

Crypto World
Loopring shuts down Ethereum’s first zk rollup DEX after years of decline


Loopring has announced the immediate closure of its decentralized exchange and automated market maker after concluding that years of limited adoption, business shortcomings, and technological competition left the project without a sustainable future.
Summary
- Loopring has shut down its decentralized exchange after citing weak adoption, business challenges and competition from newer Ethereum scaling networks.
- Users will receive their remaining balances through direct Ethereum wallet distributions, with Loopring covering the gas fees.
- More than 60 crypto projects have closed in 2026, with Pyra, Carrot, Botanix Labs and several others also ending operations.
Loopring disclosed the decision in a post on X on Sunday, confirming that all trading services have stopped and the protocol’s relayer has ceased operating. The team attributed the shutdown to three factors: weak user adoption, limited business development capabilities, and competition from newer zkEVM based Ethereum scaling networks.
The developers acknowledged that Loopring pioneered zero knowledge rollup technology but stated that the protocol’s architecture lacked a virtual machine, which prevented composability and limited practical payment use cases. These design constraints restricted ecosystem growth, the team wrote.
Engineers behind the project also admitted they excelled at technical development but failed to build the commercial side of the business. The announcement added that exchange delistings of LRC during 2026 accelerated a process that had already become unavoidable.
The team further stated that modern Ethereum compatible zkEVM networks eventually outpaced Loopring’s specialised design. Rather than continue operating what it described as a hollow service, the developers chose to discontinue the platform.
User withdrawals to continue after trading ends
Loopring confirmed it will calculate final user balances before distributing funds directly to users’ Ethereum wallets in batches. The team also committed to paying the gas fees associated with those withdrawals.
Wallet services had already closed in July 2025 after the project cited scaling challenges. The latest announcement completes the shutdown of Loopring’s remaining core products.
The protocol reached a total value locked of about $760 million during the crypto market peak in November 2021, but that figure has since fallen by almost 99% to roughly $8 million, based on L2Beat data. LRC has followed a similar trajectory, falling to about $0.01 from its all-time high of $3.75 recorded during the same month.
Loopring secured one of its highest-profile partnerships in 2021 when it agreed to power GameStop’s NFT marketplace, which launched the following year.
Crypto closures continue through 2026
RootData has recorded more than 60 crypto projects and protocols that have discontinued services during 2026, as prolonged market weakness and changing technology trends have affected businesses across the sector.
As previously reported by crypto.news, Pyra announced plans to wind down after concluding it could not recover from losses linked to the Drift exploit. The crypto payments platform halted new user registrations, cancelled payment cards, and gave customers until Sept. 15, 2026, to withdraw funds and export private keys through a dedicated web portal while it prepares to distribute any future Drift recovery tokens.
Other projects have also exited the market this year. Solana-based yield protocol Carrot attributed its shutdown to losses connected to the Drift Protocol exploit, while Bitcoin Layer 2 developer Botanix Labs stated that user demand had not reached a level capable of supporting long term operations.


The locked capital needed for a MiCA spot license is relatively small, somewhere between 50,000 euros ($57,000) and 150,000 euros by class, according to Patrick Gruhn, founder and CEO of Perpetuals.com Ltd. (PDC).
What becomes costly is the license itself, which can be as high as 700,000 euros in year one and 250,000 euros a year after for a lean firm, or into the millions for a large exchange, Gruhn said via email. “Call it 12–24 months to the first authorized trade with maybe €100k lawyer fees,” he said.
As for the number of jobs that could be lost due to MiCA, no reliable estimate exists. However, many of the 80% of pre-MiCA platforms facing extinction are tiny shell entities, Gruhn said.
“That overstates the situation significantly,” Gruhn said. “And much of it is reallocation, since licensed firms have to hire compliance staff and the offshore ones don’t.”
Changing environment
Nevertheless, MiCA threatens to stifle crypto as an industry in some countries. The situation is particularly harsh in Poland, where domestic legislative delays and presidential vetoes have meant the Polish Financial Supervision Authority (KNF) has faced roadblocks in establishing a fully functional crypto application and licensing regime.
Mateusz Kara, CEO of Morphic Financial Group, which is headquartered in London and has deep roots and operations in Poland, said the MiCA deadline could “wipe out Polish crypto.”

If you’ve been in the crypto industry for a while, you’re undoubtedly aware of market cycles.
They tend to revolve around Bitcoin’s halving, which usually acts as a catalyst for an incoming bull run. Many have expressed doubts about this theory, but so far it appears to be playing out incredibly accurately.
Let’s dive in and see if we can estimate when this downturn could end, taking into account previous market behavior.
What the Previous Cycles Suggest
The first reference point is the price increase from Bitcoin’s 2015 low to its 2017 high. This period lasted roughly 1064 days (this may vary depending on the exchange data you use, but it’s a very accurate estimate). From then, the bear market lasted until the low on December 15th, 2018. This created a 363-day top-to-bottom window. The market then spent months recovering, but the main capitulation low had already been set.
The second reference point is the cycle that began after the December 2018 low and lasted until the 2021 high on November 10th. This time, it took Bitcoin 1062 days to complete the cycle (about the same as the previous cycle). From there, BTC started declining into bear market territory, which ultimately bottomed on November 21, 2022.
That took 376 days, only 13 days longer than the previous cycle. Despite different macro conditions, different market participants, and a larger crypto ecosystem, the timing was alarmingly close.
Here’s where it gets interesting. From the low in 2022 to the high achieved on October 6th, 2025, it’s around 1051 days – more or less the same. Following that logic and using a historical average of 363 to 376 days from top to bottom, the current bear market might reach its lowest point between October 4 and October 17, 2026. Make of this what you will.
This is a Window, not a Prediction
Now, this kind of cycle analysis could be useful, but it should never be treated as a guaranteed forecast – previous results do not promise future ones. Bitcoin’s future bottom will heavily depend on liquidity, interest rates, ETF flows, regulation, miner behavior, leverage, broader risk appetite, geopolitics, and more. A major macro shock could accelerate the decline, while strong institutional demand could easily shorten it.
Still, this pattern is worth watching. It gives some sort of a framework. If Bitcoin tops around October 2025, history suggests the most important low may not arrive in the next few days or weeks. It may take another few months of correction and eventual capitulation before the conditions reset.
For now, the historical model points to one key window: October 2026.
The post Bitcoin Cycle Timing: Could the Next BTC Bottom Arrive in October 2026? appeared first on CryptoPotato.

Key Takeaways
- ASML shares currently hover around $1,841, within a 52-week trading band of $683.48 to $1,959.04, commanding a $724 billion market valuation
- The company’s order backlog stays robust as semiconductor manufacturers reserve EUV machinery years ahead, guaranteeing revenue visibility
- Revenue from installed base operations reached €2.49 billion in Q1 2026, climbing from €2.13 billion in the preceding quarter
- Management elevated full-year 2026 sales outlook to €36–€40 billion, while earnings per share are projected to surge 33% in the coming year
- Analyst consensus leans Moderate Buy with a mean price objective of $1,772.62; Bank of America maintained its Buy stance and increased its target
ASML began Friday’s session at $1,841.18. This represents a dramatic recovery from the 52-week floor of $683.48, and approaches the ceiling of $1,959.04. Following such a substantial appreciation, investors naturally wonder: does meaningful upside remain?
The current valuation demands attention. ASML commands approximately 49.9x this year’s anticipated EPS of just under $36. This multiple significantly exceeds its historical average in the mid-30s range. For typical corporations, such pricing would trigger caution.
Yet ASML operates in a category of its own.
The Dutch company maintains an uncontested monopoly on Extreme Ultraviolet lithography equipment — the critical machinery enabling cutting-edge semiconductor production. Manufacturing 2-nanometer chips is impossible without this technology. No competing suppliers exist.
Each unit commands a price exceeding $350 million and requires months for assembly, precision calibration, and delivery. Customers don’t simply submit purchase orders — they reserve manufacturing capacity years into the future. This represents far more than a healthy sales funnel. It constitutes structural market control.
Order Backlog and Service Revenue Drive Fundamentals
Q1 2026 net revenue totaled €8.77 billion, representing a decline from Q4 2025’s €9.72 billion. At first glance, this suggests weakening momentum. The reality differs considerably.
ASML’s quarterly revenue fluctuates based on delivery schedules rather than underlying demand. Every system the company manufactures already has a committed buyer. The quarter-over-quarter decrease reflects production capacity constraints, not softening customer appetite.
The more revealing metric comes from installed base management. This revenue category — encompassing maintenance and enhancement of existing deployed systems — registered €2.49 billion in Q1, advancing from €2.13 billion the prior quarter. It delivers predictable, margin-rich, and expanding cash flows.
Executives lifted full-year 2026 guidance to a revenue corridor of €36 billion to €40 billion. The latter half of the year should show acceleration, powered by increasing system deliveries.
TSMC, Intel, and Samsung are all expanding fabrication facilities to satisfy AI infrastructure requirements. These facilities require ASML’s equipment. Hyperscaler capital spending is forecast to nearly double from $427 billion in 2025 to beyond $860 billion by 2027.
Profit Margin Improvement Represents the Upcoming Driver
EPS consensus forecasts indicate 33% expansion next year. This figure anchors the bullish investment thesis.
The route to that outcome flows through margin enhancement. ASML is shifting from limited-volume, early-phase production of its latest systems — including the high-margin High-NA EUV platform and the NXE:3800 series — toward standardized, volume-scale manufacturing. Fixed expense allocation improves across larger unit counts. Gross margins should progress toward management’s 2030 objective of 56%–60%.
One notable risk persists. China continues to represent approximately 19% of ASML’s revenue, and export limitations remain an active concern. Dutch government representatives are reportedly advocating against stricter restrictions on equipment sales to Chinese customers. Any intensification on this front could constrain sales.
Decker Retirement Planning recently established a fresh $4.23 million stake in ASML. Dimensional Fund Advisors maintains ownership exceeding 990,000 shares. Institutional holdings comprise 26.07% of outstanding equity.
Goldman Sachs, Citigroup, Morgan Stanley, and Deutsche Bank all maintain Buy ratings or equivalents. Bank of America elevated its price objective citing improved earnings projections for 2027 and 2028.
The consensus mean target stands at $1,772.62, though an alternative analyst cohort establishes it at $2,019 — suggesting approximately 12.5% appreciation potential from present levels.


Key Takeaways
- ASTS shares rallied approximately 11% Thursday following the company’s announcement of three additional BlueBird satellites scheduled for August launch via SpaceX Falcon 9.
- The updated deployment timeline positions AST for launches every two months, enabling up to 18 satellite deployments annually.
- Twenty-four satellites (BlueBirds 14-37) are currently in production, with orbital deployment expected by late 2027.
- Institutional ownership stands at roughly 61% of outstanding shares; company insiders have liquidated over $280 million in stock during the past 90 days.
- Wall Street consensus leans toward “Reduce” with an average price target of $85.09; shares opened Monday trading at $71.57.
AST SpaceMobile (ASTS) shares surged approximately 11% during Thursday’s session, closing at $71.58. While no immediate news triggered the rally that day, the momentum followed the company’s recent announcement of an accelerated satellite deployment strategy that captured investor attention.
Earlier during the week, the company disclosed that its upcoming trio of BlueBird satellites—units 11, 12, and 13—are slated for an August liftoff using SpaceX’s Falcon 9 launch vehicle. This announcement arrives on the heels of the successful June 17 deployment of BlueBirds 8, 9, and 10.
The consecutive launch schedule establishes a rhythm of approximately one deployment every eight weeks, potentially enabling an annual deployment rate of 18 satellites.
AST is presently manufacturing 24 additional satellites—BlueBirds 14 through 37. Maintaining the current timeline, the company projects these units will achieve orbit before 2027 concludes, coinciding with the planned commencement of beta operations for its direct-to-cell (DTC) connectivity network.
The European market is also entering the picture. Statements connected to a Vodafone-supported deployment identified Spain as a potential early commercial territory, with service potentially beginning in 2027—strengthening the company’s international monetization narrative.
Wall Street’s Take: Ratings and Target Prices
Despite investor optimism reflected in recent price action, analyst sentiment remains tepid. The consensus rating on ASTS currently registers as “Reduce,” with analysts projecting an average fair value of $85.09.
Deutsche Bank recently downgraded the stock from buy to hold while trimming its price objective from $117 down to $106. B. Riley shifted to a “neutral” stance with an $85 valuation. Among the more optimistic voices, Roth MKM maintains a “buy” recommendation alongside a $108 price target.
Among the ten analysts providing coverage, just one rates the stock a buy. Six recommend holding. Three advise selling.
Technically, the stock’s 50-day moving average sits at $87.18, while the 200-day average rests at $89.23—both considerably above current price levels.
Heavy Insider Liquidation Draws Attention
A notable development that investors cannot overlook: significant insider selling activity.
During the past three months, company insiders have offloaded more than 3.1 million shares valued at approximately $280.6 million. This includes CFO Andrew Martin Johnson, who disposed of 45,809 shares at an average price of $93.81 on June 11, trimming his holdings by 8.34%.
Director Julio A. Torres separately sold 15,000 shares at $76.34 during May, reducing his position by roughly 26%.
Insiders currently control 20.89% of outstanding shares, while institutional investors hold 60.95%.
SG Americas Securities LLC expanded its ASTS position by 18.6% during Q1, purchasing an additional 11,813 shares to reach a total holding of 75,157.
Regarding financial performance, AST’s first quarter results disappointed. The company reported an EPS loss of -$0.66, significantly worse than the -$0.23 consensus estimate. Revenue totaled $14.73 million, falling short of the $39.01 million analyst projection.
Full-year EPS is forecast at -$1.47. The stock has traded within a 52-week range spanning from $36.08 to $133.86.
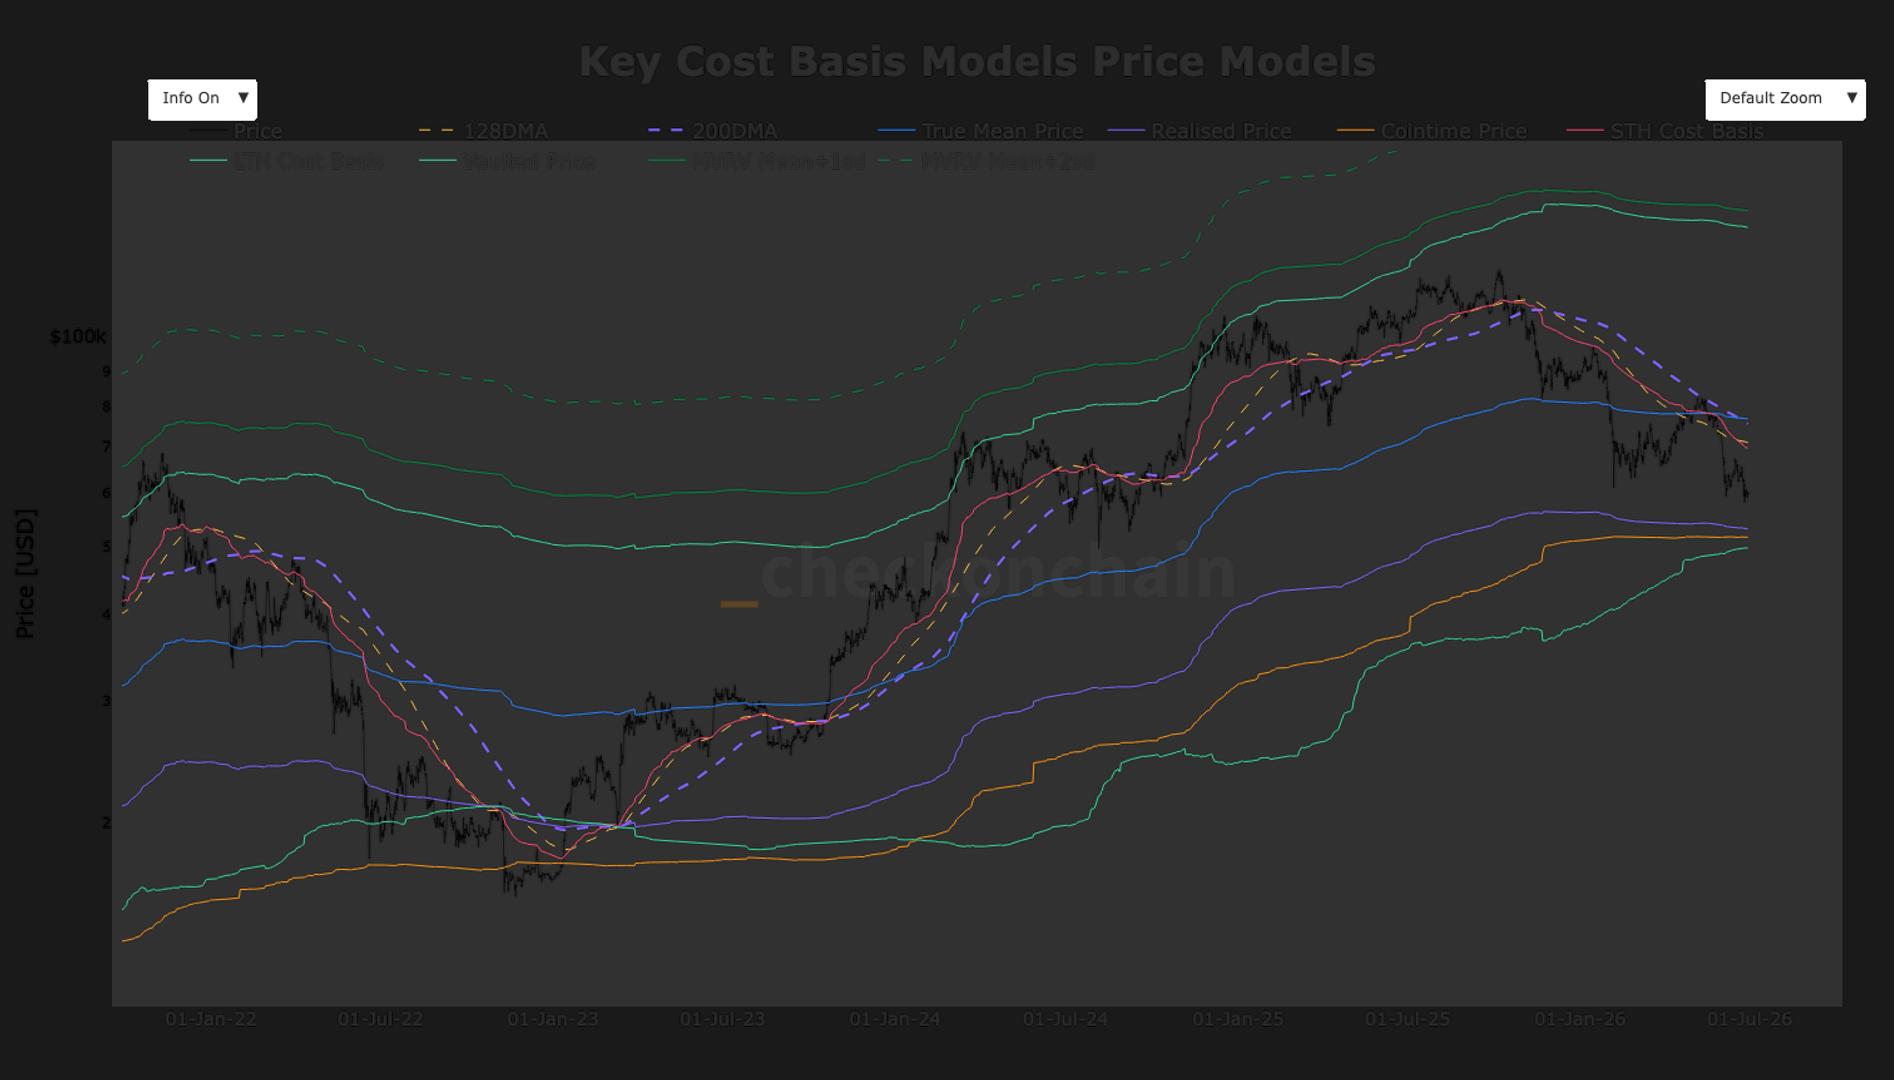

Bitcoin is currently trading below $60,000, placing it in “no man’s land,” a zone where price sits between major on chain support and resistance levels. BTC has failed to reclaim several important technical and on chain thresholds, so the path of least resistance appears to remain to the downside.
Several key valuation metrics now sit above the current price. The True Mean Price, currently around $76,300, estimates the average acquisition cost of coins after adjusting for lost or inactive supply, providing a more accurate measure of the network’s economic cost basis.
The 200-Day Moving Average, at $75,500, is a widely followed technical indicator that smooths price action over the past 200 days and is often used to distinguish long term bull and bear trends. The 128-Day Moving Average, at $70,900, tracks bitcoin’s intermediate trend, while the Short Term Holder Cost Basis, at $69,600, represents the average purchase price of investors who have held bitcoin for less than roughly 155 days.
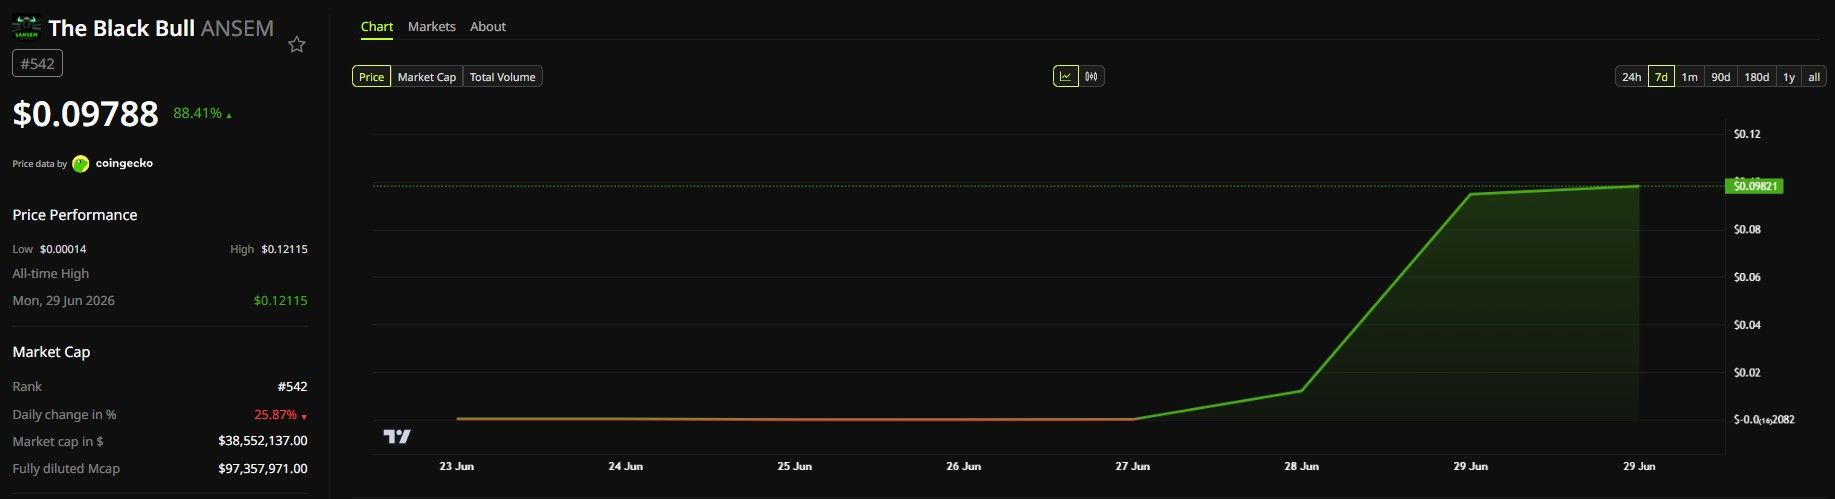
The Black Bull (ANSEM) climbed nearly 20,000% in seven days on Solana after crypto influencer Ansem announced plans to distribute his accumulated creator fees as weekly airdrops to community members.
The announcement came through X. Ansem told followers he would redirect his Pump.fun creator fees as weekly airdrops, selecting winners at random each week.
A Single Post Triggers a Market Move
The airdrop announcement pushed ANSEM’s 24-hour trading volume past $80 million as traders moved quickly to accumulate the token. The token’s price reached an all-time high of $0.121 on June 29. At that level, its fully diluted valuation sat near $121 million.
Some traders who entered before the announcement reported gains between 100x and 261x their original investment. ANSEM now trades at $0.108, up 79.7% in the past 24 hours. Its current market cap sits near $42.8 million. Over seven days, the token has climbed roughly 19,878%.
The speed of the move highlights how sharply the Solana meme coin market reacts to social catalysts.
Creator Fees Repurposed as Community Incentive
Ansem, known on X as @blknoiz06, is a prominent Solana-focused trader with a large following. Historically, his activity has moved prices in the Solana meme coin space.
Pump.fun routes a portion of trading fees to the creator of each token on the platform. As a result, creators of high-volume tokens accumulate significant fee income over time. In turn, that mechanic gave Ansem a fund to redistribute without launching a new token from scratch.
While Ansem utilized his accumulated fees for the incentive, it is worth noting that the ANSEM token itself was launched as an independent community project rather than by the influencer himself.

Solana’s Memecoin Landscape Sets the Stage
Solana meme coin trading had already been recovering before the announcement, with the network continuing to draw speculative volume toward new token launches. Meanwhile, Pump.fun DEX volume reached record highs earlier in 2026, reflecting renewed appetite for tokens on the network.
However, Solana DEX volumes have reversed sharply before, and single-catalyst rallies on the network have a mixed record of sustaining momentum. ANSEM’s $80 million in 24-hour volume represents a meaningful slice of Solana’s daily memecoin activity, but the next test is whether airdrop participation continues to generate new buyer demand week over week.
ANSEM price data and trading activity remain the key metrics to watch as the first airdrop date approaches.
The post ANSEM Climbs 19,878% After The Black Bull Ansem Announces Creator Fee Airdrops appeared first on BeInCrypto.


Grayscale has said Bitcoin may be near its current cycle low if three key risks ease in the coming months. In a new market note, the asset manager said the outcome depends on the CLARITY Act, Strategy’s balance sheet and Federal Reserve policy. Its base case assumes the bill clears the Senate, Strategy improves its financial position and the Fed avoids more rate hikes.
Summary
- Grayscale says Bitcoin may be near its low if policy and treasury risks ease soon.
- A stalled CLARITY Act could keep regulatory pressure high as Bitcoin trades near stress levels.
- Fed rate hikes and DAT deleveraging remain the main downside risks in Grayscale’s scenario now.
“If downside risks materialize, we could see bitcoin fall moderately further,” Grayscale’s head of research, Zach Pandl, said. He said a weaker case would involve the CLARITY Act failing to pass this year, digital asset treasuries deleveraging further and the Fed raising rates because inflation stays high.
The warning comes after Bitcoin fell below $60,000 during a sharp reset across crypto markets. Recent Bitcoin price analysis showed ETF outflows and liquidations added pressure as traders tried to defend the $60,000 area. Grayscale said older Bitcoin bear markets saw drawdowns of around 80%, but it does not expect the current cycle to fall that deeply because institutional demand has remained firmer.
CLARITY Act path remains uncertain
The CLARITY Act remains one of the main policy factors in Grayscale’s outlook. The bill would create a federal market structure framework for digital assets and give clearer rules to exchanges, developers and token issuers. A recent Senate update showed the bill had moved to the Senate calendar after committee approval, but still needs floor debate, possible amendments and 60 votes.
The bill’s path has narrowed as the Senate calendar fills up. A separate timeline report said the bill still needs coordination between the Senate Banking and Agriculture committees before a final floor vote can begin. The report also said disputes over conflict-of-interest language, stablecoin rules, illicit finance provisions and floor time remain unresolved.
Grayscale’s view is that a successful vote could reduce policy risk and support the next phase of institutional participation. A delay would leave the market without the clear rulebook many investors expected this year. For Bitcoin, that means regulation remains tied to price sentiment, especially while risk appetite stays weak.
Fed hikes and Strategy risks weigh on BTC
The Fed is the second major risk in Grayscale’s downside case. Recent coverage on rate-hike risk showed Citadel Securities warning that the Fed could raise rates as early as September 2026 if inflation remains firm. Another report said the Fed’s June projections shifted away from rate cuts, with several officials now seeing hikes before year-end.
Higher rates can weigh on Bitcoin because the asset does not pay yield. A stronger dollar and higher real yields make cash and Treasuries more attractive for some investors. That has already pressured Bitcoin and gold this year, with recent analysis showing both assets under stress during a stronger-dollar and higher-rate environment.
Strategy also remains central to the market’s risk view. A recent report said Strategy’s position moved about $12 billion below cost after Bitcoin fell below $60,000, while MSTR traded below the value of its Bitcoin holdings. Another analysis said the company’s Bitcoin flywheel began to reverse as its stock premium weakened and financing became harder.
Grayscale’s scenario does not call for a full repeat of past bear markets. It frames the next move around policy, rates and balance-sheet stress. If CLARITY passes, Strategy steadies its finances and the Fed stays on hold, Bitcoin may already be close to its low. If those factors move the other way, Grayscale says more moderate downside remains possible.
Crypto World
New MiCA regime in Europe, U.S. nonfarm payrolls for June: Crypto Week Ahead: Crypto Week Ahead


Crypto market participants are entering July with a critical shift in Europe as the MiCA framework’s transitional period expires. Exchanges are now competing to lure in Binance users in the region after the firm failed to secure a license.
On top of that, investors will see new product reveals from Robinhood, in an event where CEO Vlad Tenev is speaking alongside the company’s general manager for crypto, Johann Kerbrat.
There is also a packed week of U.S. macroeconomic data, including employment and manufacturing reports, while potential black swan events surrounding geopolitics could also help shape the market’s direction.
What to Watch
(All times ET)
- Crypto
- July 1: Transitional period for the European Union’s Markets in Crypto Assets (MiCA) framework expires.
- July 1: Robinhood (HOOD) to hold product reveal event titled “The World is Flat.”
- July 2: Tokenization firm Securitize to start trading on NYSE after SPAC merger.
- Macro
- June 30, 9:00 a.m.: U.S. House Price Index YoY for April (Prev. 1.7%)
- June 30, 10:00 a.m: U.S. JOLTs Job Openings for May est. 7.28M (Prev. 7.618M)
- July 1, 5:00 a.m: Eurozone Inflation Rate YoY Flash for June est. 3% (Prev. 3.2%)
- July 1, 8:15 a.m: U.S. ADP Employment Change for June est. 118K (Prev. 122K)
- July 1, 9:00 a.m: U.S. Fed Chair Warsh speaks at European Central Bank Forum
- July 1, 10:00 a.m: U.S. ISM Manufacturing PMI for June est. 53,7 (Prev. 54)
- July 2, 8:30 a.m: U.S. nonfarm payrolls for June est. 114K (Prev. 172K)
- July 2, 8:30 a.m: U.S. unemployment rate for June est. 4.3% (Prev. 4.3%)
- July 2, 8:30 a.m: U.S. initial jobless claims for period ending June 27 est. 220K (Prev. 215K)
- July 2, 4:30 p.m: U.S. Fed Balance Sheet for July 1 (Prev. $6.736T)
- Earnings
Token Events
- Governance Votes & Calls
- Aave DAO is voting on upgrading the Pendle PT risk oracle stack to an automated pipeline. Voting ends on June 30.
- Arbitrum (ARB) is voting on narrowing Arbitrum Gaming Ventures (AGV) to exclusively manage its existing portfolio. The proposal seeks DAO approval to terminate forward investment activity and return surplus capital to the DAO treasury for redeployment. Voting ends on July 2.
- is voting on transferring the intellectual property of the protocol from Pixelcraft Studios to the AavegotchiDAO Foundation. Voting ends on July 4.
- Redbelly Networm (RBNT) is voting on temporarily suspending the operational activities of the Redbelly Community DAO until the broader ecosystem reaches greater maturity. Voting ends on July 4.
- Unlocks
- Token launches
Conferences
Bitcoin is attempting to reclaim the $60,000 level heading into the weekend, as technical traders point to cooling volatility and renewed momentum signals on multiple time frames. The move comes with renewed comparisons to late-2022, when similar relative strength patterns preceded a major shift in market direction.
Despite pockets of bullish read-through, some traders continue to expect another leg lower—framing any recovery as potentially temporary unless key resistance levels hold. For market participants, the immediate question is whether $60,000 can flip from a ceiling back into dependable support.
Key takeaways
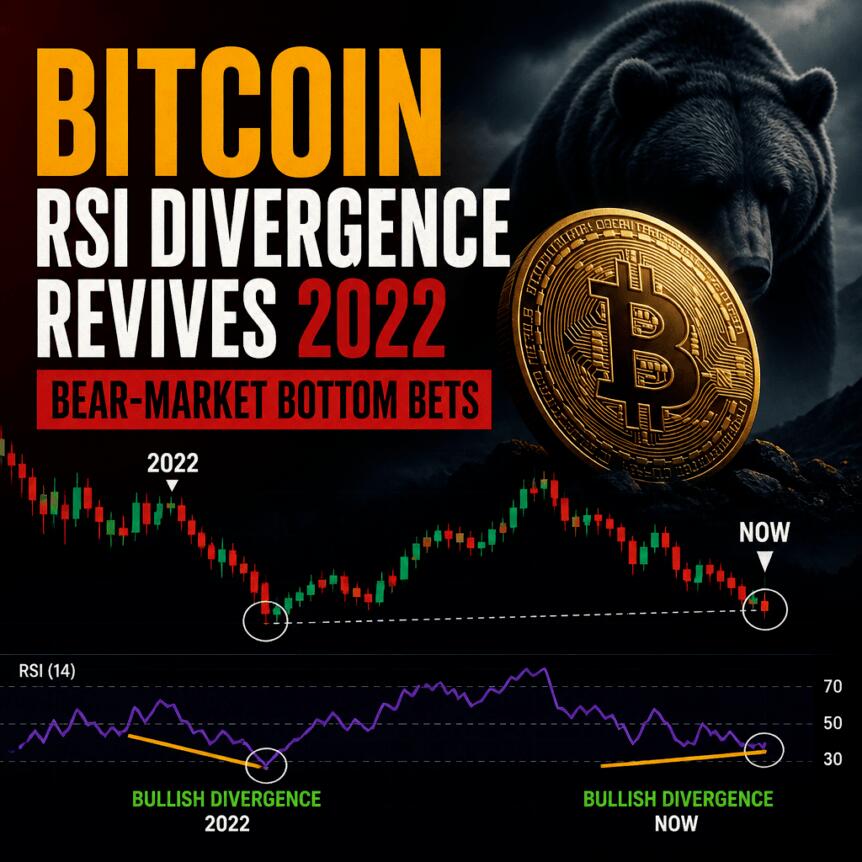
- Traders using TradingView data cite a developing RSI bullish divergence as price struggles below recent levels.
- Analysis highlights higher RSI swing lows on the four-hour chart alongside lower price lows, a pattern often associated with improving downside momentum.
- Weekly RSI divergence is being compared to a 2022 setup that preceded Bitcoin’s durable bear-market floor near $15,600.
- Some analysts still project further downside, potentially extending into August, even if a relief bounce occurs sooner.
- Commentary from analysts suggests $60,000 is being defended, but it remains unclear whether that defense can withstand a confirmed trend reversal.
RSI divergence draws renewed 2022 parallels
According to TradingView charting, BTC/USD has shown signs of “cooling” volatility after returning above $60,000. On the hourly time frame, market observers noted a sequence of higher swing lows paired with relative strength index (RSI) readings that suggest selling pressure may be easing.
The more widely circulated signal, however, is on the four-hour chart. A bullish divergence appears to be forming when RSI prints higher lows while price makes lower lows—an arrangement traders interpret as a potential shift in the balance between buyers and sellers.
Pseudonymous trader Rod explicitly framed the situation as history repeating itself, pairing current signals with how RSI behavior changed during the 2022 bear market. In a post on X, Rod wrote: “It’s 2022 again,” aligning the current backdrop with the earlier period when RSI divergence preceded a durable base.
What traders point to from the 2022 bear-market setup
In the 2022 episode cited by traders, a weekly RSI bullish divergence coincided with Bitcoin establishing its bear-market low near $15,600. That low later functioned as a lasting market floor, reinforcing the idea—at least for technical analysts—that multi-time-frame RSI divergence can matter when the broader downtrend starts to lose momentum.
More recently, four-hour RSI levels fell to around 11.4 at the start of June, according to the same chart-based commentary. That reading is described as one of the lowest levels on record, underscoring that RSI has already tested extreme oversold conditions before bouncing back toward the $60,000 area.
Daily confirmations and the debate over next support
On Friday, crypto analyst Lukasz Wydra added daily perspective to the ongoing RSI discussion. According to his post on X, the bullish RSI divergence has been “officially confirmed,” though he cautioned that it could still deepen before any sustained recovery takes hold.
Wydra characterized the RSI development as an “encouraging sign,” while also pointing to what he described as continued defense of the price by Binance. The core takeaway for traders: even if divergence signals are improving, confirmation through price action still determines whether buyers can hold the current range.
For investors and traders, this distinction is critical. RSI divergence can indicate changing momentum, but without a follow-through move—such as reclaiming and holding major resistance—markets can remain prone to “false starts” where dips resume after brief bounces.
Calls for $55,000 and the risk that relief fades in August
Not all participants are comfortable treating $60,000 as a turning point. Niels Klaver, cofounder of STABL Agency, reiterated expectations for Bitcoin to visit around $55,000 “before any big move” in his post on X. His view implies that a larger downside objective could still be ahead even if RSI-based signals continue to improve.
Similarly, trader and analyst Rekt Capital suggested the market could experience a relief bounce next month, arguing that July tends to behave differently than June. But he also tied the follow-up to a key mechanical level: once BTC/USD confirms the 50-month exponential moving average (EMA) as new resistance, Rekt Capital expects “August cancellation of relief and additional downside” linked to weakening around $60,000 support, as described in his weekly update on X.
Under this framework, the near-term path would be less about a straight reversal and more about a sequence: a bounce first, then renewed pressure if resistance levels prevent buyers from sustaining higher prices. That view matches the broader tension in the current technical narrative—RSI divergence hints at improving momentum, while other chart targets suggest further downside risk remains active.
What to watch next
Traders should focus on whether Bitcoin can hold $60,000 after testing it, and whether RSI improvements translate into sustained breakouts rather than short-lived mean reversion. The next decisive clues are likely to come from how BTC reacts to the highest-probability resistance levels highlighted by analysts and whether downside projections from $55,000 toward later-month scenarios gain confirmation.
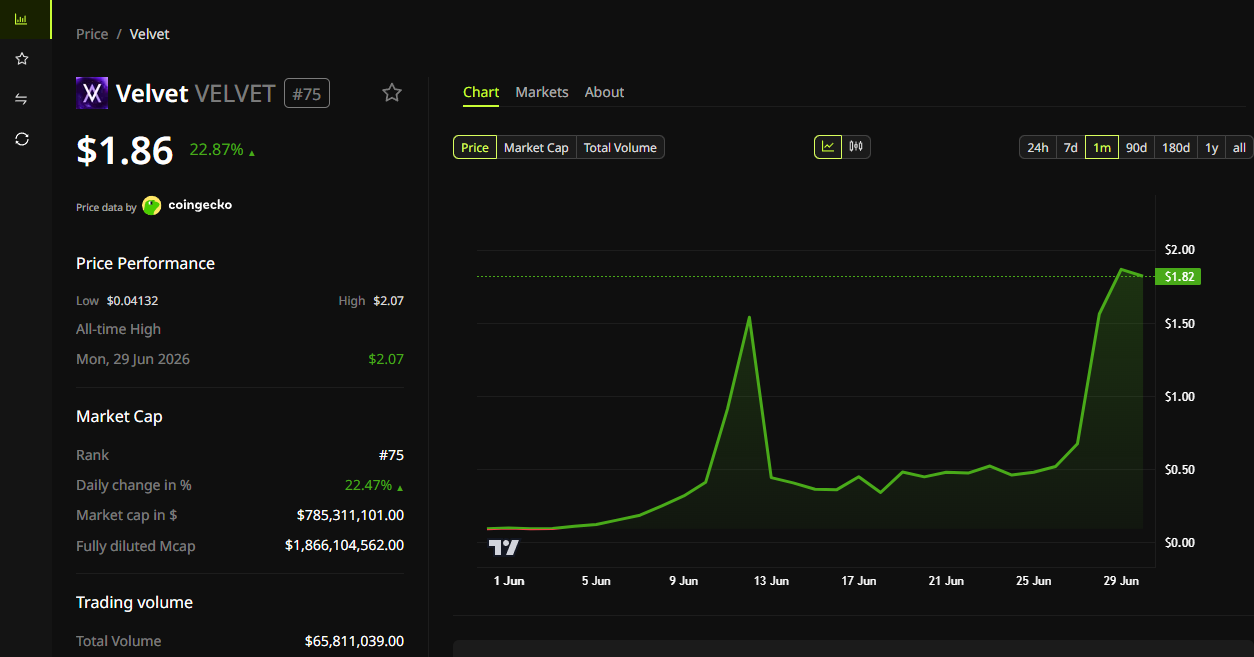
Velvet gained 306% over the past seven days, making it last week’s top-performing altcoin. The token now trades over $1.80 as buyers push it toward its $2.
That rally follows a large correction earlier in June that dragged VELVET down towards $0.30. Two product developments pulled buyers back in.
Aerodrome Migration and Pre-IPO Markets Drove Velvet Recovery
The project moved 100% of its protocol-owned liquidity on Base to Aerodrome Finance, the chain’s leading decentralized exchange. The move concentrates depth into one venue, giving traders tighter spreads and better fills on every trade through the platform.
Velvet also launched synthetic pre-IPO markets, letting users trade exposure to private companies before public listings. The SpaceX feature drew significant speculative interest and helped push VELVET token price sharply higher in mid-June.
Trading volume surged alongside the price move, confirming buyers stepped in with conviction rather than thin-market drift.
However, its market cap sits just around $800 million while its total value locked remains around $770,000. That disconnect points to speculation driving the rally rather than underlying platform usage.

What the Broader Market Shows
VELVET’s surge stands out against a weak broader backdrop. Bitcoin (BTC) is hovering just under $60,000, weighed down by persistent macro uncertainty and subdued risk appetite. Most large-cap altcoins have struggled to gain traction in that environment.
Capital rotating into low-cap tokens like VELVET during a broad market slump is a pattern worth noting. It often reflects speculative positioning rather than a wider recovery in sentiment.
The post VELVET Jumps 300% in a Week on Aerodrome Move, Despite Market Downturn appeared first on BeInCrypto.

Europe’s unlicensed crypto firms face ‘wipeout’ as MiCA transition deadline nears

Christina Ricci Hit By New Custody Claims Over Her Past

Van driver caught weeing ‘ridiculed over prostate problems’ by council worker | News UK


-
 Sports6 days ago
Two goals and an assist by sheer aura: Cristiano Ronaldo just entered the World Cup chat
-

 Tech7 days ago
Microsoft accidentally kills epic Outlook email threads
-

 Fashion3 days ago
Weekend Open Thread: Staud – Corporette.com
-

 Politics3 days ago
The House | Manchesterism won’t survive the painful trade-offs unless it gets citizens on board
-

 Politics3 days ago
Potential 2028er World Cup attendee leaderboard
-

 Business3 days ago
Asia stock markets slide as tech shares slump
-

 Tech4 days ago
A Look At A Gaggle Of Transputer Boards
-
Crypto World5 days ago
Bitcoin (BTC) Dips Below $62K, Ethereum (ETH) Plunges 6% Daily: Market Watch
-
 Crypto World4 days ago
Dell (DELL) Shares Tumble Over 5% Following Analyst Downgrade to Hold
-

 Crypto World5 days ago
Securitize Wraps Roubini's SEC-Registered ETF as Dubai VARA Digital Security
-
Business5 days ago
Entergy settles forward sale agreements, raises $672 million in cash proceeds
-

 Crypto World2 days ago
Kraken's xStocks Opens Bending Spoons IPO Registration to EEA Retail
-

 Sports3 days ago
FIH Pro League: India defeat Pakistan 7-1, register biggest win of campaign | Other Sports News
-

 Crypto World2 days ago
Coinbase, Circle Deepen Crypto Stock Losses Despite Resilient S&P 500
-
 Crypto World3 days ago
Hyperliquid Named on Singapore MAS Investor Alert Register
-

 Crypto World3 days ago
RTX holders must register wallets before token distribution begins
-

 Tech1 day ago
Bluekit phishing kit adopts browser-in-the-middle for login theft
-

 Tech2 days ago
Russian hackers now target Signal backup recovery keys
-

 Politics7 days ago
Wes Streeting abandons leadership bid and backs Burnham
-

 Sports4 days ago
India vs Bangladesh LIVE Score, Women’s T20 World Cup: Bangladesh Opt To Bat; India Enter ‘Do-Or-Die’ Stage As Semi-Final Race Heats Up
You must be logged in to post a comment Login