
Crypto World
New MiCA regime in Europe, U.S. nonfarm payrolls for June: Crypto Week Ahead: Crypto Week Ahead


Crypto market participants are entering July with a critical shift in Europe as the MiCA framework’s transitional period expires. Exchanges are now competing to lure in Binance users in the region after the firm failed to secure a license.
On top of that, investors will see new product reveals from Robinhood, in an event where CEO Vlad Tenev is speaking alongside the company’s general manager for crypto, Johann Kerbrat.
There is also a packed week of U.S. macroeconomic data, including employment and manufacturing reports, while potential black swan events surrounding geopolitics could also help shape the market’s direction.
What to Watch
(All times ET)
- Crypto
- July 1: Transitional period for the European Union’s Markets in Crypto Assets (MiCA) framework expires.
- July 1: Robinhood (HOOD) to hold product reveal event titled “The World is Flat.”
- July 2: Tokenization firm Securitize to start trading on NYSE after SPAC merger.
- Macro
- June 30, 9:00 a.m.: U.S. House Price Index YoY for April (Prev. 1.7%)
- June 30, 10:00 a.m: U.S. JOLTs Job Openings for May est. 7.28M (Prev. 7.618M)
- July 1, 5:00 a.m: Eurozone Inflation Rate YoY Flash for June est. 3% (Prev. 3.2%)
- July 1, 8:15 a.m: U.S. ADP Employment Change for June est. 118K (Prev. 122K)
- July 1, 9:00 a.m: U.S. Fed Chair Warsh speaks at European Central Bank Forum
- July 1, 10:00 a.m: U.S. ISM Manufacturing PMI for June est. 53,7 (Prev. 54)
- July 2, 8:30 a.m: U.S. nonfarm payrolls for June est. 114K (Prev. 172K)
- July 2, 8:30 a.m: U.S. unemployment rate for June est. 4.3% (Prev. 4.3%)
- July 2, 8:30 a.m: U.S. initial jobless claims for period ending June 27 est. 220K (Prev. 215K)
- July 2, 4:30 p.m: U.S. Fed Balance Sheet for July 1 (Prev. $6.736T)
- Earnings
Token Events
- Governance Votes & Calls
- Aave DAO is voting on upgrading the Pendle PT risk oracle stack to an automated pipeline. Voting ends on June 30.
- Arbitrum (ARB) is voting on narrowing Arbitrum Gaming Ventures (AGV) to exclusively manage its existing portfolio. The proposal seeks DAO approval to terminate forward investment activity and return surplus capital to the DAO treasury for redeployment. Voting ends on July 2.
- is voting on transferring the intellectual property of the protocol from Pixelcraft Studios to the AavegotchiDAO Foundation. Voting ends on July 4.
- Redbelly Networm (RBNT) is voting on temporarily suspending the operational activities of the Redbelly Community DAO until the broader ecosystem reaches greater maturity. Voting ends on July 4.
- Unlocks
- Token launches
Conferences


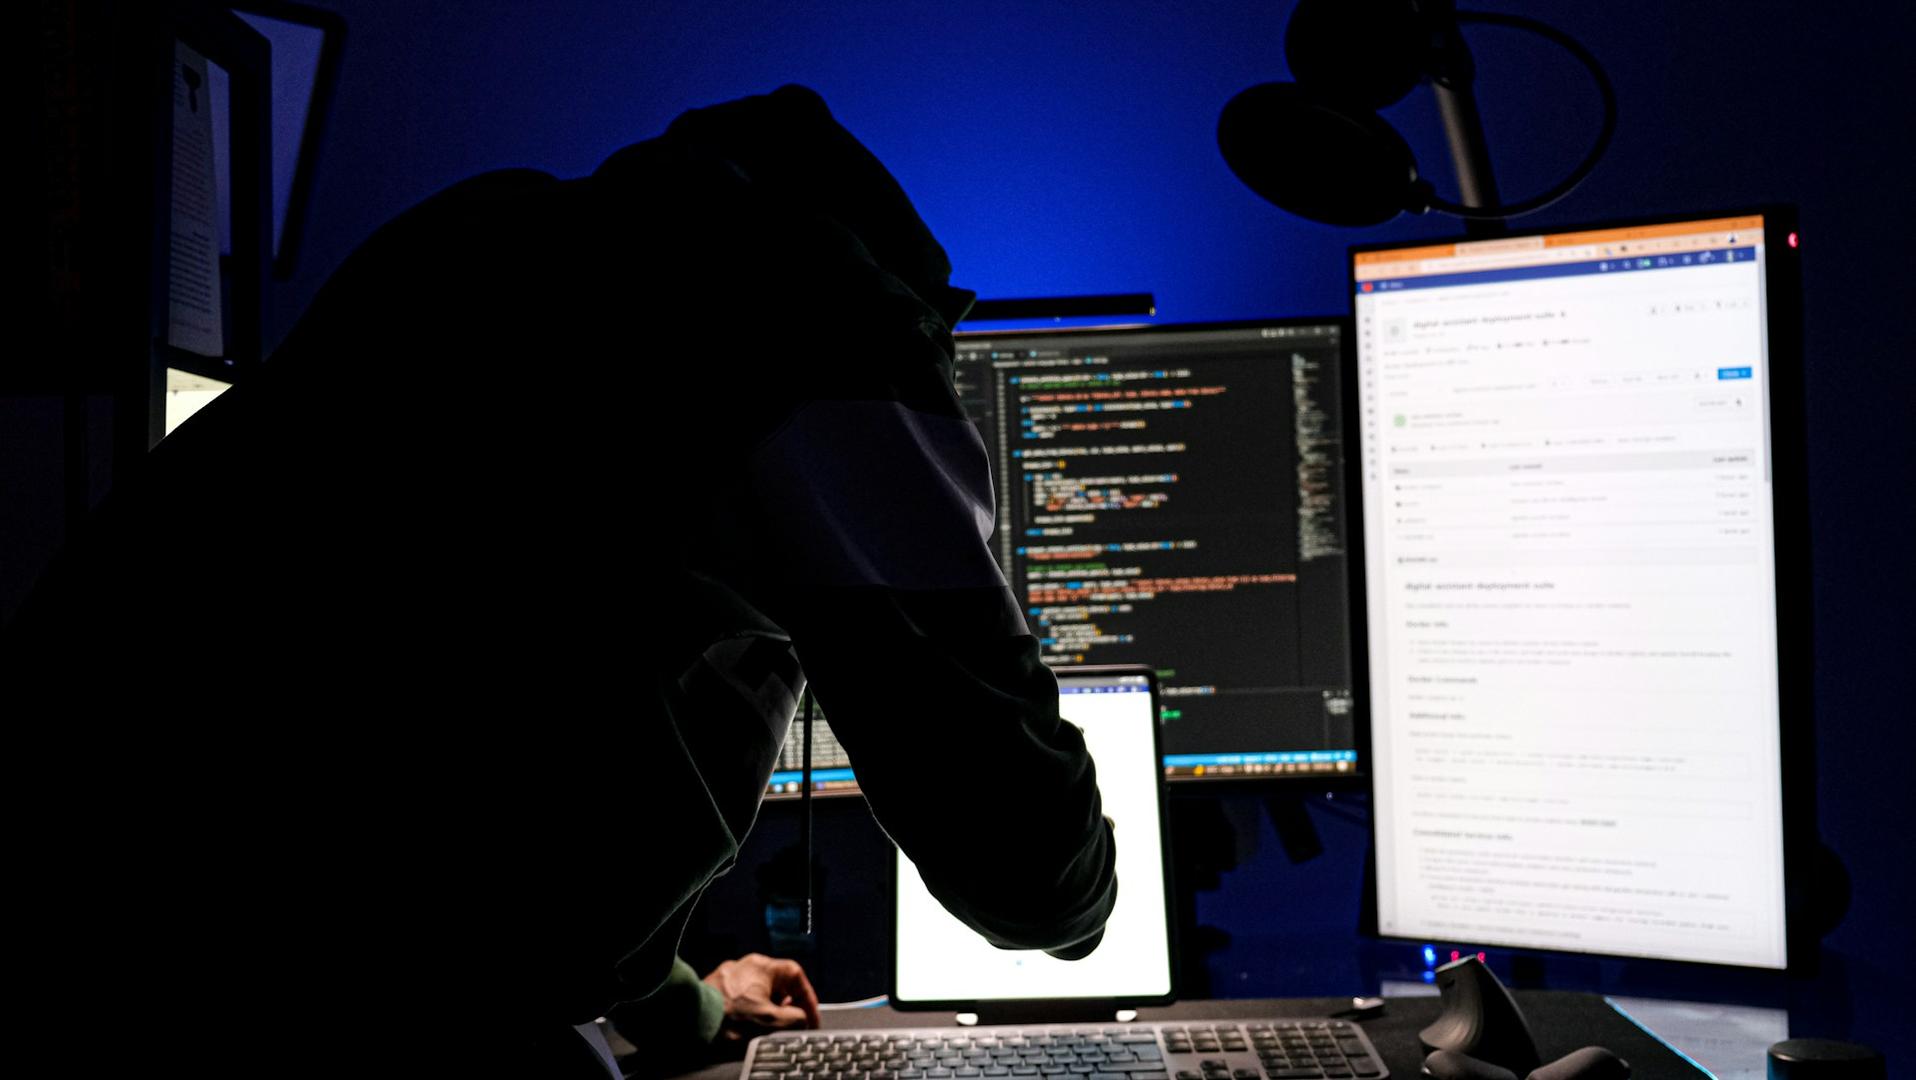
The attacker working through Coldcard-generated keys is now emptying wallets worth a few thousand dollars each.
Galaxy Research flagged a third wave of sweeps early Sunday, roughly 208 bitcoin drained from 1,912 addresses between Friday midday and Saturday morning UTC.
That is just over a tenth of a bitcoin per victim. The July 30 opening wave averaged close to a full coin, 1,083 bitcoin from 1,196 addresses in 41 minutes.
Observed losses across all three waves now total 1,367 bitcoin, nearly $89 million, from 4,585 addresses.
Wave three sends each victim’s coins to its own destination rather than the handful of shared collector addresses that made the first two easy to map, and parks them in pay-to-witness-script-hash outputs, a format that can carry multisignature or timelock conditions, instead of the plain single-key outputs used before.
It batched an average of six victims into each sweep where wave one took exactly one at a time, and it scanned only the default derivation path, the standard branch of the key tree a wallet checks first, instead of testing several branches per seed.

Perhaps due to the quickly re-escalating tension in the Middle East, the cryptocurrency market has posted fresh losses over the past few hours, with BTC dropping to $62,000 after failing to reclaim the $63,000 support during the day.
XRP was not spared, as it just slipped below $1.05. The asset was rejected at $1.20 during the mid-July rally after the favorable US inflation data for June, and eventually lost the coveted $1.10 support. Now, it fights for the last line of defense before the bulls would have to defend the $1.00 zone.
Popular analyst EGRAG CRYPTO outlined the significance of the $1.05 level, calling it the ‘battlefield’ region. Although he noted earlier today that the cross-border token had managed to maintain that level, he acknowledged the predominantly bearish structure of lower highs on the 4-hour chart.
The short-term path of recovery would be a successful defense of $1.05 before XRP can bounce above $1.083 and eventually reclaim the $1.10 level, which now acts as resistance.
EGRAG laid out an even more promising road ahead for the asset if it manages to continue its recovery, with the “major price target” set at $1.30.
However, a decisive breakdown below $1.05 would essentially mean that XRP will head toward the notable liquidity zone at around $1.00, he warned.
Mikybull Crypto also believes XRP has the strength to stage a surprising comeback. The analyst claimed that the asset’s bullish reversal run is currently loading despite the negative outlook.
His long-term chart compares the current market structure with the one from two years ago when XRP was highly compressed at around $0.60. Once it broke out the upper boundary, though, it rocketed to a fresh all-time high within less than a year.
“Before the last run, I screamed for you to buy at a crazy discount. The opportunity is presenting again,” he said now.
History is not on XRP’s side at the moment, though, as August has been quite a painful month for the asset. As reported earlier today, the cross-border token was deep in the red in all four previous editions.
The post XRP Price Dips to ‘Battlefield’ Zone, but Analysts See Major Reversal Opportunity appeared first on CryptoPotato.
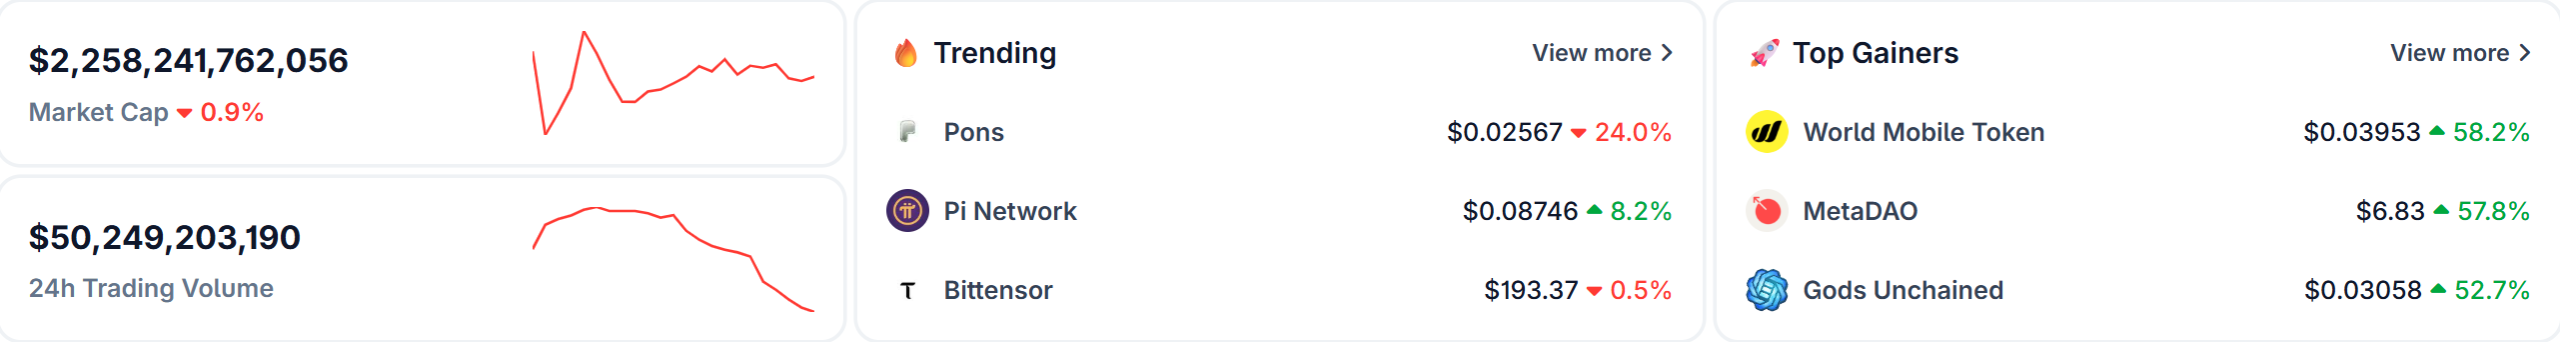
Pi Coin (PI) rose 8% on Saturday to $0.0870. The move pushed the token onto CoinGecko’s trending list, days before a hard deadline for Pi Network.
Nodes are the computers that check Pi transactions. The people who run them have until August 11 to install an update. Nodes that miss it get cut off.
Why Pi Coin Is Trending Again
CoinGecko ranked PI second on its trending board on Saturday. Most other coins on that list were falling. Pi Coin was one of the few going up.

The bigger picture is less kind. While PI has gained 7% over the past week, it is still down 25% over the past month. The token is worth about $957 million in total, making it the 67th largest coin.

Trading stayed thin. Pi Network market data shows roughly $8.6 million changed hands in 24 hours.
What the August 11 Deadline Means
Protocol v26 is the latest step in a long chain of updates that started at version 19. Pi says it makes smart contracts safer. It also improves how the network stores data and talks to other blockchains.
“Protocol 26 is a major milestone ahead of the final planned upgrade, Protocol 27. With 8 successful upgrades completed over the past few months, these final two upgrades will bring the network up to date with the latest protocol features, improvements, and functionality,” the team noted.
Follow us on X to get the latest news as it happens
Only node operators need to act. People who mine Pi on their phones do not. Pi lists every step on its node page.
Pi nodes agree on transactions in small trusted groups, a design borrowed from Stellar. The July 22 Protocol v25 rollout added the cryptography that privacy apps need.
Why Pi Coin Rallies Keep Fading
Traders have seen this before. PI jumped 24% ahead of the July 22 update. It handed the gain back once the day arrived. The Protocol 24 mainnet upgrade in June ended the same way.
Zoom out and it looks worse. PI hit a record low of $0.0710 on July 14. It now sits 79% below where it traded a year ago.
New supply is the main drag. PiScan data cited last month showed about 1.71 billion PI unlocking over the next year. That is a heavy load for a market trading under $10 million a day.

Protocol v27 is the last planned update. Whether August 11 shifts the PI price forecast outlook comes down to one thing. Buyers have to show up faster than the new coins do.
The post Pi Coin Defies Market Trend Before Key Deadline: Will the 10% Bounce Hold? appeared first on BeInCrypto.

Who are possible challengers to FIFA President Gianni Infantino?
Infantino was originally expected to easily retain his position at the helm of FIFA in March 2027.
Now, with public calls for review into his leadership, potential rivals may feel emboldened.
“FIFA is full of sharks, and there’s no question that many of them can smell blood. Infantino’s election in 2027, which seemed like a sure bet only a few days ago, is now an open question,” Boykoff says.
Challengers for his role must submit their candidacies by Nov. 18, and there has already been some speculation as to who might make a bid.
Sheikh Salman bin Ebrahim Al Khalifa, president of the Asian Football Confederation (AFC), was defeated by Infantino in 2016, the current administrator’s first term, but he could return a decade later as a frontrunner. He called Infantino’s investment proposal and his failure to consult AFC on it “totally unacceptable,” putting the two publicly at odds.
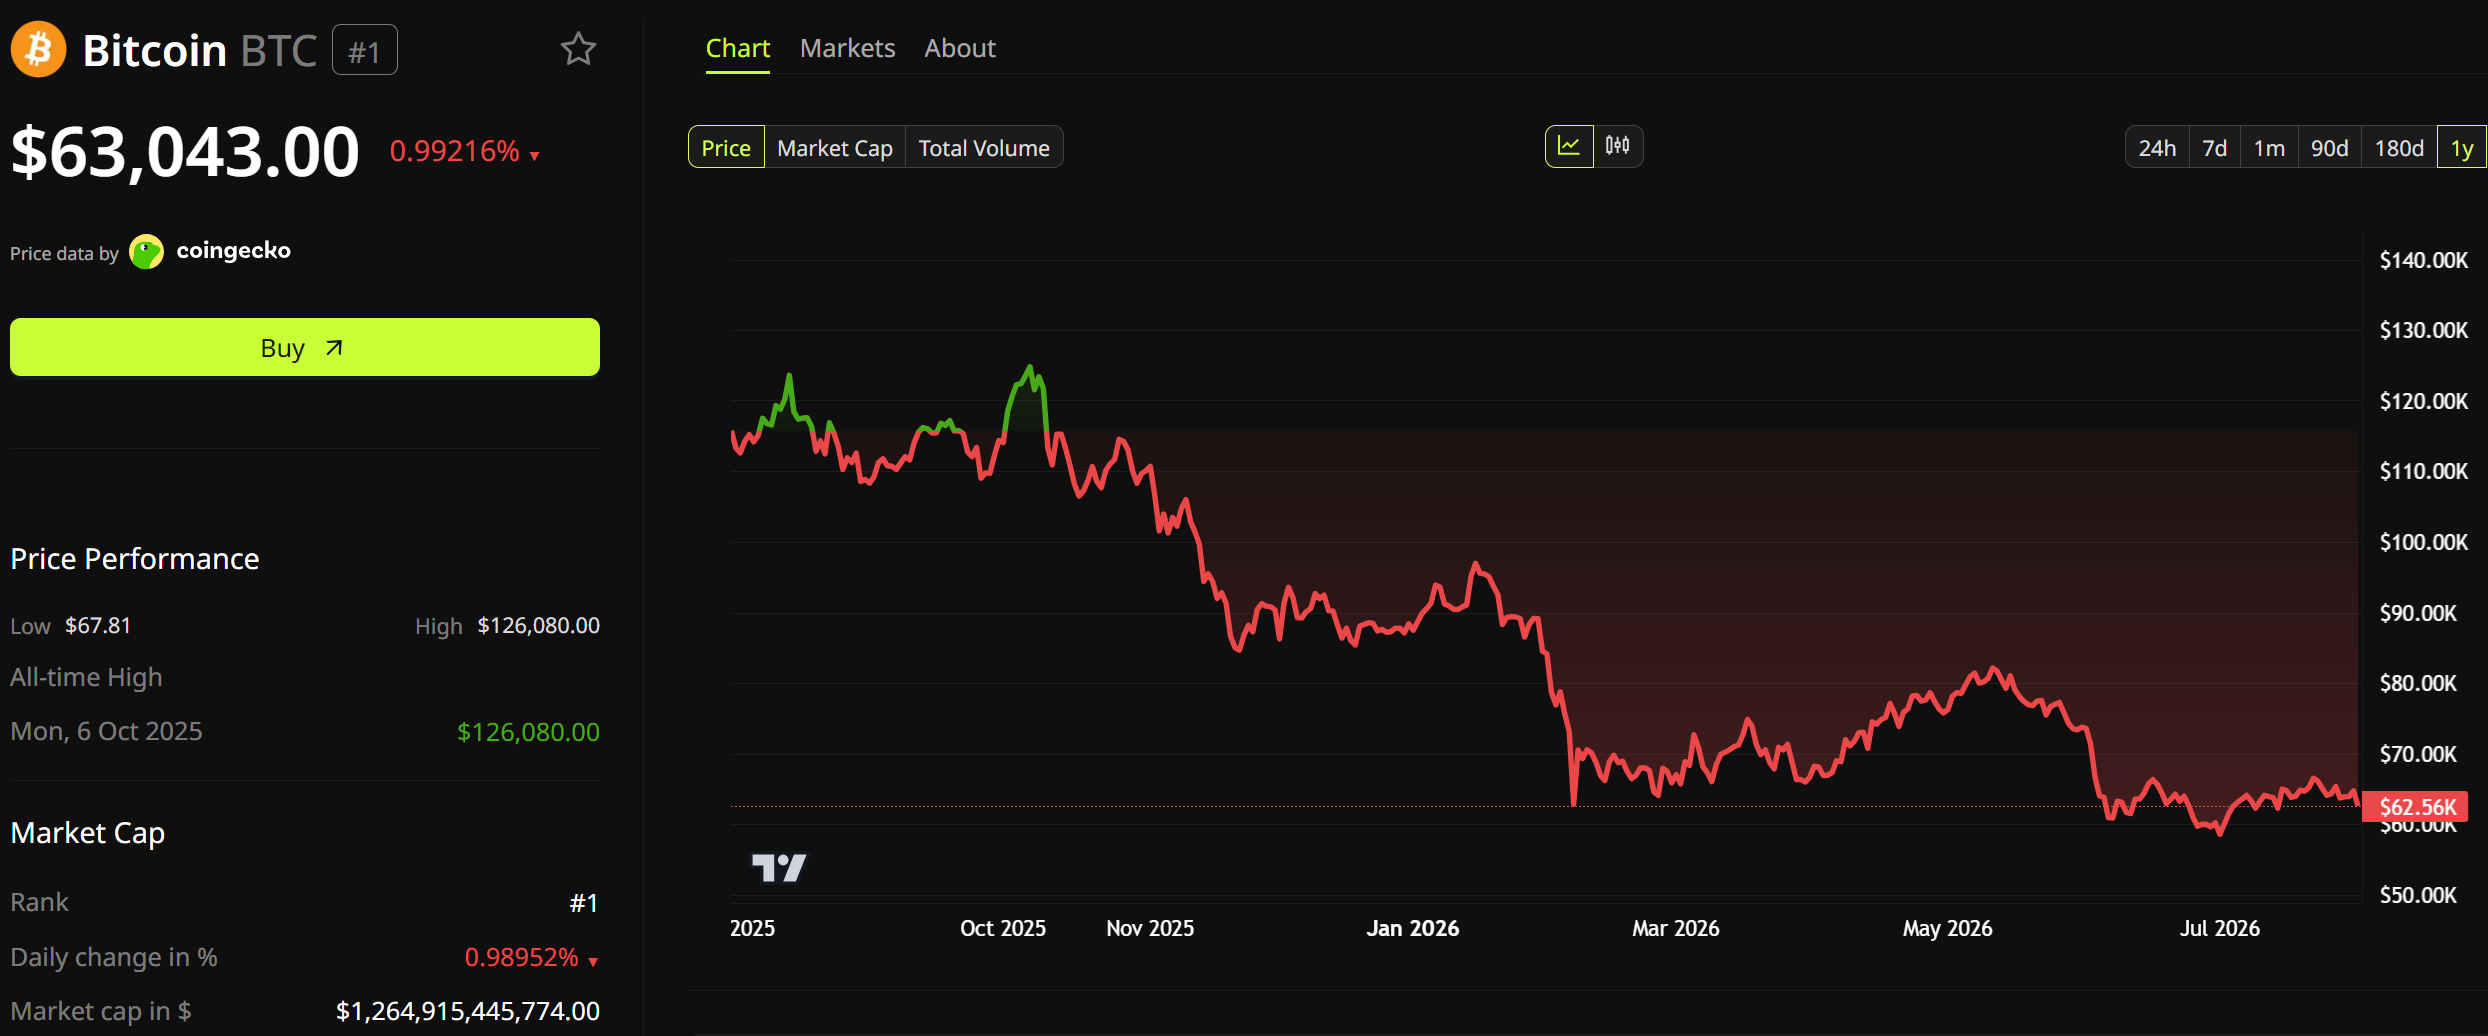
We will begin with the mandatory disclaimer, as we are well aware that historical performance does not guarantee similar moves in the future. However, history does tend to rhyme, and that’s what happened in July for BTC.
The question is: will August follow suit, as the month has not been kind to the largest cryptocurrency, especially the last four editions.
July Brought Some Gains
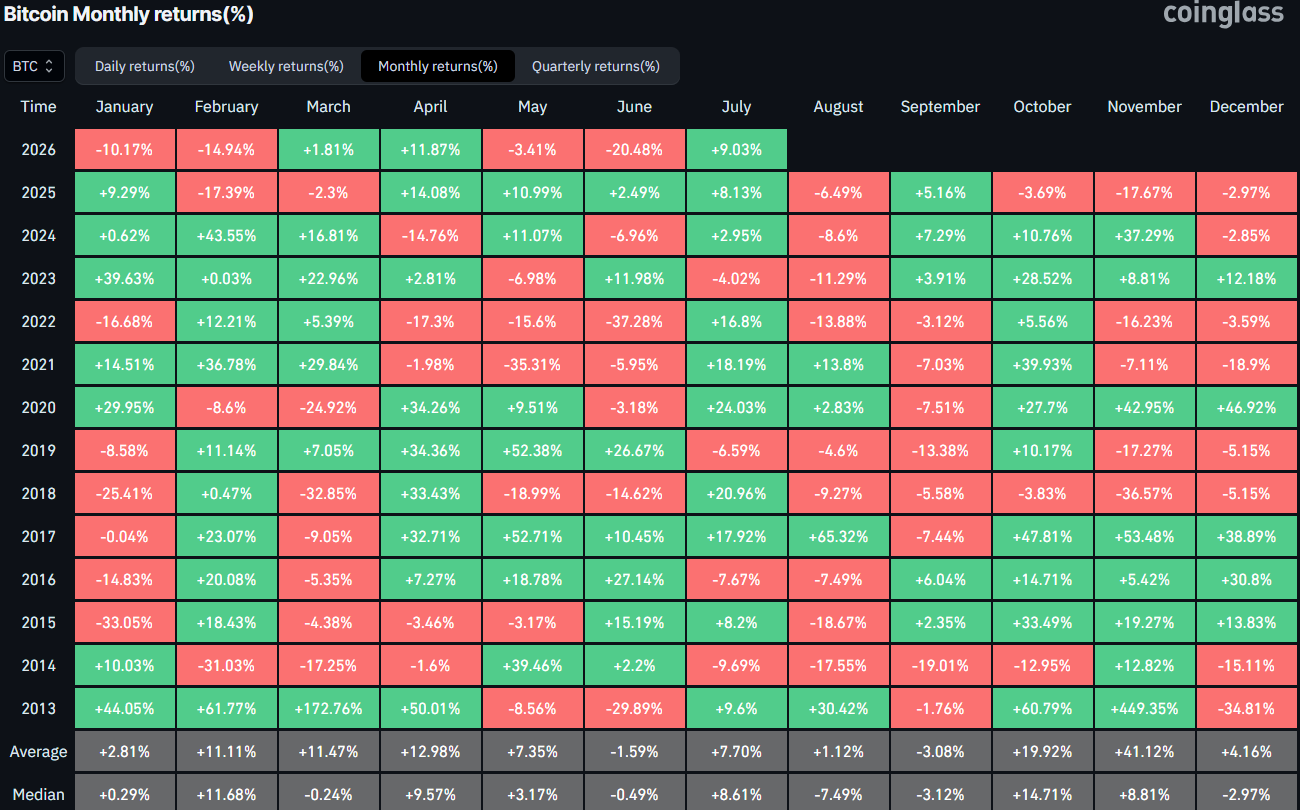
Before we explore what happened in July, here’s a brief outlook of the painful June, which set the stage for a rebound during the seventh month of the year. The 2026 edition of June became the most violent in terms of price moves for the cryptocurrency in precisely four years. It tumbled by 20.48% in 2026 compared to 37.28% in June 2022.
As such, it was almost expected that July would be a better month. History was also on BTC’s side as 9 out of the last 11 were in the green. However, the start was actually quite surprising as bitcoin dipped below $58,000 on July 1 for the first time in nearly two years.
The bears quickly lost control, though, and the asset reclaimed the coveted $60,000 level within a day or two. It wasn’t the most volatile of months, but BTC still managed to post some gains and peaked on July 21 at $67,000. This became its highest price tag in two months.
However, it was rejected there despite the softer-than-expected inflation data for June and the fact that the Fed refused to hike interest rates last week. Thus, bitcoin ended the month at under $64,000, which was still a 9% monthly increase.
Your Move, August
As popular analyst Ali Martinez put it yesterday: August hasn’t been kind to bitcoin. In fact, the last four have all been in the red, posting losses of 13.88%, 11.29%, 8.6%, and 6.49%, respectively. The silver lining is that the declines become less violent over time.
The broader August perspective is still deeply negative, though. Only three out of the last 12 editions have been in the green, with 2017 standing out as the most bullish one on record. At the time, BTC rocketed by over 65%, but it was a different time and a vastly different market phase.
For now, BTC enters August 2026 with lots of uncertainty not only within the industry itself, where interest has dwindled lately, but on a macro perspective as well. The war in the Middle East continues, and the one between Ukraine and Russia too, while inflation remains an issue, and Trump’s controversial actions tend to halt each breakout attempt in its tracks.
The post Bitcoin Rebounded in July, but Bears Target an August Pullback appeared first on CryptoPotato.

Cointelegraph is committed to providing independent, high-quality journalism across the crypto, blockchain, AI, and fintech industries.
All news, reviews, and analyses are produced with full journalistic independence and integrity. For more details on our standards and processes, please read our Editorial Policy.

A crypto-industry-backed political action committee affiliate has intensified its advertising push ahead of next week’s Michigan Republican primary, according to the latest Federal Election Commission (FEC) filings. Protect Progress PAC, which the filings indicate is funded largely by contributions from cryptocurrency companies Ripple Labs and Coinbase, has spent more than $2 million on media to influence the contest in Michigan’s 13th Congressional District.
The most recent updates, filed as of Thursday, show the committee ramping up spending in support of U.S. Representative Shri Thanedar while also funding opposition to his Democratic challenger, Donavan McKinney. The renewed disclosures come shortly after earlier reporting showed the PAC had already ramped up its buy—effectively doubling its reported ad spending from the prior week.
Key takeaways
- FEC filings show Protect Progress PAC has spent over $2 million on media for Michigan’s 13th district primary race.
- New disclosures add $884,240 to advertisements supporting Shri Thanedar and more than $150,000 to ads opposing Donavan McKinney.
- The PAC’s funding is described in the filings as being largely backed by cryptocurrency companies Ripple Labs and Coinbase.
- Thanedar’s legislative record includes support for crypto-related bills such as the GENIUS Act and the CLARITY Act.
- Protect Progress is an affiliate of Fairshake, a major outside spender in U.S. elections tied to crypto industry policy goals.
Michigan’s 13th district: Protect Progress increases ad buys
According to FEC disclosures accessed via the commission’s docquery system, Protect Progress PAC reported spending more than a combined $2 million on media in connection with Michigan Representative Shri Thanedar and his Democratic primary contest against Donavan McKinney.
As of Thursday, the filings reflect a further escalation: compared with what the PAC had already reported spending a week earlier, the committee’s latest report effectively doubled its media spending. The additional outlay includes $884,240 dedicated to ads supporting Thanedar and more than $150,000 aimed at opposing McKinney.
The Michigan primary is scheduled for Tuesday, but the filings underscore that the committee and its network have been willing to deploy substantial resources well before Election Day. Similar patterns have been visible across multiple congressional races during the 2026 cycle, according to the article’s referenced coverage and FEC-based reporting.
Why the race is drawing crypto-linked political money
Thanedar’s congressional record is at the center of the narrative around why outside groups see his candidacy as important for crypto policy. During his time in the House, he voted in favor of the stablecoin-focused GENIUS Act and supported the legislative push for clearer digital asset market structure—the Digital Asset Market Clarity (CLARITY) Act, which has been discussed in the Senate.
He also cosponsored the Promoting Innovation in Blockchain Development Act, an effort aimed at protecting developers. Supporters of crypto policy reform often point to such measures as steps toward a more predictable regulatory environment, while critics argue the industry has too much influence over the political process.
For voters watching the contest, the spending escalation suggests the primary is being treated as more than a local political test—it is being framed by donors and advocacy networks as part of a broader strategy to influence which lawmakers back specific digital asset legislation.
McKinney’s response and the broader allegations over crypto influence
McKinney has publicly characterized the ad push as a payoff for political favors. In a July 21 statement related to the PAC spending, he said “the crypto lobby is paying my opponent back for helping Trump make over $1 billion since taking office,” according to a video shared on his campaign’s Facebook page.
That comment appears to reference the U.S. President’s disclosures about crypto-related earnings, including a figure cited in earlier reporting referenced by the article—more than $1.4 billion from crypto investments in 2025—along with concerns raised by Democrats that Trump could be using his role to profit through policies such as GENIUS.
While those claims are rooted in political argument rather than direct proof of intent tied to the specific Michigan ads, they highlight a recurring tension in U.S. crypto politics: outside spending may be framed by industry-aligned PACs as policy support, while opponents often describe it as evidence of undue influence.
Cointelegraph reports that it reached out to both Thanedar’s and McKinney’s campaigns for comment on the PAC expenditures but did not receive an immediate response.
Fairshake’s affiliates: national momentum in multiple primaries
Protect Progress PAC is an affiliate of Fairshake, a political network that has become one of the most prominent outside spenders linked to crypto industry policy goals. Fairshake was responsible for spending more than $170 million across the 2024 election cycle through media buys supporting candidates it viewed as aligned with crypto-friendly regulation, as summarized in the article.
The article also notes that affiliates have already deployed millions of dollars in 2026 races beyond Michigan, pointing to activity in states including Texas and Illinois. In addition, it cites Public Citizen reporting from June that Fairshake and its affiliates accounted for more than $82 million out of roughly $189 million deployed by crypto companies during the 2026 election cycle.
Fairshake itself reportedly listed holding a $193 million “war chest” as of January, according to figures referenced in the piece. Taken together with the Michigan disclosures, the pattern suggests a sustained approach: deploy substantial resources early enough to shape narrative and voter attention around specific legislative priorities.
The article further describes similar affiliate activity in other congressional primaries. It says Defend American Jobs PAC spent more than $65,000 on media in Washington’s 4th congressional district to support a Republican candidate, with Washington holding primaries on the same day as Michigan.
In Alabama, scheduled primaries on Aug. 11 are also described as a focus for Fairshake-linked spending. FEC filings cited in the article indicate Defend American Jobs PAC spent more than $511,000 on media supporting Jerry Carl Jr., a Republican who represented Alabama’s 1st congressional district from 2021 to 2025.
For readers tracking the cycle, these parallel contests illustrate how crypto-aligned PAC affiliates appear to treat primary elections as strategic targets—places where candidate positioning on digital asset policy could be determined before general election dynamics begin.
What to watch as Michigan’s primary approaches
With Michigan’s 13th district primary scheduled for Tuesday, the key question is whether Protect Progress’s latest ad surge will further alter voter perceptions or turnout in the remaining days. More broadly, the filings reinforce that crypto-linked political spending is not limited to high-profile general election races—affiliates are actively contesting primaries with resources intended to influence policy direction well after election season announcements fade.
Binance founder Changpeng Zhao (CZ) says this bear market has no shortage of money. Plenty of it is hunting for somewhere to go.
Elsewhere, Social Capital founder Chamath Palihapitiya said where he thinks it should land. Not in artificial intelligence (AI) chips.
The Bear Market Has Money. It Is Not Buying Crypto
CZ did not say where the money should go, but acknowledged that there was a lot of liquidity floating despite the bear market.
The numbers show why it is not going into crypto. Bitcoin (BTC) trades near $63,037. It is down 45% in a year. That is almost exactly half its October 6 record.

Chamath Is Buying Land, Not Chips
Meanwhile, the Social Capital founder Chamath Palihapitiya, a venture capitalist, entrepreneur, and investor, buys three things at once. Land, a power connection, and an empty building to hold the computers.
“LPS (Land Power Shell) is still the most obvious and fastest path to cash on cash returns,” Palihapitiya wrote.
Palihapitiya is a former senior executive at Facebook (now Meta), a renowned SPAC sponsor, and former minority owner of the Golden State Warriors.
His reason is simple. Towns keep blocking data centers. Every site that already has power gets rarer.
The numbers back him. Data Center Watch counted at least 75 US projects blocked or delayed in early 2026, worth about $130 billion.It was the worst quarter on record. Opposition groups doubled and now operate in 49 states.
Politicians joined in. More than 300 state data center bills were filed in six weeks. Maine missed becoming the first state to ban them outright by one House vote.
Why He Quit the Chip Business
He says he helped start Groq in 2016. Nvidia licensed Groq’s technology last December. The deal was not exclusive. Groq founder Jonathan Ross moved to Nvidia.
Neither company gave a price, but Palihapitiya says $20 billion. Still, he would not do it again as chips have to run too fast, factories have to be too exact, and a startup cannot get enough memory.
How Much Power He Has Bought
Palihapitiya says he and his partner Anita Vlallian have acquired almost six gigawatts (GW). It arrives in stages through 2029.
One deal shows the going rate. Nasdaq-listed TeraWulf used to mine Bitcoin. In July it leased a 401-megawatt site in Hawesville, Kentucky, to Anthropic. The lease runs 20 years and should bring in about $19 billion.
Here is the part that proves his point. That site is not built yet. Power starts flowing in late 2027 and reaches full load in early 2028.
The money is committed anyway. Palihapitiya holds roughly 15 times that much capacity. His is not leased out yet, so the figure shows the size of his bet, not its value.
However, miners got there first, and already own cheap power, land with grid hookups, and empty sheds. Coinbase chief executive Brian Armstrong disputed the mining warning in July.
What Could Go Wrong
Jordi Visser of 22V Research says easy money is over in AI. He expects about 30% a year now.
The land bet also needs the protests to keep coming. If towns start approving data centers again, the scarcity goes away.
TeraWulf’s $19 billion is a forecast too. Its own filing calls it expected revenue.
CZ is right. The money is out there. The question is whether it buys power lines or comes back to Bitcoin and crypto markets.
The post CZ Says Bear Market Money is Hunting, Social Capital Founder Says Skip AI Chips appeared first on BeInCrypto.
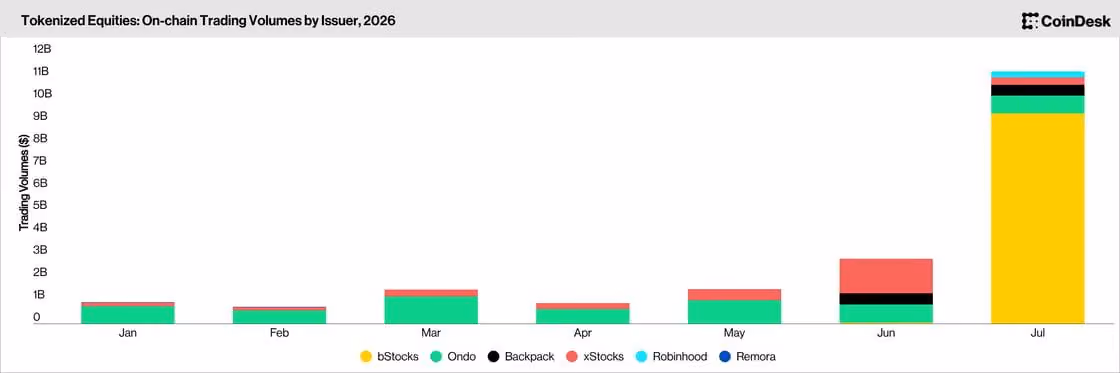
Trading volume for tokenized stocks and ETFs surged 288% to a record $11.3 billion in July, though most of the increase came from a single Binance-linked token.
Binance bStocks accounted for $9.41 billion, or 83.3% of the total, according to CoinDesk Data’s latest Stablecoins & Tokenized Assets report. A bStocks token, QQQB, tracking Invesco’s QQQ ETF, generated $9.27 billion alone, equivalent to roughly 82% of all tokenized-equity volume.

Excluding QQQB, July volume was roughly $2.03 billion, about 30% below the market’s implied June total of $2.91 billion. xStocks volume dropped to $335 million from $1.55 billion, while Ondo recorded $792 million and Backpack $479 million, the report details.
QQQB began trading on Binance on June 30 with zero maker fees through Aug. 31. Binance also began counting stocks and bStocks volume at three times its traded value for some users seeking higher VIP tiers on July 23, though the multiplier does not alter actual trading volume.

Prince William and Kate Take Kids to 2026 Commonwealth Games
Gulveer Singh scripts history, becomes first Indian to win Commonwealth Games 5000m medal | Commonwealth Games News

Evangelist is booted from Alaska Airlines flight for trying to preach a sermon in the skies


-
 Sports6 days ago
Commonwealth Games boxing: Jadumani Singh seals dominant 5-0 win over Pakistan’s Sumama Rehman to enter quarter-finals | Commonwealth Games News
-

 Business3 days ago
Why Trees Belong on the Risk Register
-

 Fashion1 day ago
Weekend Open Thread: Wit & Wisdom
-

 Tech6 days ago
Intel is reversing course and bringing hyper-threading back to its server chips
-

 Politics24 hours ago
Meta enters AI-training agreement with far-right ‘propaganda rag’ Newsmax
-

 Politics5 days ago
Luke Littler dismantles Gerwyn Price to retain title in Blackpool
-
 Crypto World6 hours ago
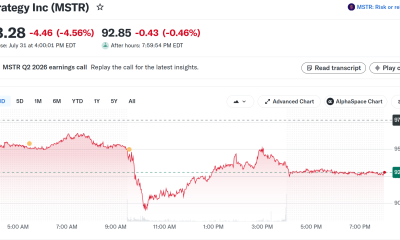
MicroStrategy Post-Earnings CLARITY Act Push Could Add New Catalyst for Its Stock
-

 Politics5 days ago
The Part of the Electric Transition Nobody Wants to Discuss
-

 News Videos6 days ago
BITCOIN JUST ENTERED THIS CRITICAL ZONE…
-
 Entertainment4 days ago
‘Stargate’ Creator’s New Sci-Fi Series Returns for Season 3 Tomorrow
-

 Business4 days ago
Major shareholder moves on Canyon
-

 Crypto World7 days ago
XRP Ledger adds $2.6B as RWA inflows rank second
-

 Politics6 days ago
Spain sweeps the board at 2026 World Cup with individual awards
-

 News Videos2 days ago
Bitcoin Enters the 3rd Stage of the Bear Market
-
Crypto World15 hours ago
XRP Ledger v3.3.0 brings five institutional features
-

 Entertainment7 days ago
Sara Gilson Killed By Husband After Viral “Pedophile” TikTok Video
-

 Crypto World4 days ago
Kraken Enables Retail Access to Jersey Mike’s IPO via Tokenized Shares
-

 Tech5 days ago
New macOS Sequoia & Sonoma security updates for older Macs
-

 News Videos4 days ago
Claude: Build Financial Dashboards in Minutes (2026)
-

 Politics2 days ago
Luke Littler’s dominance sparks GOAT debate
You must be logged in to post a comment Login