

Crypto World
Bitcoin (BTC) Steadies Near $60,000 After Volatile Week
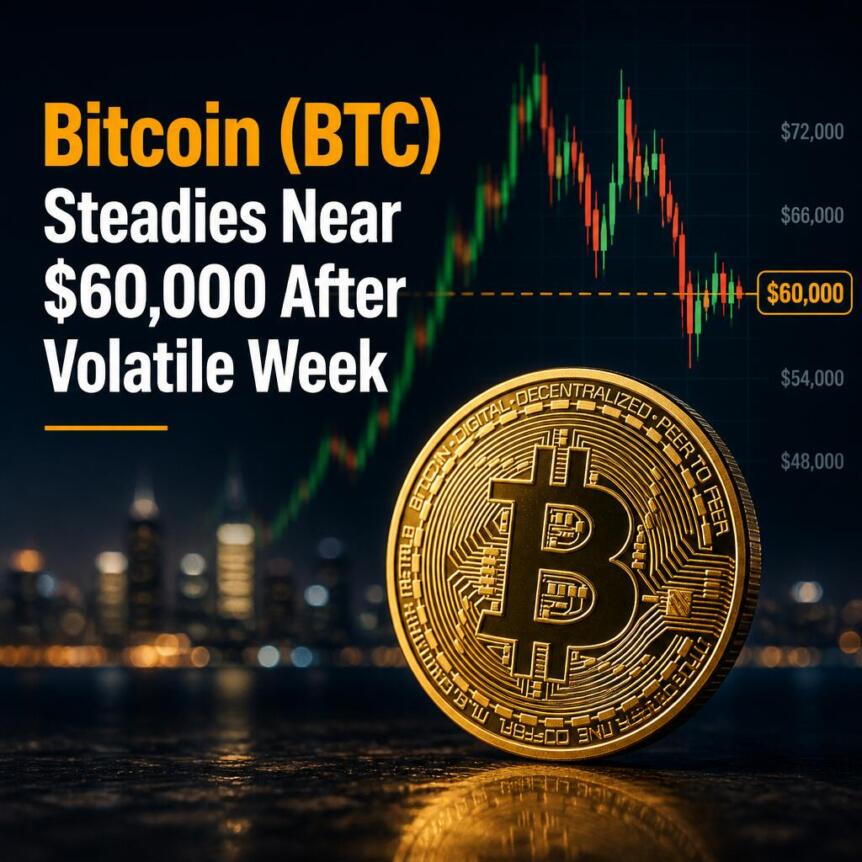
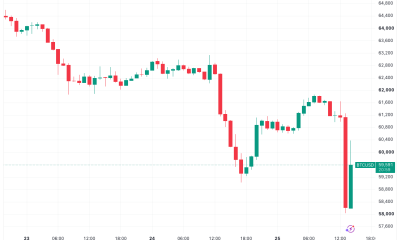
Bitcoin (BTC) steadied itself over the weekend after a volatile week that saw its value drop to its lowest level since September 2024.
The flagship cryptocurrency fell to a low of $58,000 on Thursday, struggling against sustained ETF outflows, a hawkish Federal Reserve, concerns around Strategy, and a stronger US Dollar.
Bitcoin Stabilizes After Sharp Selloff
BTC experienced a substantial downturn last week, falling from a high of $65,553 on Monday to a low of $58,000 on Thursday. ETF outflows, a stronger US Dollar, a hawkish Federal Reserve, and the ongoing geopolitical situation continue to pressure Bitcoin and the broader market. However, price action steadied over the weekend and has reclaimed the $60,000 level after falling to a low of $58,800 earlier today.
Bulls have defended $58,000, a key support level, despite substantial selling pressure. BTC maintained its position above $58,000 over the weekend despite fresh US-Iran tensions over a volatile ceasefire. Markets had registered a substantial recovery earlier this month after tensions in the Middle East thawed, easing oil prices and inflation concerns. However, the rally soon fizzled out, pushing the price to sub-$60,000 levels.
BTC’s price action could go one of two ways. If the flagship cryptocurrency fails to regain momentum and slips below $58,000, a drop toward $55,000 or lower can be expected. However, a clean recovery above $60,000 would suggest buying pressure returning.
Strategy Under Pressure
Concerns around Strategy’s capital structure have also impacted market sentiment. STRC, the company’s preferred stock product, is currently trading around $74.57, significantly lower than its intended $100 mark. Annual dividend obligations have risen to $1.2 billion, while dividend coverage dropped to 14 months thanks to declining cash reserves. Strategy used its stock premium to raise capital for more BTC acquisitions. However, weak pricing has made it substantially harder for the Michael Saylor-led firm to depend on this model to raise additional capital.
Meanwhile, CryptoQuant has urged Strategy to pause its acquisitions and rebuild its cash reserves. However, the plea looks to have fallen on deaf ears, with Michael Saylor teasing another buy, posting the company’s Bitcoin tracker with the caption “We’re going to need more charts.”
Analysts Divided
Meanwhile, analysts remain divided on Bitcoin’s price action. Analyst Market Watcher highlighted a downtrend from July and August highs of around $70,000 and $67,000, adding that a break of the line would make investors more willing to deploy capital. The analyst described the current price range as an “indecisive summer chop.” However, he added that a break of the main trend around $58,000 could change the entire setup.
Another analyst, EGRAG CRYPTO, highlighted Bitcoin’s 12-month cycle, adding that the current cycle may be different from the usual “three years up one year down” cycle. Meanwhile, CryptoQuant analyst Crazzyblockk stated that Bitcoin is currently in an undervalued zone after its short-term holder realized dominance fell to 27.6%. Previous cycles have witnessed market tops when short-term holders controlled the realized capital. Bear markets witness the opposite, as short-term holders realize their losses and realized capital drops.
Disclaimer: This article is provided for informational purposes only. It is not offered or intended to be used as legal, tax, investment, financial, or other advice.

Crypto World
Bitcoin’s tie to USD/JPY is the strongest it’s been since 2022. Here’s why that matters.


Under the “yen carry trade” framework, a weak yen (USD/JPY rising) is supposed to be accompanied by rising BTC, just as it tends to support stocks. Extending that logic, a strengthening yen should trigger risk aversion in both stocks and cryptocurrencies.
That’s precisely what happened in late July/early August 2024, when the Bank of Japan hiked interest rates, sending the yen sharply higher. Risk assets had a meltdown, with BTC falling from roughly $65,000 to $50,000 in the following weeks.
Carry-unwind fears have resurfaced lately as the yen continues to slide, hitting four-decade lows this week. That’s raised hopes of more aggressive action by the BOJ to stem the yen’s slide.
However, if the latest correlation is anything to go by, potential BOJ action and a resulting rise in the yen could actually put a floor under BTC, working the opposite way from what carry-trade logic would predict.
A mirage?
Correlation doesn’t necessarily mean causation.
Neither BTC nor the yen may be driving the other directly. Instead, broad US dollar strength or weakness may be moving both assets independently, creating the appearance of a tight BTC-yen relationship.
That reading makes sense in context: markets have recently priced in at least one 25-basis-point interest rate hike from the Fed this year. That hawkish repricing, a sharp reversal from earlier hopes of rate cuts, has lifted the dollar broadly. The euro, the Australian dollar, the New Zealand dollar, gold and silver have all declined against the greenback over the same stretch.


The chances of the crypto market structure bill, or CLARITY Act, passing before the November midterm election have remained far from assured as major legislative hurdles continue, according to investment bank TD Cowen.
Summary
- TD Cowen said the CLARITY Act faces significant political and procedural hurdles before the November midterm election.
- Senate leaders are expected to begin considering the bill in mid July, but unresolved policy disputes could delay a floor vote.
- Ethics rules, anti money laundering concerns and uncertainty over President Donald Trump’s support continue to weigh on the bill’s prospects.
According to TD Cowen’s Washington Research Group, Senate Majority Leader John Thune is expected to begin the procedural process for the CLARITY Act during the week of July 13, potentially setting up a Senate floor vote either that week or during the week of July 20.
The investment bank’s managing director, Jaret Seiberg, said the legislation still faces several obstacles before it can clear the Senate.
He identified July 24 as the key deadline before the House leaves for its August recess and questioned whether the bill could realistically advance later in the year if lawmakers fail to act before then.
“We continue to question if the bill can pass in the fall before the election,” Seiberg wrote.
The assessment follows similar concerns raised last week by Galaxy Research, which reduced its estimate of the CLARITY Act becoming law in 2026 to 50% from 60%, citing Senate scheduling constraints and limited legislative time.
Earlier this month, JPMorgan analysts also said they see less than a 50% chance of the bill passing this year because of the approaching midterm election, unresolved policy disputes and the continuing debate over stablecoin yield.
Previous reporting by journalist Eleanor Terrett also said congressional staff, White House officials and crypto industry representatives have continued negotiating the legislation while the Senate remains in recess, with ethics rules, anti-money-laundering provisions and digital asset market oversight among the unresolved issues.
Trump stance and ethics debate remain key obstacles
One area of uncertainty, according to TD Cowen, is whether President Donald Trump would ultimately sign the legislation.
Seiberg said Democrats are expected to force Republicans to vote on politically difficult amendments, and Republican lawmakers are unlikely to take those votes unless they believe Trump will approve the final bill.
According to the note, that confidence has weakened after Trump declined to sign a bipartisan housing bill negotiated by his own administration and later said he would not approve legislation until Congress passes the Safeguard American Voter Eligibility Act. Although Seiberg said Trump could still make an exception for the CLARITY Act, he warned the uncertainty could delay the bill.
Ethics provisions have also become another point of disagreement. According to TD Cowen, Democrats want to ban government officials and their families from owning crypto businesses, a proposal that would also apply to the president. Seiberg said Trump has not indicated a willingness to compromise, leaving Republicans in a position where they may have to reject a Democratic amendment.
“It is not clear to us the GOP has the votes,” Seiberg wrote, adding that Republican Senators Thom Tillis, Mitch McConnell, Bill Cassidy, John Cornyn, Susan Collins, and Lisa Murkowski could play an important role because several are moderates or are retiring.
Separately, TD Cowen said the White House has continued meeting with stakeholders over concerns from law enforcement agencies about whether software developers should be held responsible if tools they create are later used for money laundering or other illicit finance. Seiberg said resolving those concerns would improve the bill’s prospects.
The discussion follows a letter sent last week by several law enforcement groups to the White House arguing that Section 604 of the CLARITY Act, known as the Blockchain Regulatory Certainty Act, could weaken oversight by protecting non-custodial software developers and make investigations into illicit crypto activity more difficult.
However, Seiberg said he does not expect changes to the bill’s stablecoin yield provisions despite continued opposition from banks.
Key Takeaways
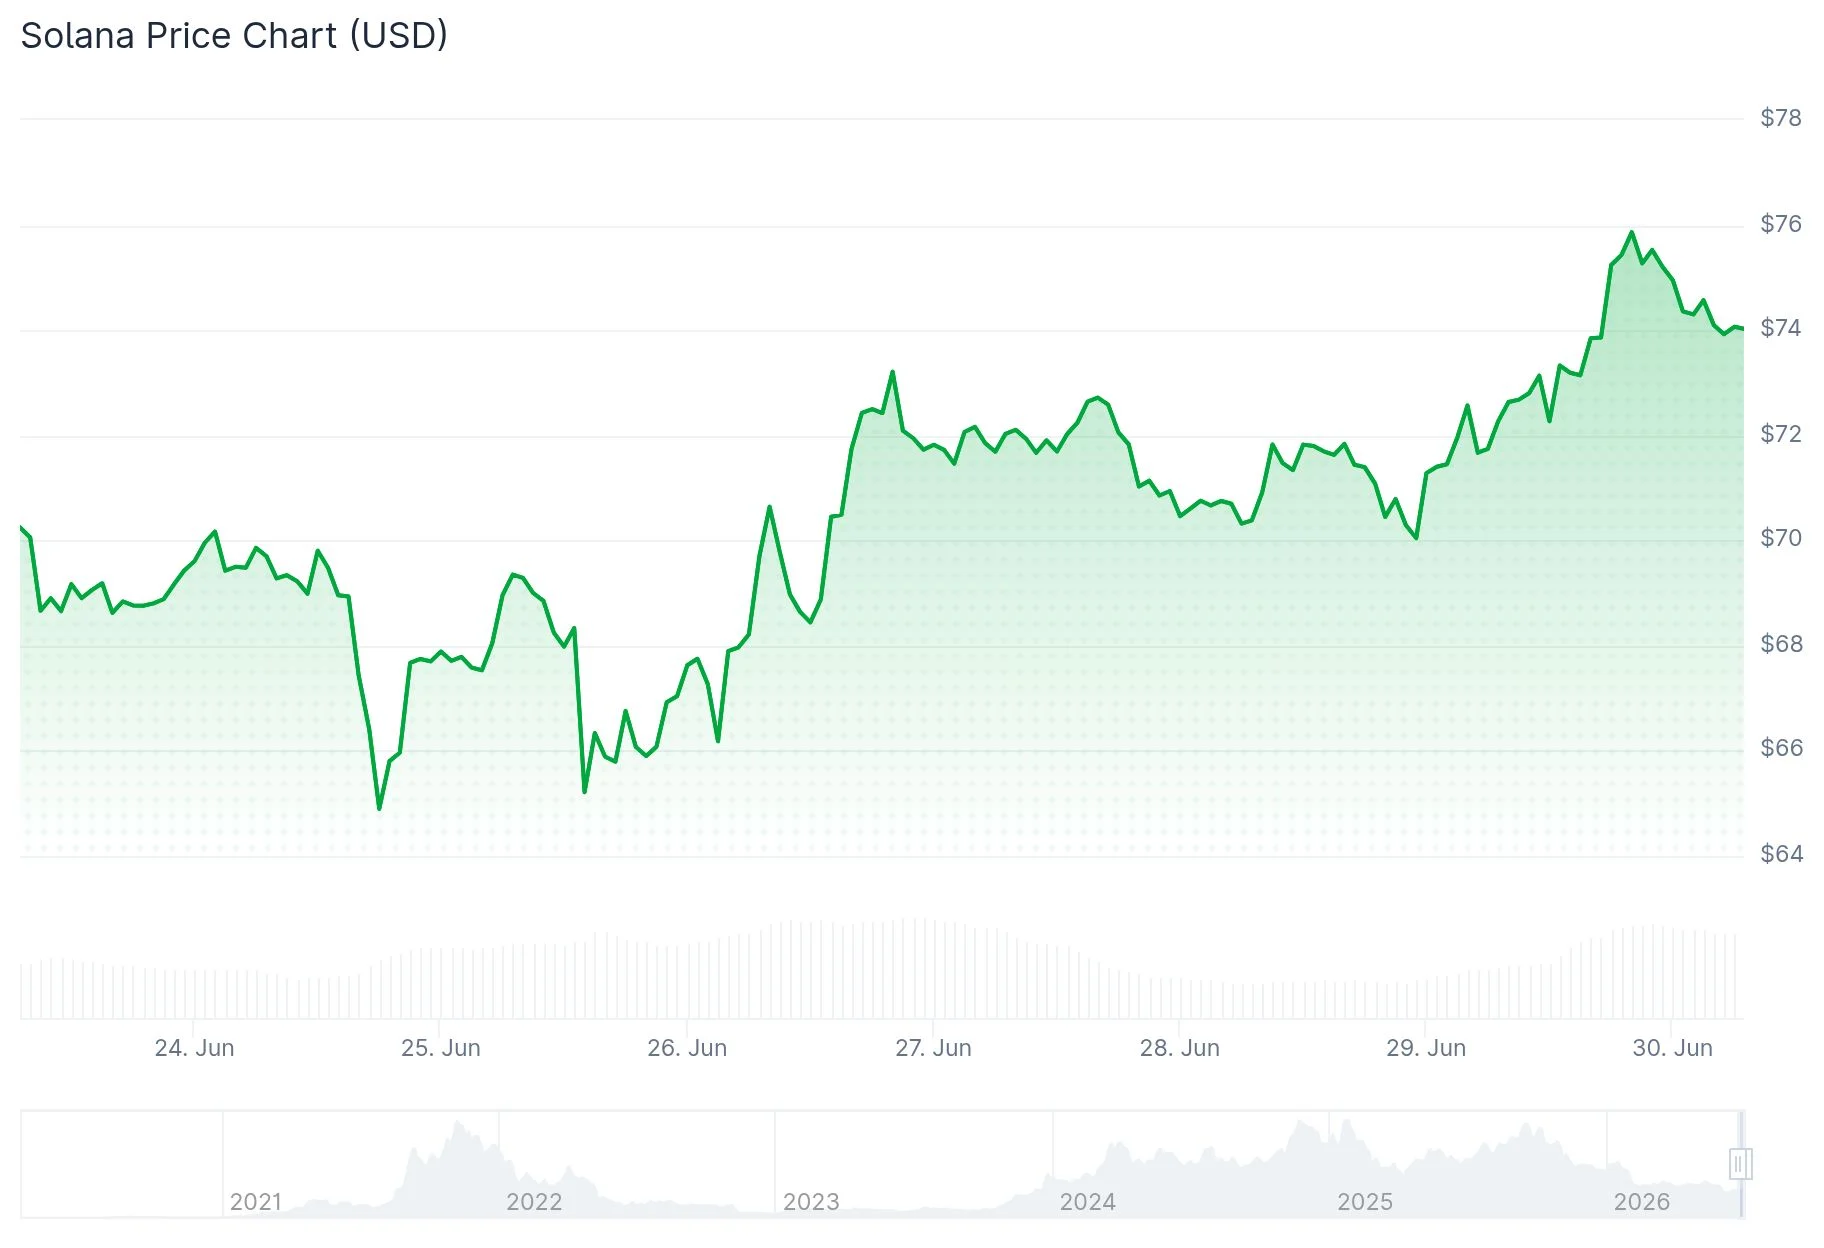
- Solana is currently testing a critical demand zone between $65 and $71 after retreating to $71.37.
- Over 60 million SOL tokens were transacted within the $65–$71 range, establishing it as a significant support area.
- Failure to maintain $70 could trigger declines toward $64, followed by $53.10, based on URPD analysis.
- Technical indicators show RSI at 51.60 with a bullish MACD crossover, hinting at potential momentum shifts.
- World Xyz, a Solana-based project, officially launched, injecting renewed enthusiasm into the community.
Solana’s price has retreated to $71.37 in the last 24 hours. This decline mirrors Bitcoin’s broader market correction that affected most cryptocurrencies.

Blockchain data reveals that over 60 million SOL tokens were traded between the $65 and $71 price levels. This concentration of activity establishes this range as a formidable nearby support area.
When significant supply clusters form within a specific price band, they typically function as a buffer during market downturns. Numerous investors established their positions within this zone and may actively defend these levels.
Should SOL maintain support above $70, the asset could enter a consolidation phase. Subsequently, it might challenge the resistance barrier near $73.
A breach below $70 would alter the technical outlook significantly. Market participants would then monitor for potential movement toward the $64 level, according to recent technical assessments.
Critical Support Zones Under Watch
Should the $64 level give way, additional support areas exist at $53.10, $23.60, and $8.85. The $53.10 zone carries particular significance for near-term price action, with approximately 7 million SOL having changed hands at that level.
The present downturn isn’t driven by Solana-specific factors. Bitcoin declined 1.43% during the same timeframe, while overall cryptocurrency market capitalization contracted 1.18%.
This correlation demonstrates that Solana continues exhibiting high-beta characteristics. When Bitcoin experiences selling pressure, alternative cryptocurrencies typically amplify those movements.
The Fear and Greed Index currently registers 16, reflecting prevailing market caution. SOL is positioned beneath its 30-day EMA around $72.48.
The daily RSI indicator hovers near 34.83, indicating subdued momentum. While MACD remains in negative territory, the histogram displays marginal improvement.
Alternative technical analysis presents a more optimistic scenario. RSI has advanced to 51.60, with the signal line at 45.95, while the MACD line exhibits a bullish crossover with a histogram reading of 0.68730.
These technical signals indicate potential easing of downward pressure. Validation would require increased trading activity and decisive closes above resistance thresholds.
Project Developments and Market Commentary
The enigmatic Solana initiative World Xyz has officially unveiled itself following extended speculation. The project previously acquired the world.xyz domain for $80,000.
Vibhu from the Solana Foundation characterized World as an agentic, intent-focused settlement infrastructure constructed on the x402 protocol. The platform functions as a decentralized framework for tokenizing tangible assets.
Following this revelation, SOL’s price appreciated 2.86% over 24 hours. Market analyst 0xNeena indicated that losing the $65–$75 support corridor would leave SOL vulnerable to further declines toward the $50–$55 range.
On X, analyst Sjuul from AltCryptoGems observed that SOL “has been showing some strength on lower time frames” while noting that “on higher time frames it is still in trouble.” Sjuul emphasized that meaningful recovery requires SOL to recapture the $78 threshold.
Solana’s trading volume allegedly surged over 3,200% during Q2, hitting $67 billion. Memecoin trading, staking protocols, and diverse applications contributed to this substantial growth.
Solana ETF flow data indicated $5.8 million in net outflows throughout June. A $15 million short position has sparked discussion regarding whether the current correction might intensify.
CryptoPatel identified an extended support corridor between $40 and $60, projecting ambitious long-term targets at $500 and $1,000 should SOL reclaim higher resistance zones eventually. Analyst Ardi suggested one final capitulation below present levels remains plausible before any substantial recovery materializes.


CFTC has opened a wide ranging investigation into Polymarket’s business activities, including its social media operations, according to new reports.
Summary
- The CFTC has opened a broad investigation into Polymarket covering its business activities and social media operations.
- The inquiry follows reports that Polymarket used fake trading videos and undisclosed influencer promotions to attract users.
- The investigation comes as Polymarket works to restore access to the U.S. market while facing renewed regulatory scrutiny.
According to Bloomberg, the Commodity Futures Trading Commission is conducting an extensive investigation into prediction market platform Polymarket that covers multiple parts of its business, including its social media activities.
The report follows a Wall Street Journal investigation published last week that alleged Polymarket hired dozens of mostly college-aged content creators to post fake trading videos designed to attract new users. Bloomberg reported that the CFTC inquiry extends beyond those marketing practices into other aspects of the company’s operations.
CNBC has separately reported, citing a person familiar with the matter, that the investigation remains active, although the source did not disclose when it began.
Both the CFTC and Polymarket have yet to issue an official statement regarding the matter.
Investigation follows scrutiny over promotional campaign
The Wall Street Journal has also alleged that Polymarket used replica versions of its trading platform to create promotional videos showing fabricated bets and winnings.
According to the newspaper, it reviewed 1,105 videos posted between December 2025 and mid-May and found that about 70% contained simulated trades rather than real market activity. The report said the campaign displayed roughly $1.9 million in fake bets, including nearly $900,000 in fabricated winnings that would instead have resulted in losses if placed on the live platform.
Further, it alleged that creators were paid about $2,000 to $3,000 per month through marketing contractor Virality and were instructed not to disclose the sponsorships. Analytics firm Tubular, separately, estimated the videos generated more than 140 million views across TikTok, YouTube, and Instagram.
Responding to those allegations, Polymarket told CNBC it is conducting a comprehensive audit of its active promotional content to ensure it complies with company standards as well as regulatory and legal disclosure requirements.
Questions over U.S. access continue
Bloomberg reported that the CFTC previously closed, alongside the U.S. Department of Justice, an investigation into whether Polymarket violated restrictions on U.S. users without filing charges last year.
The company has barred Americans from its main platform since reaching a settlement with the regulator in 2022, although the report noted that some users continue accessing the service through virtual private networks.
The company has also been working to restore access to the U.S. market. As crypto.news has previously covered, Polymarket launched a CFTC-regulated U.S. exchange in December.
In the meantime, Senators Adam Schiff and John Curtis asked CFTC Chair Michael Selig last week to confirm whether the agency had opened an investigation into Polymarket’s advertising practices and to explain how it has prevented the platform from attracting U.S. users since the 2022 settlement.
According to their letter, the senators also questioned whether the agency has sufficient oversight tools to supervise prediction markets and requested details on advertising standards, influencer disclosure rules, consumer safeguards and age verification requirements.
The current inquiry would be the first major investigation into an event contract platform under CFTC Chair Michael Selig, whose tenure has generally been viewed as supportive of prediction markets.
Following the US dollar’s notable strength last week, European currencies have entered a period of consolidation. Investors and market participants have temporarily reduced trading activity ahead of a series of key macroeconomic releases from the euro area, the UK and the US, which could determine the next direction for EUR/USD and GBP/USD. At the same time, markets continue to monitor developments in the Middle East, as easing geopolitical tensions have somewhat reduced demand for safe-haven assets, allowing investors to shift their focus back to economic fundamentals.
Investor sentiment has also been supported by reports suggesting that the US and Iran may be close to reaching an agreement to halt mutual strikes and resume negotiations. The restoration of shipping through the Strait of Hormuz has reduced concerns over disruptions to global oil supplies and contributed to greater stability across financial markets. Nevertheless, ongoing disagreements over the situation in the Strait of Hormuz and conflicting statements from Iranian officials indicate that geopolitical risks have not yet fully subsided.
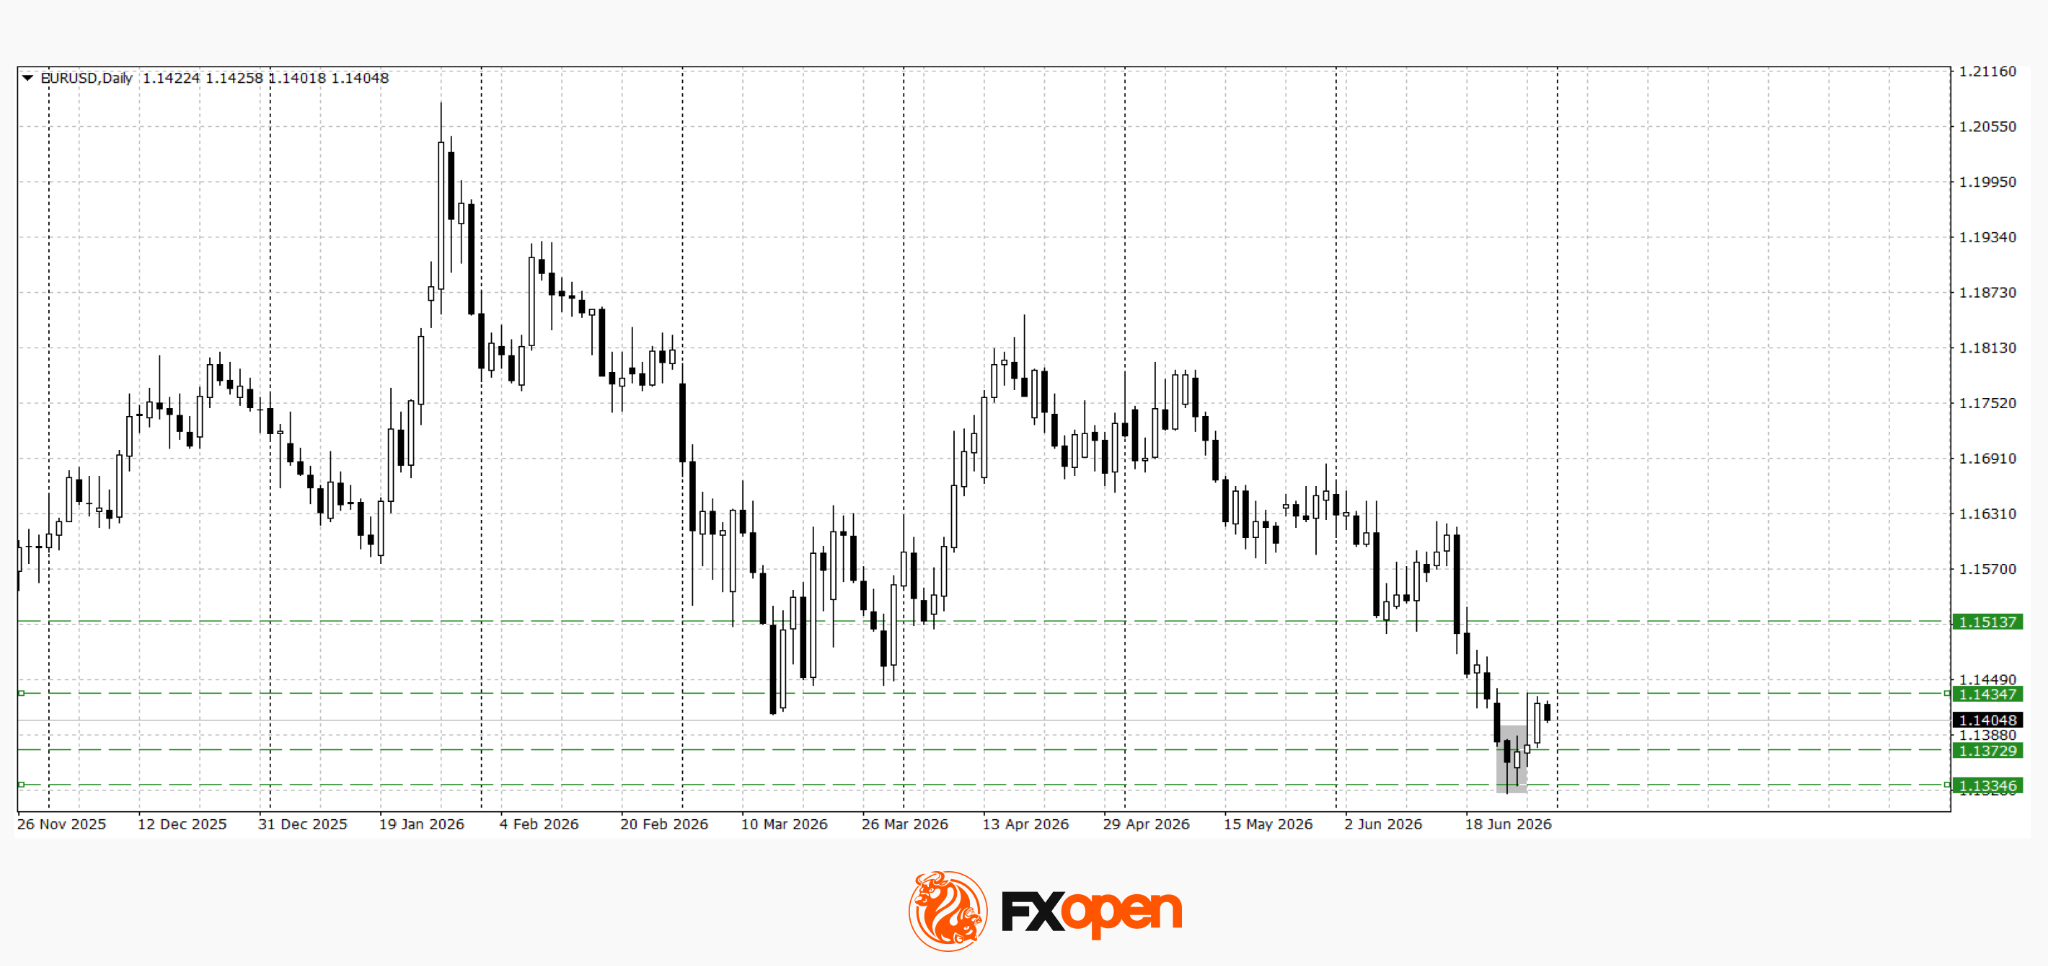
EUR/USD
Following a test of the March low, a bullish Piercing Line candlestick pattern formed on the daily timeframe. Technical analysis suggests that EUR/USD is trading within a sideways range between 1.1340 and 1.1430. Price action around these boundaries, together with the incoming macroeconomic data, should provide further clues regarding the pair’s next directional move.
Key events for EUR/USD:
- Today at 09:45 (GMT+3): France CPI.
- Today at 15:00 (GMT+3): Germany CPI.
- Today at 17:00 (GMT+3): US JOLTS Job Openings.

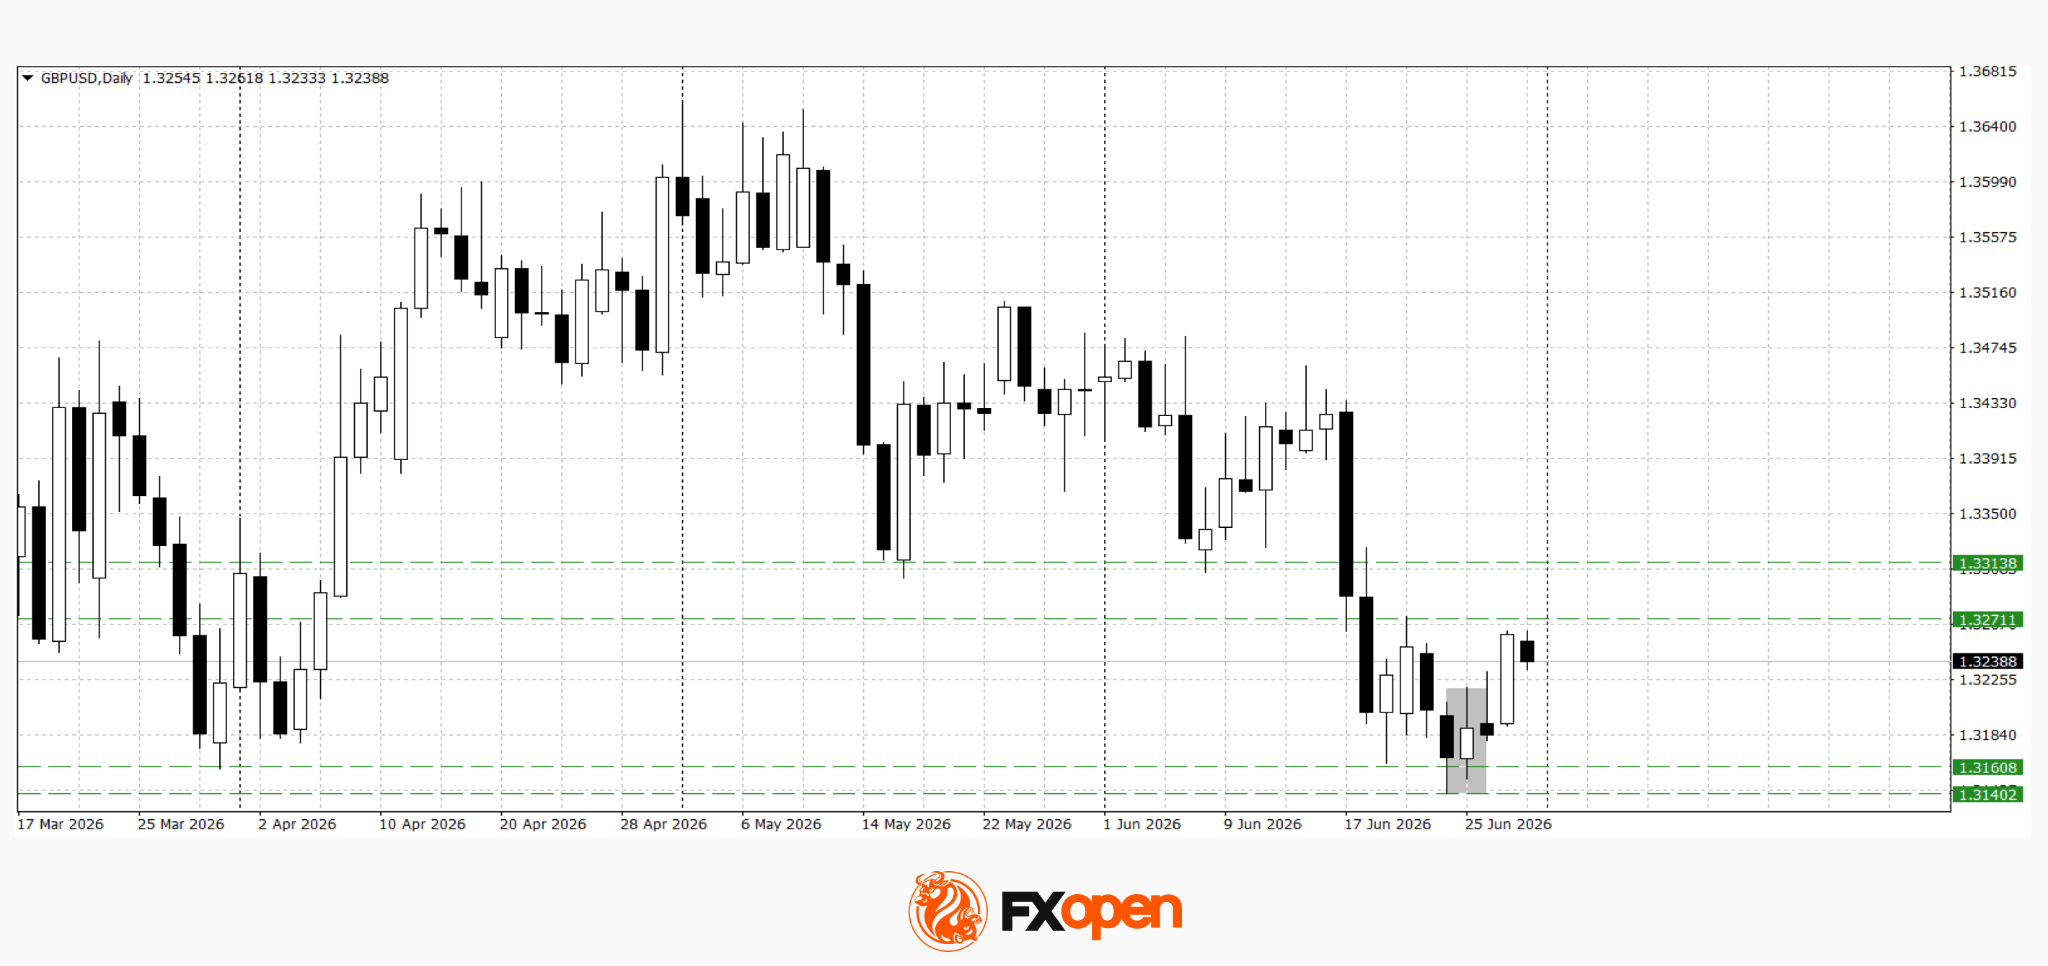
GBP/USD
After testing this year’s March low at 1.3160, sterling buyers regained the initiative and formed a bullish Piercing Line candlestick pattern. The pair has since rebounded towards 1.3270, although any further upside is likely to depend on incoming macroeconomic data. Technical analysis suggests the pair may retest the 1.3270 level. A decisive break and close above this resistance could pave the way for further gains towards 1.3300–1.3310, while rejection from current resistance may trigger a decline back towards the 1.3140–1.3160 area.
Key events for GBP/USD:
- Today at 09:00 (GMT+3): UK GDP.
- Today at 13:40 (GMT+3): Speech by Bank of England Financial Policy Committee member Sarah Breeden.
- Today at 17:00 (GMT+3): US CB Consumer Confidence Index.
Following the sharp moves seen in recent sessions, the foreign exchange market has entered a wait-and-see mode. The release of key economic data on both sides of the Atlantic is likely to determine whether the current consolidation becomes the starting point for a recovery in European currencies or gives way to a renewed strengthening of the US dollar.
Trade over 50 forex markets 24 hours a day with FXOpen. Take advantage of low commissions, deep liquidity, and spreads from 0.0 pips (additional fees may apply). Open your FXOpen account now or learn more about trading forex with FXOpen.
This article represents the opinion of the Companies operating under the FXOpen brand only. It is not to be construed as an offer, solicitation, or recommendation with respect to products and services provided by the Companies operating under the FXOpen brand, nor is it to be considered financial advice.
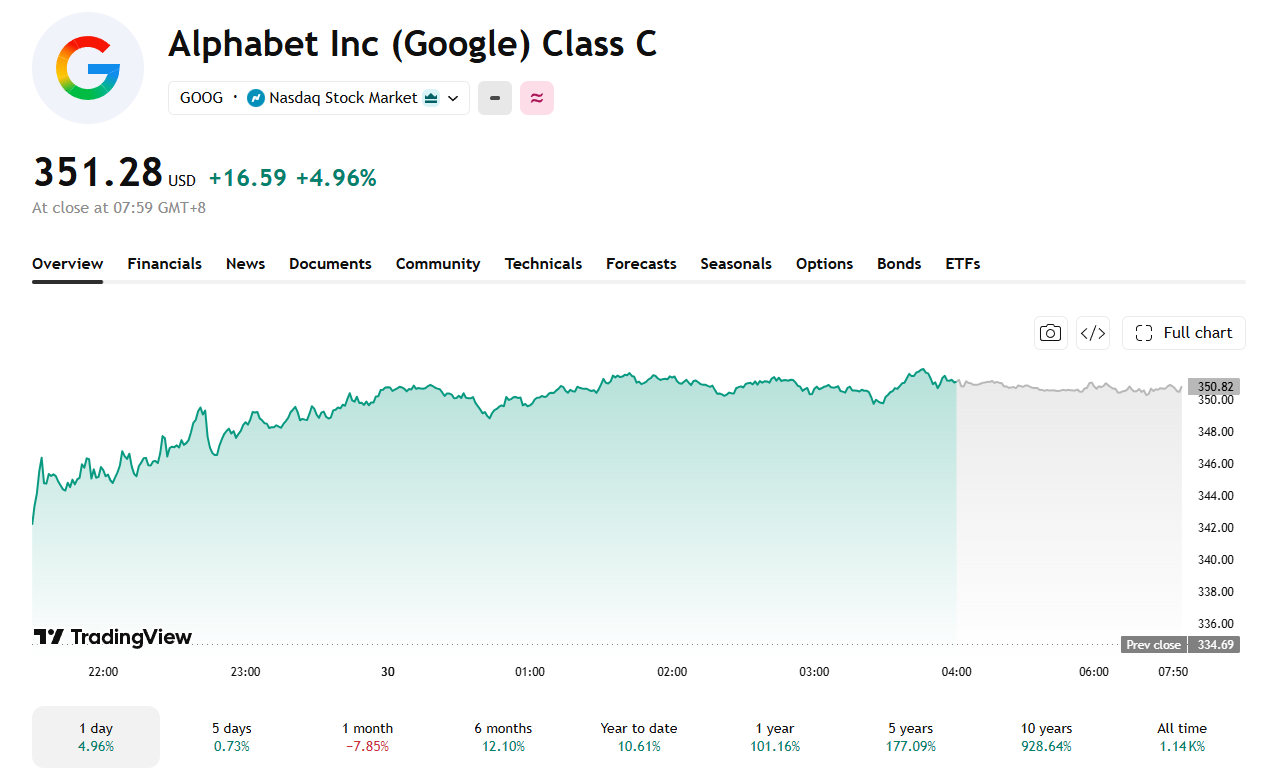
The Dow Jones Industrial Average (DJIA) closed above 52,000 for the first time on Monday, June 29, powered by Alphabet’s blue-chip debut and a broad rally in semiconductor stocks.
The index gained 306.63 points, or 0.59%, to finish at 52,182.74. The S&P 500 rose 1.18% to 7,440.43, and the Nasdaq Composite surged 2.07% to 25,820.14.
Alphabet’s Dow Debut Lifts Sentiment
Alphabet (GOOGL) climbed nearly 5% on its first session as a Dow member after replacing Verizon in the index. The addition carries more symbolic weight than mechanical impact, as the stock already sits in the S&P 500 and Nasdaq 100, limiting forced fund buying from the change.

Despite Monday’s pop, Alphabet is still on pace for its worst month since February of last year, with six of the past seven weeks ending in negative territory. Investor concerns center on AI execution, with Nvidia chip stock flows drawing renewed attention across the sector as compute access tightens.
Semis and Geopolitics Drive the Broader Move
The VanEck Semiconductor ETF gained more than 3%, led by Astera Labs, KLA, and Applied Materials, which rose roughly 16%, 12%, and 11%, respectively.
Macro relief also played a role. The US and Iran agreed to pause hostilities and allow commercial vessels to transit the Strait of Hormuz freely.
Brent and West Texas Intermediate climbed slightly, as traders weighed whether the ceasefire would hold. BeInCrypto previously covered how Iran’s oil ceasefire deals move crude and downstream inflation expectations.
Whether the rally extends into a shortened week ahead of the July 4 holiday will depend on whether the Iran ceasefire holds and if semiconductor momentum carries through.
The post Dow Closes Above 52,000 for First Time as Alphabet Debuts appeared first on BeInCrypto.


U.S. spot bitcoin ETFs lost a net $231 million on Monday, with BlackRock’s IBIT accounting for $300 million of outflows that other funds partly offset, including $50 million into ARKB and $35 million into GBTC, per SoSoValue data.
The outflow lands as risk appetite elsewhere is surging. Wall Street’s technology rally spread into Asia on Tuesday, with the MSCI Asia Pacific index up 1% on the year’s final trading day after a semiconductor rebound helped the S&P 500 snap a five-session losing streak. The Asian benchmark is on track for its biggest quarterly gain in almost 17 years.
South Korea’s Kospi, which crashed 10% in a single session earlier this month, climbed 2.1% to extend its lead as the world’s best-performing major benchmark this year. Samsung is up more than 100% this quarter, and SK Hynix has gained almost 240% since April. The yen slid to its weakest level against the dollar since 1986, a sign investors are funding the AI trade by borrowing in yen.
Bitcoin ETFs are not participating in that capital rotation, however. The same AI infrastructure spending fueling record quarters in Seoul and Tokyo is the trade competing for the dollars that might otherwise flow into bitcoin, a dynamic that has run through the month’s coverage of SpaceX, Anthropic and the chip sector.

Key Highlights
- BitMine acquired 27,084 ETH in the past week, marking its fourth-smallest weekly accumulation this year, pushing total reserves to 5.7 million ETH.
- US-based spot Ethereum ETFs experienced their seventh consecutive week of net redemptions, shedding $273.3 million in the steepest weekly decline since January.
- Sharplink re-entered the market after an eight-month hiatus, acquiring 39,196 ETH valued at $62.4 million across three consecutive days.
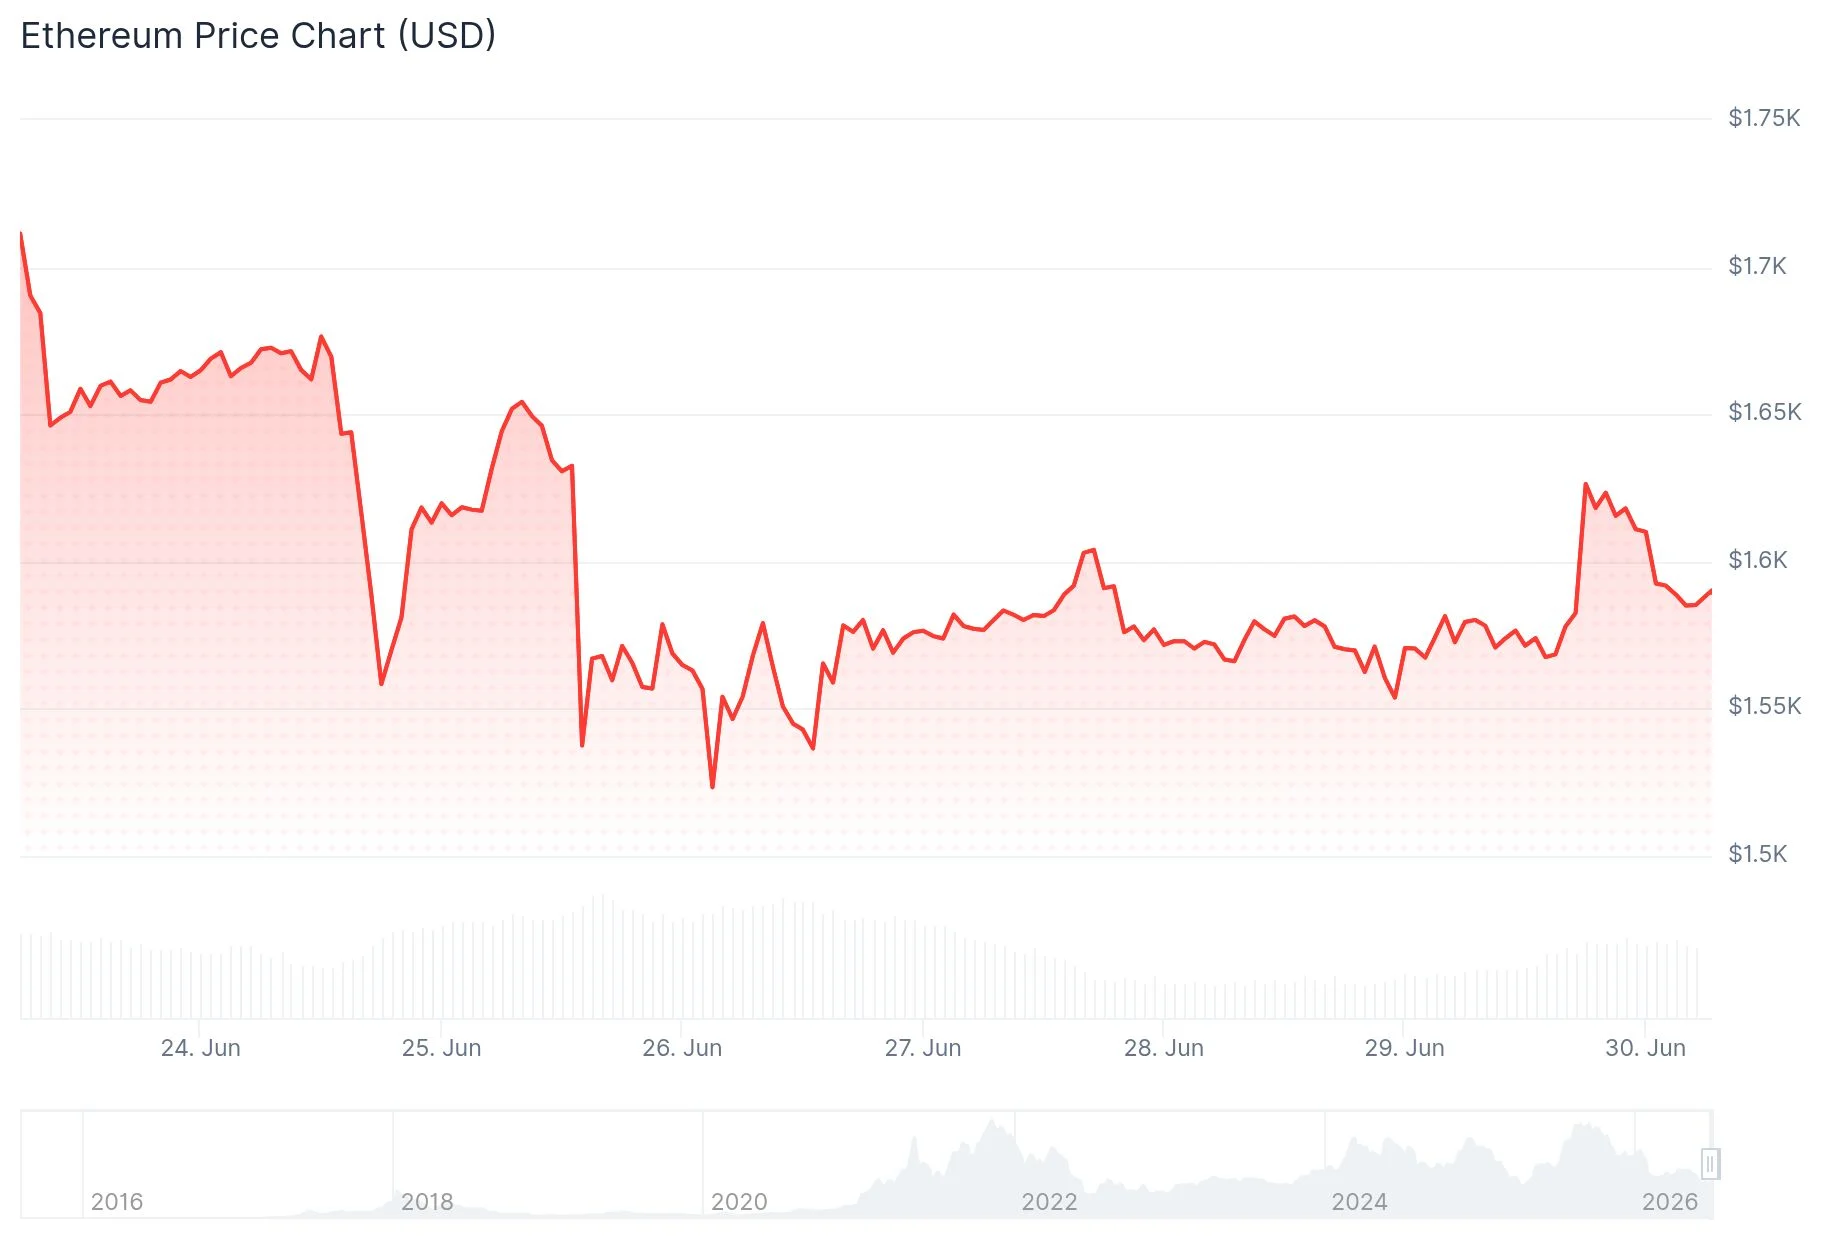
- Ethereum has declined approximately 50% year-to-date and approaches the possibility of recording three consecutive quarterly losses.
- Derivatives markets reveal $4.09 billion in short positions compared to $1.31 billion in long positions, highlighting prevailing bearish sentiment among traders.
Ethereum’s market value hovers around $1,580 as the blockchain network contends with diminishing corporate accumulation and persistent outflows from investment vehicles. The cryptocurrency has found it difficult to maintain critical price thresholds throughout June.
BitMine Immersion, holding the distinction of being the largest institutional ETH holder, acquired 27,084 ETH during the previous week. This transaction elevated the company’s aggregate holdings to 5.7 million ETH, representing approximately $9.22 billion in value. The purchase volume represents one of the company’s most modest weekly acquisitions this year.
Simultaneously, BitMine allocated 160,480 ETH to its staking infrastructure. The firm’s staked portfolio now encompasses 4.879 million ETH, producing approximately $211 million in annual staking rewards.
BitMine Chairman Thomas Lee attributed the reduced acquisition pace to end-of-quarter “window dressing” activities. He observed that market participants frequently reduce exposure to underperforming assets during quarterly closings, regardless of positive fundamental developments.
Investment Fund Redemptions Accelerate
US spot Ethereum exchange-traded funds registered their seventh straight week of negative net flows. These investment vehicles experienced redemptions totaling $273.3 million over the past week, representing the most substantial weekly decline since January, based on SoSoValue tracking data.
BlackRock’s iShares Ethereum Trust experienced the largest redemptions among ETF providers. The trend demonstrates retail and institutional fund investors reducing allocations while certain corporate treasuries maintain their accumulation strategies.
This divergence has generated an atypical market dynamic. Corporate balance sheet strategies continued adding ETH exposure while traditional fund investors redirected capital to alternative investments.
Sharplink, another prominent institutional ETH holder, re-initiated purchases following an eight-month dormant period. Blockchain analytics from Lookonchain documented the company’s acquisition of 39,196 ETH valued at $62.4 million through three separate transactions during the previous week.
Arkham Intelligence data identified the initial purchase batch through FalconX on Thursday. Sharplink executed additional transactions on Friday, complemented by substantial over-the-counter trades throughout the weekend.
As of June 21, Sharplink maintained holdings of 876,285 ETH, establishing its position as the second-largest public corporate ETH holder after BitMine. The company has not publicly addressed the rationale behind resuming its accumulation strategy.
Quarter-End Performance and Derivatives Market Positioning
Ethereum has experienced a decline approaching 50% since the beginning of January. This downturn temporarily allowed Tether’s USDt stablecoin to surpass ETH in overall market capitalization during the past week.
Cryptocurrency analyst Max Crypto highlighted in a social media post that ETH approaches the possibility of recording three consecutive quarterly losses for the first time in its history. He characterized this pattern as a structural concern extending beyond temporary price volatility, prompting market observers to monitor whether the asset can prevent a fourth consecutive negative quarter.
Derivatives market information from CW indicated that high-leverage short positions on ETH totaled $4.09 billion. Long positions registered $1.31 billion on the identical platform, suggesting that speculative traders anticipate continued downward price movement.
From a technical perspective, ETH trades beneath its 20-day, 50-day, and 100-day Exponential Moving Averages, which range between $1,670 and $2,004. The Relative Strength Index currently registers 35, while the Stochastic indicator stands at 26, both metrics indicating persistent downward momentum with minimal signals of reversal.
Market analyst Daan Crypto Trades remarked on social platform X that Ethereum has been unable to successfully recapture previous support zones. He indicated that a recovery above $1,750 would represent the initial indication of bullish strength on extended timeframes, whereas a breach below the current $1,500 support level, which has provided a floor on two prior occasions, could trigger a decline toward April 2025 price lows.
Near-term resistance levels for ETH are positioned at $1,626, followed by additional barriers at $1,670 and $1,741. Support zones are established near $1,524, with a secondary support foundation at $1,404.
Key Takeaways
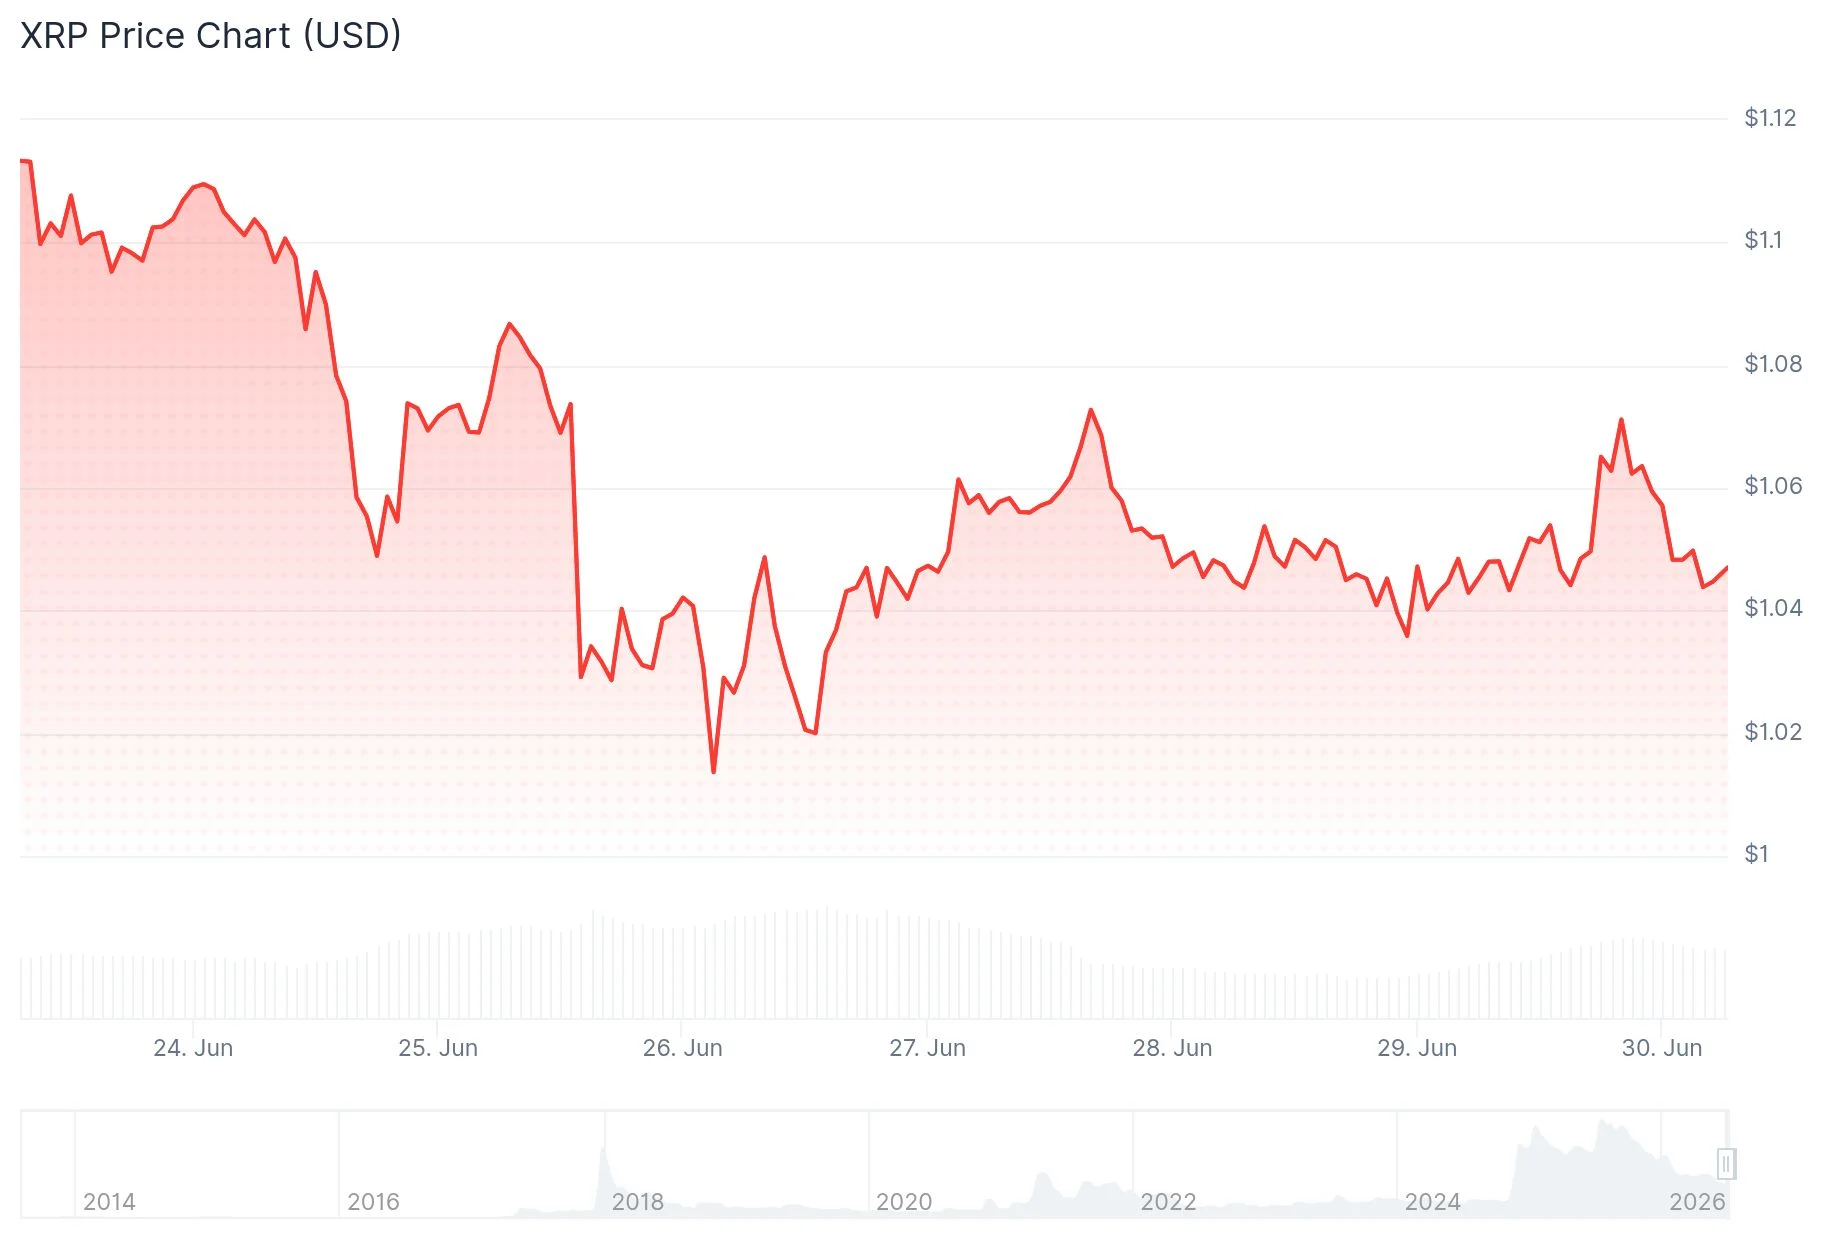
- XRP currently hovers around $1.05, maintaining stability above the critical $1 threshold following a June 25 dip to $1.01—the lowest level in 19 months.
- Tokens flowing out of exchanges increased dramatically, jumping from 40.7 million to approximately 123 million XRP within days, suggesting potential accumulation by holders.
- Spot XRP ETFs recorded their eighth consecutive week of positive inflows, bringing total cumulative inflows to approximately $1.47 billion.
- Network engagement surged with daily active addresses climbing 72% over a two-week period, moving from 23,000 to nearly 39,500.
- Derivatives open interest contracted sharply from 1.3 billion to under 150 million, indicating a significant deleveraging event.
XRP maintains its position around the $1.05 level following a challenging June performance. The digital asset touched approximately $1.01 on June 25, marking its lowest valuation in 19 months, yet purchasing pressure has successfully defended the psychologically important $1.00 threshold in subsequent trading sessions.

While price action has remained subdued, the underlying XRP Ledger has demonstrated notable vitality. The blockchain recorded 4,941 newly created wallets within a 24-hour window, representing the most significant single-day expansion in wallet creation observed over the past three months.
Concurrently, daily active addresses have experienced substantial growth. The metric expanded from approximately 23,000 on June 14 to nearly 39,500 by June 27, reflecting a 72% increase within a fortnight.
Token Movement and Institutional Capital Flow
Blockchain analytics reveal an accelerating trend of tokens being withdrawn from centralized exchanges. The exchange net position change metric shifted from roughly 40.7 million XRP on June 22 to approximately 123 million XRP several days afterward, representing an increase of nearly 200%.

Such withdrawal patterns typically indicate that holders are moving assets into self-custody rather than positioning for immediate sales. Meanwhile, institutional appetite for XRP exposure continues unabated.
Spot XRP exchange-traded funds have maintained positive net inflows for eight consecutive weeks. Total cumulative inflows now approach $1.47 billion, with an additional $22.99 million recorded during the week ending June 26.
Notably, on June 26, XRP-focused ETFs attracted $15.6 million in capital while bitcoin-based products experienced $444.5 million in withdrawals and ethereum funds recorded $12.9 million in outflows.
The derivatives market has undergone significant consolidation. Open interest across primary trading venues declined from a peak exceeding 1.3 billion to beneath 150 million, eliminating substantial speculative positioning that accumulated during XRP’s previous upward movement.
Market intelligence firm Santiment Intelligence highlighted this divergence between price weakness and growing network participation in a recent analysis. The firm observed that new wallet creation and optimistic market sentiment are materializing even as price threatens the $1 level, with sentiment analysis revealing 3.7 positive comments for each negative one—the highest ratio in three months.
Critical Technical Zones Under Observation
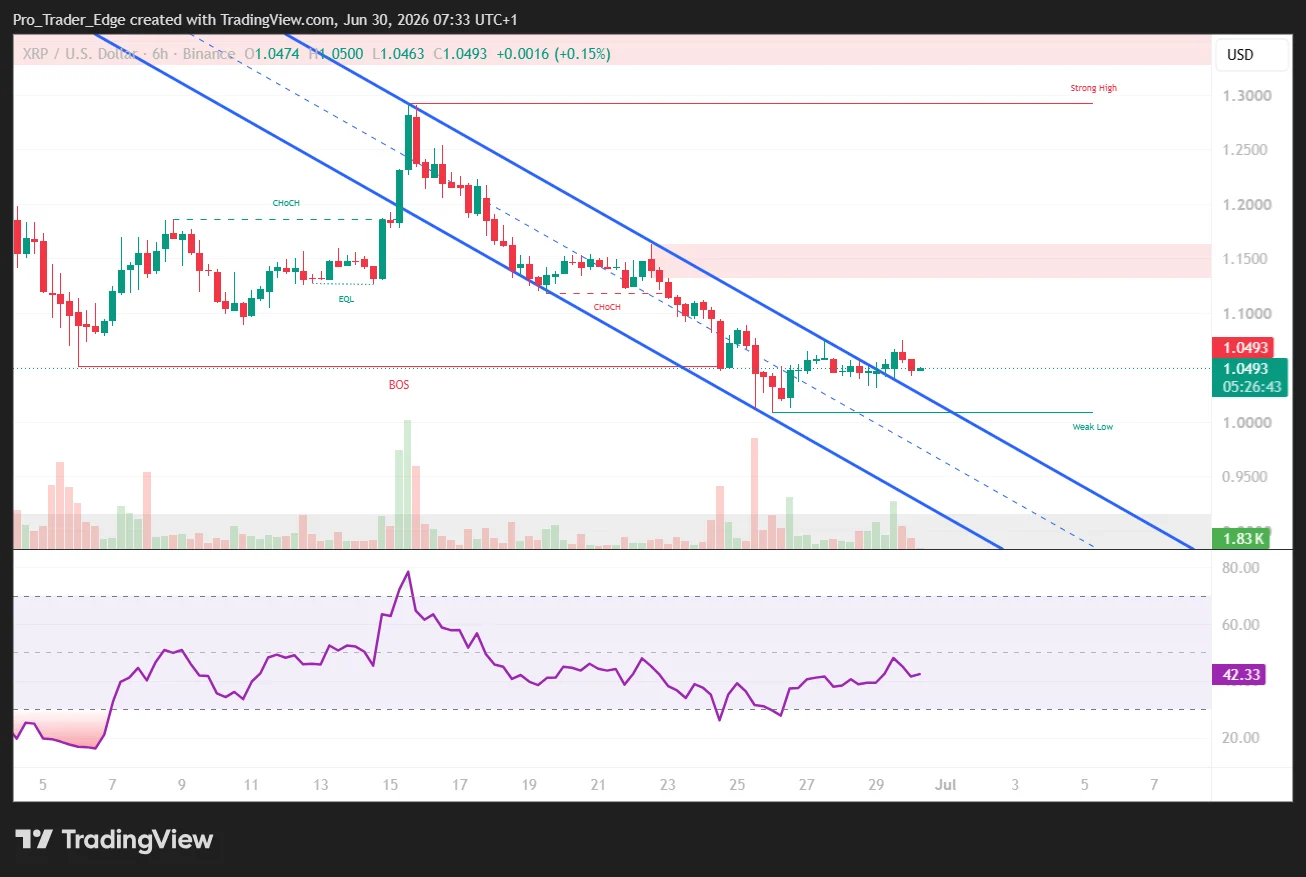
XRP has remained confined within a descending price channel throughout the past year. The 20-period exponential moving average, which tracks near-term momentum, currently aligns with the upper boundary of this channel in the $1.18 to $1.22 range.
This region also coincides with a Fibonacci retracement level at $1.178 and a concentration of approximately 22.8 million XRP in cost basis distribution between $1.18 and $1.19. An additional 27.4 million XRP are positioned between $1.21 and $1.22.
These price zones represent areas where previous purchasers may attempt to exit positions at breakeven, establishing resistance. A decisive move above $1.18 followed by $1.22 would push XRP beyond its established downtrend into more neutral technical territory.
For downside protection, immediate support is established near $1.02. A violation of this level could potentially trigger a decline toward $0.87, according to Fibonacci extension analysis.
In the near term, market participants are monitoring $1.06 as initial resistance, followed by the $1.09 to $1.10 zone where previous recovery attempts have encountered selling pressure. A sustained move above $1.20 would represent the first meaningful indication of a potential trend reversal.
The 4-hour relative strength index has recovered to 46 after entering oversold territory, though it remains below the neutral 50 threshold. Price action recently consolidated within a $1.03 to $1.06 range, with peak trading volume occurring on June 29 at 17:00 UTC when 86.5 million XRP were exchanged.


The pickup began about 18 months ago, before MiCA’s first rules took effect, she said. Stablecoin regulations began applying about a year ago, and crypto-asset service providers have been working through a transition period before the July 1, 2026, deadline. After that date, firms relying on legacy national regimes will no longer be able to provide MiCA-regulated services in the EU.
The inquiries come from entrepreneurs frustrated by bureaucracy and regulatory burdens in Europe.
“They’re not just some random guys,” she said. “They’re former founders or current founders, somebody with multiple exits, somebody with years of experience in crypto.”
The deadline is already reshaping the competitive landscape. Binance, the world’s largest cryptocurrency exchange by trading volume, withdrew its MiCA application in Greece last week and notified EU users it would suspend some services while seeking another regulatory route. The company said it remains committed to Europe.
“Our ambitions in Europe remain the same, and we are confident we will secure a MiCA licence in the coming months,” Binance said in a statement to CoinDesk on Thursday.
Rivals are trying to capitalize. OKX and Coinbase (COIN) announced bonuses of up to 8% of total deposits and transfers for new users the following day.

Bitcoin’s tie to USD/JPY is the strongest it’s been since 2022. Here’s why that matters.

Zebby Matthews fires 7 strong innings, Twins hang on to edge Astros

Making A Magnetic Core Memory USB Drive


-
 Sports7 days ago
Two goals and an assist by sheer aura: Cristiano Ronaldo just entered the World Cup chat
-

 Fashion4 days ago
Weekend Open Thread: Staud – Corporette.com
-

 Politics4 days ago
The House | Manchesterism won’t survive the painful trade-offs unless it gets citizens on board
-

 Politics4 days ago
Potential 2028er World Cup attendee leaderboard
-

 News Videos2 days ago
MAJOR BITCOIN & MARKET UPDATE!!!! (MUST WATCH ASAP!!!)
-

 Business4 days ago
Asia stock markets slide as tech shares slump
-

 Tech5 days ago
A Look At A Gaggle Of Transputer Boards
-

 Crypto World6 days ago
Securitize Wraps Roubini's SEC-Registered ETF as Dubai VARA Digital Security
-
Crypto World6 days ago
Bitcoin (BTC) Dips Below $62K, Ethereum (ETH) Plunges 6% Daily: Market Watch
-
 Crypto World5 days ago
Dell (DELL) Shares Tumble Over 5% Following Analyst Downgrade to Hold
-

 Crypto World3 days ago
Coinbase, Circle Deepen Crypto Stock Losses Despite Resilient S&P 500
-
Business6 days ago
Entergy settles forward sale agreements, raises $672 million in cash proceeds
-

 Crypto World3 days ago
Kraken's xStocks Opens Bending Spoons IPO Registration to EEA Retail
-

 Sports3 days ago
FIH Pro League: India defeat Pakistan 7-1, register biggest win of campaign | Other Sports News
-

 Tech2 days ago
Bluekit phishing kit adopts browser-in-the-middle for login theft
-
 Crypto World4 days ago
Bitcoin Sparks $600M Hourly Liquidations With $65,000 Set To Become Resistance
-

 Tech3 days ago
Russian hackers now target Signal backup recovery keys
-
 Crypto World4 days ago
Hyperliquid Named on Singapore MAS Investor Alert Register
-

 Crypto World4 days ago
RTX holders must register wallets before token distribution begins
-

 Crypto World5 days ago
Ripple and SBI launch RLUSD in Japan after JFSA approval
You must be logged in to post a comment Login