

Crypto World
The Black Bull (ANSEM) price prediction 2026

A Pump.fun token airdropped to a famous trader’s wallet is up tens of thousands of percent in days. Here is the honest version: this is a high-risk memecoin with no product, and most tokens like it go to zero.
Summary
- The Black Bull (ANSEM) is a Solana memecoin launched on Pump.fun in mid-June 2026, trading near $0.13 with a market cap around $56 million after a move of roughly 26,000% in a week.
- The token was not created by the trader it is named after. An anonymous developer airdropped a large share of the supply to the wallet of Ansem, a well-known Solana influencer, who later embraced it rather than launching his own coin.
- There is no product, roadmap, team, or revenue behind the token. Its price is driven entirely by attention, one influencer’s involvement, and speculative trading, which makes it a casino bet, not an investment.
- On-chain analysis tools have flagged manipulation risk and heavy holder concentration; liquidity is thin relative to the market cap, and the trader associated with it has faced market-manipulation allegations.
- Third-party forecasts that exist for ANSEM are wide and speculative, spanning roughly $0.03 to $0.25, and the most realistic base case for any token of this type is a sharp drawdown, with a real chance of going to near zero.
Before anything else, the blunt version. The Black Bull, traded under the ticker ANSEM, is a memecoin. It has no underlying business, no cash flows, and no roadmap that would anchor a valuation. Its price exists because a famous trader is associated with it and the internet is paying attention.
Tokens like this can produce life-changing gains and total losses inside the same week, and the overwhelming majority of Pump.fun launches lose nearly all their value, many within a single day. Any “price prediction” for an asset like this is closer to handicapping a roulette spin than forecasting a company. Read the rest with that frame fixed in place.
This piece explains what The Black Bull actually is, the numbers behind its move, why it is a casino rather than an investment, the bull thesis stated fairly, the specific ways it could go to zero, what the few forecasters tracking it say, and then bull, base, and bear scenarios. It closes with a short FAQ.
What The Black Bull (ANSEM) actually is
The Black Bull is a Solana token launched on Pump.fun, the memecoin launchpad, around June 16 to 17, 2026, with the on-chain contract address ending in “pump” as Pump.fun tokens do. The story that gave it life is specific. An anonymous developer created the token and airdropped a large portion of the supply, by some accounts around 65%, directly to the wallet of Ansem, a prominent Solana trader and influencer also known by the handle blknoiz06, whose real name is Zion Thomas. Ansem is one of the best-known memecoin personalities on Solana, with roughly a million followers and a reputation as an early caller of tokens like WIF and BONK.
Crucially, Ansem did not create the token, and it is not officially his project. The developer essentially bet that putting the supply in a famous wallet would manufacture attention. It worked. Rather than dump the airdrop or launch a competing coin of his own, Ansem leaned in, reportedly pledging to airdrop creator fees back to holders instead of cashing out, and his wallet holds a very large position, on the order of 600 million tokens that at points represented the bulk of his visible on-chain portfolio. That alignment, a recognizable figure with skin in the game, is the entire bull narrative. It is also the entire risk, because the token’s fate is tethered to one person’s continued involvement.
The numbers behind the move
As of late June 2026, ANSEM trades near $0.13, having reached a peak around $0.14 on June 29. The 7-day move was roughly 26,000%, the kind of figure that only appears in freshly launched memecoins coming off a near-zero base. The market cap sits around $56 million, with roughly 410 million of a 1 billion total supply in circulation, implying a fully diluted valuation closer to $136 million. The token ranks somewhere around #374 by market cap, and daily trading volume has run between roughly $60 million and $94 million, which against a $56 million cap produces a volume-to-market-cap ratio above 2.
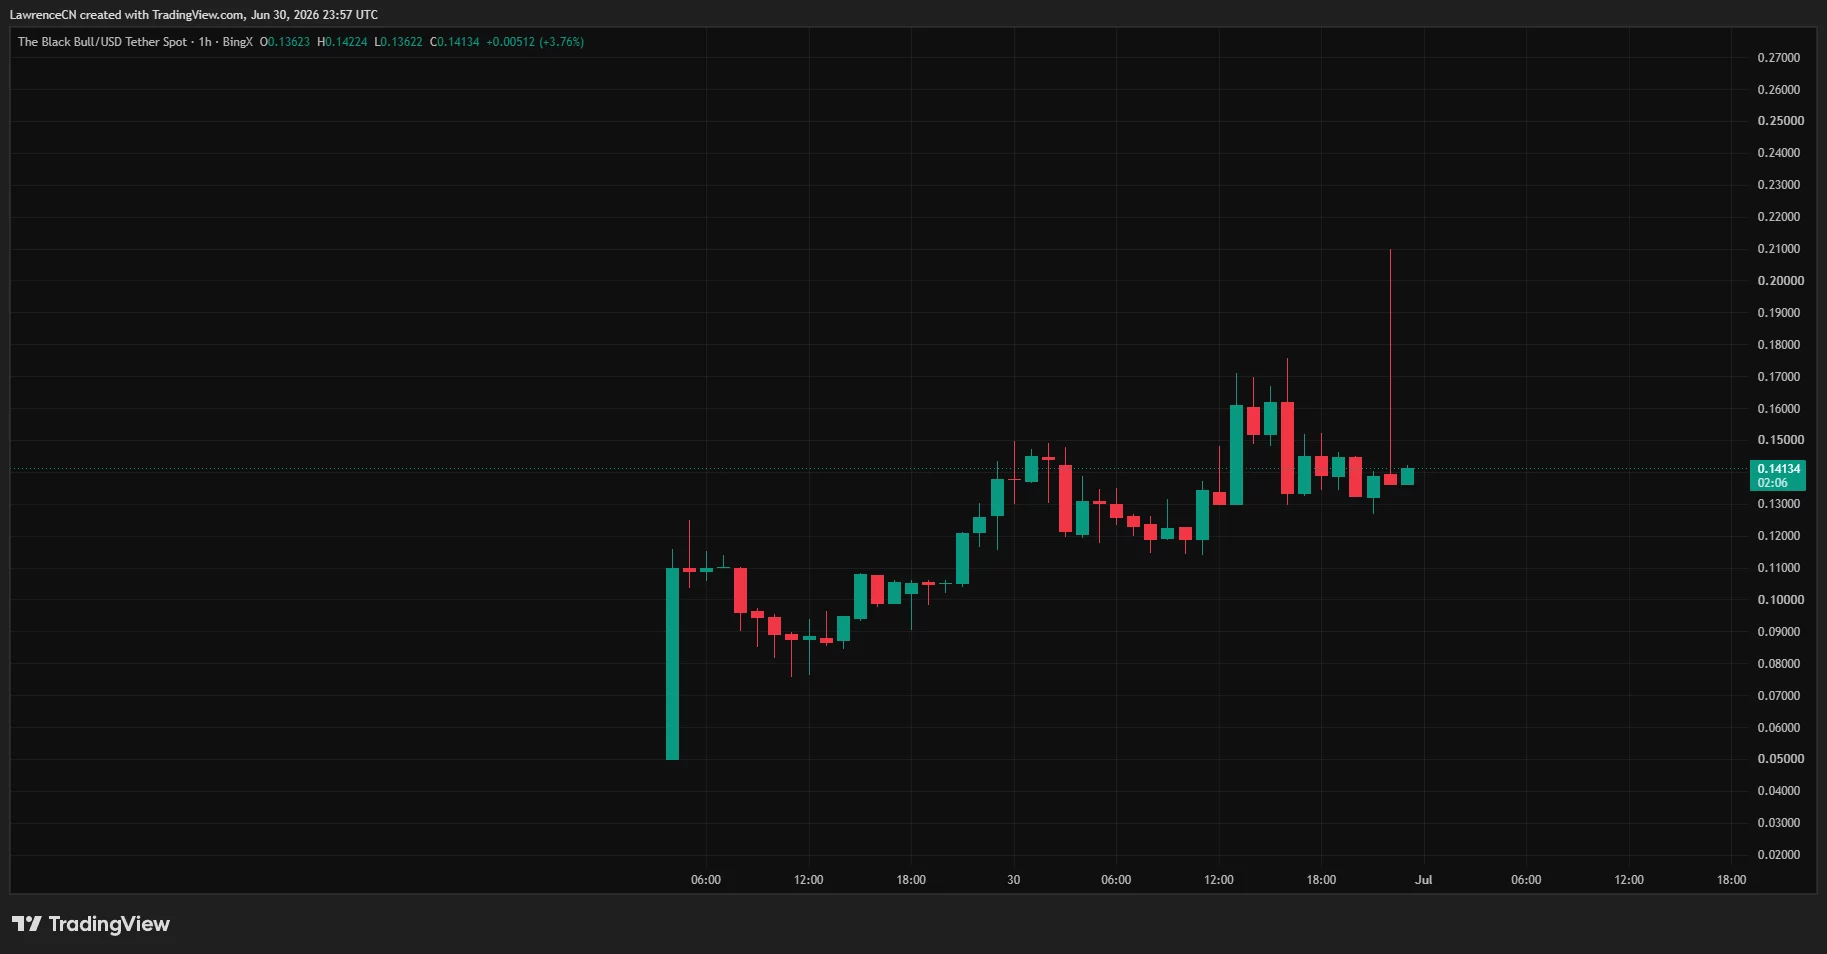
That ratio is itself a warning light: it means the token turns over its entire value more than twice a day, the signature of frantic speculative churn rather than steady holding. ANSEM trades across venues including PumpSwap and Meteora on Solana, with perpetual futures listed on some offshore exchanges such as MEXC and others, and it has appeared as a verified token on Solana interfaces like Jupiter and Phantom. The presence of leveraged perps on a token this young amplifies the volatility in both directions, because liquidations can cascade fast when the price moves.
These numbers describe a token in the most volatile possible phase of its life. The percentage gains are real, and so is the fragility underneath them.
Why this is a casino, not an investment
This section is the heart of the piece, and it is deliberately heavier than the bull case, because the risks here are not footnotes. They are the main event.
First, there is nothing to value. ANSEM has no product, no revenue, no roadmap, and no team in the conventional sense. There is no cash flow to discount, no user base to grow, no utility that creates demand for the token beyond speculation. Its price is a pure function of attention and belief, both of which can evaporate without warning.
Second, on-chain analysis has flagged it. Token-screening tools such as Rugcheck have raised manipulation warnings tied to supply concentration in wallets that are not clearly identified. Heavy concentration means a small number of holders could move the price violently or exit into the liquidity that retail buyers provide. Thin liquidity relative to the market cap compounds this: when real liquidity is shallow, a few large sells can collapse the price far faster than the order book suggests.
Third, the person at the center carries his own controversy. The trader associated with the token has faced market-manipulation allegations in the broader memecoin context, which adds reputational and regulatory risk to an asset whose entire thesis rests on his involvement. If he steps back, sells, or is forced to distance himself, the narrative that supports the price can vanish.
Fourth, the base rate is brutal. The large majority of Pump.fun memecoins lose almost all their value, frequently within hours or days of launch. Survivorship bias makes the winners loud and the thousands of dead tokens silent. Treating ANSEM as likely to be one of the rare survivors, instead of one of the many that fade, is the single most common and most expensive mistake buyers of tokens like this make.
Put together, these are not reasons to never touch a memecoin. They are reasons to size any exposure as money one is fully prepared to lose, and to never confuse a fast chart with a sound investment.
The bull thesis, stated fairly
For balance, the case the buyers make deserves a fair hearing, even inside a risk-first frame. The bull argument has 3 legs. The first is reach: Ansem commands a large, engaged audience, and in memecoins, attention is the scarce resource that drives price. A token he is actively associated with has a built-in distribution advantage that most launches never get.
The second is alignment. By reportedly pledging to route creator fees back to holders instead of launching a separate token to cash in, Ansem signaled that his incentives point in the same direction as the people holding the coin, at least for now. In a category defined by developers dumping on their communities, an influencer choosing to share fees is a comparatively constructive signal.
The third is the Solana memecoin meta itself. Solana has repeatedly produced memecoins that ran far longer and higher than skeptics expected, and the ecosystem’s culture, low fees, and fast launches keep the speculative engine fed. In a market where attention rotates quickly, a token with a recognizable face and an active community can sustain a narrative longer than a faceless launch.
None of this changes the absence of fundamentals. The bull case is a bet that attention and alignment persist long enough to matter, which is a real but fragile proposition.
What could make it go to zero
The bear mechanics are concrete and worth naming, because they are the most probable outcome for tokens of this kind. Concentration is the first: if large holders, identified or not, decide to sell into the thin liquidity, the price can fall faster than buyers can react, and early entrants exit at the expense of late ones. Liquidity withdrawal is the second: if liquidity providers pull their positions, the token can become nearly untradeable at anything close to the quoted price.
Narrative death is the third and most likely slow killer. Memecoins live on attention, and attention is finite. When the crowd rotates to the next launch, volume dries up, the chart bleeds, and the token drifts toward irrelevance even without a dramatic crash. Copycats accelerate this, as the inevitable wave of imitation tokens splits the speculative capital and dilutes the original’s mindshare. Finally, the single-person dependency is the acute risk: if Ansem sells, goes quiet, or is forced to distance himself for legal or reputational reasons, the one pillar holding up the price is removed, and there is nothing fundamental left to catch it.
Any one of these can take a token like this down by 80% or more in short order, and several can combine. This is not a tail risk for ANSEM. It is the central scenario that any honest forecast has to treat as the base case.
What forecasters say
A handful of exchange-affiliated outlets have published speculative ANSEM ranges, and they should be read as guesses about a chaotic asset, not as analysis grounded in fundamentals, because there are no fundamentals to ground them in. These are 3rd-party figures, not endorsements.
Some short-term models from venues such as WEEX have sketched a near-term base band roughly between $0.085 and $0.135, a momentum upside toward $0.15 to $0.18 if attention holds, and a downside toward $0.06 to $0.075 if it fades. Broader 2026 ranges floated by outlets including BTCC and WEEX span roughly $0.03 to $0.25. The width of these ranges, a possible multiple up or a collapse of more than half, is the most honest thing about them: it concedes that the outcome is dominated by reflexive sentiment, not by anything that can be modeled. For an asset like this, the error bars are the message.
The pattern this fits: influencer memecoins before ANSEM
The Black Bull is not the first token to run on a famous name, and the history of the pattern is the most useful guide to its likely path. Solana has produced a long line of influencer-linked and celebrity memecoins, some tied to the same callers who built reputations on early WIF and BONK trades. The recurring shape is familiar: a token attaches itself to a recognizable figure, attention floods in, the price goes parabolic on a near-zero base, and a wave of buyers arrives late expecting the early gains to repeat. What happens next sorts almost entirely on whether attention and the figure’s involvement persist.
The brutal majority outcome is decay. Most of these tokens fade within days or weeks as the crowd rotates to the next launch, leaving holders who bought the peak deeply underwater. A small number sustain a community and trade sideways at a fraction of their high for longer. A rare few extend into something more durable, and those are the cases the next round of buyers remembers, which is exactly how survivorship bias keeps the cycle turning. The honest framing is that ANSEM is drawing from the same deck, and the base rates for that deck are unforgiving.
What makes The Black Bull slightly different from a faceless launch is the creator-fee airdrop dynamic, which gives the central figure a reason to stay engaged instead of dumping immediately. That can extend the attention window. It does not change the category math.
An influencer can prolong a memecoin’s life, but no influencer has reliably prevented the eventual reversion that defines the type. Treating ANSEM as exempt from that pattern, because this time the figure seems aligned, is the precise belief that has separated late buyers from their money in every prior cycle.
If you choose to speculate anyway
This is not a recommendation to buy ANSEM or any memecoin. But because people will trade tokens like this regardless of warnings, the harm-reduction principles that disciplined speculators apply are worth stating plainly, since they are the difference between a survivable loss and a damaging one.
The first principle is sizing. Money committed to an asset like this should be money one can lose in full without affecting rent, savings, or obligations, because total loss is a realistic outcome, not a worst case. The second is that the position should be treated as already gone the moment it is opened, which removes the emotional pressure that leads people to average down into a falling token or chase it higher. The third is that taking profits on the way up is the only way speculative gains become real; a paper gain in a token with thin liquidity is not a realized gain until it is sold, and the same shallow liquidity that let the price spike can prevent an exit at the quoted price on the way down.
The fourth principle is to distrust leverage entirely here. The presence of perpetual futures on a token this young and this volatile is a fast path to liquidation, because the swings that make memecoins exciting also trigger margin calls in minutes.
The fifth is to verify instead of assume: checking the contract, the liquidity, and the holder concentration before committing, instead of trusting a chart or a name. None of this makes a memecoin a sound investment. It makes the gamble less likely to cause real damage, which is the most honest advice anyone can give about an asset with no fundamentals.
Bull, base, and bear scenarios for ANSEM
These scenarios are illustrative and speculative. For a memecoin with no fundamentals, they describe possible paths driven by attention and holder behavior, not valuations. The bear case is weighted as the most probable, consistent with how tokens of this type typically resolve.
Bull case
In the bull scenario, Ansem stays actively involved, the creator-fee airdrops keep holders engaged, and the Solana memecoin meta stays hot enough to keep attention flowing. Volume holds, new buyers keep arriving faster than early holders exit, and the token sustains or extends its level, pushing toward the upper speculative bands near $0.15 to $0.25 that the most optimistic 3rd-party ranges describe. This case requires attention to persist, concentration not to unwind, and no reputational or regulatory shock to the figure at its center. It is possible, and in memecoins it does happen, but it is the minority outcome.
Base case
In the base scenario, the initial frenzy cools as it almost always does. Volume fades from its launch peak, the chart gives back a large portion of the parabolic move, and the token settles into a lower, choppier range, perhaps the $0.06 to $0.13 zone, while it searches for whether a durable community remains after the hype. From there it either grinds out a smaller, attention-dependent existence or slowly bleeds lower as the crowd moves on. Even this “survives but deflates” path involves a substantial drawdown from the peak for anyone who bought the top.
Bear case
In the bear scenario, which is the most likely for a token of this kind, the attention rotates away, concentration unwinds into thin liquidity, or the single-person narrative breaks. The price falls 80% or more from its highs and continues toward near zero as volume disappears, joining the large majority of Pump.fun launches that do not survive. A liquidity pull, a large holder exit, a wave of copycats, or the central figure stepping back are each sufficient to trigger this, and they often compound. Anyone holding into this scenario should expect to lose most or all of the position.
Frequently Asked Questions
Did Ansem create The Black Bull token?
No. The token was created by an anonymous developer who airdropped a large share of the supply to Ansem’s wallet to attract attention. Ansem, the Solana trader also known as blknoiz06, did not launch it, and it is not officially his project. He later embraced it and reportedly pledged to share creator fees with holders, but the origin was a 3rd party using his name and wallet.
Why has ANSEM risen so much?
The move, roughly 26,000% in a week, reflects a freshly launched memecoin coming off a near-zero base combined with the attention of a well-known influencer. There is no product or revenue driving it. The price is a function of speculation, social momentum, and one person’s involvement, which is exactly why it can reverse just as violently.
Is The Black Bull a safe investment?
No. It is a high-risk memecoin with no fundamentals, flagged manipulation and concentration risk, thin liquidity, and a price dependent on a single person’s involvement. The large majority of tokens like it lose nearly all their value. It should be treated as a speculative gamble with money one is fully prepared to lose entirely, not as an investment.
What are the biggest risks?
The biggest risks are holder concentration selling into thin liquidity, liquidity providers withdrawing, attention rotating away and the narrative dying, copycat tokens splitting interest, and the central figure selling or stepping back for legal or reputational reasons. Any one can cause an 80%-plus decline, and they often combine.
What price targets do forecasters give?
Speculative 3rd-party ranges from exchange-affiliated outlets span roughly $0.03 to $0.25 for 2026, with short-term bands near $0.06 to $0.18. These are guesses about a chaotic, sentiment-driven asset, not fundamentals-based analysis. The wide ranges reflect that the outcome cannot be modeled with any confidence.
What is the most likely outcome?
For a memecoin of this type, the most likely outcome is a sharp drawdown from the peak, with a meaningful chance of trending toward near zero as attention fades. A minority of such tokens sustain a smaller community-driven existence, and a rare few extend higher. Betting on the rare outcome is the most common and costly mistake.
Disclaimer: This article is for information purposes only and does not constitute financial, investment, or trading advice. Memecoins are extremely high-risk, speculative assets with no underlying value, and most lose nearly all of their value. Prices are highly volatile, and the figures here, accurate as of June 30, 2026, will change rapidly. Nothing here is a recommendation to buy or sell any asset. Never invest more than you can afford to lose entirely, and consider consulting a licensed professional before making financial decisions.

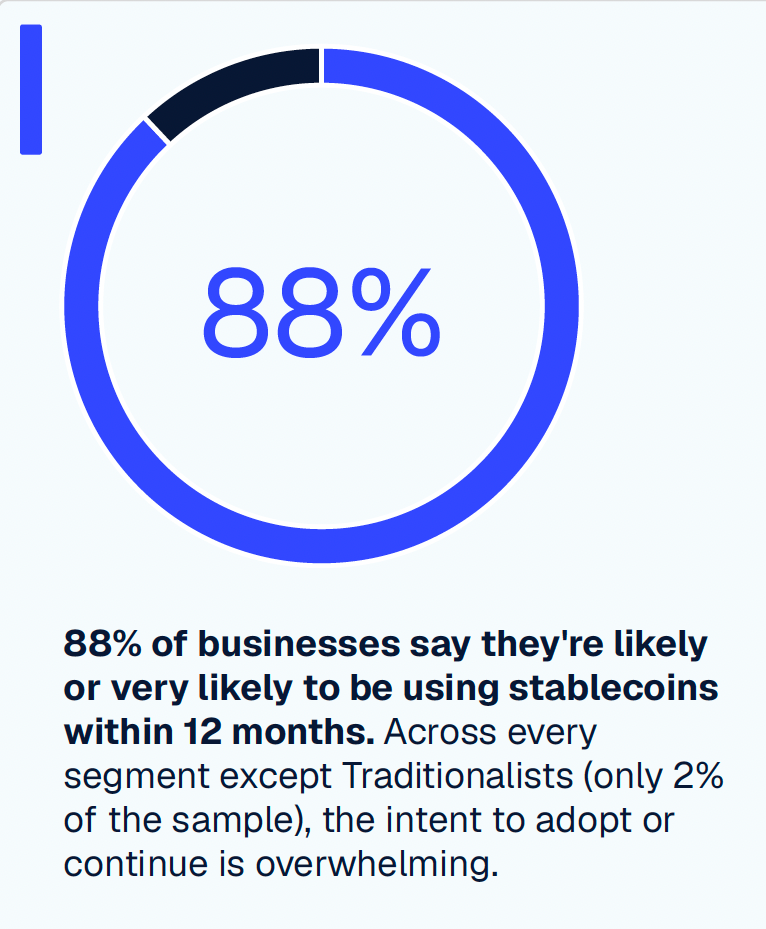
Business use of stablecoins is poised to surge in the next 12 months as adoption of the digital currency goes mainstream, according to a new report from payments infrastructure firm Cybrid.
The report found 42% of businesses surveyed are already using stablecoins for cross-border payments and 88% of respondents said they are likely or very likely to use stablecoins within the next 12 months. Still, only 2% identified as committed users of traditional payment rails.
Businesses using stablecoins reported average cross-border payment cost savings of 35%, with companies processing more than $100 million in monthly payment volume reporting average savings of up to 47%, according to the survey.

Source: Cybrid report
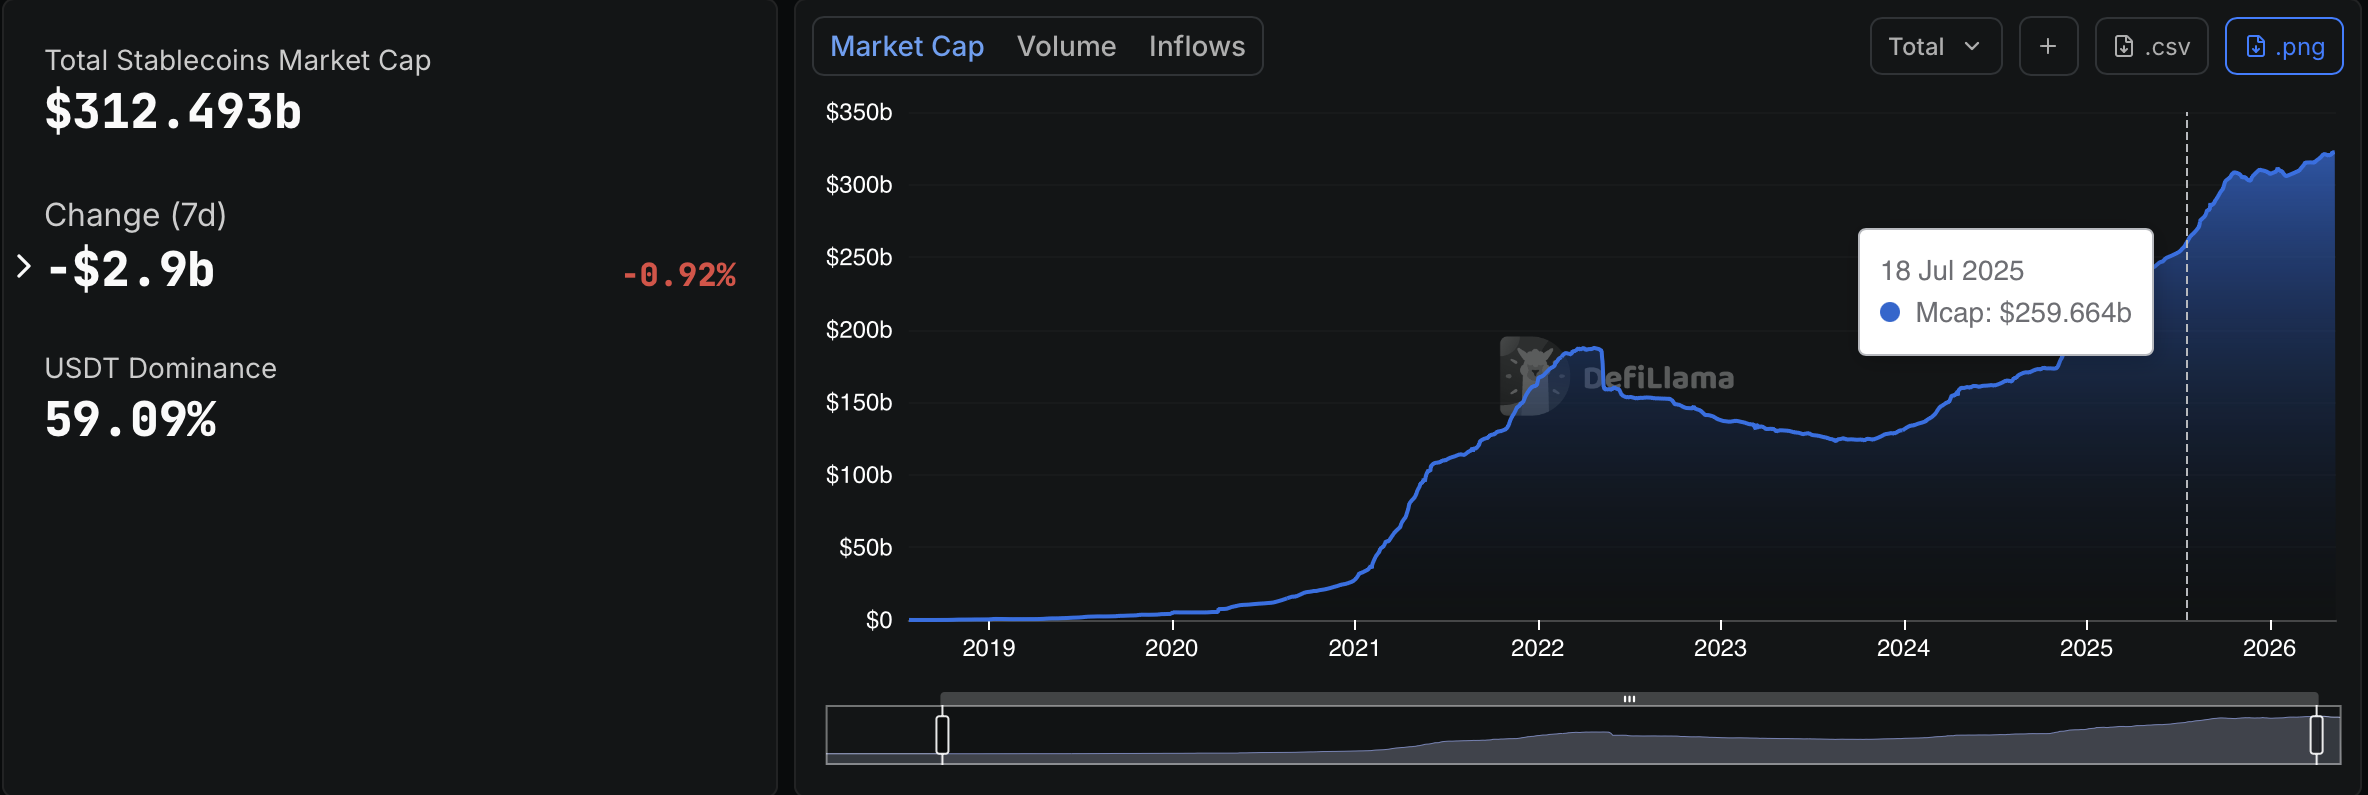
The global stablecoin market cap is now at $307.64 billion, led by Tether’s USDT, at $184.7 billion, and Circle’s USDC, at $73.51 billion, Coingecko data shows. Fueled by recent legislation, GENIUS Act-compliant stablecoins have reached a market cap of more than $76 billion. That established the first federal regulatory framework for payment stablecoins in the United States.
The report is based on a survey of 468 executives and business leaders conducted between April 28 and May 4.
Varied users look for regulatory clarity to gain confidence
Payroll and contractor payments were the most common stablecoin use case among respondents, followed by supplier payments, customer payments, investment and yield generation, vendor payments, and treasury and liquidity management.
Regulatory clarity was also a top factor respondents said would increase their confidence in expanding stablecoin use, with 71% identifying it as more important than trusted infrastructure providers or integration with existing systems.
Respondents came from the technology, financial services and ecommerce sectors in the United States, Canada and the United Kingdom, including C-suite executives, finance and treasury managers, and payments and operations leaders.
Related: Breez launches Bitcoin-to-stablecoin payments across more than 30 blockchains
Companies expand infrastructure for stablecoin payments
Separate industry data points to the same trend. In June, payments infrastructure provider Paybis said business customers accounted for nearly 98% of stablecoin payout volume processed through its platform during the first four months of 2026, up from 36% in 2023.
Paybis also cited McKinsey research estimating that business-to-business transactions accounted for roughly 60% of the $390 billion in global stablecoin payment volume recorded in 2025.
Companies have continued expanding infrastructure to support growing business demand. In May, Falcon Finance debuted the dollar-backed stablecoin fUSD through Anchorage Digital Bank’s federally regulated issuance platform, targeting institutional trading, collateral and treasury workflows.
On Monday, BNY expanded its digital asset custody platform to support Circle’s USDC, allowing institutional clients to store, transfer, mint and redeem the stablecoin directly through the bank.
Source: DefiLlama
Magazine: AI is banking the unbanked in Africa… faster than crypto

US President Donald Trump’s cryptocurrency ventures generated more income for him in 2025 than real estate or resort businesses, according to his latest financial disclosures.
Donald Trump’s annual financial disclosure report was released by the US Office of Government Ethics on Tuesday, revealing more than $1.4 billion in income from crypto-related ventures last year.
The filings show Trump has profited substantially from an industry that he’s simultaneously regulating, which critics say creates a conflict of interest. In 2025, his administration pushed pro-crypto policy, a friendlier regulatory environment and executive orders favorable to digital assets, while his family’s ventures generated vast income as crypto markets surged to an all-time high.
In a statement to the media, White House Deputy Press Secretary Anna Kelly said Trump had “proudly made the United States the crypto capital of the world.”
“Neither the President nor his family has ever engaged – or will ever engage – in conflicts of interest,” she added.
Memecoins and WLFI top earners
According to the 927-page disclosure, the licensing and sale of memecoins such as Trump Coin (TRUMP) generated the most income for Trump, with about $635 million coming from “royalties” in a “license agreement with Celebration Coins.”
Meanwhile, the Trump family’s DeFi platform, World Liberty Financial, was the second-biggest earner, generating about $588 million from “proceeds from token sales.”
The disclosure also revealed that Trump earned $197 million from selling equity in a stablecoin venture.
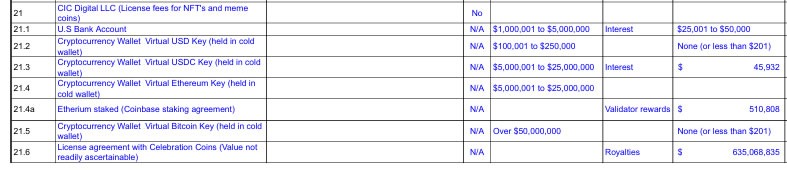
Trump’s memecoin income disclosures. Source: US OGE
This combined crypto income dwarfs the second category, real estate and resorts, with the president reporting more than $290 million in income related to revenue from his Mar-a-Lago Club in Palm Beach, Florida, and various golf clubs and resorts he owns.
Public Citizen calls for action
The Trump Organization said in a statement that “the breadth and depth of this filing further underscores our commitment to transparency,” according to Reuters.
“At nearly 1,000 pages, it represents one of the most comprehensive financial disclosure reports ever submitted and demonstrates a level of financial transparency unmatched in presidential history.”
Related: Donald Trump has 10 days to decide on housing bill with CBDC ban
Public Citizen, a nonprofit consumer advocacy group, called it an “obscene crypto grift” in a statement on Tuesday,
“Trump’s personal profit interest has now aligned him with the crypto industry, paving the way for dangerous legislation that will facilitate mass rip-offs and even threaten financial system stability,” said Public Citizen co-president Robert Weissman as he called on Congress to take action.
Magazine: Bitcoin slides to $58K, XRP hits $1 but onchain data promising: Market Moves
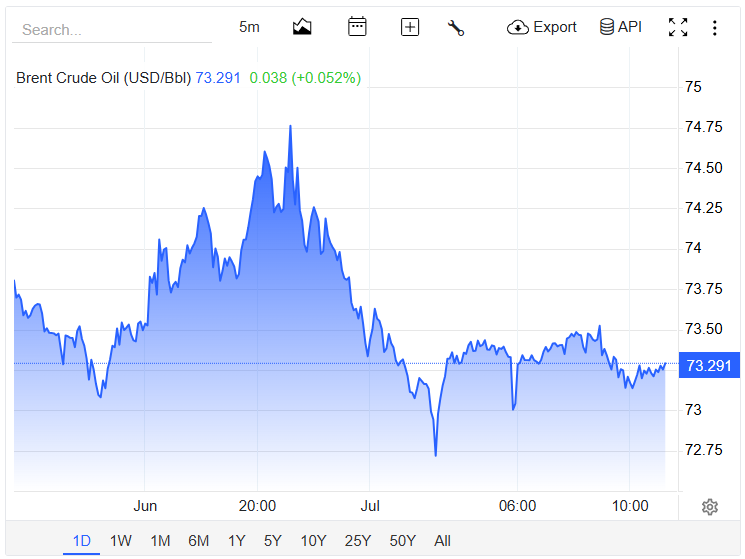
Iran refused to meet US envoys Jared Kushner and Steve Witkoff in Doha on Tuesday June 30. Oil prices rose as ceasefire hopes dimmed in the ongoing war.
Qatar’s prime minister met the Americans in Doha instead of Iranian officials. Iran’s Foreign Ministry said Hormuz mine clearance falls under June’s memorandum of understanding (MoU) and needs no outside help, according to Al Jazeera.
Why Tehran Is Staying Away From Doha
Alex Vatanka, a senior fellow at the Middle East Institute, said Iran’s foreign minister, Abbas Araghchi, and speaker Mohammad Bagher Ghalibaf fear a Doha visit could backfire at home. Both officials want visible progress on the MoU signed June 17 first.
“In Tehran they’re asking where’s the action on the MoU? Why are Iranian assets still frozen? Why is Israel still in Lebanon?”
— Alex Vatanka, Al Jazeera
Ghalibaf said Tehran will not negotiate a final deal until Washington meets every MoU condition. Those conditions include unfreezing Iranian funds and ending hostilities in Lebanon. Iran signed the memorandum on June 17, but says Washington has not met these terms yet.
Oil Climbs as Hormuz Risk Lingers
Brent crude peaked at $74.75 a barrel on Tuesday before settling to $73.29 early on Wednesday as traders keep close tabs on Iran’s dealings with the US envoys. Brent had briefly dipped after supertankers resumed Hormuz transit last week.

Vice President JD Vance said tanker traffic through the strait has reached pre-war levels. He also said Iran will not collect tolls from ships passing through Hormuz.
“This is not going to end in a place where the Iranians are collecting tolls on ships going through the Strait of Hormuz.”
— JD Vance, Reuters
US crude inventories fell 6.1 million barrels last week. The International Energy Agency warned in May that global markets would stay undersupplied through the third quarter of 2026.
Brent lost about $45 a barrel between the first and second quarters, its steepest quarterly drop since 2008. WTI fell around $31 in the same period, its biggest drop since 2020. Both benchmarks reversed course as the war de-escalated, pulling back from gains triggered by earlier Iran strikes.
The post Iran Snubs US Envoys in Doha, Dimming Ceasefire Hopes as Oil Rises appeared first on BeInCrypto.
Hollywood director Carl Rinsch has been sentenced to two and a half years in prison for defrauding Netflix out of $11 million, which he spent on crypto, stocks and luxury goods.
A Manhattan federal court on Monday sentenced Rinsch, known for directing the 2013 film “47 Ronin,” starring Keanu Reeves, to 30 months in prison after he was convicted in December on charges including fraud and money laundering.
“Rinsch orchestrated a scheme to steal millions by seeking $11 million from a subscription streaming service, falsely claiming that money would be used to finance a television show that he was creating,” Manhattan US Attorney Jay Clayton said in a statement Monday.
“Instead of using the money to make the show, Rinsch made risky bets on highly speculative stock options and cryptocurrency, and spent millions of dollars on luxury goods for himself,” Clayton added. “Today’s sentence sends a deterrent message: fraud will not be tolerated.”
Rinsch’s sentence was far below the maximum possible prison time of 90 years he was facing for his seven total charges, to which he pleaded not guilty. His defense also argued that he suffered from mental health issues.
The sentence brings to a close a 15-month saga after Rinsch was arrested in March 2025 for defrauding what prosecutors referred to in court documents as “Streaming Company-1,” which multiple reports have identified as Netflix.

Source: US Attorney SDNY
Rinsch makes $27 million on Dogecoin bet
According to a March 2025 indictment and a November 2023 New York Times report on a confidential arbitration proceeding between Netflix and Rinsch, the company initially gave Rinsch $44 million for his sci-fi show “White Horse,” later renamed “Conquest,” but he asked for more funds to finish the show, prompting Netflix to wire an additional $11 million in March 2020.
Rinsch used $10.5 million from the fresh funding to gamble on the stock market and quickly lost about half of it in a few weeks by trading options on pharmaceutical companies and the S&P 500.
Rinsch transferred more than $4 million in remaining funds to crypto exchange Kraken and went all in on the memecoin Dogecoin (DOGE), a bet that ultimately generated around $27 million when he liquidated in May 2021, according to an account statement seen by The Times.

Carl Rinsch giving an interview in 2013 for his feature directorial debut film 47 Ronin. Source: YouTube
With the DOGE winnings, Rinsch then spent about $10 million on personal expenses and luxury goods, including $1.8 million on credit card bills, $1 million on lawyers to sue Netflix, $3.8 million on furniture and antiques, $2.4 million on five Rolls-Royces and a Ferrari, and $652,000 on watches and clothes, according to the indictment.
Related: Onchain, in court: What happened in crypto legal news this week
Rinsch never finished the show or returned the funds Netflix provided to complete it.
Prosecutors asked for five years
Rinsch was convicted of one count each of wire fraud and money laundering, each carrying a maximum sentence of 20 years in prison, along with five counts of making monetary transactions in property derived from unlawful activity, each carrying a maximum of 10 years.
Prosecutors asked the court in a mid-June sentencing memo to give Rinsch five years in prison after he argued for a sentence without prison time.
Rinsch’s defense said he suffered from mental health issues, with friends and family members writing to the court to say that his behavior changed around the time of the offenses. Keanu Reeves also wrote to the court in support of Rinsch.
In addition to his two-and-a-half-year prison term, Rinsch was sentenced to three years of supervised release, $11 million in forfeiture and $700 in mandatory special assessments.
Magazine: China’s 107 Bitcoin memory thief, Bithumb CEO booked: Asia Express
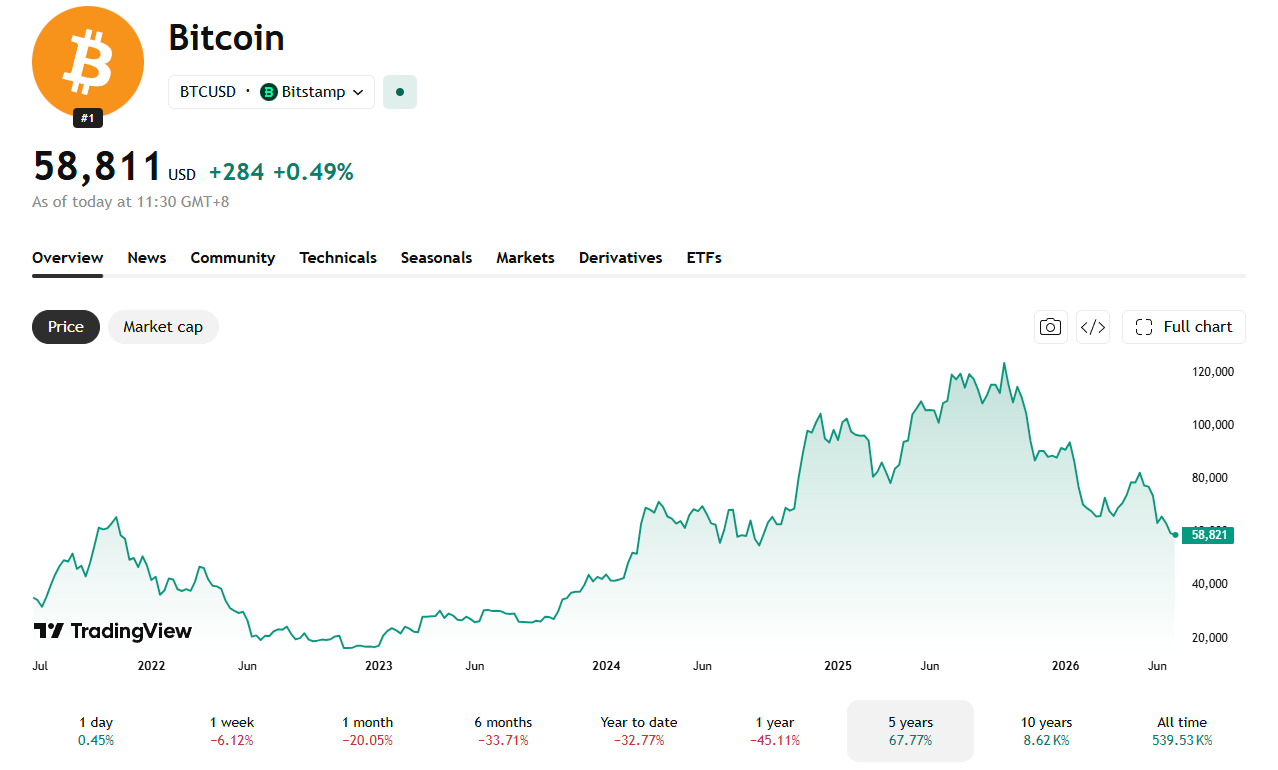
A $1,000 bet on the S&P 500 in July 2021 now beats the same bet on Bitcoin (BTC). Stocks won even though Bitcoin took the wilder ride.
Many proponents of Bitcoin have pointed to the digital’s asset’s performance against traditional investment vehicles over the years. However, with Bitcoin now way below 50% of its all time high, more steady investments are overtaking.
The Numbers
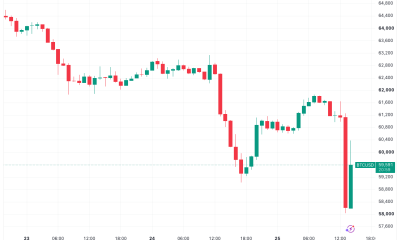
Bitcoin closed at $35,171 on July 1, 2021. It sits at around at $58,811 as of writing. That marks a gain of about 68%.

The S&P 500 closed at 4,319.94 on July 1, 2021. It closed at 7,499.36 on June 30, 2026. That marks a gain of about 74%.

A $1,000 stake in the S&P 500 grew to roughly $1,736. The same $1,000 in Bitcoin grew to roughly $1,676. Stocks came out around $60 ahead.
Stocks Won With a Much Smoother Ride
Bitcoin’s return looks unremarkable next to the risk it carried. Bitcoin rallied to nearly $69,000 in November 2021. It then crashed below $17,000 during the 2022 crypto winter. It surged past $120,000 in 2025 then slid back below $60,000 most recently.
The S&P 500 never came close to that kind of swing. Its worst drawdown in the same stretch hit about 25% in 2022, a fraction of Bitcoin’s peak-to-trough loss.
Bitcoin has beaten the index by far wider margins over longer stretches. Back in 2019, BeInCrypto reported a 250,000% Bitcoin gain since 2011, against a 147% gain for the S&P 500 over the same span.
This time, Bitcoin’s extra volatility didn’t pay off. Investors took on far more risk and still finished behind stocks.
The post $1,000 in Bitcoin or S&P 500 in 2021? Stocks Payout More Today appeared first on BeInCrypto.


The ETH/BTC ratio prices Ethereum in Bitcoin instead of dollars, stripping out the market-wide move so you can see which of the two is actually winning. Here is what the ratio measures, how to read it, what drives it, and why it has fallen to multi-year lows.
Summary
- The ETH/BTC ratio is the price of one ether expressed in bitcoin, a single number that shows whether Ethereum is outperforming or underperforming Bitcoin regardless of what the dollar price of either is doing.
- A rising ratio means ether is gaining on bitcoin, often a sign of risk appetite and a healthier environment for altcoins; a falling ratio means bitcoin is winning, usually a sign of caution and bitcoin dominance.
- As of mid-2026, the ratio sits near multi-year lows around 0.026, reflecting Ethereum’s deep underperformance against Bitcoin, down sharply from levels near 0.08 in 2021 and 0.15 in 2017.
- The ratio is driven by the tug-of-war between Ethereum-specific forces (ETF flows, staking, layer-2 activity, supply dynamics, competition from other chains) and Bitcoin-specific forces (halving cycles, ETF and treasury demand).
- It is a relative-strength gauge and a regime signal, not a price target, and it can stay depressed or elevated for years, so it should inform context rather than dictate trades.
The ETH/BTC ratio is the price of one ether (ETH) measured in bitcoin (BTC) rather than in dollars, and it is one of the most useful single numbers in crypto for understanding which of the two largest assets is actually winning. When you look at Ethereum’s price in dollars, you are seeing two things mixed together: how Ethereum is doing, and how the entire crypto market is doing, because almost everything in crypto moves loosely with Bitcoin and with the broad risk environment.
The ETH/BTC ratio removes the second factor. By pricing Ethereum directly in Bitcoin, it cancels out the market-wide move that both assets share and isolates Ethereum’s performance relative to Bitcoin alone. If both assets rise 20% in dollars, the ratio does not move, because neither outperformed the other. If Ethereum rises while Bitcoin is flat, the ratio rises, and you learn something the dollar chart obscured: capital is favoring Ethereum over Bitcoin right now.
That makes the ratio a lens, not just a number, and learning to read it changes how you see the market. This guide explains what the ETH/BTC ratio is and how it is calculated, why traders watch it, how to interpret a rising or falling ratio, what the ratio has done historically and where it sits now, the forces on each side that push it up or down, a worked example you can follow step by step, and how to use it sensibly without overreading it.
The aim is to give you a durable mental model rather than a snapshot, because the specific level will change, but the way the ratio works will not. None of this is trading advice; the ratio is an analytical tool, and like any tool, it can mislead if used in isolation. Used well, though, it is one of the clearest windows into the single most important relationship in the asset class, the one between its two dominant coins.
What the ratio actually measures
Start with the mechanics, because they are simple and the simplicity is the point. The ETH/BTC ratio is calculated by dividing the price of ether by the price of bitcoin, using the same currency for both, so the units cancel and you are left with a pure ratio. If ether trades at $1,550 and bitcoin trades at $60,000, the ratio is 1,550 divided by 60,000, which is about 0.0258, usually written as 0.026. That number tells you that one ether is currently worth about 2.6% of one bitcoin. You can read it directly: at a ratio of 0.026, it takes roughly 38 ether to equal one bitcoin in value.
Most charting platforms quote the pair as ETHBTC or ETH/BTC, and many crypto exchanges let you trade the pair directly, buying ether with bitcoin or the reverse, which is part of why the ratio is so closely watched, it is a live, tradable market, not just a derived statistic.
What the ratio measures, conceptually, is relative strength. It answers a question the dollar price cannot: between the two largest assets in crypto, which is the market choosing right now? Because Bitcoin and Ethereum share most of the same macro drivers, interest rates, risk appetite, regulatory news, dollar liquidity, comparing them to each other holds those shared factors roughly constant and exposes the difference that is specific to each asset. A dollar chart of Ethereum during a broad sell-off shows Ethereum falling, but it cannot tell you whether Ethereum fell more or less than Bitcoin.
The ratio can. If Ethereum fell harder than Bitcoin, the ratio dropped even as both went down, revealing that within the decline, capital preferred the relative safety of Bitcoin. That is the core value of the metric: it separates Ethereum’s own story from the market’s story, and in doing so it often reveals the direction of capital rotation that the dollar price hides.
Why traders watch it
The ratio matters because it functions as a regime indicator for the broader market, not just for Ethereum. In crypto, there is a long-observed pattern in which capital rotates in a rough sequence: money flows into Bitcoin first during the early, cautious phase of a rally, then rotates into Ethereum as confidence grows, and then spreads out into smaller altcoins as risk appetite peaks.
Because Ethereum sits in the middle of that sequence, the largest and most established asset after Bitcoin, the ETH/BTC ratio often acts as a barometer for where the market is in that cycle. A rising ratio, with Ethereum gaining on Bitcoin, frequently signals that risk appetite is building and that the environment is turning favorable for altcoins broadly, since Ethereum tends to lead the alt market. A falling ratio, with Bitcoin winning, usually signals the opposite: caution, a flight toward the relative safety of Bitcoin, and a harder environment for smaller tokens.
This is why traders treat the ratio as a piece of market-structure information instead of just a fact about two coins. When the ratio is trending up, many interpret it as confirmation of an “altcoin season” or “ETH season,” a period when capital is willing to move out the risk curve and non-Bitcoin assets outperform. When it is trending down, the read is “Bitcoin season” or rising “Bitcoin dominance,” a period when Bitcoin absorbs the market’s attention and capital while alts bleed against it. Portfolio decisions follow from this framing: a trader who believes the ratio is turning up might tilt toward Ethereum and altcoins, while one who sees it falling might rotate toward Bitcoin or cash.
The ratio also serves as a sanity check on narratives. If commentators are loudly predicting an Ethereum breakout but the ETH/BTC ratio keeps falling, the market is voting against the narrative in the most direct way available, by pricing Ethereum lower against Bitcoin quarter after quarter. Watching the ratio keeps a trader honest about what is actually happening versus what is being talked about.
How to read a rising or falling ratio
Reading the ratio is mostly about direction and context instead of any single absolute level. A rising ETH/BTC ratio means ether is appreciating relative to bitcoin, whether because ether is rising faster than bitcoin, falling more slowly, or rising while bitcoin falls. In all of those cases the message is the same: on a relative basis, the market is favoring Ethereum.
Sustained increases in the ratio tend to coincide with periods of broad risk appetite, strong Ethereum-specific catalysts, and outperformance across the altcoin complex, since Ethereum often pulls the alts along with it. A falling ratio carries the opposite message: bitcoin is winning the relative contest, the market is leaning toward caution and Bitcoin dominance, and altcoins are generally struggling against bitcoin even if they are flat or rising in dollar terms.
The crucial discipline is to read the ratio in context instead of as a standalone buy or sell signal. The same ratio level can mean very different things depending on the trend and the backdrop. A ratio of 0.026 reached on the way down, after months of Ethereum underperformance, signals weakness and momentum against Ethereum. The same 0.026 reached on the way up, after a period of Ethereum gaining, would signal the opposite, recovering relative strength.
Direction and trend matter more than the absolute figure. It also helps to watch the ratio across multiple timeframes: a short-term bounce in the ratio within a long-term downtrend is a different and weaker signal than a multi-month trend change. And because the ratio is relative, it is silent about absolute price. The ratio can rise while both assets fall in dollars, if Ethereum falls less, which is relative outperformance during an absolute loss, useful to know but not the same as a gain. Reading the ratio well means always holding two questions at once: which asset is winning the relative contest, and what is the absolute market doing underneath that contest.
A worked example
Make it concrete with numbers you can follow. Suppose ether is trading at $1,550 and bitcoin at $60,000. Divide 1,550 by 60,000 and you get 0.0258, so the ETH/BTC ratio is about 0.026, and one ether is worth roughly 2.6% of one bitcoin, or equivalently it takes about 38 ether to equal one bitcoin. Now run three scenarios from that starting point to see how the ratio responds to relative moves.
In the first scenario, both assets rise 25% in dollars: ether to about $1,938 and bitcoin to $75,000. The ratio is 1,938 divided by 75,000, which is still about 0.0258. Despite a large dollar gain in both, the ratio did not move, because neither outperformed the other, exactly the information the dollar chart would have hidden.
In the second scenario, ether outperforms: ether doubles to $3,100 while bitcoin stays at $60,000. The ratio becomes 3,100 divided by 60,000, or about 0.052, a doubling of the ratio. This is the signature of Ethereum outperformance, and a trader watching only the ratio would see it climb from 0.026 to 0.052 and read a strong shift of capital toward Ethereum, the kind of move associated with an ETH-led alt rally. In the third scenario, the market falls but Ethereum falls harder: bitcoin drops to $48,000 (down 20%) while ether drops to $1,085 (down 30%).
The ratio is 1,085 divided by 48,000, or about 0.0226, a decline from 0.026. Here both assets lost money in dollars, but the ratio fell, telling you that within the sell-off, capital preferred bitcoin and Ethereum bore more of the damage. These three cases show the ratio’s whole purpose in miniature: it ignores the shared move and reports only the relative winner, which is the piece of information that dollar prices alone cannot give you.
Where the ratio has been, and where it is now
History gives the current level its meaning, and the history of ETH/BTC is a story of a long round trip. In Ethereum’s earlier years the ratio climbed dramatically as Ethereum established itself as the clear number-two asset and the home of smart contracts, decentralized finance, and much of crypto’s developer activity. It reached its highest levels around mid-2017, near 0.15, when one ether was worth about 15% of a bitcoin, a peak of Ethereum’s relative strength driven by the initial-coin-offering boom that ran on Ethereum.
The ratio then fell sharply, recovered into the 2021 cycle to peak around 0.08 as decentralized finance and non-fungible tokens drove enormous activity on Ethereum, and has since entered a prolonged decline. As of mid-2026, the ratio sits near multi-year lows around 0.026, with ether near $1,550 against bitcoin near $60,000, a level that reflects a sustained stretch of Ethereum underperforming Bitcoin.
The reasons for the long decline are worth understanding because they explain why the ratio is where it is instead of simply that it is low. Several forces have weighed on Ethereum’s relative strength. Bitcoin has captured an enormous wave of institutional demand through spot ETFs and corporate-treasury adoption, a clean, simple “digital gold” narrative that has pulled capital toward Bitcoin specifically. Ethereum, meanwhile, has faced intensifying competition from faster, cheaper chains, with much of the speculative and developer energy that once flowed to Ethereum moving to rivals, which has diluted the “Ethereum is the only smart-contract platform that matters” thesis that powered its earlier outperformance.
Ethereum’s own narrative has also been harder to summarize than Bitcoin’s, shifting across staking, scaling through layer-2 networks, and supply dynamics in ways that are powerful but complex, and complexity is a disadvantage in a market that rewards simple stories. The result is a ratio that has spent a long time grinding lower, which is the context any reader should hold when they see the current figure: it is not a momentary dip but the late stage of a multi-year trend, which is exactly why it is so closely watched for signs of a turn.
What drives the ratio up and down
To anticipate the ratio instead of just observe it, you have to understand the forces on each side, because the ratio is a tug-of-war between Ethereum-specific and Bitcoin-specific drivers. On the Ethereum side, the factors that tend to push the ratio up include strong inflows into Ethereum ETFs, which signal institutional demand specifically for ether; growth in staking, which locks up supply and can tighten the available float; rising activity on Ethereum and its layer-2 networks, which supports the case that the network is being used; and periods when Ethereum’s supply dynamics turn deflationary, reducing net issuance. Broadly, anything that strengthens Ethereum’s relative narrative or tightens its supply relative to Bitcoin tends to lift the ratio. When these forces are strong and Bitcoin lacks an equally strong catalyst, capital rotates toward Ethereum and the ratio climbs.
On the Bitcoin side, the factors that push the ratio down include the four-year halving cycle and its associated demand narratives, large institutional inflows into Bitcoin ETFs, corporate-treasury accumulation of Bitcoin, and any environment in which the market wants the relative safety and simplicity of Bitcoin over the complexity of Ethereum and altcoins. Risk-off conditions generally favor Bitcoin and pull the ratio down, because in a cautious market capital concentrates in the most established, most liquid, most narratively simple asset, which is Bitcoin.
The overall risk environment is the backdrop to both sides: in risk-on periods, capital is willing to move out the curve toward Ethereum and the ratio tends to rise, while in risk-off periods it retreats toward Bitcoin and the ratio tends to fall. This framework explains why the ratio has been weak: Bitcoin has enjoyed powerful, simple, institution-friendly catalysts in ETFs and treasuries, while Ethereum’s catalysts have been real but more diffuse, and much of the market has been in a cautious, Bitcoin-favoring posture. A durable turn in the ratio would require Ethereum-specific demand to outweigh Bitcoin’s, which is exactly what traders watch the ratio to detect.
How to use the ratio without overreading it
For all its usefulness, the ratio is easy to misuse, and using it well means respecting its limits. The most important discipline is to remember that the ratio is a relative-strength gauge, not a price target or a guaranteed mean-reverting signal. A common error is to look at a depressed ratio and assume it must bounce back toward old levels, treating the multi-year average as a magnet.
There is no rule that forces the ratio to revert. It can stay depressed for years if Ethereum continues to underperform, just as it can stay elevated during a strong Ethereum cycle, and betting on reversion simply because the ratio looks low has cost many traders dearly through long stretches of continued underperformance. The ratio describes the current balance of relative strength; it does not promise that the balance will swing back on any particular schedule.
The second discipline is to never trade the ratio in isolation. It is one input among many, most powerful when combined with an understanding of the absolute market environment, the specific catalysts on each side, and your own time horizon. The ratio tells you which asset is winning the relative contest, but it says nothing about whether the whole market is heading up or down in dollars, which is what actually determines whether you make or lose money in absolute terms.
A rising ratio in a collapsing market still means losses; a falling ratio in a soaring market can still mean gains. The ratio is best used to inform allocation tilts and to read market structure, for example to judge whether the environment favors Ethereum and alts or Bitcoin, instead of as a standalone entry or exit trigger. Treat it as a compass that shows direction of relative capital flow, not a clock that tells you when to act, and it becomes one of the more reliable instruments in a crypto analyst’s toolkit. Misread as a precise timing signal or a guaranteed reversion bet, it becomes a trap. The metric is honest; the overreading is the danger.
Frequently Asked Questions
What is a good ETH/BTC ratio?
There is no single “good” level, because the ratio is a relative measure whose meaning depends on trend and context instead of any fixed number. Historically the ratio has ranged from highs near 0.15 in 2017 and 0.08 in 2021 down to multi-year lows around 0.026 in 2026. A higher ratio reflects stronger Ethereum performance against Bitcoin, and a lower one reflects Bitcoin dominance, but neither is inherently “good” or “bad,” it depends on which asset you favor and where you are in the cycle. What matters more than the absolute level is the direction: a rising ratio signals Ethereum gaining, a falling ratio signals Bitcoin winning. Read the trend and the backdrop, not a target number.
How do you calculate the ETH/BTC ratio?
Divide the price of ether by the price of bitcoin, using the same currency for both so the units cancel. For example, if ether is $1,550 and bitcoin is $60,000, the ratio is 1,550 divided by 60,000, which equals about 0.0258, usually written as 0.026. That means one ether is worth roughly 2.6% of one bitcoin, or that it takes about 38 ether to equal one bitcoin. Most charting platforms display the pair directly as ETHBTC or ETH/BTC, so you rarely need to calculate it by hand, and many exchanges let you trade the pair directly, which is why it behaves as a live market instead of just a derived statistic.
What does a rising ETH/BTC ratio mean?
A rising ratio means ether is appreciating relative to bitcoin, whether because ether is rising faster, falling more slowly, or rising while bitcoin is flat or falling. The shared message is that the market is favoring Ethereum over Bitcoin on a relative basis. Sustained increases often coincide with broad risk appetite and outperformance across altcoins, since Ethereum tends to lead the alt market, which is why a rising ratio is frequently read as a signal of “ETH season” or a building altcoin rally. The key caveat is that a rising ratio describes relative strength only; it says nothing about whether the overall market is going up or down in dollar terms.
Why has the ETH/BTC ratio been falling?
The long decline reflects a tug-of-war that Bitcoin has been winning. Bitcoin has captured a powerful wave of institutional demand through spot ETFs and corporate treasuries, supported by a simple “digital gold” narrative. Ethereum has faced intensifying competition from faster, cheaper chains that drew away speculative and developer activity, while its own narrative, spanning staking, layer-2 scaling, and supply dynamics, has been harder to summarize than Bitcoin’s. A generally cautious, risk-off market has also favored Bitcoin’s relative safety. The combination pushed the ratio to multi-year lows near 0.026 by mid-2026. A durable turn would require Ethereum-specific demand to outweigh Bitcoin’s catalysts.
Can the ETH/BTC ratio predict altcoin season?
It is one of the more useful indicators for it, but not a precise predictor. Because Ethereum sits between Bitcoin and smaller altcoins in the typical rotation of capital, the ETH/BTC ratio often acts as a barometer: a rising ratio suggests capital is moving out the risk curve toward Ethereum and, by extension, toward altcoins, while a falling ratio suggests retreat toward Bitcoin. Many traders treat a sustained uptrend in the ratio as confirmation that an altcoin season is building. However, it is a relative-strength gauge, not a guarantee, and it should be combined with other signals and an understanding of the absolute market, instead of treated as a standalone forecast of when alts will run.
Should I trade based on the ETH/BTC ratio?
The ratio is best used as an analytical and allocation tool instead of a standalone trading trigger, and this is not trading advice. It is most valuable for understanding market structure, judging whether the environment favors Ethereum and altcoins or Bitcoin, and informing how you tilt a portfolio, instead of as a precise entry or exit signal. Two cautions matter most: do not assume a low ratio must revert to old highs, because it can stay depressed for years, and never read it in isolation, because it says nothing about whether the overall market is rising or falling in dollars. A rising ratio in a falling market still means losses. Use it as a compass for relative strength, combined with other analyses.
This article is educational information, not financial or investment advice. Price levels and ratio figures reflect approximate values as of June 2026 and change continuously. Cryptocurrency is volatile, and you can lose money. Do your own research and consult a qualified financial professional before making any investment decision.


MetaMask has launched Money Account, a self-custodial stablecoin account on Monad that combines automated yield of up to 4% variable APY, direct spending, and integrated trading through a single balance.
Summary
- MetaMask launched Money Account on Monad, combining automatic yield, spending, and trading through a single self custodial balance.
- Supported stablecoins can be converted into mUSD at one to one parity, with balances earning up to 4% variable APY after users opt in.
- The launch expands MetaMask beyond trading after its recent Agent Wallet rollout, adding everyday payments and savings features to the wallet.
According to a press release shared with crypto.news, the new product lets MetaMask users convert supported stablecoins into MetaMask’s mUSD stablecoin and begin earning returns immediately without staking, lockup periods, minimum balances, or manual fund transfers. The company said the service is available globally in eligible jurisdictions, excluding the UK and certain restricted regions.
Money Account brings together functions that previously required separate platforms. Users can earn yield through decentralized finance protocols, spend funds through the MetaMask Card, and access MetaMask’s trading tools, including swaps, perpetual futures, and prediction markets, without moving assets between different accounts.
Consensys said mUSD is backed one to one by U.S. dollars and short-term U.S. Treasury bills held in regulated custody by Bridge, a Stripe company, while the stablecoin runs on M0’s infrastructure. The company added that users retain control of their private keys, meaning MetaMask cannot freeze or move customer funds.
Money Account runs on Monad
Built on the Monad blockchain, Money Account uses sponsored gas fees, allowing users to manage balances, earn yield, and make payments without paying network transaction costs, according to the announcement. Consensys said Monad’s sub second finality and stable transaction costs support the product’s real time payment and settlement experience.
Supported stablecoins, including USDC, USDT, DAI, aUSDC, aUSDT, and aDAI on supported networks, can be converted into mUSD instantly at one-to-one parity without conversion fees. Users can also buy mUSD directly with debit cards, credit cards, or Apple Pay.
After users opt in, funds are allocated through third-party smart contract vaults managed by Veda and curated by Steakhouse Financial. Consensys said the launch version routes funds into Morpho, while Aave markets will be added later. The company stated that balances can earn up to 4% variable APY after fees, with returns updating continuously inside the account.
For payments, the Money Account connects directly to the MetaMask Card where available. Purchases settle automatically from the account balance without additional conversion steps, while eligible spending earns up to 3% cashback in mUSD that is deposited back into the account, according to Consensys.
“Money Account is what it looks like when self-custodial finance stops asking people to choose between control and convenience and starts delivering both. MetaMask is financial agency for everyone. Money Account makes financial agency even more powerful and valuable,” said Joe Lubin, Founder and CEO of Consensys and Co-Founder of Ethereum.
MetaMask expands beyond wallet features
The launch comes weeks after MetaMask introduced an early access version of Agent Wallet, a self custodial product that allows artificial intelligence agents to execute crypto transactions under user-defined permissions across Ethereum compatible networks and Hyperliquid.
At the time, Consensys said Agent Wallet was built with spending limits, transaction simulations, Blockaid security monitoring, and user approval controls to let AI agents perform tasks such as token swaps, perpetual futures trading, liquidity provision, and prediction market activity while keeping final authority with users.
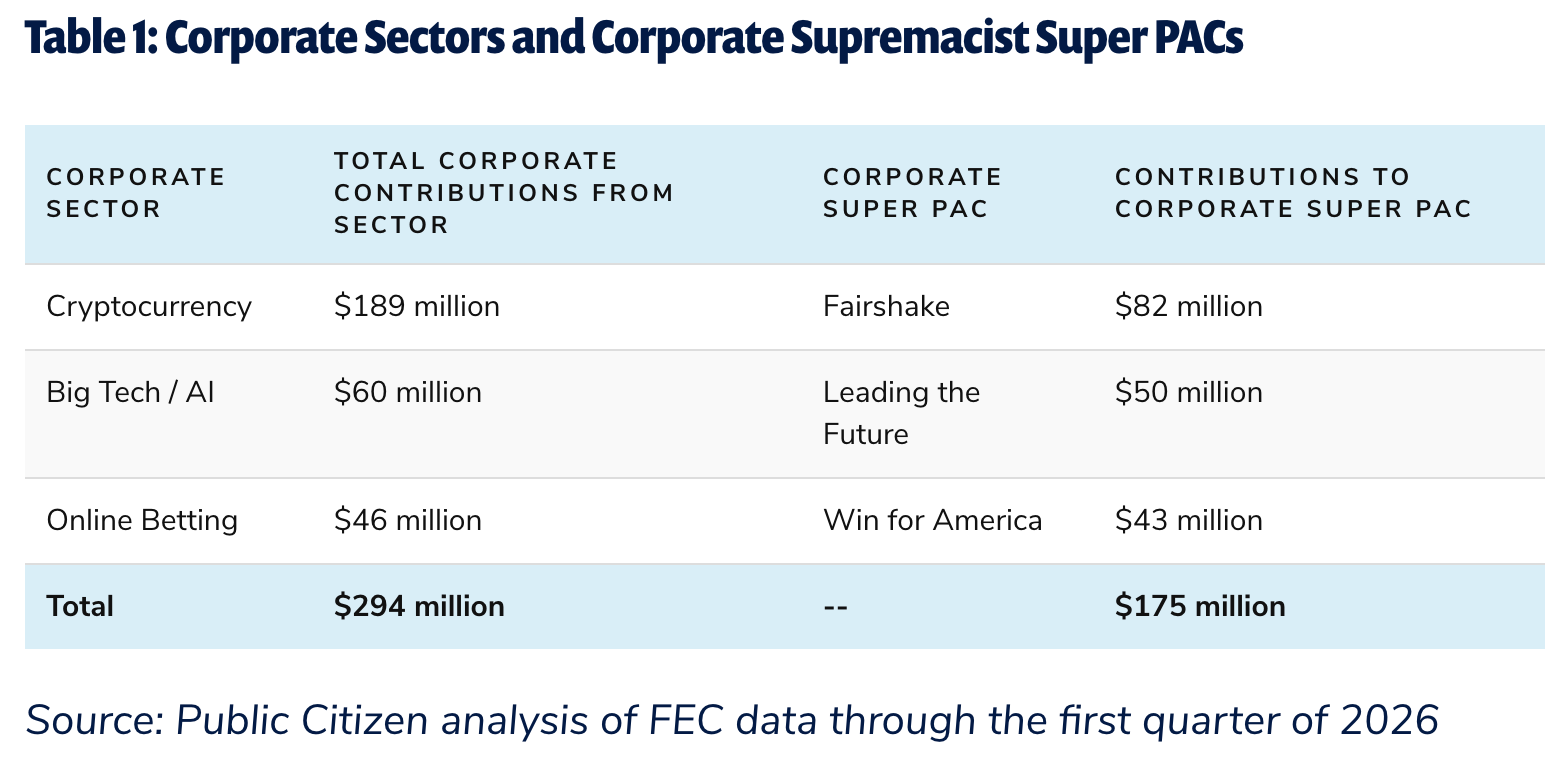
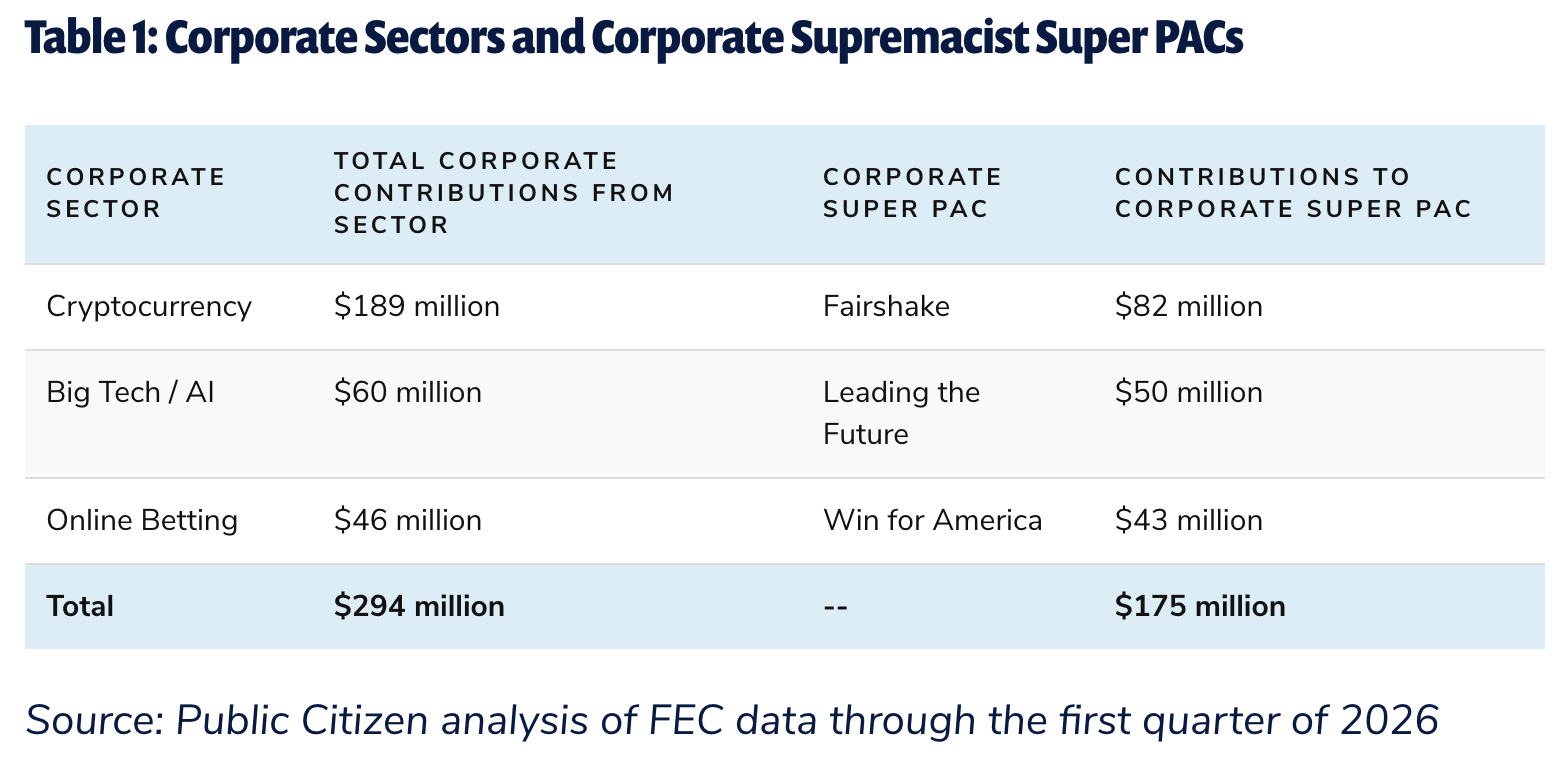
The US consumer advocacy group Public Citizen on Tuesday reported that the cryptocurrency industry had contributed $189 million toward the 2026 election cycle, following its 2024 playbook.
According to a report released Tuesday, the nonprofit organization said that about 37% of all corporate contributions in the 2026 US election cycle could be traced to crypto companies, totaling about $189 million so far, with more than four months until the November election.
While the watchdog group said that the crypto-aligned political action committee (PAC) Fairshake was responsible for spending more than $82 million so far, the MAGA Inc. Super PAC, largely backed by Crypto.com, had spent more than $56 million.
“These super PACs prioritize the interests of their business backers over either major political party or any candidate,” said Public Citizen. “Following the crypto playbook, they are set up to engage in both Democratic and Republican primaries and to support or attack candidates of either major party in the general election.”
Source: Public Citizen
Fairshake and its affiliates Defend American Jobs and Protect Progress are backed by cryptocurrency companies Coinbase and Ripple, and reported a $193 million war chest as of January. Entities aligning with industry interests have also been formed since 2024, including the Fellowship PAC backed by Cantor Fitzgerald.
Altogether, the PACs’ combined spending has already exceeded that in 2024, when companies contributed $170 million toward electing what it considered “pro-crypto” candidates to Congress.
Related: Senate leaders push for July passage of CLARITY Act
Cointelegraph reached out to a Fairshake spokesperson for a comment on the report but did not receive an immediate response.
Colorado primaries flush with crypto PAC cash
Colorado voters head to the polls today in primaries for Republican and Democratic candidates, with the state’s 8th congressional district potentially being influenced by crypto PAC spending.
The You Can Push Back Super PAC backed by Ripple Labs co-founder Chris Larsen reportedly spent $1 million on media to support Democrat Manny Rutinel. The committee’s last big bet — $3.3 million — was on Democrat Alex Bores in New York’s 12th Congressional District. He lost his primary last week to Micah Lasher, who had criticized Larsen’s involvement in the race.
Magazine: SBF will never get a pardon, Trump peace deal boosts Bitcoin: Hodlers Digest June 14-21

Nearly 1,700 investors in the United Kingdom have reportedly launched legal action against Binance and its founder, Changpeng Zhao, seeking £150 million (about $200 million). The claim alleges that Binance offered and sold crypto derivatives—including leverage tokens, futures contracts, and options—without the regulatory approval required under UK law.
According to the law firm KP Law, the case focuses on alleged violations of the Financial Services and Markets Act 2000 and on the continued availability of these products after the UK Financial Conduct Authority (FCA) banned them from being offered to retail customers in January 2021. Binance, for its part, says it will defend itself through the legal process and asserts it remains committed to operating in line with applicable law.
Key takeaways
- KP Law says almost 1,700 UK investors are pursuing a combined £150 million claim against Binance and Changpeng Zhao over crypto derivatives offerings.
- The lawsuit targets leverage tokens, futures, and options, alleging breaches of the Financial Services and Markets Act 2000.
- The case centers on alleged continued access after the FCA banned such products to UK retail customers in January 2021.
- Binance has denied wrongdoing and told Cointelegraph it will defend the claims in court.
- The complaint was reportedly filed in the London High Court, naming Binance-affiliated Nest Exchange and “persons unknown.”
What the lawsuit alleges
The investors are represented by KP Law, which states that Binance’s leverage tokens and derivatives offerings violated the Financial Services and Markets Act 2000. KP Law also argues that these products kept being offered to UK customers even after regulatory restrictions were issued.
In its statement, the law firm suggests there was “no effective barrier” preventing UK customers from accessing the products. While the precise mechanics of access are not detailed in the available reporting, the legal thrust is clear: the plaintiffs contend that the exchange’s products were distributed in a way that did not respect the regulatory prohibition for retail customers.
Reuters reported that multiple UK users lost “tens of thousands of pounds” through the affected products, underscoring that the suit is not framed as a purely technical regulatory dispute but as a remedy-seeking effort over financial losses.
Binance’s response and the legal posture
Binance told Cointelegraph it would “defend against these claims through the appropriate legal process.” The exchange also said it “remains committed to its obligations to users and to operating in accordance with applicable law.”
That stance positions the lawsuit squarely as a dispute over whether Binance’s derivative offerings were unlawfully provided to UK retail customers and whether the FCA’s January 2021 ban was effectively enforced in practice. As with any civil claim, the next steps—procedural rulings, discovery, and eventual merits arguments—will determine how those allegations are substantiated in court.
How this fits into Binance’s broader regulatory pressure
Lawyers and regulators are not acting in a vacuum. The filing adds to what Cointelegraph described as a growing list of legal and regulatory challenges for Binance, including compliance uncertainty linked to Europe’s Markets in Crypto-Assets (MiCA) framework.
Earlier coverage from Cointelegraph noted that Binance faced difficulty securing a MiCA-compliant license from an EU member state before a July 1 deadline. That type of licensing timeline matters to investors because MiCA was designed to create a clearer compliance structure across the EU—yet uncertainty around authorization and product restrictions can translate into uneven availability of services, shifting venue risk, and changes to how platforms present derivatives and related products.
In addition, Cointelegraph previously reported on allegations that Binance facilitated transactions tied to a sanctioned Iranian financier and that flowed to Iran’s Islamic Revolutionary Guard Corps. Binance strongly denied those allegations, and the case now reflects how regulatory scrutiny has spanned both market-structure compliance (derivatives access and retail suitability) and broader concerns around illicit finance and sanctions risk.
Who may be affected—and what changed for UK operations
The plaintiffs are said to be identifying the full scope of affected customers. KP Law said the precise number of UK customers affected is not publicly known, but argued that Binance’s global scale could mean a larger pool of exposure than the reported 1,700 claimants.
One individual described in coverage is Tomas Sutas, a financial controller who allegedly invested more than £100,000 into Binance’s derivatives products before the value was wiped out, the Financial Times reported. Reuters also described multiple UK users losing “tens of thousands of pounds.” While these accounts represent specific claim narratives rather than a verified aggregate loss figure for the full class, they help explain why the dispute has advanced as a high-stakes damages case.
Cointelegraph also pointed to earlier restrictions affecting Binance in the UK. Binance’s operations in the region reportedly became heavily constrained in June 2021, when the FCA informed Binance Markets Limited that it could not operate without written consent. That timeline is central to how the plaintiffs frame causation: the argument is that regulatory action came earlier, but access to the relevant derivatives continued.
Reuters reported that the lawsuit was filed in the London High Court. The defendants reportedly include the Binance-affiliated Nest Exchange as well as “persons unknown,” a formulation often used when claimants cannot yet identify all involved parties or when seeking broader injunctive and compensatory relief. KP Law said the firm is still working to determine the full set of impacted customers.
For UK-based investors and traders, the practical takeaway is that product availability can become a long-term legal issue, not just a short-lived trading restriction. Even when regulators impose bans, the continuing question—central to this lawsuit—is whether platforms effectively prevent retail access and how that is assessed under the relevant financial services framework.
As the case moves through the UK courts, readers should watch for early procedural developments, including how the court interprets the FCA ban’s reach and whether plaintiffs can demonstrate that the alleged access after January 2021 was sufficiently direct and attributable to Binance’s offerings. Beyond the outcome, the litigation could influence how exchanges design and enforce geo- and user-level controls for derivatives and other complex products in jurisdictions with active retail restrictions.

SharpLink has expanded its Ethereum treasury with another 10,000 ETH purchase even as the cryptocurrency has remained on course for its third consecutive quarterly decline.
Summary
- SharpLink bought another 10,000 ETH for $16.1 million, increasing its Ethereum holdings to 886,725 ETH.
- Ethereum is on track for its first-ever third consecutive quarterly loss despite continued treasury accumulation.
- Bitmine now holds more than 5.7 million ETH, adding to institutional buying as analysts watch the $1,500 support level.
According to a company press release, SharpLink acquired the latest 10,000 ETH at an average price of $1,611 per token, spending approximately $16.1 million on the purchase.
The transaction increases the company’s total Ethereum holdings to 886,725 ETH and follows a $75 million capital raise completed through a registered stock offering.
SharpLink continues building its Ethereum treasury
Alongside the latest crypto purchase, SharpLink stepped up its capital management efforts by repurchasing more than 2.13 million shares of its common stock, SBET, at an average price of $4.69 per share.
The company said it has now bought back over 4.07 million shares since August 2025. Despite those moves, SBET shares were trading around $4.72 at the time of writing, down nearly 4% on the day.
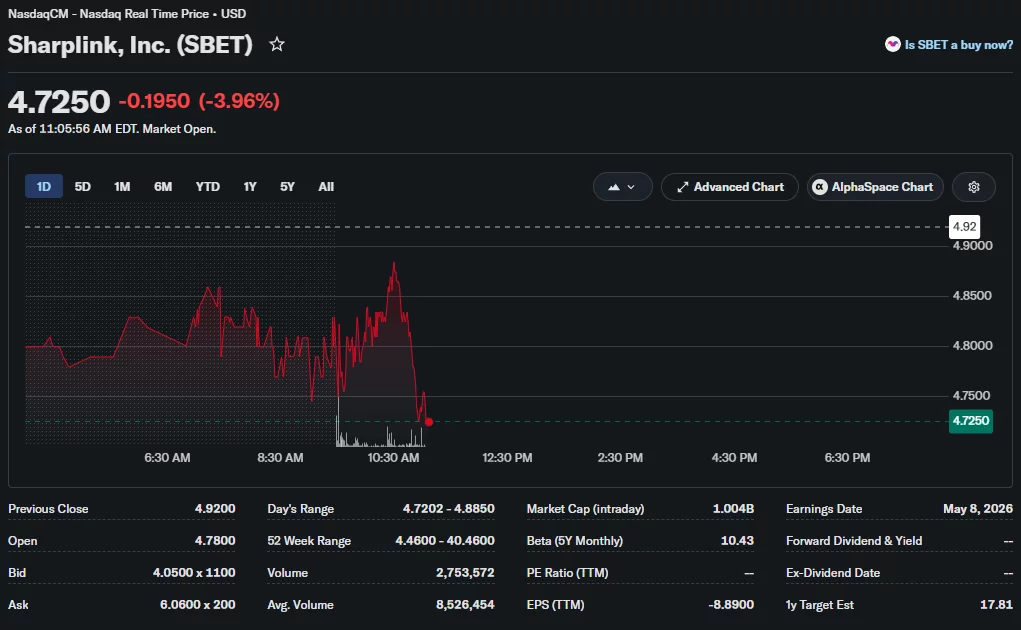
Recent corporate developments have also added to the company’s profile. Earlier this week, SharpLink joined the Russell 2000 and Russell 3000 indexes, extending its presence in major U.S. equity benchmarks while continuing to increase its Ethereum reserves.
SharpLink is not the only listed company expanding its exposure to Ethereum. As crypto.news reported on Monday, Ethereum treasury firm Bitmine purchased another 27,084 ETH during the past week, lifting its holdings to more than 5.7 million ETH.
Based on the company’s figures, those reserves now account for about 4.7% of Ethereum’s estimated circulating supply of 120.7 million ETH, bringing Bitmine closer to its previously stated target of holding 5% of the network’s supply.
Earlier this month, crypto.news also examined the implications of treasury companies accumulating increasingly large portions of Ethereum. The report noted that sustained buying could reduce the amount of ETH available for trading, although concentrated ownership may create additional risks if companies later need to fund operations through debt, equity issuance, or asset sales during weaker market conditions.
Ethereum remains under pressure despite corporate buying
Even as treasury companies continue adding to their holdings, Ethereum (ETH) has struggled to regain upward momentum. At the time of writing, ETH traded near $1,560, down about 1% on the day and roughly 25% for the quarter.
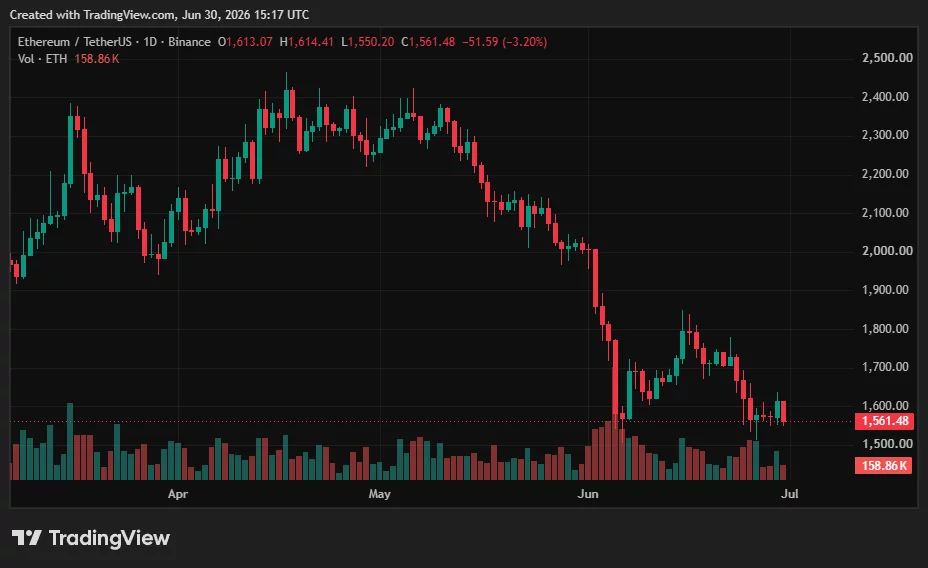
Current market performance also places Ethereum on track to record its third straight quarterly loss, a result that would be the first such streak in the asset’s history if the quarter closes at current levels.
Some analysts nevertheless see the recent weakness as a key technical test rather than a definitive breakdown. According to crypto analyst Ted Pillows, Ethereum could stage a relief rally next month if it manages to hold support around $1,500.
The analyst’s chart also outlined the downside risk if that level fails. Under that scenario, Ted Pillows said Ethereum could fall toward $1,400 or lower, underscoring that price direction in the coming weeks may depend on whether buyers continue defending the current support zone despite ongoing accumulation by treasury firms.

NIKE, Inc. (NKE) Q4 2026 Earnings Call Transcript

42% of Businesses use Stablecoins for Cross-Border Payments

BREAKING: Supreme Court OVERTURNS campaign finance limits, giving power to major party groups


-

 Fashion4 days ago
Weekend Open Thread: Staud – Corporette.com
-

 Politics5 days ago
The House | Manchesterism won’t survive the painful trade-offs unless it gets citizens on board
-

 Crypto World1 day ago
Strategy authorizes up to $1.25B in Bitcoin sales under new capital plan
-

 Politics5 days ago
Potential 2028er World Cup attendee leaderboard
-

 Business5 days ago
Asia stock markets slide as tech shares slump
-

 News Videos2 days ago
MAJOR BITCOIN & MARKET UPDATE!!!! (MUST WATCH ASAP!!!)
-

 Tech5 days ago
A Look At A Gaggle Of Transputer Boards
-

 Crypto World7 days ago
Securitize Wraps Roubini's SEC-Registered ETF as Dubai VARA Digital Security
-
 Crypto World5 days ago
Dell (DELL) Shares Tumble Over 5% Following Analyst Downgrade to Hold
-

 Crypto World3 days ago
Coinbase, Circle Deepen Crypto Stock Losses Despite Resilient S&P 500
-

 Business1 day ago
Australia treasurer says alleged access of prime minister’s bank data ’incredibly concerning’
-

 Crypto World4 days ago
Kraken's xStocks Opens Bending Spoons IPO Registration to EEA Retail
-

 Sports4 days ago
FIH Pro League: India defeat Pakistan 7-1, register biggest win of campaign | Other Sports News
-
 Crypto World5 days ago
Bitcoin Sparks $600M Hourly Liquidations With $65,000 Set To Become Resistance
-

 Tech3 days ago
Bluekit phishing kit adopts browser-in-the-middle for login theft
-

 Tech4 days ago
Russian hackers now target Signal backup recovery keys
-
 Crypto World5 days ago
Hyperliquid Named on Singapore MAS Investor Alert Register
-

 Crypto World6 days ago
Ripple and SBI launch RLUSD in Japan after JFSA approval
-

 Crypto World4 days ago
RTX holders must register wallets before token distribution begins
-
 Business1 day ago
The AI boom won’t burst all at once. It will pop in ‘rolling bubbles’: Macquarie
You must be logged in to post a comment Login