

Crypto World
Cloudflare Launches Monetization Gateway for Stablecoin Payments via x402


Cloudflare opened a waitlist Wednesday for its Monetization Gateway, a new tool letting customers charge for any web page, dataset, API or MCP tool sitting behind its network. Payments settle in stablecoins over the x402 protocol. The announcement came from Cloudflare's official X account Wednesday… Read the full story at The Defiant

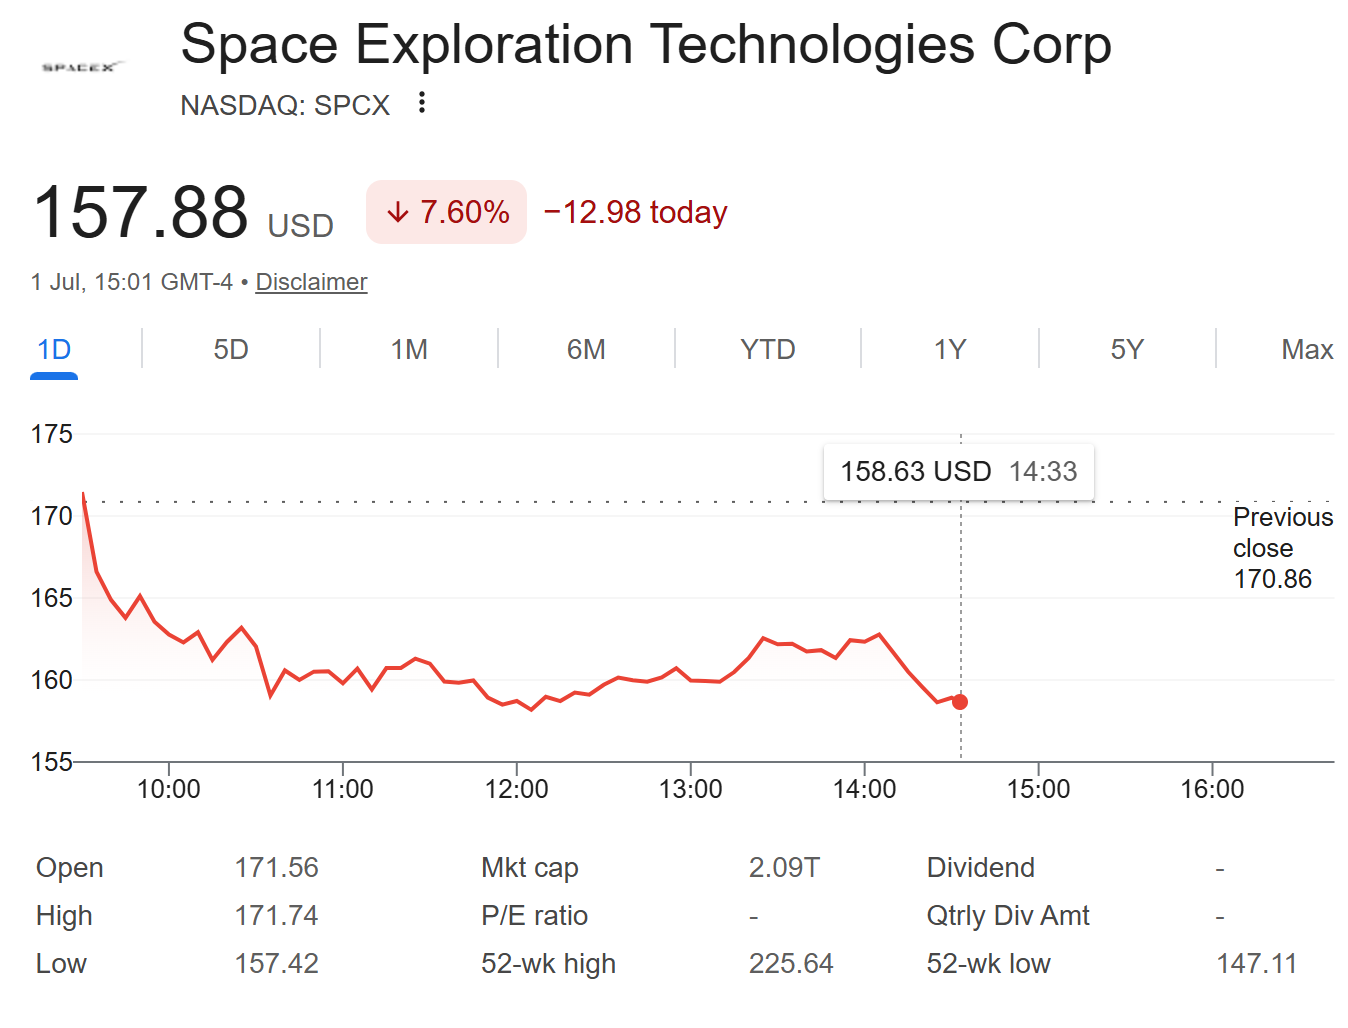
Elon Musk dismissed a Wall Street Journal report that SpaceX built a prototype AI device, calling it “utterly false”. SpaceX stock (SPCX) fell about 7% on Wednesday as investors weighed the conflicting accounts.
The report said the company privately showed investors a handset-like device before its public listing. The denial gave traders little clarity on a stock already prone to sharp swings.

Musk Rejects the AI Device Report
The Wall Street Journal reported that SpaceX showed investors a device slimmer than an iPhone before its June listing. The prototype reportedly ran a proprietary operating system on a Qualcomm (QCOM) Snapdragon chipset.
It also drew on technology from Musk’s xAI unit, now folded into SpaceX. Sources described the project as early-stage, with a design that could still change. Elon Musk has however refuted the claims. The post has since been deleted.

Follow us on X to get the latest news as it happens
No filing, image, or product demonstration has backed the report, and SpaceX has stayed publicly silent. The denial echoes February, when Musk rejected a Reuters report that SpaceX was building a Starlink phone.
Still, the report fits how SpaceX sells itself. The company spans rockets, satellite internet, and AI. Its broader AI push, though, has favored data centers and satellites over consumer gadgets.
SpaceX Stock Extends Its Post-IPO Slide
SPCX fell to $157.88, down about 7% from Tuesday’s close of $170.86. As of this writing, it was trading for $158.33, with the drop leaving the stock roughly 30% below its June peak of $225.64. It has deepened a retreat that began soon after the stock’s record IPO debut.

SpaceX priced that June offering at $135 a share, raising about $75 billion. That gave it a valuation near $2.09 trillion.
Qualcomm shares edged higher as some traders read the report as a new chip partnership. That split reaction captured the market’s uncertainty. SpaceX now trades near a make-or-break support level that analysts have flagged for weeks.

The muted company response leaves investors waiting for clarification. Musk’s denials have not always ended speculation. Continued silence from SpaceX could keep pressure on SPCX in the coming sessions.
The post Elon Musk Sends SpaceX Shares Lower With Two-Word AI Device Denial appeared first on BeInCrypto.

Key Takeaways
- Tesla shares have climbed 10.8% this week in advance of Thursday’s Q2 delivery figures
- Analyst projections for Q2 deliveries span from 400,000 to 466,000 vehicles
- Last year’s Q2 saw 384,000 vehicles sold, meaning all current forecasts indicate positive year-over-year growth
- The elimination of the $7,500 federal EV subsidy has created headwinds, though rising gasoline prices have provided some relief
- Deutsche Bank maintained its Buy recommendation; overall analyst sentiment remains Hold with a $403.07 mean price objective
Tesla shares are changing hands at $427.74 as of Wednesday, marking a 1.7% daily increase and a robust 10.8% weekly advance, with market participants strategically positioning themselves before Thursday’s Q2 delivery announcement.
The delivery figure represents the critical data point. Analyst expectations display an unusually wide range — FactSet’s consensus hovers around 409,000 units, Bloomberg’s compilation averages closer to 400,000, and Tesla’s aggregated consensus settles near 406,000. On the optimistic extreme, forecaster Troy Teslike anticipates 466,000 deliveries. Future Fund’s Gary Black projects 420,000.
Last year’s Q2 saw Tesla deliver 384,000 vehicles, meaning every current projection indicates positive year-over-year expansion.
Should these estimates prove accurate, Tesla would achieve its second consecutive quarter of year-over-year delivery increases. The automaker hasn’t recorded consecutive quarterly delivery growth since 2024. Annual deliveries reached their zenith at approximately 1.8 million in 2023, before contracting in both 2024 and 2025.
Headwinds and Tailwinds
The September elimination of the $7,500 federal EV purchase subsidy reduced affordability for American consumers and created demand challenges. Tesla additionally opted against introducing a more affordable mass-market electric vehicle, concentrating resources on the Cybercab autonomous taxi initiative instead.
Conversely, gasoline prices surged to approximately $4.60 per gallon in May — an increase of roughly $1.60 — following conflict in Iran that disrupted worldwide oil markets. Elevated fuel costs typically incentivize consumers toward electric vehicle adoption.
The stock’s 10.8% weekly surge indicates the market has already incorporated expectations of a favorable outcome. Industry watchers suggest Tesla would probably require deliveries around 420,000 or above to sustain this upward trajectory. A figure approaching 466,000 would likely propel shares even higher.
Entering 2026, Tesla remains approximately 6% lower year-to-date, notwithstanding the recent rally.
Wall Street Ratings and Financial Performance
Deutsche Bank reaffirmed its Buy stance on Tesla this Tuesday. The broader analyst community displays more reserved sentiment — 21 analysts assign it Buy ratings, 20 assign Hold ratings, and four maintain Sell recommendations. The consensus price objective stands at $403.07, modestly beneath current trading levels.
In its latest quarterly financial release, Tesla reported earnings per share of $0.41, surpassing the $0.39 consensus forecast. Revenue totaled $22.39 billion, marginally below the $22.96 billion projection but representing a 15.8% year-over-year increase.
Wedbush maintains the Street’s most bullish price target at $600.
Insider activity has trended toward selling. CFO Vaibhav Taneja divested approximately 2,600 shares in early June at $402.20 per share. Director Kathleen Wilson-Thompson decreased her holdings by 35% in late April. Collectively, insiders have liquidated approximately $12.4 million in stock during the past 90 days.
Institutional ownership comprises 66.2%, with multiple funds expanding their positions in recent quarters.
The Q2 delivery announcement arrives Thursday morning.

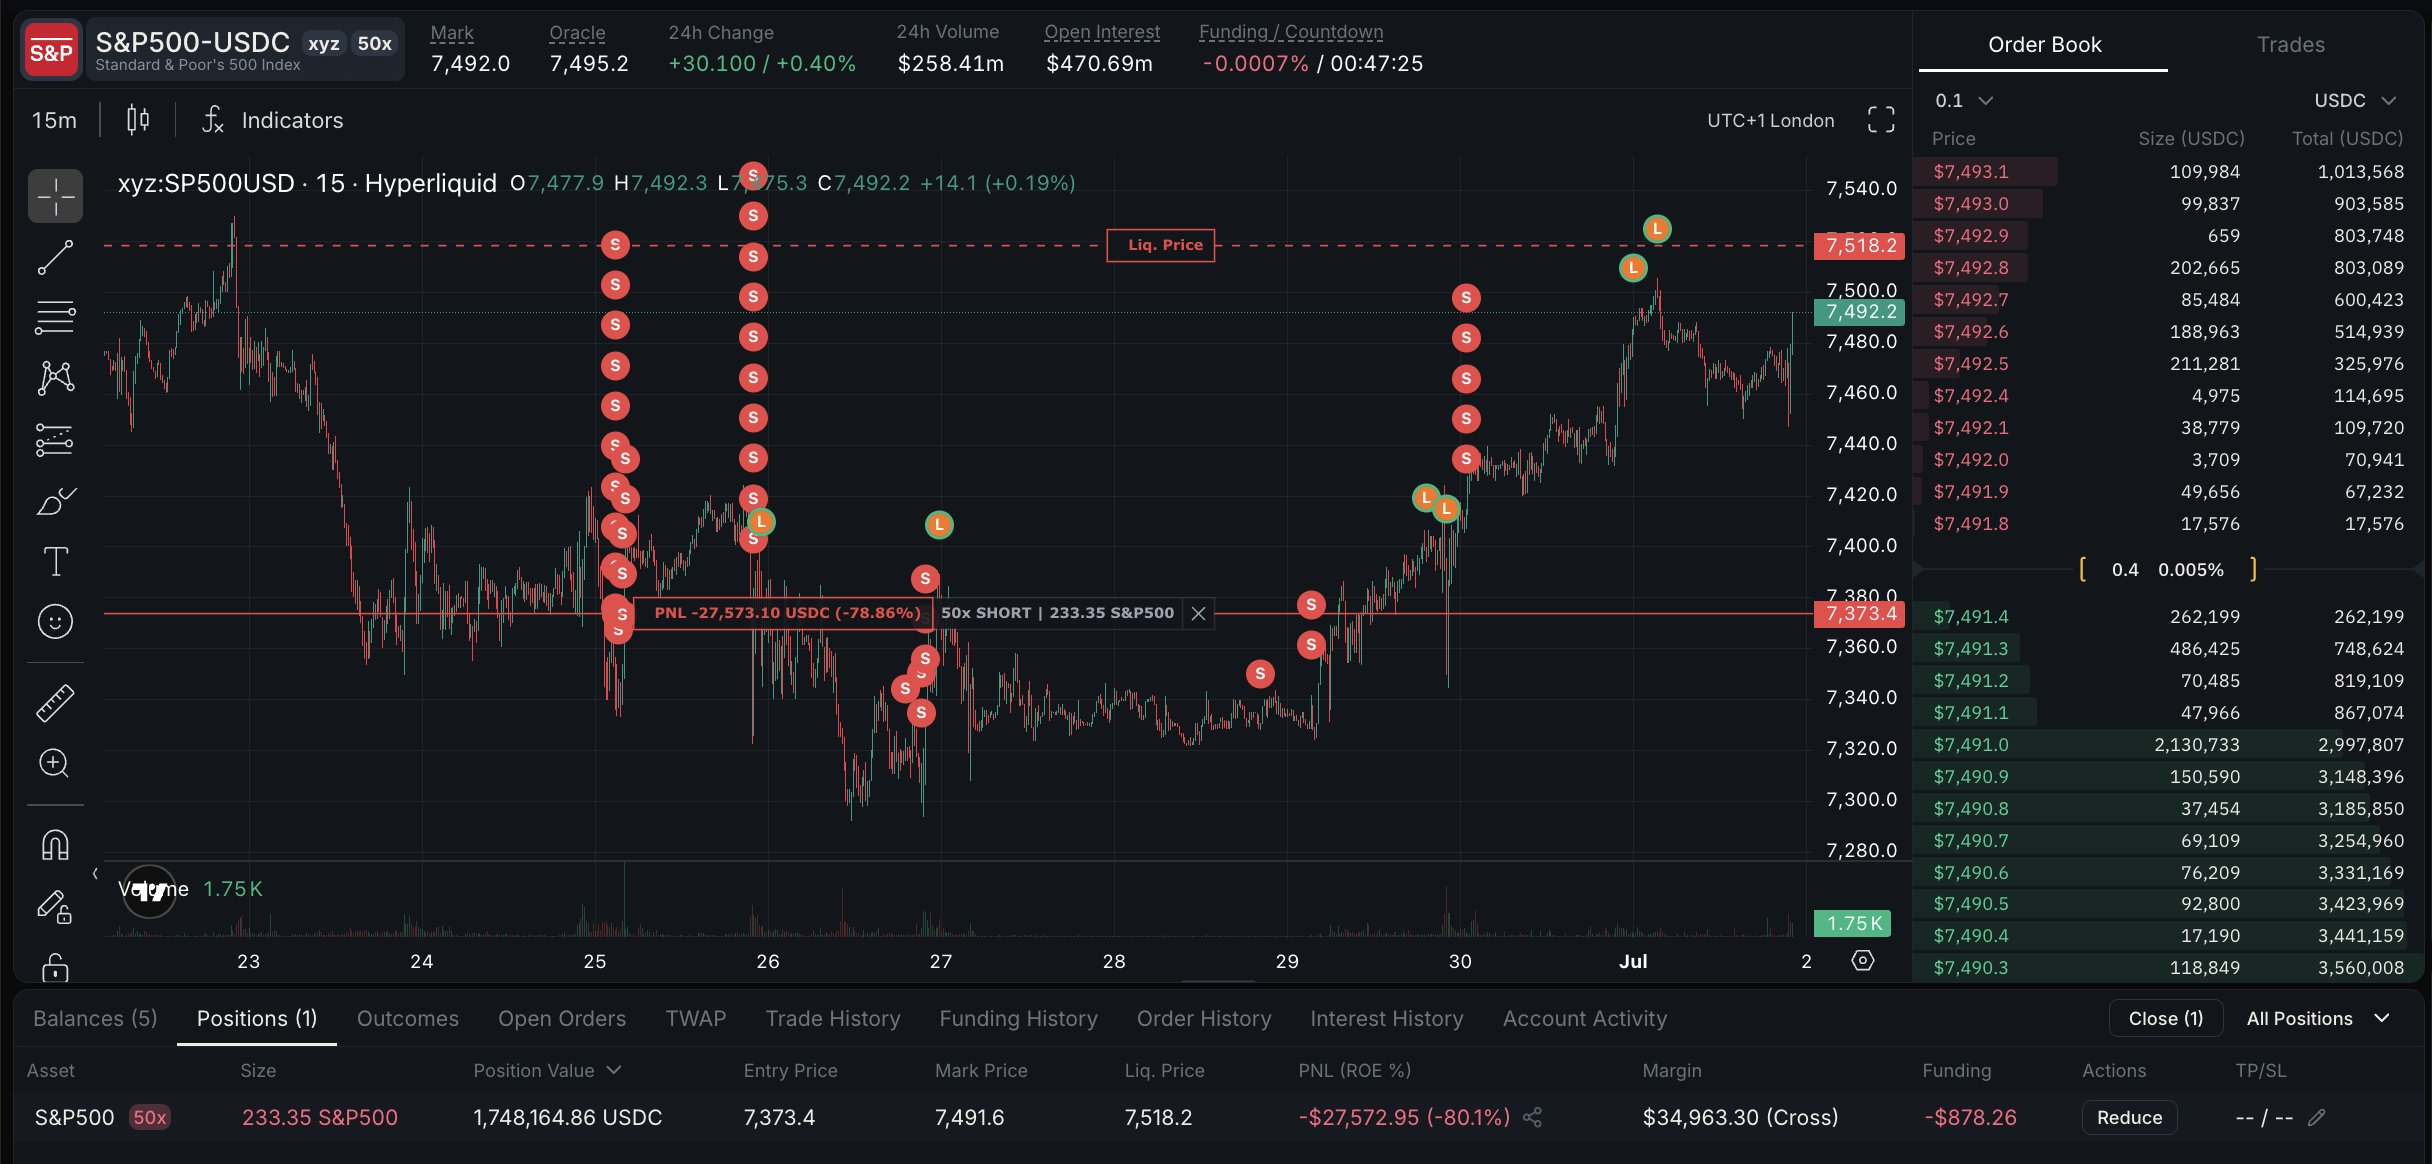
James Wynn has been liquidated twice in 24 hours for $982,000, this time shorting S&P 500 perpetual futures. The losses push his career tally past 200 liquidations.
On-chain intelligence firm Arkham flagged the losses on July 1. Another 0.35% rise in the index would end his remaining position.
From Crypto Blowups to S&P 500 Shorts
Wynn has not left Hyperliquid. Instead, his shift into traditional finance (TradFi) swaps Bitcoin (BTC) and meme coin bets for leveraged index perpetuals on the same exchange.
“JAMES WYNN LIQUIDATED FOR $1M IN TRADFI. James Wynn appears to have moved on from trading crypto, and is now shorting the S&P500 instead. He has been liquidated twice in the last 24 hours for a total of $982K. If the S&P500 rises 0.35% from here, he will be liquidated again,” Arkham indicated.
Follow us on X to get the latest news as it happens
The equity shorts extend a bearish stance from April. Back then, he outlined a defensive multi-asset strategy that included shorting US stocks.
Days later, a Bitcoin rally liquidated his 40x short. The blowup collapsed an account that once held $100 million to roughly $900.
A 2.5% rise was all it took. His new S&P 500 short leaves even less room for error.

James Wynn Liquidations Keep Climbing
Wynn entered April with 194 liquidations on record. Six more in two weeks pushed him past 200. One earlier streak, logged by Arkham, packed nine liquidations into two days and left his balance at $500.
The trader built his reputation by turning $7,600 into $25 million on the meme coin PEPE. From there, he moved to high-leverage perpetuals, where his profile remains publicly tracked.
He is not alone on Hyperliquid. Jeffrey Huang, known as Machi Big Brother, has logged 335 recorded liquidations. Meanwhile, Andrew Tate returned with a fresh 40x Bitcoin bet after 107 wipeouts of his own.
The pattern now travels across asset classes. In April, Bitcoin needed a 2.5% move to erase Wynn’s account. The S&P 500 needs just 0.35%.
The post After 200+ Crypto Liquidations, James Wynn Tries TradFi and Falls Flat appeared first on BeInCrypto.


Burning a token means destroying it on purpose, sending it to an address no one can open. Paired with a buyback, it becomes one of the most common tools a crypto project uses to manage supply and defend its price.
Summary
- A token burn permanently removes coins from circulation by sending them to a burn address, a wallet with no private key that can receive tokens but never send them, making the destruction irreversible and verifiable on-chain.
- Buyback-and-burn combines two steps: a project uses revenue or reserves to buy its own token on the open market, then burns what it bought, converting earnings into a permanent supply cut.
- The goal is scarcity. Fewer tokens spread across the same or growing demand can support the price, though a burn does nothing on its own if demand falls faster than supply.
- The idea comes from stock buybacks in traditional finance, but with a key difference: repurchased shares are usually held and can be reissued, while burned tokens are gone forever.
- Burns can also mislead, since a team can send tokens to a wallet it controls and call it a burn, so verifying the burn address and the on-chain record matters more than the announcement.
A token burn is one of the simplest ideas in crypto and one of the most misunderstood.
At its core, burning means destroying tokens on purpose, taking them out of circulation for good. Projects do it to shrink supply, and shrinking supply, all else equal, is meant to support the value of what remains. When a burn is paired with a buyback, where the project spends money to buy its own token before destroying it, the combination becomes a recurring engine that turns revenue into scarcity. This guide explains how a burn actually works, what buyback-and-burn does, how it compares with a stock buyback, why projects use it, and where it can mislead.
What a token burn actually is
Start with the mechanics, because they are more literal than the word suggests.
Nothing is set on fire. A token burn is a transaction that sends tokens to a burn address, also called an eater address or a null address, which is a wallet designed so that tokens can go in but never come out. A normal wallet has a private key, the secret that authorizes moving its contents. A burn address has no known private key, so anything sent to it is locked forever. Common examples include addresses that end in a long string of zeros or the recognizable “dead” address on Ethereum-style chains, and the so-called blackhole address on the BNB Chain.
Because blockchains are public, every burn is visible and permanent. Anyone can look up a burn address, see exactly how many tokens have been sent to it, and confirm they have left circulation. That transparency is part of the appeal: a burn is a provable, irreversible reduction in supply, not a promise. Once the tokens arrive at the burn address, the maximum and circulating supply figures for the project drop accordingly, and no team, exchange, or court can reverse it.
The permanence is the whole point. A burn is a one-way door. That is what separates it from simply moving tokens to storage, and it is why the burn address matters so much: if the destination can ever send tokens back, it was never a real burn.
What buyback-and-burn adds
A plain burn destroys tokens the project already holds. Buyback-and-burn adds a first step that makes the mechanism self-sustaining: the project spends money to buy its own token on the open market, then sends what it bought to the burn address. The two actions together turn a stream of income into a steady, permanent supply cut.
The buyback half matters for two reasons. First, it creates real buy-side demand, since the project is competing with everyone else to purchase the token, which can support the price directly through the purchase itself. Second, it ties the supply reduction to the project’s actual performance, because the more revenue a protocol generates, the more it can buy and burn. A well-designed program scales with success: rising fees mean more tokens bought and destroyed, which tightens supply exactly when the network is growing.
The funding source is the detail that separates a durable program from a marketing stunt. Buybacks paid for out of genuine protocol revenue or fees are sustainable, because they draw on money the network actually earns. Buybacks paid from a treasury or from external fundraising are finite, because that reserve can run dry. When you evaluate a buyback-and-burn, the first question is always where the money comes from.
Buyback-and-burn versus a stock buyback
The concept is borrowed from traditional finance, where public companies repurchase their own shares, so the comparison is worth drawing precisely. In a stock buyback, a company buys its shares on the market and absorbs them, reducing the number outstanding. This lifts earnings per share and can support the price, and it is a familiar way to return capital to shareholders.
The crucial difference is what happens next. Repurchased shares are usually held in the company treasury, where they can be reissued later for compensation, acquisitions, or fresh capital raises. They are removed from the float, but not necessarily destroyed. A token burn goes further: the bought-back tokens are sent to the burn address and can never return. The supply cut is absolute, not a temporary parking of shares that management could undo.
There is a second difference around certainty. Corporate buybacks are discretionary, decided by management and subject to change, so investors cannot be sure a program will continue. Many crypto buyback-and-burn programs run on pre-programmed smart contracts, which execute automatically according to fixed rules, removing the discretion. When a burn is coded into the protocol, holders can verify it will happen instead of trusting that it will. That automation and permanence are what crypto added to the old idea.
Why projects burn tokens
The headline reason is supply and demand. If the number of tokens falls while demand stays flat or grows, basic economics points toward upward pressure on price, because the same value is spread across fewer units. A burn is a lever on the supply side of that equation, and projects reach for it to support the value of the tokens still in circulation.
There are other motivations layered on top. A burn is a signal: a team spending real money to buy and destroy its token communicates confidence and a commitment to holders, which can improve sentiment beyond the mechanical supply effect. Burns also offset inflation. Many tokens issue new supply continuously to reward validators, stakers, or liquidity providers, and a burn can counteract that issuance, keeping net supply flat or even negative so that the rewards do not dilute holders into the ground. A project that emits new tokens and burns an equal or greater amount can market itself as deflationary, which many investors prize.
Finally, burns can serve housekeeping purposes: removing unsold tokens after a sale, correcting an oversupply from an early distribution, or cleaning up tokenomics that were set too loose at launch. In each case the underlying logic is the same, which is to bring supply into a healthier relationship with demand.
A worked example
Numbers make the mechanism concrete. Imagine a project with a circulating supply of 1 billion tokens trading at $0.10, giving a market cap of $100 million. The protocol earns fees and commits a portion to buyback-and-burn. Over a quarter, it uses revenue to buy 100 million tokens on the open market and sends them all to the burn address.
Two things happen. During the quarter, the buying itself adds demand, which tends to support or lift the price as the program competes for tokens. After the burn, the circulating supply drops from 1 billion to 900 million, a 10% reduction. If demand and market cap held steady at $100 million, the price per token would rise from $0.10 to about $0.111, because the same total value now divides across fewer coins. If demand also grew over the period, the effect compounds.
The example also shows the limit. If, over that same quarter, holders lost confidence and demand fell so that the market cap dropped to $81 million, the price would sit near $0.09 even after the burn, lower than where it started. The burn cut supply by 10%, but demand fell further, and price follows the balance of the two. A burn improves the supply side; it cannot rescue a token whose demand is collapsing.
Types of burn programs
Not all burns are the same, and the distinctions matter when you assess one. The first split is burn versus treasury buyback. A buyback-and-burn destroys the repurchased tokens permanently. A treasury buyback purchases tokens on the market but keeps them in the project treasury, where they remain outstanding and could be redeployed for incentives or investment later. Only the burn permanently reduces supply; the treasury version reduces the float temporarily.
The second split is the funding source. Revenue-funded and fee-funded burns draw on money the protocol actually earns, so they scale with adoption and are the most sustainable. Treasury-funded and externally funded burns draw on finite reserves and cannot continue indefinitely. The third split is manual versus automatic. Manual burns are decided by a team or a governance vote, offering flexibility but requiring trust. Automatic burns run on smart contracts at fixed intervals or thresholds, offering predictability that holders can verify.
A fourth category worth separating out is the fee burn, where a protocol destroys a portion of every transaction fee instead of buying tokens back. This is a different mechanism from buyback-and-burn, since there is no purchase step, but it achieves a similar deflationary effect by removing tokens with each use of the network. Knowing which type you are looking at tells you how durable and how trustworthy the supply reduction really is.
Notable examples
The most cited program is the one that popularized the model. The largest exchange token runs a quarterly buyback-and-burn funded by a share of exchange profits, with a stated goal of shrinking its supply substantially over time, and each burn is documented and verifiable on-chain. It became the template that many other projects copied.
More recent designs push the mechanism further. Some trading platforms route the large majority of their protocol fees into an on-chain fund that continuously buys and burns the native token, so the burn is tied directly to real usage and scales automatically with volume. Meme tokens have run burn campaigns that destroy a set portion of profits or a fixed amount into a public burn wallet, using the burns partly as a community rallying point. And some base-layer networks burn a portion of every transaction fee at the protocol level, so that heavy network use can make the token deflationary during busy periods. Each of these illustrates a different funding source and trigger, but all rest on the same core idea of provable supply reduction.
When burns mislead
This is the part that matters most for protecting yourself, because a burn is easy to fake in appearance if not in substance. The most common trick is a team announcing a burn while sending tokens to a wallet it secretly controls rather than to a true burn address. Nothing is destroyed; the tokens are simply moved, and they can be sold later. Verifying that the destination is a genuine, keyless burn address, and not just an unfamiliar wallet, is the difference between a real burn and theater.
Burns can also be used to hide concentration. A project might burn tokens to make the remaining distribution look less concentrated, masking how much supply a few insiders still hold. And burns are sometimes deployed purely as marketing, timed to generate a price pop and attention rather than to reflect any sustainable program, with no revenue behind them and no plan to continue. A large one-time burn with no ongoing funding is a very different thing from a revenue-funded program that runs every quarter.
The deeper limitation is the one the worked example showed: scarcity is not value. Reducing supply supports price only if demand holds. A token with a shrinking supply and no users, no utility, and no demand will still decline because there is nothing on the other side of the equation. A burn is a tool, and like any tool it can be used well, used carelessly, or used to deceive. The on-chain record, the funding source, and the presence of real demand are what separate the three.
Burns versus locks and vesting
One of the most useful habits when you read tokenomics is separating a burn from the mechanisms that only look like supply reduction. A burn permanently removes tokens. A lockup and a vesting schedule do something very different: they delay when tokens reach the market without removing them at all. Confusing the three is a common way to misjudge how much real supply pressure a token faces.
A lockup holds tokens in a contract that releases them at a set time. Team allocations, investor allocations, and rewards are often locked for months or years, which keeps them out of circulation for now but not forever. When the lock ends, those tokens unlock and can be sold, adding supply exactly when the schedule dictates. Vesting is the same idea spread over time, releasing a locked allocation in steady increments instead of all at once. Neither reduces the eventual supply; both simply push it into the future. A token can look tight today and face heavy unlocks next quarter, and only reading the vesting schedule reveals it.
A burn is the opposite. The tokens are gone, so they can never unlock, never vest, and never hit the market. That permanence is why a burn and an unlock are worth watching together: a project might burn a headline number while a far larger allocation sits waiting to vest, so the net supply is still climbing. The burn grabs attention; the unlock schedule determines what actually happens to supply. A serious read of any token weighs burns against pending unlocks to see where net supply is heading, not just at the burned figure in isolation.
There is a further wrinkle around circulating versus total supply. A burn reduces both, since destroyed tokens leave the maximum forever. A lockup reduces circulating supply for now but leaves total supply unchanged, because the tokens still exist and will circulate later. Projects sometimes lean on the lower circulating figure to make a token look scarcer than it is, while a large locked allocation waits in the background.
Checking total supply and the unlock calendar alongside any burn is what keeps you from mistaking a delay for a reduction.
The practical takeaway is a short checklist. When a project touts a burn, confirm the tokens went to a real burn address, find the funding source behind it, and then look at what is locked and vesting on the other side of the ledger. A revenue-funded burn running against a light unlock schedule is a genuinely tightening supply. A one-time burn running against heavy upcoming unlocks is a headline masking the opposite. The burn is only half the picture, and the locks and vesting are the half that projects prefer you skip.
Frequently Asked Questions
What does it mean to burn a token?
Burning a token means permanently removing it from circulation by sending it to a burn address, a wallet with no private key that can receive tokens but never send them. Because the address cannot be opened, the tokens are locked forever. Every burn is recorded on the blockchain, so anyone can verify that the supply has been reduced.
What is a burn address?
A burn address, also called an eater or null address, is a wallet with no known private key. Normal wallets use a private key to authorize moving funds, but a burn address lacks one, so any tokens sent to it can never be moved again. Common examples include addresses ending in many zeros or a recognizable “dead” address, and the blackhole address on some chains.
How does buyback-and-burn work?
Buyback-and-burn is a two-step process. First, the project uses revenue or reserves to buy its own token on the open market, which adds real buying demand. Second, it sends the tokens it bought to a burn address, permanently reducing supply. Together, the steps convert the project’s income into a lasting supply cut that scales with how much revenue it generates.
How is a token burn different from a stock buyback?
A stock buyback repurchases shares and usually holds them in the company treasury, where they can be reissued later, so the reduction can be temporary. A token burn destroys the tokens at a burn address, making the supply cut permanent and irreversible. Many crypto burns also run automatically on smart contracts, while corporate buybacks are discretionary decisions by management.
Does burning tokens always raise the price?
No. A burn reduces supply, which can support the price if demand holds or grows, but it cannot lift a token whose demand is falling. If confidence drops and demand declines faster than supply, the price can fall even after a large burn. Scarcity supports value only when there is real demand on the other side of the equation.
Why do projects burn their own tokens?
Projects burn tokens to support price through scarcity, to signal confidence and commitment to holders, and to offset the new supply issued as staking or liquidity rewards, keeping the token from inflating. Burns are also used for housekeeping, such as removing unsold tokens after a sale or correcting an oversupply set at launch. The common goal is a healthier balance between supply and demand.
Can a token burn be faked?
Yes. A team can announce a burn while sending tokens to a wallet it secretly controls instead of a true burn address, so nothing is actually destroyed and the tokens can be sold later. Burns can also mask holder concentration or serve purely as marketing to spark a price pop. Verifying that the destination is a genuine keyless burn address on-chain is essential.
What is the difference between buyback-and-burn and a fee burn?
Buyback-and-burn has a purchase step: the project buys tokens on the market, then destroys them, using revenue or reserves. A fee burn has no purchase step; instead, the protocol destroys a portion of every transaction fee automatically as the network is used. Both reduce supply, but the fee burn scales directly with network activity rather than with a funded buyback program.
Disclaimer: This article is for information and educational purposes only and does not constitute financial, investment, or trading advice. Cryptocurrency prices are volatile, and mechanisms such as token burns do not guarantee any price outcome. Nothing here is a recommendation to buy or sell any asset. Always do your own research and consider consulting a licensed professional before making financial decisions.
Information is accurate as of July 1, 2026, and may change.
The Bitcoin Power Law, the model physicist Giovanni Santostasi has championed for over a decade, is now peer-reviewed science. The new study argues Bitcoin’s (BTC) long-term price growth follows a predictable mathematical trend rooted in network adoption.
Elsevier’s journal Nonlinear Science published the study online on June 29. Analyst Benjamin Cowen quickly joined the congratulations.
From Reddit Post to Peer-Reviewed Science
Santostasi, a former physics professor who spent years researching gravitational waves, first sketched the idea in a 2014 Reddit post. He noticed Bitcoin’s price climbing along a strikingly straight line when plotted on logarithmic scales.
For years, the theory lived on social media and community charts, which Santostasi expanded into a 2024 Medium essay. Critics dismissed it as curve fitting, the same charge leveled at Bitcoin’s famous rainbow chart.
Academics had connected Bitcoin’s value to network size before. Timothy Peterson published a Metcalfe’s Law analysis in 2018, and a Royal Society study followed in 2019. However, both treated Bitcoin’s growth rate as a number fitted to data, not one the math itself predicts.
That gap is what Santostasi and co-author Stephen Perrenod claim to close. They defended the model before independent reviewers, and the journal accepted it.
“Achievement unlocked! Power Law paper published. Thank you for all your support and constuctive criticism along the way,” Santostasi wrote in a post on X.
Follow us on X to get the latest news as it happens
Cowen, a nuclear engineering PhD who founded analytics firm Into The Cryptoverse in 2019, publicly congratulated him days later.
What the Bitcoin Power Law Study Found
The paper analyzed 5,696 daily Bitcoin prices from July 2010 through February 2026. Across that stretch, one steady mathematical curve, known as a power law, explains about 96% of the price’s long-run variation.
The authors trace the pattern to two simple forces:
- New users join Bitcoin in accelerating waves.
The same growth shape documented in a 1989 study of the US AIDS epidemic.
- The network gains value as each newcomer connects with everyone already inside.
Multiplied together, those two effects predict almost exactly the growth rate Bitcoin has shown for 15 years. The prediction lands within 1.6% of the measured figure.
Speculation still matters, the authors argue. However, booms and busts wash in and out around the trend instead of driving it. The paper also lists conditions that would break the model, keeping the theory testable.
Can the Model Survive the Bear Market?
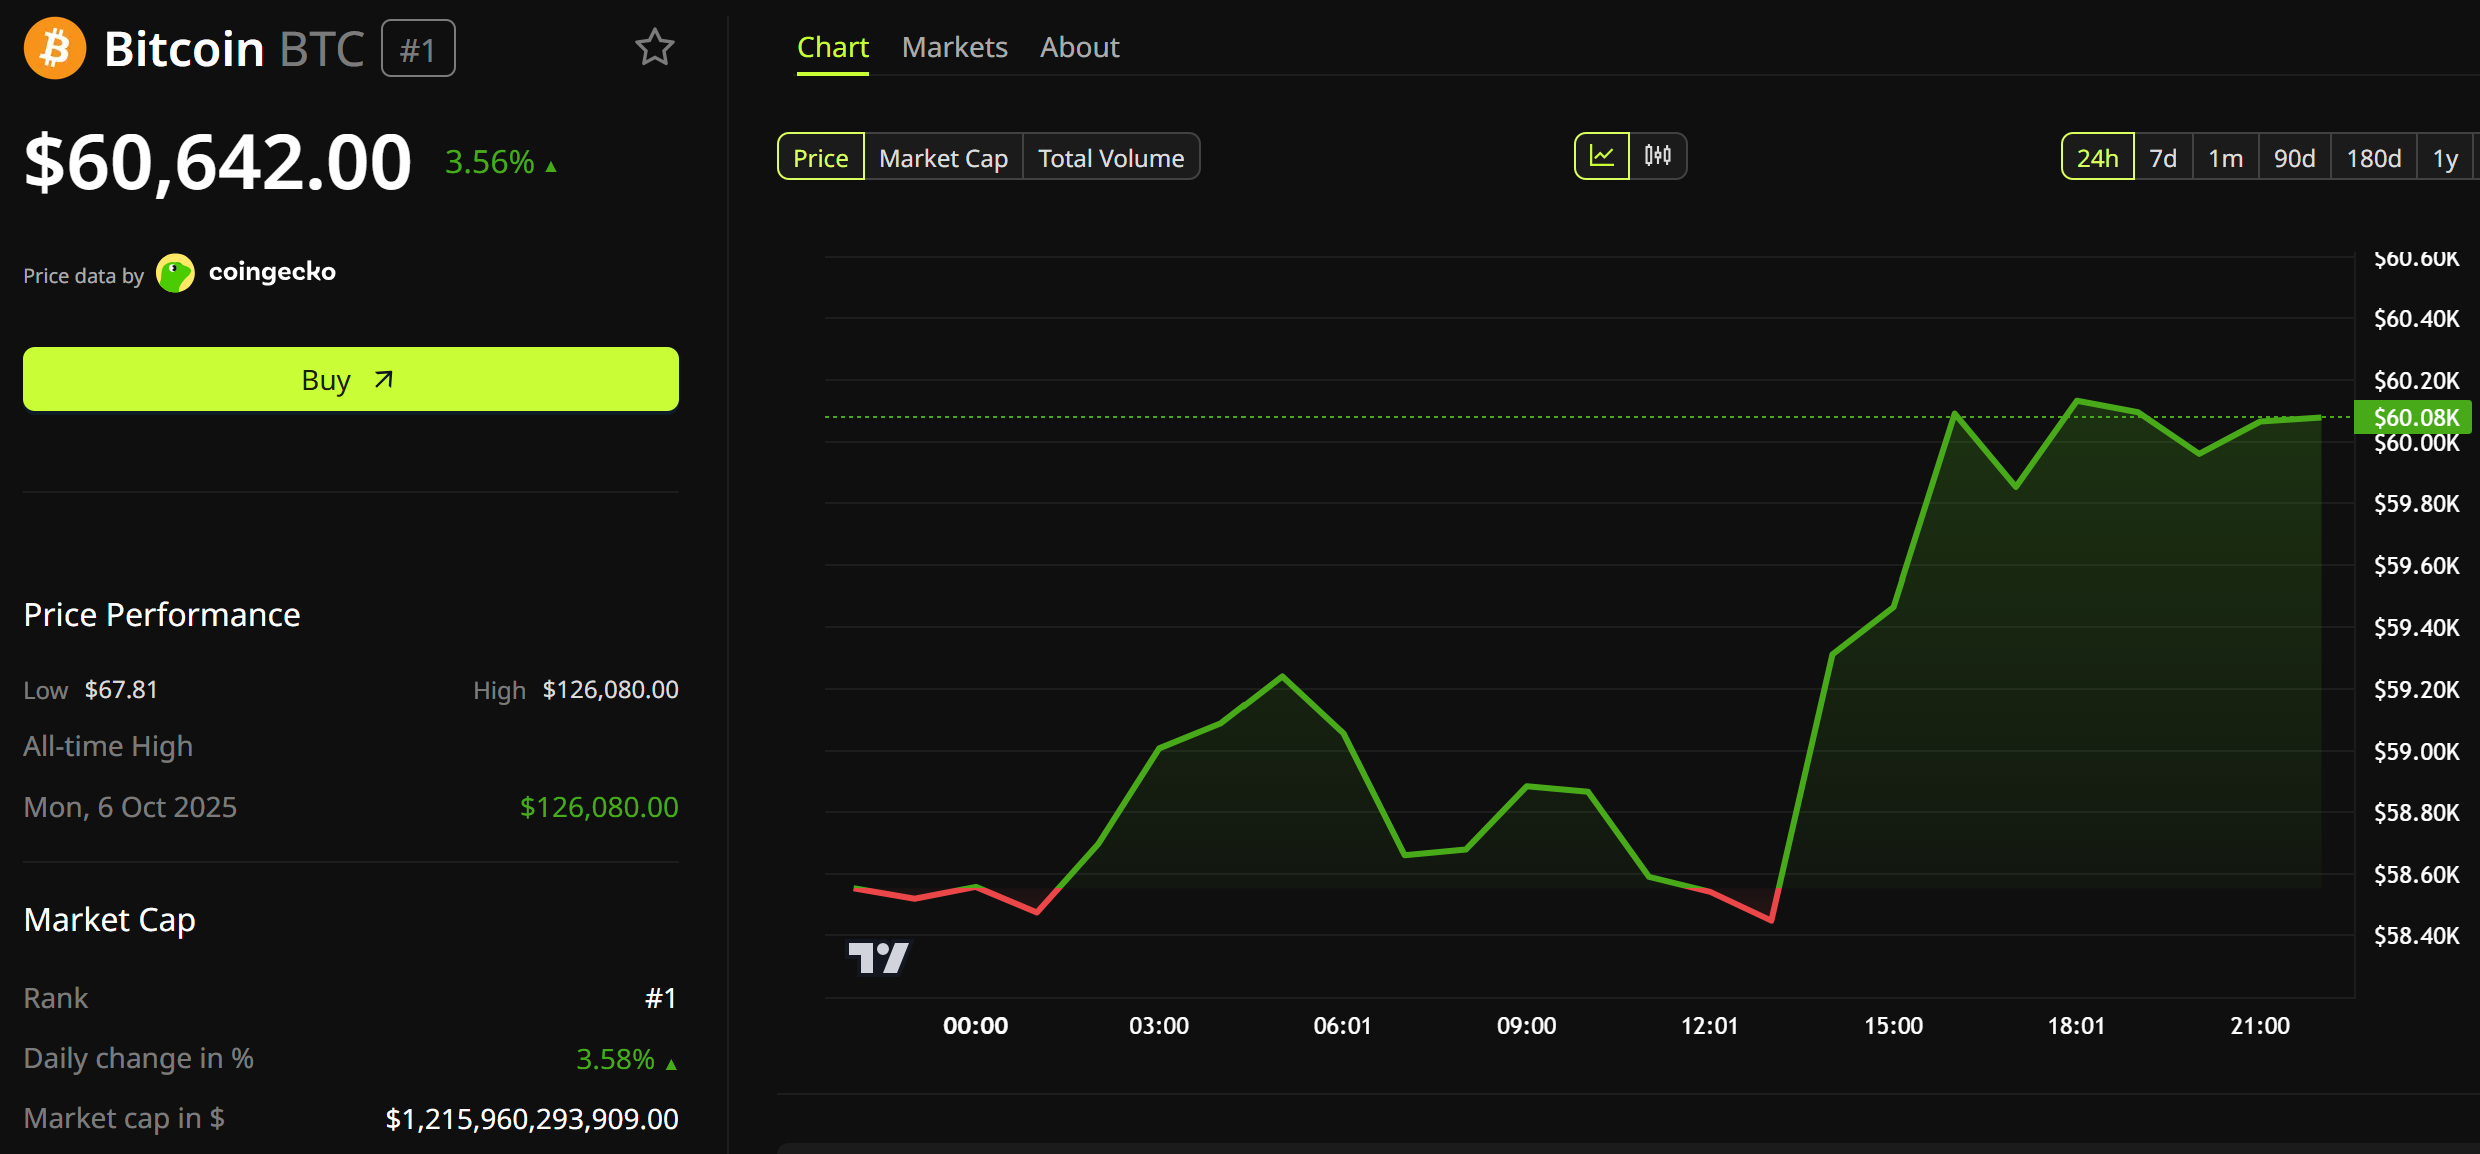
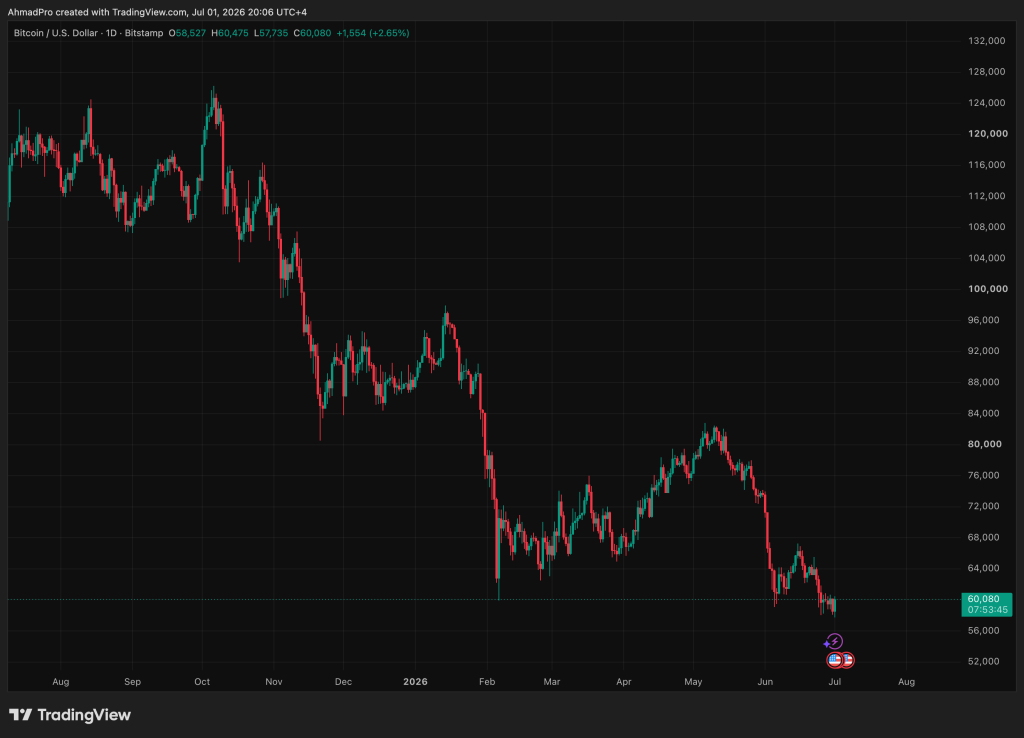
The timing adds intrigue. Bitcoin trades near $60,642, according to BeInCrypto Markets data. That is 43% lower over the past year and 52% below its October 2025 record of $126,080.

Other popular frameworks have struggled in this downturn. Stock-to-flow has broken down, while Standard Chartered and Galaxy Digital stake out floors of $59,000 and $40,000 in the Bitcoin bottom debate.
Cycle-based tools face similar questions. The 500-day halving rule still points to a buy window in November 2026, while Coinbase CEO Brian Armstrong defends the 4-year cycle.
The paper offers a direct answer to the survival question. Every earlier bear market stayed within the model’s normal range of swings. Stability tests found no structural breaks between 2011 and 2026.
The authors also identify five conditions that would break the trend, each with measurable early signs:
- Floor violation (F1) — price falls more than 3 standard deviations below the trend line and stays there over a year. In 2025 terms, that floor was roughly $10,000.
- Adoption collapse (F2) — address growth slows sharply below its cubic rate in rolling estimates, e.g., if a rival network starts absorbing Bitcoin’s marginal adopters.
- Exponent drift (F3) — the growth exponent drifts outside the 5.0–7.0 band over a multi-year period.
- Metcalfe breakdown (F4) — price and address count decouple (Metcalfe fit R² sustained below 0.7), meaning the market stops pricing Bitcoin as a network good.
- R² collapse (F5) — the rolling 3-year fit of the price power law drops below 0.80 for two consecutive years.
However, the study’s data ends in February 2026, leaving the latest slide outside it. A peer-reviewed trend line does not guarantee future returns, and the authors avoid price targets.
That gap makes this bear market the Bitcoin Power Law’s first live test as published science.
Subscribe to our YouTube channel to watch leaders and journalists provide expert insights
The post Bitcoin Power Law Goes Peer-Reviewed: Will the Model Survive the Bear Market? appeared first on BeInCrypto.

Key Highlights
- Amazon’s repositioned June Prime Day event (June 23–26) delivered record-breaking online sales totaling $26.4 billion, marking a 9% increase year-over-year
- Consumer electronics and clothing categories dominated sales, featuring promotional discounts reaching 24% and 20% respectively
- Buy now, pay later transaction volume climbed 10%, accounting for 6.6% of overall orders (approximately $2.1 billion)
- Goldman Sachs recommends accumulating hyperscaler stocks, including AMZN, ahead of the upcoming earnings cycle
- The hyperscaler index has retreated 17% from its June 1 peak, while AMZN maintains a consensus Strong Buy with analysts targeting $318.21 on average
Shares of Amazon (AMZN) advanced 1.68% during Tuesday’s trading session following confirmation that its June Prime Day shopping event achieved record-breaking online sales of $26.4 billion — representing a 9% year-over-year increase compared to 2025’s equivalent event.
The promotional event spanned four days, from June 23 through June 26, marking a departure from Amazon’s traditional July timing. Adobe Analytics monitored transaction data throughout the period, noting that final results aligned closely with industry projections.
Consumer electronics emerged as the standout category, benefiting from promotional discounts that reached as high as 24%, which fueled robust purchasing activity. Clothing items, home appliances, and children’s toys also performed exceptionally well, with price reductions extending up to 20%.
The buy now, pay later payment option continued gaining traction among shoppers. BNPL transaction volume during the Prime Day period increased 10% compared to the prior year, comprising 6.6% of total online transactions, which translates to approximately $2.1 billion in payment volume.
For context, Prime Day’s performance is rapidly approaching holiday shopping levels. The four-day event’s $26.4 billion in sales compares favorably against the $32.45 billion generated during the combined Black Friday and Cyber Monday period of the 2025 Thanksgiving shopping weekend.
Amazon strategically shifted its annual summer shopping event from July to June this year. This timing adjustment serves dual strategic objectives: accelerating revenue generation while simultaneously reducing warehouse inventory levels before entering the year’s second half.
Goldman Sachs Identifies Strategic Entry Point
In a separate development, Goldman Sachs issued a recommendation on July 1 advocating for strategic accumulation of U.S. hyperscaler stocks during the current pullback. The hyperscaler index has declined 17% from its June 1 peak, sliding from 122.89 down to 102.46.
Goldman’s investment thesis centers on sustained earnings momentum: fundamental profitability for these technology companies continues expanding. Should companies like Amazon demonstrate revenue acceleration linked to artificial intelligence infrastructure investments during forthcoming quarterly reports, analysts anticipate rapid multiple expansion and price recovery.
Amazon currently trades at a P/E multiple of 29.05x — representing a premium valuation justified by its GF Score of 94 out of 100. This composite metric reflects exceptional ratings across financial strength, profitability metrics, and growth characteristics.
Analyst Community Perspective
The analyst community maintains overwhelming conviction on Amazon shares. The stock holds a consensus Strong Buy designation based on ratings from 46 Wall Street analysts — comprising 45 Buy recommendations and one Hold rating issued during the most recent three-month period.
The consensus price objective of $318.21 suggests potential upside of approximately 20% from present trading levels.
One consideration for investors: company insiders have divested $51.6 million in AMZN shares during the previous three months, with no offsetting insider purchases recorded. While insider selling at major corporations often reflects portfolio diversification and personal financial planning rather than business concerns, the transaction volume warrants acknowledgment.
Amazon’s current market capitalization approaches $2.61 trillion. The company’s revenue composition shows retail operations generating roughly 74% of total revenue, with Amazon Web Services contributing 17% and the advertising segment adding 9%.
With second-quarter earnings reports on the horizon and Prime Day performance now confirmed, investor focus shifts to Amazon’s upcoming financial disclosure and management commentary on business momentum.
Crypto World
Bitcoin Price Prediction: An Analyst Just Called for Bitcoin to Drop to $40,000, And the Chart Is Not Helping the Bull Case

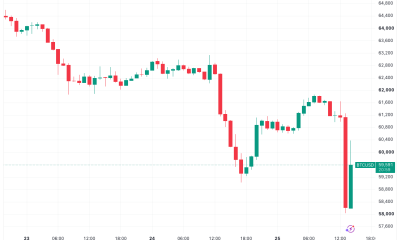
Bitcoin price is holding an uneasy line near $60,000, roughly 52% below its all-time high of ~$126,000 set late last year, and the prediction debate over what comes next is getting loud.
The question traders are actually asking right now isn’t whether a recovery is coming, but whether the bottom is already in or still $10,000–$20,000 lower. One number keeps surfacing in the bearish camp: $40K.
CNBC reported that Zacks strategist John Blank put a $40,000 downside target on BTC, framing the move through the lens of a prolonged crypto winter، a pattern-derived call that implies roughly 33% further downside from current levels.
Separately, cycle analysts tracked by Mudrex have flagged a $50,000–$55,000 window as the highest-probability cyclical low, expected in the Q3–Q4 2026 timeframe. The macro backdrop isn’t helping: BTC dropped ~18% in June alone, and weekly volatility has been sustained and punishing.

Macro conditions are shifting simultaneously، Supreme Court rulings on Fed independence, tech stocks near six-month highs, and a US-Iran ceasefire lifting risk sentiment، yet BTC is not participating. That divergence from traditional risk assets deserves a closer look.
Bitcoin Price Prediction: Can Bitcoin Price Hold $60K or Is a Flush to $40K Next?
Bitcoin price is trading near $60,000, down approximately 18% month-over-month with cycle analysts split on what comes next.
The immediate line in the sand is $58,000. A decisive close below it risks accelerated selling toward the mid-$50,000s, with $50,000 to $55,000 as the next structural support band.
On the upside, the 50-month EMA near $65,600 is what bulls need to reclaim. A monthly close above it represents meaningful trend repair. Until that happens the macro structure remains bearish. Resistance clusters around $65,000 are capping every relief rally.
If $58,000 holds, ETF inflows accelerate, and BTC reclaims the $65,600 EMA, recovery targets reach $98,000 to $106,000 on the next leg.
If neither side takes decisive control, Bitcoin consolidates between $58,000 and $65,000 through Q3 2026, with a gradual bottoming process supported by corporate treasury demand and spot ETF capital. A break below $58,000 extends selling pressure toward the $40,000 to $50,000 range flagged by pattern analysts, pushing the cycle low into late 2026.
The Federal Reserve is the macro catalyst most likely to shift this range. A credible pivot toward rate cuts would be the single most supportive external variable for Bitcoin right now. ETF flow data in the coming weeks will signal whether institutional demand is absorbing this correction or stepping aside entirely.
Bitcoin Hyper Targets Early Mover Upside as Bitcoin Tests Key Levels
BTC at $60,000, down 52% from its peak, is a painful place to sit. Waiting for a confirmed bottom at $50,000 or below means holding unrealized losses or cash while the next cycle clock runs.
Some traders are rotating early-stage capital into infrastructure plays that have not been priced yet.
Bitcoin Hyper is one pulling attention in the current rotation. The project positions itself as the first Bitcoin Layer 2 with Solana
Virtual Machine integration, meaning smart contract execution at sub-Solana latency built directly on Bitcoin’s security layer. Bitcoin’s trust model combined with Solana-grade throughput is a technically meaningful combination that nothing else currently offers.
The presale has raised $32.9 million at a current price of $0.0136824. Staking is available for presale participants and a Decentralized Canonical Bridge handles native BTC transfers across chains.
Early-stage presales carry significant risk. Liquidity, execution, and token unlock dynamics all apply. But for traders doing their own research during a Bitcoin consolidation phase, Bitcoin Hyper is worth adding to the watchlist.
Visit Bitcoin Hyper HERE is worth adding to the watchlist.
The post Bitcoin Price Prediction: An Analyst Just Called for Bitcoin to Drop to $40,000, And the Chart Is Not Helping the Bull Case appeared first on Cryptonews.
World launched on July 1 as an onchain prediction market on Solana (SOL), live in Phantom Wallet and using Chainlink oracles to automatically settle trades in the CASH stablecoin.
Its debut adds a Solana-native challenger to a sector Polymarket and Kalshi already lead, where volumes have hit records.
How World Works Inside Phantom
World operates as a non-custodial protocol rather than a traditional exchange. It routes orders to liquidity providers on Solana and does not hold user funds or run the markets itself. Traders keep positions in their own wallets as tokens until they choose to cash out.
Settlement runs through Chainlink Data Streams and its runtime environment, which feed prices and resolve outcomes with limited human involvement. Winning positions redeem automatically in CASH, a Solana stablecoin.
At launch, World lists short-duration Bitcoin (BTC) up-or-down contracts and markets on the 2026 FIFA World Cup. The debut lands as Solana runs hot.
Solana’s SOL token rose more than 5% on the day and about 16% over the week, according to BeInCrypto data.

The team plans to add sports, politics, and macro markets through July.
World Replaces Kalshi in the Wallet
The launch is the public reveal of infrastructure that has quietly run for weeks. Phantom offered Kalshi-powered markets through a DFlow integration from December 2025. It then switched to World for all positions opened on or after June 1.
Under the old setup, traders redeemed winning positions themselves, whereas World settles them automatically once an event ends.
That switch matters because Phantom reaches roughly 20 million users, giving World immediate distribution without a separate app. Kalshi, meanwhile, remains a formidable rival and is reportedly weighing a $40 billion valuation.
Before the reveal, the project ran a stealth campaign built around a glowing globe and the tagline “Trade Everything.” It even told followers there was “no product.”
“Prediction markets are one of the most powerful applications you can build on a high-performance blockchain. World is designed to show what Solana makes possible: real-time markets, onchain settlement, and a user experience that meets people where they are,” Pedro Miranda, Head of Consumer at the Solana Foundation, said in the launch announcement.
Follow us on X to get the latest news as it happens
Can World take on Polymarket and Kalshi?
The incumbents carry moats World has not built. Polymarket proved the model in 2024, when more than $3 billion traded on its US presidential market. It has since expanded onto Solana through a February integration with Jupiter, contesting the same turf World now claims.
Their regulatory paths diverge sharply. Kalshi is a US-regulated exchange that beat the CFTC in court in 2024 to list election contracts. Polymarket took the opposite route, paying a $1.4 million CFTC penalty in 2022 that forced it offshore for years.
World sidesteps both, running as a permissionless onchain protocol with no license and no gatekeeper.
That freedom cuts two ways. The non-custodial model removes intermediaries, but it also forgoes the oversight and protections that anchor a regulated venue like Kalshi.
World has not published volume or liquidity figures, so its trading power stays unproven. Prediction markets reward deep books, which produce tighter spreads and steadier pricing. Distribution can pull in users fast, but that kind of depth takes time to build.
Sector momentum still helps, with prediction market open interest hitting a record $1.48 billion in June.
An unaffiliated memecoin using the World name sparked speculation on Pump.fun, though the team confirmed there is no link to it.

World’s case rests on distribution and instant onchain settlement, not proven scale. The World Cup becomes the first real test of whether embedded access inside Phantom turns into lasting liquidity.
The post Solana Prediction Market World Goes Live: Can It Take on Polymarket and Kalshi? appeared first on BeInCrypto.
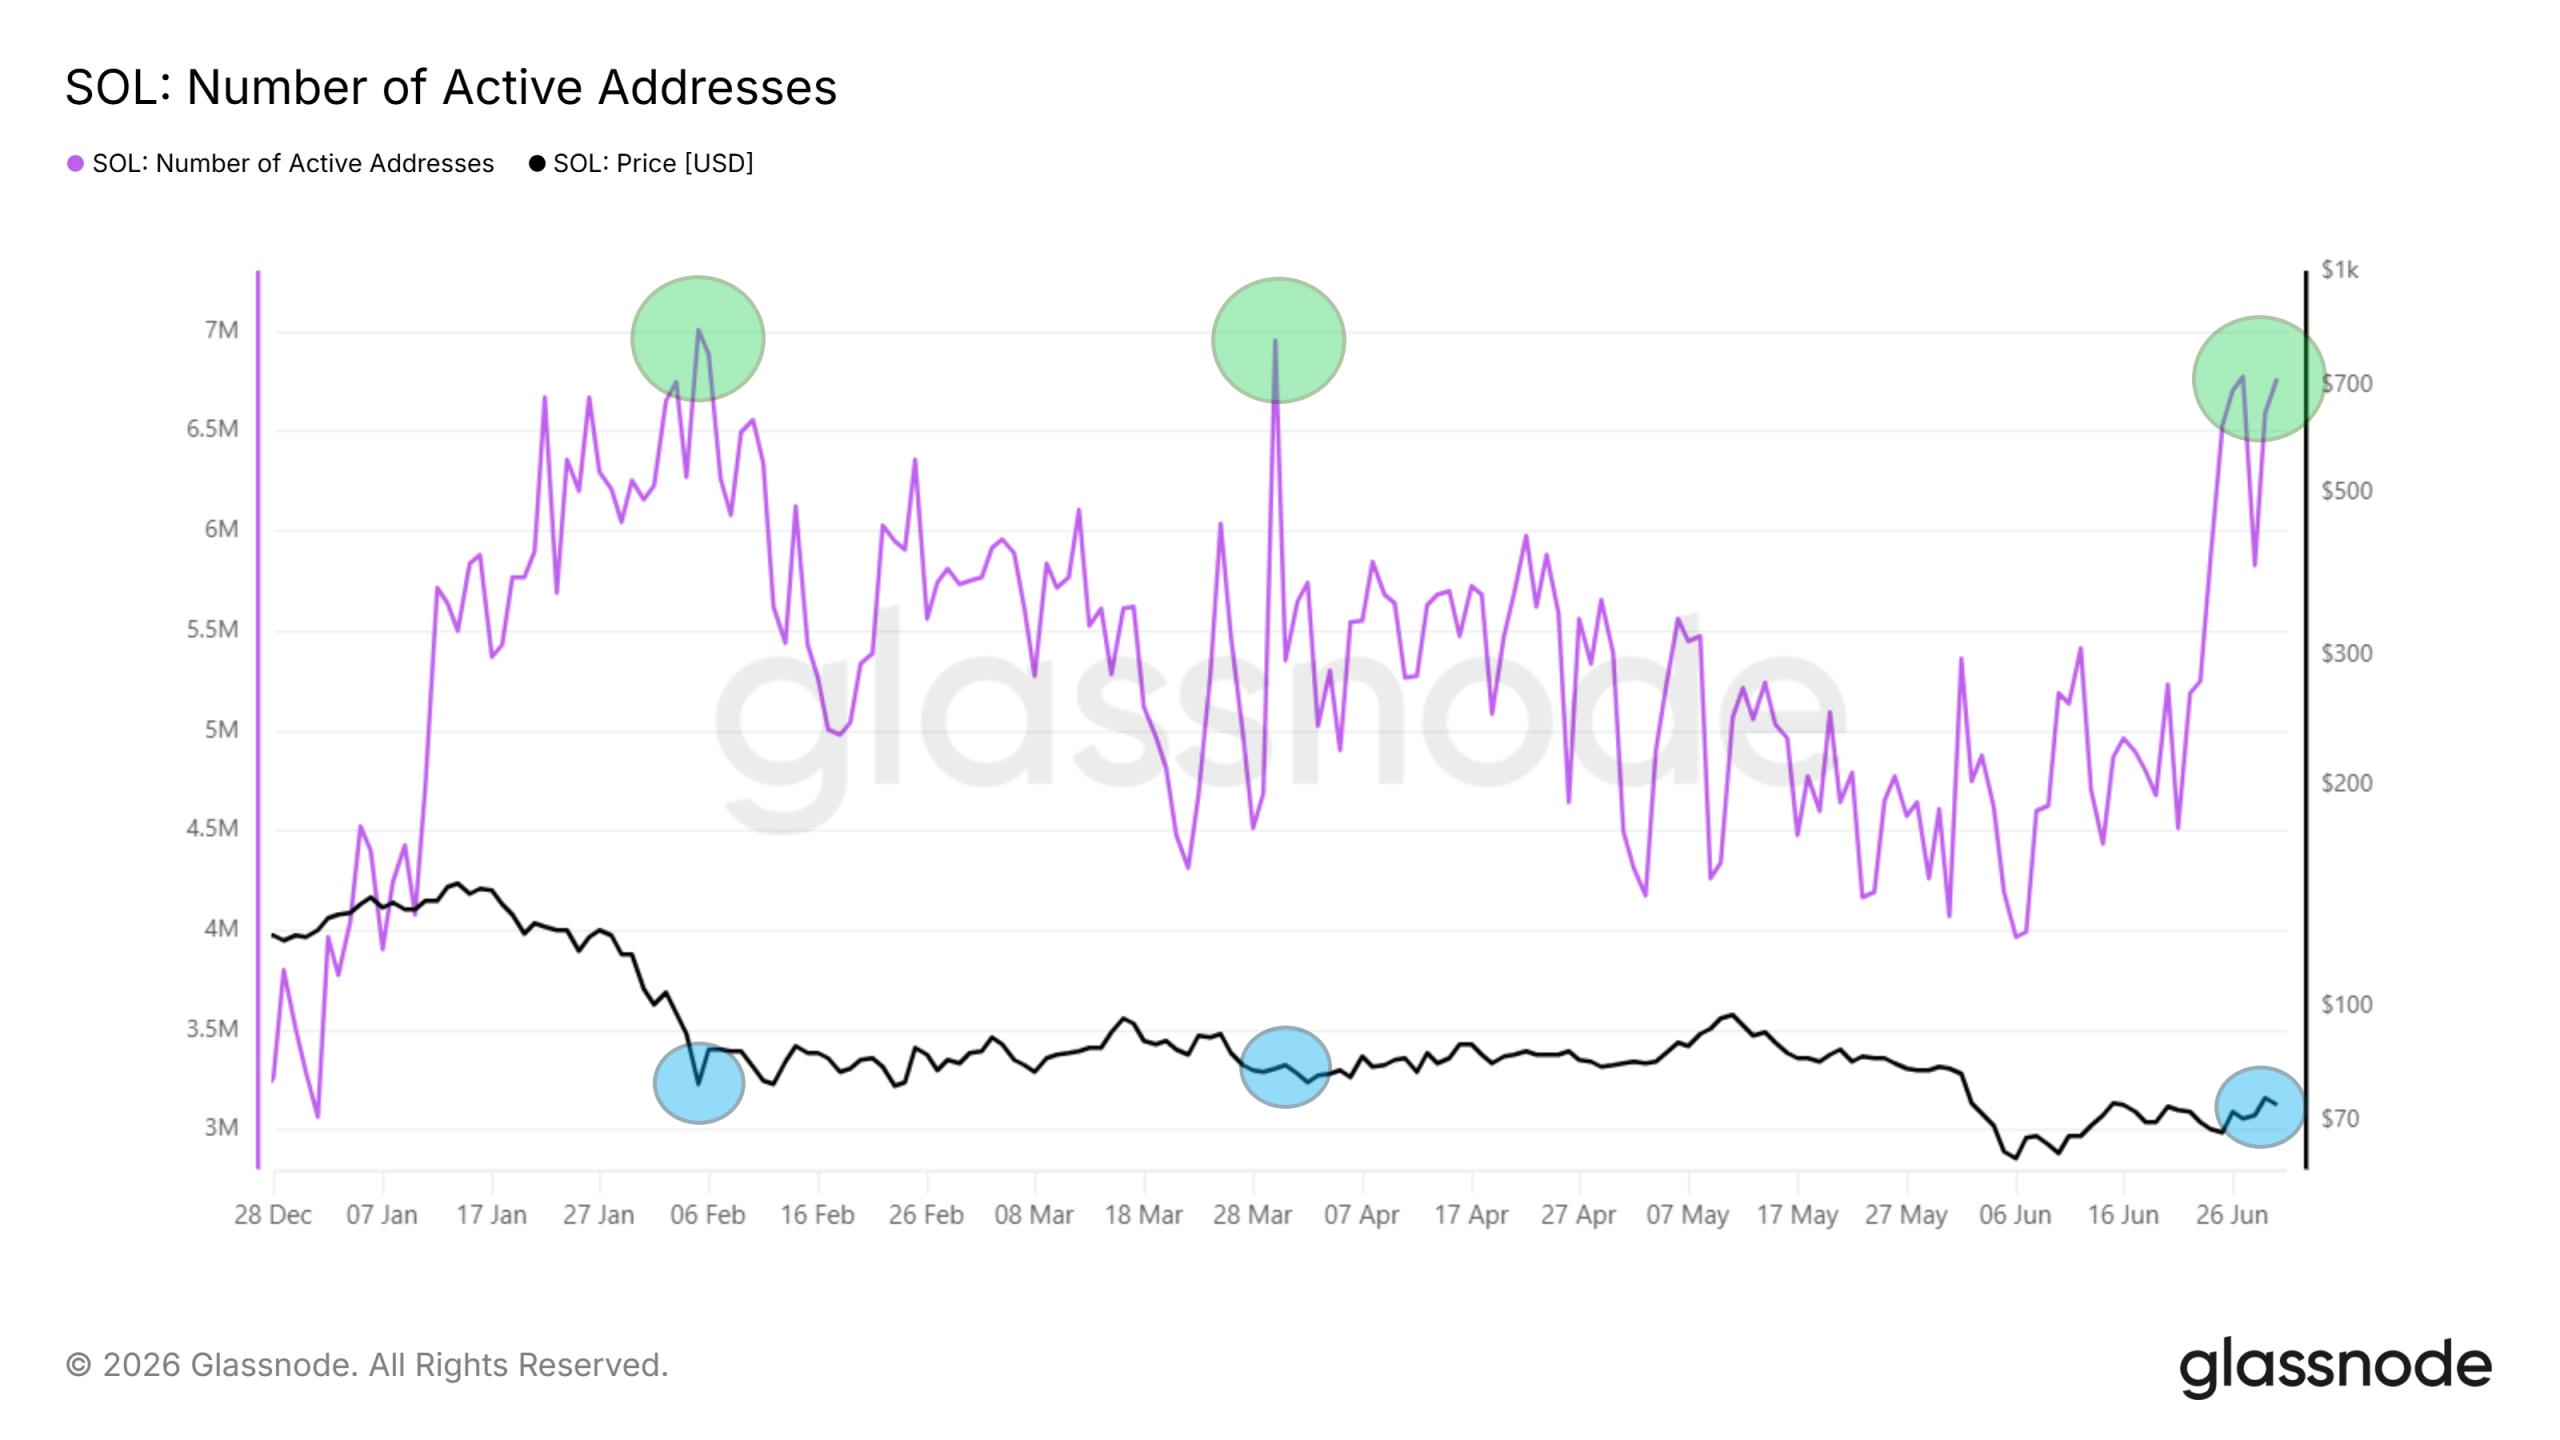
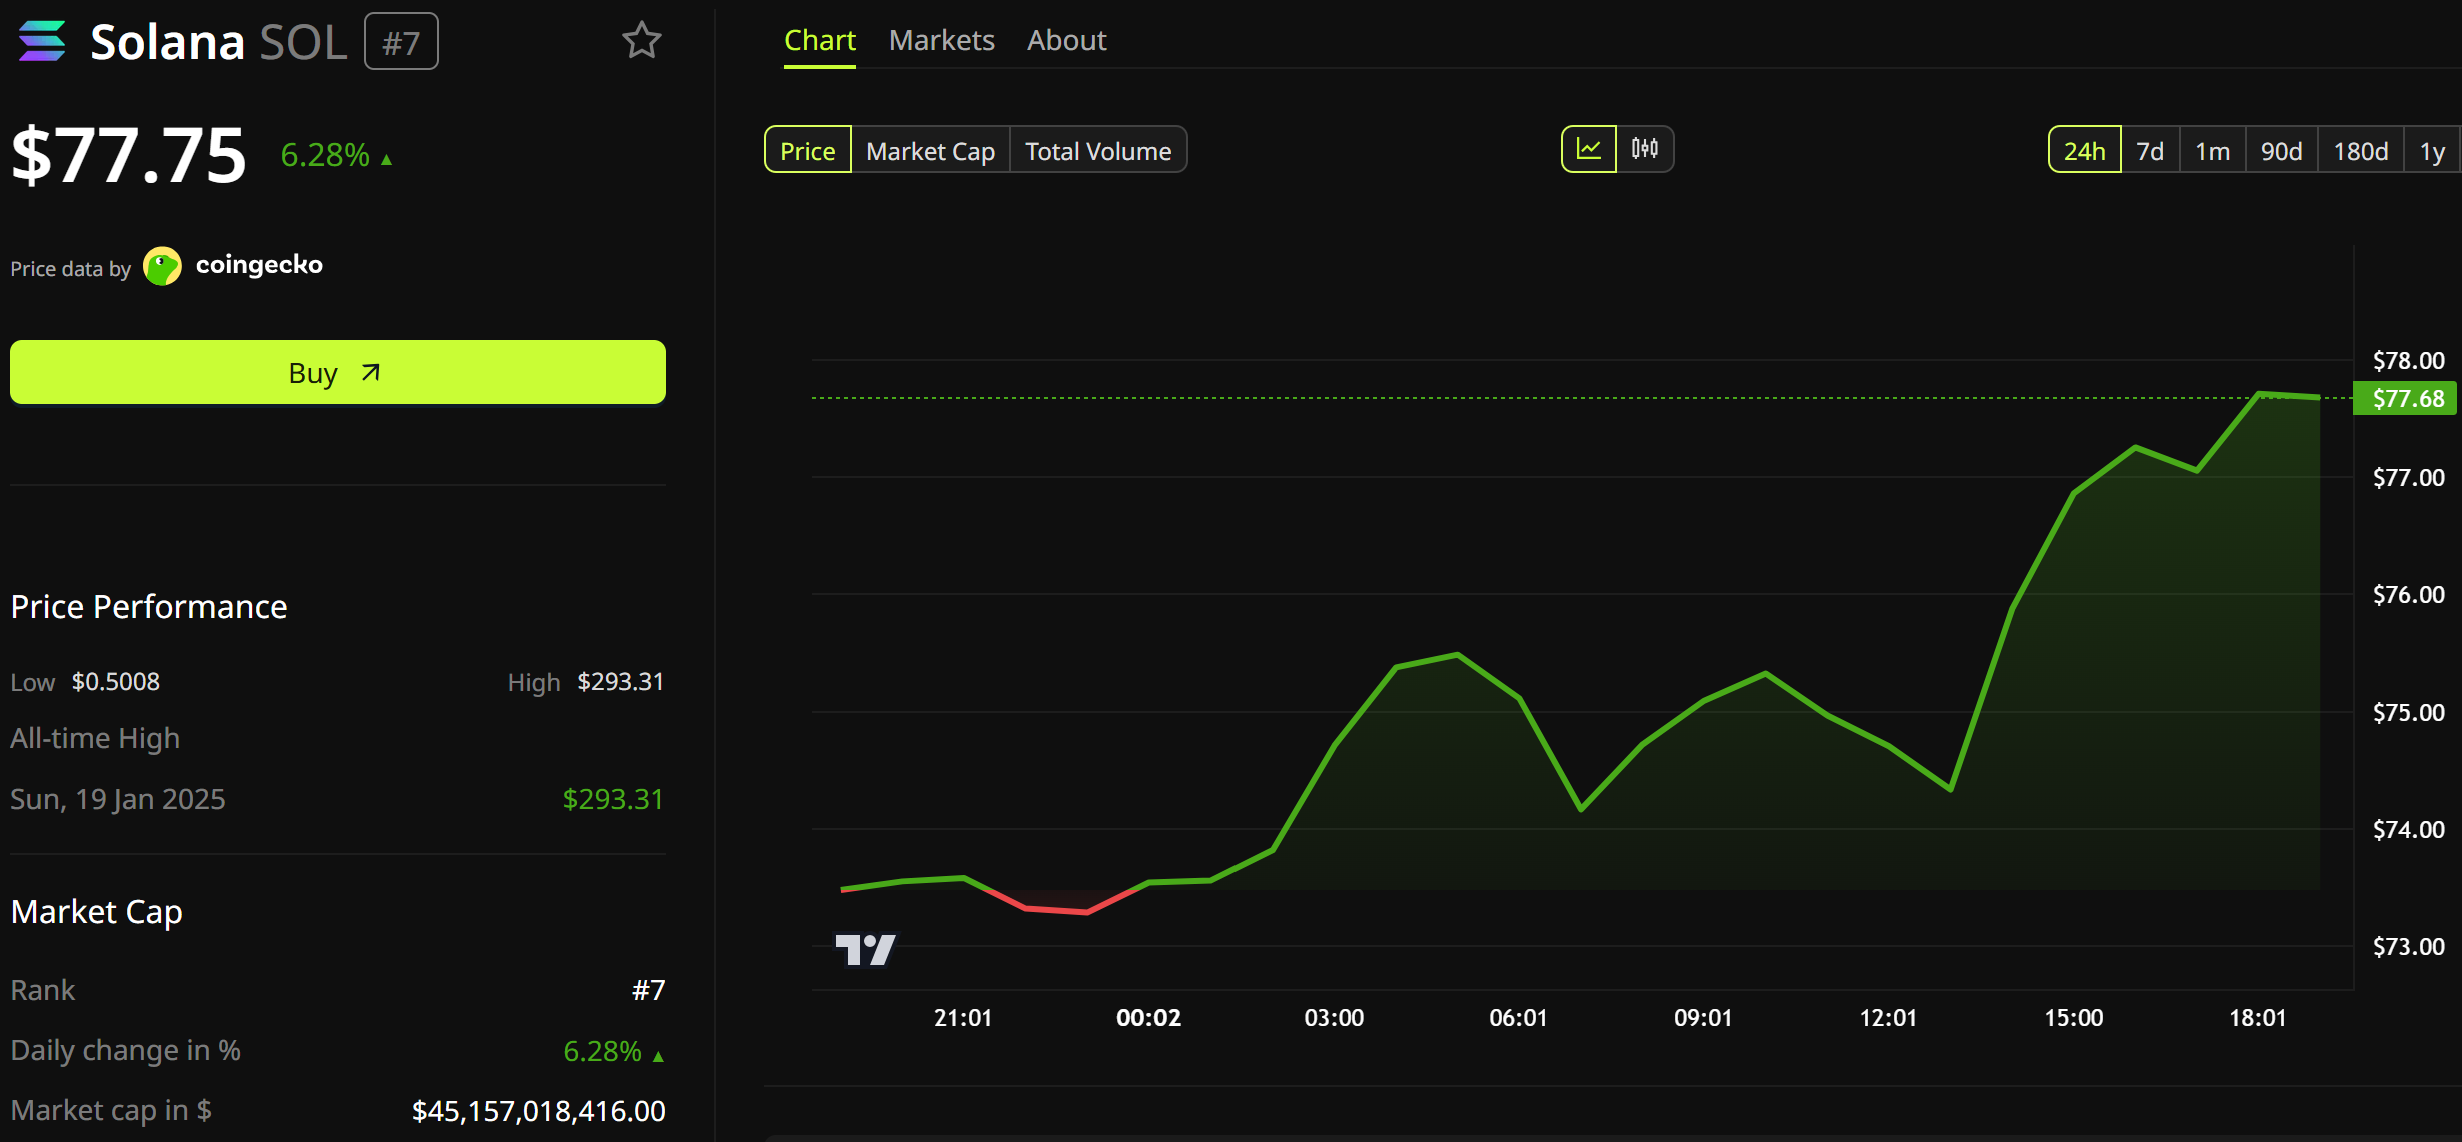
SOL trades near $77 after a 16% weekly bounce, yet it remains about 74% below its record high. On-chain activity is climbing toward yearly highs as the price attempts to bottom.
The contrast sets up a decisive month for SOL. A bearish price structure on higher timeframes now collides with some of the strongest network readings Solana has posted this year.
Solana Network Activity Tests Yearly Highs
On-chain data paints a healthier picture than price alone suggests. The number of active addresses is rising sharply and retesting yearly highs just below 7 million.

Transactions per second, measured on a seven-day average, are trending steeply higher toward 1,100. That reading is approaching a new all-time high for network throughput.
This creates a clear divergence. Network activity continues to grow while the token price sits near its lowest level in more than a year.

Much of the recent surge in throughput stems from meme coin launchpads and speculative airdrops on Solana. Sustained usage above these levels would strengthen the fundamental case for a price recovery.
Weekly Chart Keeps SOL in a Bearish Range
The weekly chart tells a more cautious story. SOL sits roughly 74% under its all-time high of $293 and trades at its lowest level since December 2023.
Price is currently defending the long-term 0.786 Fibonacci retracement near $73. That level marks the last major support before deeper downside opens up.
The first meaningful resistance sits at the 0.618 Fibonacci level around $120. A move back to that zone would require a gain of more than 55% from current prices.

Weekly volume continues to contract, which often signals accumulation and low volatility. However, the broader structure stays bearish until buyers reclaim higher levels. The recent leverage liquidations across the market underline how fragile sentiment remains.
Solana Price Prediction: $80 Line in the Sand
The daily chart offers the first signs of a possible bottom. SOL broke down from an ascending channel in June and hit its measured target near $63.
Price then bounced firmly off that support and now retests resistance just below $80. The Relative Strength Index has climbed toward 60, which indicates building momentum from buyers.
A daily close above $80 would strengthen the recovery case and open the path toward $100 and eventually $120. Failure to hold $73 would expose the $63 demand zone again.

The upcoming Alpenglow consensus upgrade could act as a catalyst if activation nears in the third quarter. Broader market weakness, seen in recent ETF outflows, remains the main risk. July now hinges on whether SOL can convert strong network fundamentals into a decisive break above $80.
The post What to Expect From Solana (SOL) in July 2026 appeared first on BeInCrypto.


Its launch comes as Ethereum’s support ecosystem undergoes a broader evolution, following the debut of EthLabs and amid ongoing efforts by the Ethereum Foundation to respond to community criticism over transparency, communication and its role within the ecosystem by encouraging more independent organizations to take the lead on adoption and ecosystem growth.
Vivek Raman, CEO of Etherealize, said on X that Ethereum Institutional is another example of Ethereum’s decentralized model in action.
“Ethereum is not built by or run by a single organization,” Raman wrote. “Ethereum is a network of independent nodes that collectively make the infrastructure inevitable. Ethereum Institutional will play a key role in amplifying and growing Ethereum. Could not be more excited for this launch.”
Joe Andrews, CEO of privacy developer firm Aztec Labs, told CoinDesk that the launch reflects the continued decentralization of Ethereum’s support ecosystem rather than the emergence of a single voice.
“Over the last two weeks, the Ethereum community has further added to the decentralisation of the network,” he said. “There are now three non-profits all advocating for adoption of Ethereum. It is natural that one of these entities is focusing on institutions, as the world needs a global settlement layer and Ethereum is the only credible option.”

The Complete Guide to Professional Carpet Cleaning for Colorado Homeowners

Elon Musk Sends SpaceX Shares Lower With Two-Word AI Device Denial
McLaughlin: What’s Next After Launch for Retooled Pac-12? > Spencer talks about the best coaches in the league with 'Locked On Pac-12' host Christian Rauh


-

 Fashion5 days ago
Weekend Open Thread: Staud – Corporette.com
-

 Politics6 days ago
The House | Manchesterism won’t survive the painful trade-offs unless it gets citizens on board
-

 Crypto World2 days ago
Strategy authorizes up to $1.25B in Bitcoin sales under new capital plan
-

 Politics6 days ago
Potential 2028er World Cup attendee leaderboard
-

 Business6 days ago
Asia stock markets slide as tech shares slump
-

 News Videos3 days ago
MAJOR BITCOIN & MARKET UPDATE!!!! (MUST WATCH ASAP!!!)
-

 Tech6 days ago
A Look At A Gaggle Of Transputer Boards
-
 Crypto World6 days ago
Dell (DELL) Shares Tumble Over 5% Following Analyst Downgrade to Hold
-

 Crypto World4 days ago
Coinbase, Circle Deepen Crypto Stock Losses Despite Resilient S&P 500
-

 Business2 days ago
Australia treasurer says alleged access of prime minister’s bank data ’incredibly concerning’
-

 Crypto World5 days ago
Kraken's xStocks Opens Bending Spoons IPO Registration to EEA Retail
-

 Sports5 days ago
FIH Pro League: India defeat Pakistan 7-1, register biggest win of campaign | Other Sports News
-
 Crypto World6 days ago
Bitcoin Sparks $600M Hourly Liquidations With $65,000 Set To Become Resistance
-

 Tech4 days ago
Bluekit phishing kit adopts browser-in-the-middle for login theft
-

 Tech4 days ago
Russian hackers now target Signal backup recovery keys
-
 Crypto World5 days ago
Hyperliquid Named on Singapore MAS Investor Alert Register
-

 Crypto World5 days ago
RTX holders must register wallets before token distribution begins
-
 Crypto World7 days ago
Ripple and SBI launch RLUSD in Japan after JFSA approval
-

 Tech2 days ago
Anonymous researcher drops 0-day ‘exploitarium’ repo
-

 Sports11 hours ago
Broncos roster: OL Ben Powers (No. 74) entering final year of contract
You must be logged in to post a comment Login