

Crypto World
Ethereum Institutional wins backing from Standard Chartered and top Ethereum leaders


Its launch comes as Ethereum’s support ecosystem undergoes a broader evolution, following the debut of EthLabs and amid ongoing efforts by the Ethereum Foundation to respond to community criticism over transparency, communication and its role within the ecosystem by encouraging more independent organizations to take the lead on adoption and ecosystem growth.
Vivek Raman, CEO of Etherealize, said on X that Ethereum Institutional is another example of Ethereum’s decentralized model in action.
“Ethereum is not built by or run by a single organization,” Raman wrote. “Ethereum is a network of independent nodes that collectively make the infrastructure inevitable. Ethereum Institutional will play a key role in amplifying and growing Ethereum. Could not be more excited for this launch.”
Joe Andrews, CEO of privacy developer firm Aztec Labs, told CoinDesk that the launch reflects the continued decentralization of Ethereum’s support ecosystem rather than the emergence of a single voice.
“Over the last two weeks, the Ethereum community has further added to the decentralisation of the network,” he said. “There are now three non-profits all advocating for adoption of Ethereum. It is natural that one of these entities is focusing on institutions, as the world needs a global settlement layer and Ethereum is the only credible option.”

Crypto World
Tassat wants to help smaller banks tap the stablecoin boom before big banks lock them out


The announcement comes as stablecoins move further into mainstream finance following the passage of the GENIUS Act. Wall Street firms and banks are expanding stablecoin initiatives, while Citi projects the market could reach roughly $4 trillion by 2030.
At that scale, Sussman said, concentrating reserves among a few institutions could create liquidity and deposit risks.
“If you assume stablecoins scale to $5 trillion or $10 trillion, then there has to be something that helps the market reach equilibrium,” Sussman said. “It can’t just live in a really small circle because that will compound the risk on both sides.”
The platform itself will not run on a blockchain, though Tassat plans to connect it with tokenized asset and deposit networks. Sussman said that approach lowers the technical burden for smaller banks.
“There is a real risk that vast swaths of the U.S. banking ecosystem get left out in the cold,” he said. “I don’t think that’s healthy politically for the United States. I don’t think it’s healthy economically.”
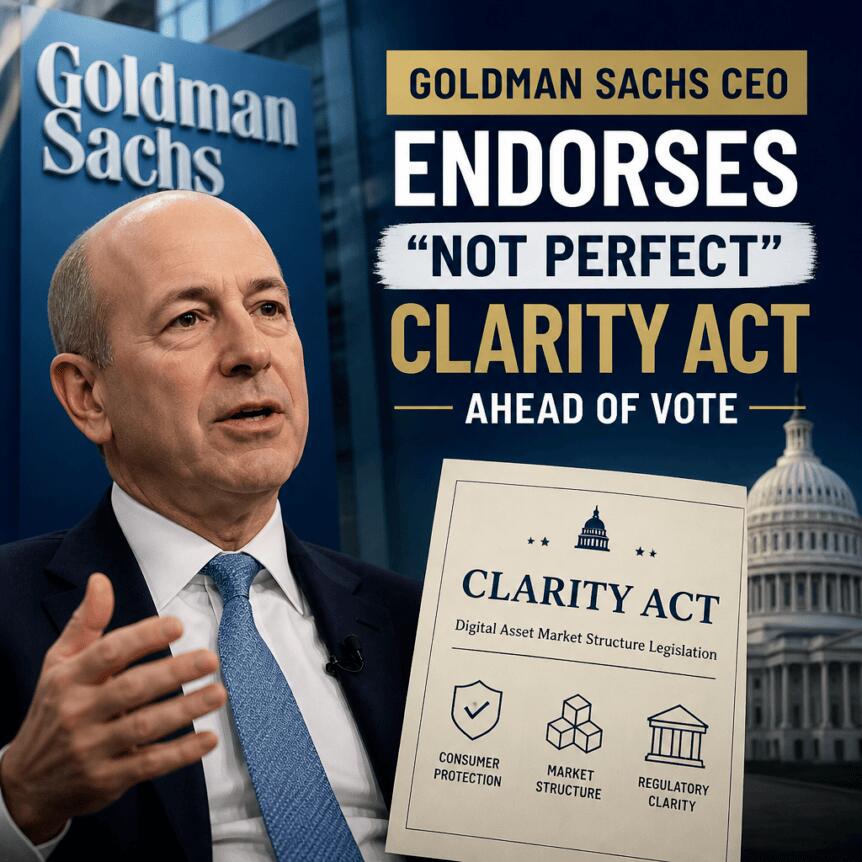
Goldman Sachs CEO David Solomon has voiced support for a US Senate bill intended to reshape crypto market structure, arguing that the proposed Digital Asset Market Clarity (CLARITY) Act is “not perfect” but could help create a more consistent framework for participants.
According to a Thursday report by Politico, Solomon framed the legislation as necessary to establish a “level playing field” that could improve market stability as digital asset markets continue to develop.
Key takeaways
- David Solomon says the CLARITY Act is “not perfect,” but supports it for creating a more “level playing field” to bolster stability.
- Many industry leaders oppose the bill’s approach, including concerns that it would allow certain crypto firms to pay yield related to stablecoins outside existing financial-institution rules.
- Republicans released the CLARITY Act text ahead of a potential Senate vote, but Senate leaders had not scheduled timing as of Thursday.
- Democrats and critics highlighted ethics provisions, with objections centered on enforcement and accountability mechanisms.
- The bill likely requires additional Democratic votes to reach the Senate’s 60-vote threshold.
Solomon’s “level playing field” argument
In comments reported by Politico, Solomon emphasized that legislation is rarely flawless, but maintained that CLARITY’s central purpose is to normalize how digital asset markets operate—at least relative to how traditional finance is regulated.
His view stands in contrast to broader skepticism within parts of traditional banking circles, where executives have questioned whether CLARITY expands regulatory permission in ways that could weaken investor and depositor protections.
Politico’s report also notes that Solomon’s endorsement is relatively uncommon among leaders at major financial institutions considering the bill.
Banking concerns over stablecoin yield permissions
A key point of contention involves whether crypto firms would be allowed to offer interest or yield on stablecoins under rules that critics say do not map cleanly to the protections expected of regulated financial institutions.
Earlier coverage highlighted that many peers oppose the bill on these grounds, arguing that the proposal’s stablecoin yield approach does not provide the guardrails banks would be expected to meet. Cointelegraph previously reported on these concerns.
The contrast in views is also reflected in remarks from JPMorgan Chase chief Jamie Dimon. As reported in an interview conducted in May, Dimon said CLARITY would let crypto companies pay interest on stablecoins “without the protection that they should have,” arguing that banks would not accept a similar arrangement. The interview was shared on YouTube.
Democrats focus on ethics provisions and enforcement
Even as the CLARITY Act moves toward a possible Senate vote, Democratic lawmakers have signaled resistance—not only on technical market-structure issues, but also on ethics language attached to the bill.
As described in reporting from Cointelegraph and subsequent commentary, Democrats are concerned that the ethics provisions do not go far enough and that enforcement would be left to the US Department of Justice rather than state authorities. If Republicans are unable to secure enough support beyond their ranks, the bill could stall at the 60-vote threshold required to advance in the Senate.
Senator Elizabeth Warren, a leading Democratic critic, said in a statement released alongside the Wednesday publication of the bill text that she believes the legislation is designed to protect President Donald Trump’s crypto profits and that it fails to adequately safeguard investors, the financial system, and national security. The statement was posted by the Senate Banking Committee’s minority.
Cointelegraph earlier also reported on Democrats’ objections to the ethics language during the markup process, underscoring how these provisions have become a central political obstacle for CLARITY. Earlier coverage details the core Democratic concerns.
What happens next in the Senate
Republicans released the full CLARITY Act text on Wednesday, setting the stage for potential Senate action. However, as of Thursday, Senate leaders had not scheduled a vote, according to the Politico report.
With multiple factions still divided—particularly over stablecoin yield permissions and ethics/enforcement mechanics—the immediate question for investors and market operators is whether amendments can narrow the gap between competing priorities or whether the bill will face a larger momentum reversal.
Readers should watch for whether Senate leaders set a vote date soon and, more importantly, whether any compromise emerges that could attract enough Democratic support to meet the 60-vote threshold—since the bill’s advancement appears tightly linked to both ethics politics and the future regulatory treatment of stablecoin-related yield.

A television station broadcasts Kevin Warsh, chairman of the US Federal Reserve, speaking after a Federal Open Market Committee (FOMC) meeting on the floor of the New York Stock Exchange (NYSE) in New York, US, on Wednesday, June 17, 2026.
Michael Nagle | Bloomberg | Getty Images
Investors are increasingly preparing for the Federal Reserve to hike interest rates as oil prices climb.
Fed funds futures are pricing in a roughly 82% likelihood that the central bank lifts borrowing costs at its September policy meeting, according to CME’s FedWatch tool. A week ago, those odds sat below 53%.
The central bank is still broadly expected to keep rates unchanged at the current 3.50% to 3.75% at its gathering next week. But even then, there’s a growing minority planning for an increase: Fed funds futures trading indicates a nearly 38% probability of a quarter percentage point hike, up from less than 12% a week ago.
Brent, the global crude benchmark, hit $100 a barrel on Thursday for the first time since late May amid a new round of tit-for-tat attacks between the U.S. and Iran. The average price for a gallon of gasoline in the U.S. reached $4 per gallon this week — the highest in more than a month, according to AAA.
Thursday’s employment data bolstered the view that the Fed can focus more on inflation — which could accelerate as energy prices climb — than the health of the labor market.
Initial jobless claims dropped to 187,000 in the week ended July 18, the Labor Department reported. That was the fewest claims since 1969, when the U.S. population was 60% of what it is today.
“At the moment, the outlook for economic growth is showing some signs of overheating if today’s weekly jobless claims figures can be believed,” said Christopher S. Rupkey, chief economist at FWDBONDS. “But for how long is the question if energy prices continue to spiral upward.”
Rising expectations for a rate increase may be adding to the downward pressure on the stock market Thursday, according to Larry Tentarelli, chief technical strategist at the Blue Chip Daily Trend Report. That’s on top of the breakout in oil prices and Treasury yields, and Alphabet‘s post-earnings swoon, he said.
The blue-chip Dow Jones Industrial Average tumbled more than 600 points in midday trading. The Nasdaq Composite — heavily weighted to technology stocks that can be sensitive to higher borrowing costs — shed nearly 3%.
“You really just have a perfect storm of headwinds right now,” Tentarelli said.

The Nasdaq Composite, 1-day
“We’ve got a Fed meeting in six days, and I think investors should not be in a hurry to buy anything,” he added. “There’s times where you can just sit it out and be patient.”
‘A readthrough’
Market participants looking for insights into the Fed’s outlook are closely monitoring the 2-year U.S. Treasury yield. The yield, which rose more than 6 basis points on Thursday, offers “a readthrough on what the Fed might do next,” said Ross Mayfield, an investment strategist at Baird.
U.S. 2-year Treasury, 1-month
While Mayfield said investors don’t need to worry about an interest rate move next week, September feels like a “live” meeting for the Fed.
Kalshi traders have similarly increased their bets of a September quarter point increase in recent days. Odds of such a move at that meeting rose to 48% midday on Thursday, up from about 30% a week ago.
To be sure, economists’ interest rate outlook through 2026 doesn’t signal an environment with tighter monetary policy.
The consensus forecast remains that the Fed won’t hike rates this year, according to FactSet. In 2027, economists anticipate the central bank will lower borrowing costs by half a percentage point.
— With additional reporting by CNBC’s Sean Conlon


Ripple has invested an undisclosed amount in Notabene to bring RLUSD payments to an institutional network processing more than $2 trillion in annualized transaction volume.
Summary
- Ripple invested in Notabene to integrate RLUSD into its institutional payment network.
- Notabene’s regulated infrastructure handles more than $2 trillion in annualized transaction volume.
- Ripple’s European licenses and U.S. policy push support its stablecoin payment expansion.
Notabene announced the strategic investment in a press release, adding that the two companies will work together to expand regulated stablecoin payments for businesses. Under the agreement, Notabene will integrate Ripple USD, commonly known as RLUSD, into Notabene Flow, its business-to-business stablecoin payment platform.
Once integrated, RLUSD could become available across one of the largest networks connecting regulated digital asset companies. Notabene described the collaboration as a route for institutions to use the stablecoin while meeting payment authorization and compliance requirements.
Alongside the RLUSD integration, Ripple and Notabene will examine how trusted payment authorization could support Ripple Payments. According to Notabene, its infrastructure gives regulated institutions the information needed to identify counterparties, understand payment purposes and approve transactions without adding unnecessary friction.
“The partnership is set to accelerate adoption of compliant stablecoin payments while creating a pathway for RLUSD to be integrated across one of the world’s largest institutional payment networks for digital assets,” Notabene stated.
Notabene gives RLUSD access to regulated payment counterparties
Notabene co-founder and CEO Pelle Braendgaard identified uncertainty over transaction details as a central problem for companies considering stablecoins. In his assessment, institutions need to know who is receiving a payment, why the transaction is taking place, and how it can be authorized within their existing controls.
Braendgaard argued that Notabene’s network provides those functions through connections with regulated institutions. Combined with Ripple’s payments business and RLUSD, he expects the infrastructure to help companies move stablecoin payment programs beyond limited trials.
“That is what Notabene and its network of regulated institutions solve. Paired with an enterprise-ready stablecoin like RLUSD and Ripple’s global payments reach, it turns compliant stablecoin payments from a pilot into a real growth engine that reaches more counterparties and moves more volume, faster,” Braendgaard said.
Ripple Senior Vice President of Stablecoin Jack McDonald also linked the investment to a long-standing barrier facing enterprise users. According to McDonald, Notabene supplies part of the compliant infrastructure that institutions require before moving money at an international scale.
“Together we’re helping build the compliant infrastructure institutions need to move value at global scale while expanding the utility of RLUSD.”
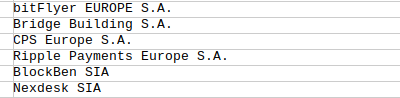
The agreement comes as Ripple builds regulated payment access for RLUSD in Europe. As crypto.news reported, Ripple Payments Europe appeared alongside 14 other companies in the European Securities and Markets Authority’s latest Markets in Crypto-Assets register update on July 18.
ESMA’s register lists Ripple Payments Europe SA as an authorized crypto asset service provider. According to the register, the approval enables Ripple’s European payments subsidiary to provide regulated crypto services across 29 European Union countries.
Ripple had previously secured authorization in Luxembourg under the MiCA framework. The company stated that the Luxembourg license allows its local subsidiary to provide services to financial institutions and businesses across the European Economic Area.
Paired with Ripple’s existing electronic money institution license in Luxembourg, the crypto asset service provider approval permits the company to offer crypto asset and stablecoin payment services. Ripple says banks, fintech firms and corporate clients can use a single integration to collect funds, exchange assets and make payments.
Regulatory progress supports Ripple’s institutional payment strategy
In the United States, Ripple is also pressing lawmakers to establish federal rules for crypto markets. Ripple CEO Brad Garlinghouse on July 22 backed Chief Legal Officer Stuart Alderoty’s call for Congress to pass the Digital Asset Market Clarity Act despite unresolved disputes surrounding the legislation.
Alderoty urged lawmakers not to abandon the bill while pursuing a perfect compromise. His appeal followed the release of updated legislative text and came as Congress moved closer to its August recess, while a group of Senate Democrats renewed resistance to the proposal.
Describing the CLARITY Act as a consumer protection measure, Alderoty argued that it would reinforce anti-money laundering and know-your-customer standards. He also maintained that the legislation would give law enforcement agencies and state authorities clearer powers to address misconduct.
Garlinghouse endorsed that assessment after Ripple had supported federal market structure legislation during the current negotiations. The company’s policy push accompanies rising institutional interest in stablecoin payments following the passage of the GENIUS Act.
RLUSD has also secured integrations beyond the planned Notabene Flow addition. Renewed interest in the stablecoin follows BNY Mellon’s plan to develop a 24-hour settlement system for the U.S. Treasury market, although the bank’s initiative remains separate from Ripple’s Notabene agreement.
Through the investment, Ripple gains a route into Notabene’s regulated network without acquiring the company or disclosing the size of its stake. Notabene, in turn, will add RLUSD to payment infrastructure already used by institutions handling more than $2 trillion in annualized transaction volume.

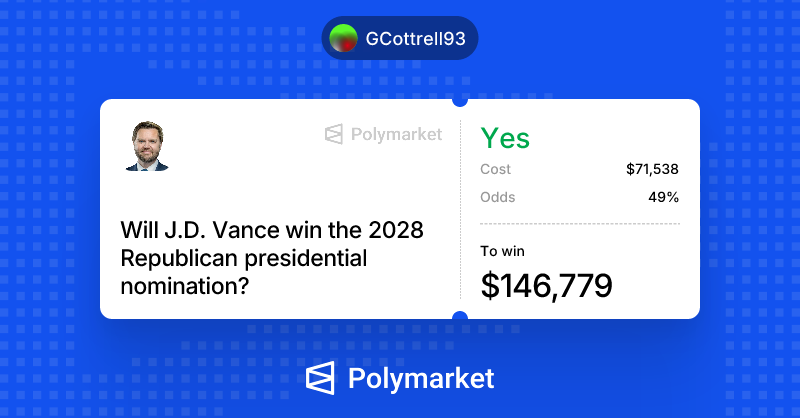
Convicted fraudster and Nigel Farage backer George Cottrell had $9 million deposited into his Polymarket account by two unknown sources.
That’s according to the Financial Times (FT), which reported that Cottrell’s Polymarket account — which has the username “GCottrell93” — received $8.8 million in October 2024.
It received $7 million across five different transactions from a wallet on crypto exchange OKX, and received another $1.83 million from a wallet on ChangeNOW.
These funds were used almost immediately to bet on whether or not Trump would win the US election. From here, the FT claims $13 million in winnings was sent to an OKX wallet while $282,000 was sent to ChangeNOW.
Cottrell was previously convicted of wire fraud in March 2017 after he was caught agreeing to launder drug trafficking proceeds.
For many years, Cottrell and his relationship with Farage had gone largely under the radar. However, this past year has seen him thrust into the limelight after Farage was discovered to have accepted, without declaring, a £5 million gift from multi-billionaire Tether investor Christopher Harborne.
Cottrell was also revealed to have funded staff, security, and housing for the Reform UK leader before his election in 2024.
None of this was declared, and has since been referred to the UK’s Parliamentary Commissioner for Standards.
Read more: Nigel Farage aide George Cottrell bets US war will last four more months
Cottrell has continued to bet on Polymarket throughout the year. Protos reported in March 2026 that he bet $41,000 that the US war with Iran would last another four months.
One of his larger bets currently involves $71,000 on whether or not Vice President JD Vance will win the Republican nomination for president in 2028.
In addition to the FT’s report, Byline Times also revealed today that Cottrell has in the past used a fraudulent Swiss passport, under the name of “Oscar Drewitt.”
This fraudulent identity was reportedly known by Reform UK’s former Treasurer, Mehrtash A’zami, who hired Cottrell into a City financial network while using this Swiss alias.
Byline Times also discovered that a fellow gambler called Hon Kong Yong introduced Cottrell to this network under the false alias, and that Yong and A’zami have companies registered under the same Montenegro Tivet office, which Harborne and two other former Reform UK officials were linked to.
Got a tip? Send us an email securely via Protos Leaks. For more informed news and investigations, follow us on X, Bluesky, and Google News, or subscribe to our YouTube channel.

Ethereum has climbed by 16% over the past month and is now showing a technical setup that has historically been followed by strong price recoveries, according to crypto analyst Ali Martinez.
He found that ETH’s MVRV ratio is nearing a bullish crossover above its 160-day simple moving average (SMA).
Recovery Hints
The MVRV Momentum measures the relationship between aggregate holder profitability and its medium-term trend line. Martinez explained that when the daily MVRV ratio moves back above the 160-day SMA, it indicates a shift out of capitulation and the beginning of a fresh accumulation phase. Interestingly, this is the first time the setup has emerged in 2026.
Over the past three years, crossovers above this level have consistently marked the end of distribution periods and preceded major rebounds in ETH’s price.
At the same time, large investors continue adding to their holdings. According to Lookonchain, an anonymous whale purchased 27,000 ETH worth $52.03 million through Galaxy Digital’s over-the-counter (OTC) desk after remaining inactive for three months.
Additionally, BSCN reported that BitMEX co-founder Arthur Hayes acquired another 644.34 ETH worth roughly $1.25 million, increasing his total purchases over the past eight days to 3,270 ETH. This follows his earlier $2.53 million ETH buy and comes alongside several other multi-million-dollar Ethereum purchases and staking activity reported earlier this week.
Prediction markets are also leaning bullish. In fact, Whale Insiders said Kalshi traders are forecasting ETH could climb as high as $3,210 this year.
Separate data also showed that investors withdrew around 1 million ETH, worth nearly $2 billion, from centralized exchanges over the past 30 days, which pushed exchange balances to their lowest level in a decade. Declining exchange reserves typically reduce selling pressure and support a bullish outlook.
On the institutional front, spot Ethereum ETFs have recorded consistent net inflows this month, raking in over $380 million during this period.
Alternative Outlook
Not all analysts share the same near-term outlook. Crypto analyst Nonzee, for one, argued that the crypto asset could still see one more rally before a deeper correction. He expects it to test $2,000, with a possible move to $2,200 if Bitcoin climbs to $70,000. However, he believes those levels would mark a bull trap rather than the start of a meaningful breakout.
According to the roadmap, Ethereum could spend seven to ten days in a distribution phase before falling into a final bottom zone between $1,300 and $900, which he considers the ideal accumulation range. Despite his bearish short-term outlook, Nonzee maintained a long-term price target of $7,000 for ETH.
The post Ethereum’s Next Leg Higher? Historic Indicator and Whale Activity Align appeared first on CryptoPotato.
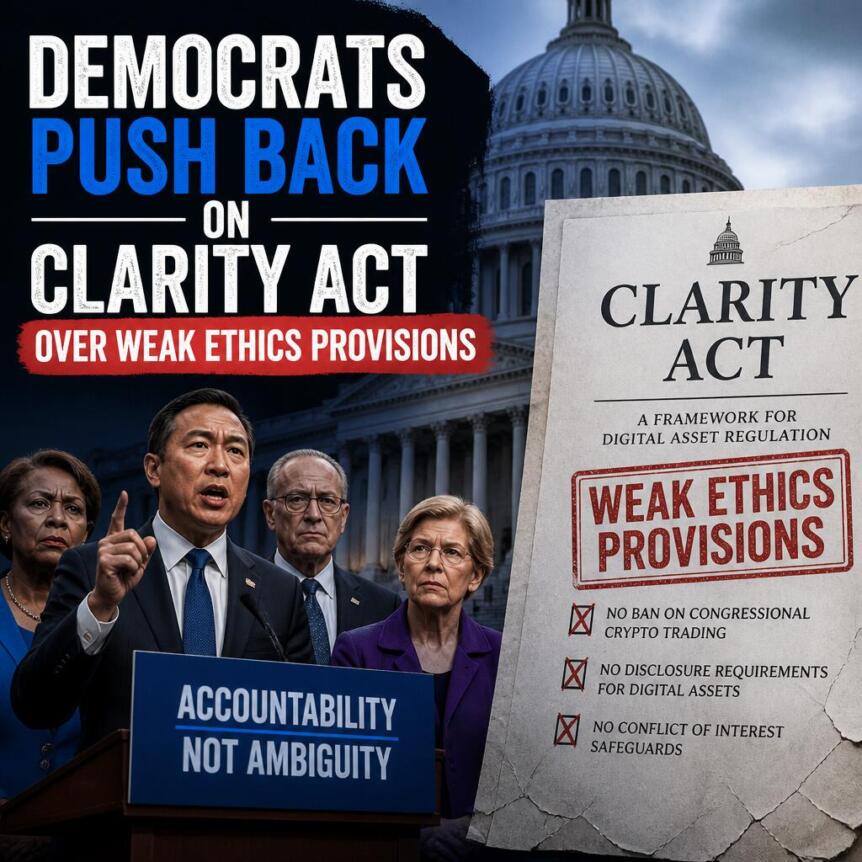
Democratic lawmakers are pushing back against the latest draft of the CLARITY Act over its ethics provisions. The lawmakers believe the provisions do not adequately address President Trump’s crypto interests.
Lawmakers have signalled support for the legislation if stronger provisions are included. However, the bill has found support in the crypto industry, with Coinbase and Ripple backing it.
Democratic Lawmakers Push Back Against Clarity Act Draft
Republican lawmakers released the latest draft of the CLARITY Act on Wednesday (July 22), with several prominent figures from the crypto industry supporting the measure. However, the legislation quickly faced fierce pushback from Democratic lawmakers over weak ethics provisions. The lawmakers argued that the provisions were inadequate to address President Trump’s crypto links. Senator Angela Alsobrooks said the current draft fell short and asked for key provisions to be strengthened, stating, “The Republican-proposed text of the CLARITY Act as it currently stands falls short. Key provisions including those addressing ethics for elected officials, consumer protection, illicit finance, conflicts of interest and market integrity must be strengthened.”
President Trump and his family remain involved in the crypto industry, with interests including a popular memecoin and World Liberty Financial, a decentralized protocol that operates a borrowing-and-lending platform. According to financial disclosures, President Trump received millions tied to WLF.
Incomplete Enforcement Mechanism
The 616-page draft prohibits public officials and their spouses from sponsoring and issuing digital assets. However, it does not prohibit extended family members. The draft also includes a clause stating the restrictions expire in January 2029 and tasks the Justice Department with enforcing the provisions. Senator Ruben Gallego supported the bill in the committee but has ruled out backing it in the Senate unless the ethics language is changed. Besides Alsobrooks and Gallego, Senate Democrats Catherine Cortez Masto and Cory Booker have also opposed the bill in its current form.
Senator Elizabeth Warren took to X, criticizing the bill and stating, “The new draft of the Senate GOP crypto bill does nothing to stop President Trump from making his next $1.4 billion from crypto. It’ll supercharge Trump’s crypto corruption. This bill should be dead on arrival.”
Amanda Fischer, Chief Operating Officer and policy director for Better Markets and former chief of staff for Gary Gensler, believes the draft does not change much for President Trump and his entanglement with crypto.
“The bottom line: Doesn’t change much at all about Trump’s existing crypto grift. No divestment required. Maybe stops new crypto grifts, but it’s up to his personal attorney [Acting U.S. Attorney General] Todd Blanche to enforce. Amnesty kicks in as soon as the new POTUS is inaugurated.”
Support From The Crypto Industry
Unsurprisingly, prominent individuals from the crypto industry threw their weight behind the legislation. Supporters were happy the bill retained software developer protections and added that the legislation would ensure regulatory clarity and elevate the US’ role in the digital asset industry. Ji Hun Kim, CEO of the Crypto Council for Innovation, urged for bipartisan support to get the bill across the line, and Solana Policy Institute CEO Miller Whitehouse-Levine called on Congress to “seize the moment.”
The strongest support for the bill came from Coinbase and Ripple. Coinbase CEO Brian Armstrong said the lack of a clear regulatory framework had hurt the industry, allowing major incidents like the FTX collapse to hurt consumers. Stuart Alderoty, Chief Legal Officer at Ripple, said the bill gives law enforcement agencies the teeth to go after bad actors, while CEO Brad Garlinghouse stated the bill does not have to be perfect to pass.
Supporters of the legislation are urging Congress to vote on the bill before its August recess. However, this depends on whether Democrats and Republicans can agree to a timely compromise.
Disclaimer: This article is provided for informational purposes only. It is not offered or intended to be used as legal, tax, investment, financial, or other advice.

Empery Digital said it invested $20 million in Cardinal Data Power, acquiring an approximately 8% stake in the private developer of powered data center campuses.
The investment was part of Cardinal Data Power’s approximately $70 million Series A financing and will support development of a 750-megawatt data center campus in West Texas. The project is expected to deliver its first power in 2027, expand to about 1 gigawatt by 2029 and eventually exceed 5 gigawatts.
Cardinal develops powered data center campuses for artificial intelligence and high-performance computing workloads. The company said it combines power generation, natural gas supply and electrical infrastructure to accelerate development of large-scale computing sites.
Empery has been moving away from its Bitcoin (BTC) treasury strategy, which it adopted in mid-2025 after pivoting from its former electric powersports business. Earlier this month, the company disclosed it had sold about 1,400 Bitcoin over a two-month period for roughly $87.1 million, using the proceeds to fund AI infrastructure investments and repay debt.
The sale came as Empery faced mounting pressure from shareholder Tice P. Brown, who called on the company to abandon its treasury strategy and sought the resignation of its chief executive officer and board.
The transactions reduced the company’s Bitcoin holdings to 1,514 BTC. Empery had previously held as many as 4,081 BTC before beginning to trim its position in March, according to data from BitcoinTreasuries.NET.
Related: Bernstein says Bitcoin mining deals necessary for AI power crunch
Bitcoin treasury companies take divergent paths
The Bitcoin treasury model is evolving, with some companies doubling down on accumulation while others are pivoting, restructuring or exiting altogether.
Satsuma Technology became one of the first Bitcoin treasury companies to unwind after shareholders voted overwhelmingly on July 20 to sell the company’s Bitcoin holdings, return substantially all of its capital to investors and delist from the London Stock Exchange. More than 90% of votes cast supported both the capital return and the delisting.
Meanwhile, a proposed merger between Tether-backed Twenty One Capital, Strike and Bitcoin miner Elektron Energy was scrapped earlier this week, leaving Strike as a standalone company while discussions between Twenty One and Elektron continue
Despite the change, Twenty One remains one of the world’s largest corporate Bitcoin holders with 43,514 BTC, second only to Strategy among publicly tracked corporate treasuries.
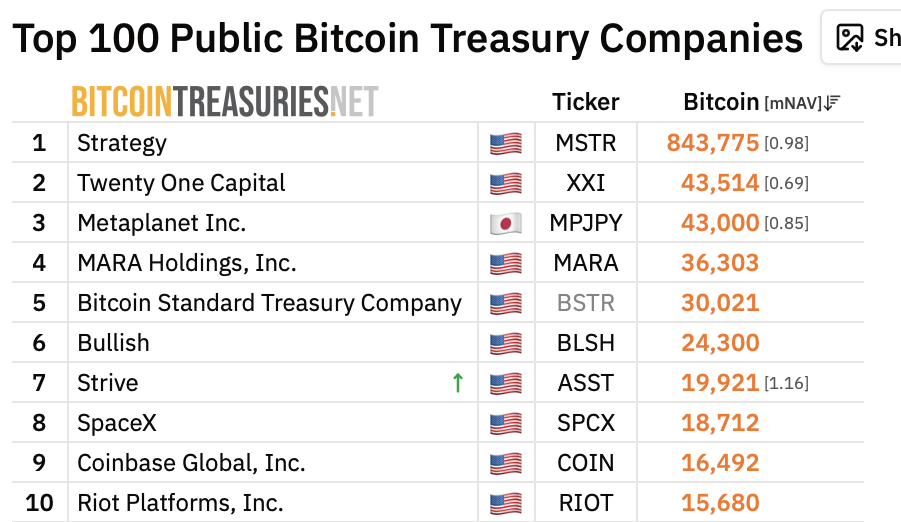
Top 10 Bitcoin treasury companies. Source: BitcoinTreasuries.NET
Other entrepreneurs are taking the Bitcoin treasury concept in a different direction. Last week, Bitcoin analyst Lyn Alden co-founded Orange Juice HODLINGS, a permanent-capital holding company backed by Mexican billionaire Ricardo Salinas that launched with $40 million in initial funding.
Rather than simply accumulating Bitcoin, the company plans to acquire and hold profitable businesses indefinitely while using Bitcoin as its treasury reserve asset, combining long-term business ownership with a Bitcoin-backed balance sheet.
Magazine: Fears of AI-driven DeFi hack epidemic overstated for now — but not for long

Negotiations over the long-awaited US Digital Asset Market Clarity Act—known as the CLARITY Act—have reportedly narrowed to one of the most politically sensitive issues: ethics rules for federal officials and who will enforce them. After months of drafting and bargaining, a dispute over a “code of conduct” element is now threatening to derail a bill that many in the industry view as crucial for regulatory certainty.
Democratic senators say the current version of the proposal does not go far enough, particularly on ethics provisions covering elected officials and related consumer and market-integrity safeguards. Republicans, meanwhile, argue that ethics enforcement should remain within the Department of Justice (DOJ) under a single national framework, rather than being handled by state attorneys general.
Key takeaways
- Seven Democratic senators said the current CLARITY Act text “falls short,” calling for stronger ethics, consumer protection, illicit finance, conflict-of-interest, and market-integrity provisions.
- The latest draft would bar senior federal officials and their spouses from issuing or sponsoring digital assets while in office, alongside limits on crypto platforms listing such assets.
- Democrats want ethics enforcement to allow state attorneys general to step in if DOJ does not enforce the law; Republicans insist DOJ should be the sole enforcement channel.
- Multiple policy and industry stakeholders say lawmakers may still be able to compromise, but uncertainty over ethics is becoming the central bottleneck.
- Even if senior officials are restricted from sponsoring or issuing new tokens, the draft would still allow covered officials to own cryptocurrencies.
What the new CLARITY ethics language would change
According to the latest Senate draft made public Wednesday, the CLARITY Act would prohibit the president, vice president, members of Congress, and other senior federal officials—along with their spouses—from issuing or sponsoring digital assets while they are in office. This would apply to officials covered under the bill’s ethics framework.
The draft also includes a platform-facing restriction: crypto platforms would be prevented from listing assets issued or sponsored by covered officials. As described in coverage of the text, these prohibitions are set to expire in 2029, after President Donald Trump’s current term ends.
Importantly for investors and market participants, the restrictions would focus on “issuing or sponsoring” while in office, not on personal ownership. Covered officials would still be allowed to hold cryptocurrencies even during the restricted period.
Why Democrats say the proposal isn’t strong enough
In a joint statement released Wednesday, seven Democratic senators argued that the bill’s current provisions are inadequate. They said “key provisions,” including those addressing ethics for elected officials, consumer protection, illicit finance, conflicts of interest, and market integrity, must be strengthened.
“Key provisions including those addressing ethics for elected officials, consumer protection, illicit finance, conflicts of interest and market integrity must be strengthened,” the senators said.
Senator Angela Alsobrooks—speaking at a Semafor event on Wednesday—stated that while negotiations may be “fairly close,” the ethics language remains a dealbreaker. She indicated she would not support the legislation on the Senate floor unless it includes stronger ethics provisions.
Alsobrooks’ primary concern is both the substance and the enforcement structure. She said it cannot be taken for granted that DOJ will enforce the law effectively, framing the issue as a credibility problem rather than a purely theoretical one.
Democrats’ stance has been amplified by scrutiny of President Trump’s growing crypto-related business interests, which have reportedly included meme coin activity and a broader portfolio of digital asset exposure. Critics argue that this creates incentives and potential conflicts that stronger ethics and enforcement mechanisms should address.
Senator Elizabeth Warren has also signaled that she views the draft as insufficient, arguing that it would not prevent the president from profiting from new crypto activity in a way that could be economically significant. Separately, former SEC official Amanda Fischer argued that the restrictions could still allow the president to benefit from existing crypto projects, with the proposed limitations aimed at future income streams.
Republicans push for DOJ-only enforcement
Republicans contest the idea that the ethics provisions are too weak, while also objecting to Democratic calls for additional enforcement leverage for state attorneys general. They argue that federal ethics requirements should be enforced through a single national mechanism—DOJ—rather than through a patchwork of state interpretations and political priorities.
Attorney and former Republican Senate candidate John Deaton said the CLARITY Act is federal legislation and that DOJ, not “fifty different state AGs,” is the appropriate body to enforce federal law. In this view, allowing state officials to intervene would risk undermining the uniformity that supporters say the bill is intended to provide.
Other Republican-aligned commentators characterized the ethics language as unprecedented. For example, Senator Bernie Moreno described the current draft as containing “the most powerful ethics language in US history.”
Patrick Witt, a former White House and Senate counsel, suggested the disagreement may be driven by two incompatible Democratic positions: that ethics rules would be meaningless without state AG enforcement, or that the proposal could not be changed in a way that would satisfy concerns about constitutional constraints. Witt argued that endorsing the first position would effectively dismiss the enforceability premise behind existing federal ethics laws, while the second position would be difficult or impossible to meet without violating constitutional principles.
Industry and policy observers see a path—but not an easy one
Despite the ethics dispute, many observers believe the bill can still progress through negotiation. Kristin Smith, former CEO of the Blockchain Association and now president of the Solana Policy Institute, told Cointelegraph that the latest draft reflects meaningful compromise on ethics—an element viewed as necessary for Senate Democrats to come closer to supporting the measure.
Smith also emphasized that ethics is only one component of the broader package. She pointed to additional elements added to the Senate’s work, including a disclosure regime, an illicit finance section, and improved spot market regulation. In her view, rejecting the bill on ethics alone could mean lawmakers lose more than just the ethics language—they could lose the rest of the regulatory structure altogether.
“There is no version of a ‘no’ vote that produces a stronger bill,” Smith said. “A ‘no’ vote produces no bill at all: no disclosure regime, no illicit finance protections, no spot market improvements, no ethics provisions, nothing.”
Vincent Chok, co-founder and CEO of stablecoin issuer First Digital, likewise suggested that narrowing negotiations to ethics rather than the overall structure indicates progress. He framed the question less as whether the US needs a framework and more as how to finalize one that can attract broad support.
Chok argued that no regulatory scheme is likely to be perfect at the start, but businesses can adjust if the market gets clarity. Long periods of uncertainty, he said, make it harder to justify long-term investment and product development.
Other industry figures expressed cautious optimism while still criticizing how far the initial ethics proposal goes. Salman Banaei, head of public policy at Plume, a blockchain network focused on tokenized real-world assets, said compromise may be possible, but cautioned that the White House’s initial ethics proposal was “not a good starting point.”
At the heart of the debate remains the enforcement question: the current draft appears to rely heavily on DOJ for ethics implementation, while Democrats want a mechanism that gives state attorneys general a clearer role if federal enforcement falls short. How lawmakers balance these competing views—without stalling the broader CLARITY framework—may determine whether the bill reaches the next stages.
As negotiations continue, the key variable for readers is whether the parties can agree on an enforcement structure that satisfies Democrats’ concerns about DOJ reliability while preserving Republicans’ push for a single federal enforcement lane. With the bill’s timetable dependent on this remaining sticking point, investors and builders should watch for the next revised ethics draft and any accompanying language changes that clarify whether enforcement authority can shift beyond DOJ.
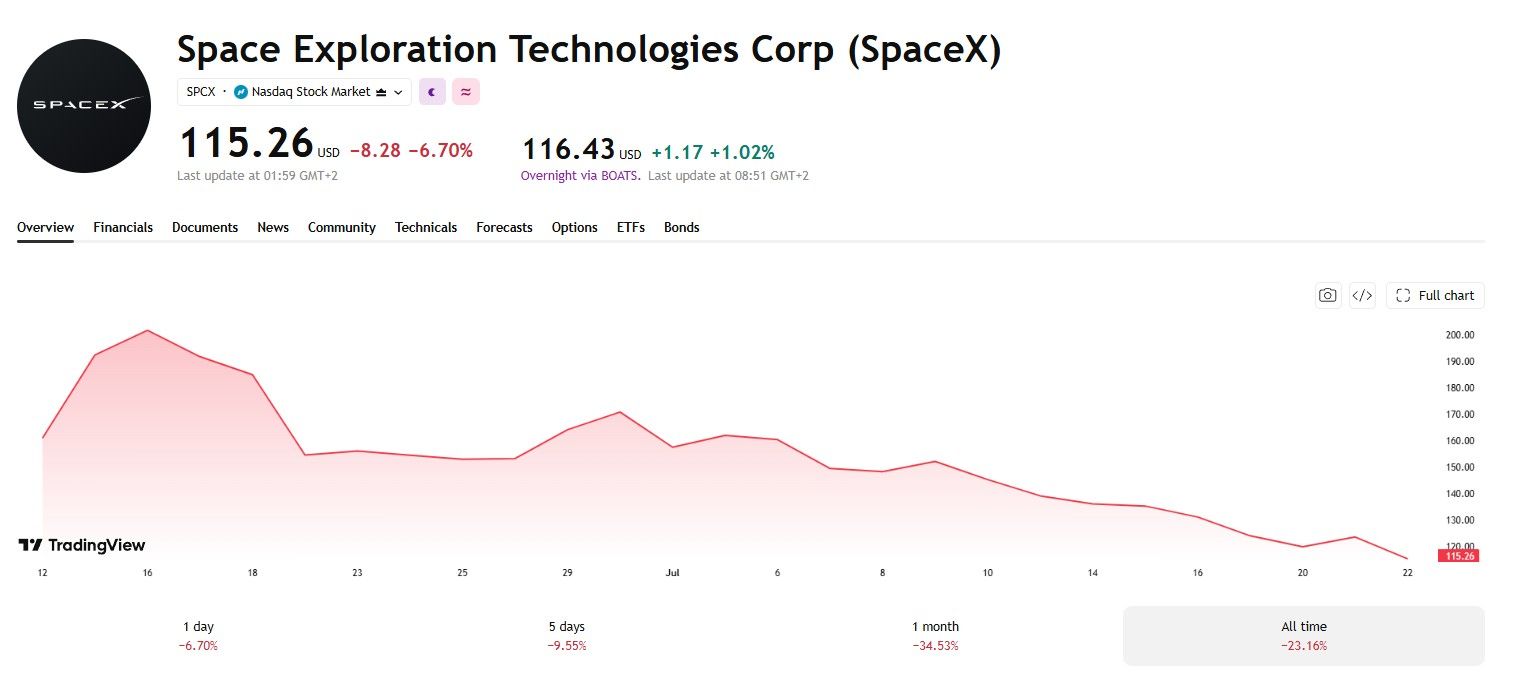
SpaceX stock (SPCX) closed just above $115 on Wednesday, nearly 20% below its June IPO price, while its 2056 bonds sank to a record low below 89.
The dual decline pushed the bonds’ yield to worst to 7.6% and reignited talk of an AI-driven valuation reset across stocks and crypto. SPCX now trades roughly 48% below its June peak of $225.64.
Bond Market Flashes a Warning Signal
SpaceX priced $25 billion in bonds in June across five tranches, with coupons ranging from 5.35% to 6.65%. The longest maturity, due in 2056, has fallen the most and now trades alongside junk-rated debt.
Zerohedge reported the bonds slipping below 89 this week, alongside a broader selloff in hyperscaler debt. The move echoes the market top signal analysts flagged shortly after the IPO priced.
Credit spreads on the 2056 notes have widened from roughly 175 basis points at issuance to more than 230 basis points now.
Meanwhile, the company reported a first-quarter net loss of $4.28 billion on $4.69 billion in revenue, fueling scrutiny of its bond math.
In turn, analysts argue that the gap explains why bondholders, unlike equity buyers, are pricing in more risk.
Schiff Frames SpaceX Selloff as a Broader Signal
Peter Schiff reposted the bond data and separately noted SPCX closed nearly 50% below its high. He called the drop a possible harbinger for other overhyped stocks and cryptocurrencies.
Schiff has issued a prior bond market warning, arguing that credit stress, not Bitcoin, would trigger the next major crash. However, his critics note a long history of bearish calls that have not always come to fruition.
Still, the timing aligns with broader concerns about AI-linked valuations. SpaceX joined the Nasdaq 100 shortly after its debut, and the stock has since dropped roughly 29% from that milestone.
A delayed Starship test flight added to the negative sentiment this month.

Lockup Expiry Adds to the Pressure
SpaceX’s first major share unlock is scheduled for early August, two days after second-quarter earnings. Roughly 911.5 million shares, worth about $123 billion at recent prices, become eligible for sale.
Investors are already watching the stock’s share unlock schedule alongside dilution concerns tied to SpaceX’s reported Cursor AI acquisition. Some traders, however, still see a falling wedge pattern that could support a rebound near current levels.
Whether the stock and bond weakness spreads to crypto markets may become clearer once the lockup and earnings pass in August. Traders will likely watch SPCX bond yields as an early signal before any broader repricing hits digital assets.
The post SpaceX is a Warning For Crypto and Tech Stocks, Peter Schiff Says appeared first on BeInCrypto.
China’s Geely to make electric SUVs at Ford Spain plant, jointly develop model for Europe
Real neighborhood Spider-Man spontaneously saves wheelchair user from traffic incident

Luka Modric contract: One-year AC Milan extension for 40-year-old Croatian

Renter of Home in Anne Heche Crash Denies Settlement With Son

No Jackpot Winner as $257 Million Prize Rolls Over to $269 Million Monday Draw

Weekend Open Thread: Staud – Corporette.com

XRP FOMO IS LOADING! – PRICE OF XRP VS XLM & HBAR – MARKETCAP MULTIPLIER = HIDDEN CATALYST!

NEW Solo GTA 5 Online Money Glitch 2026! Frozen Money Glitch Method After Patch

XRP JUST IN! RUSSIA TAKING DOWN THE USA?!! ONLY 14 DAYS TO FIGHT BACK!
-

 Fashion6 days ago
Weekend Open Thread – Corporette.com
-

 Politics5 days ago
The House | The City of London can help the new chancellor deliver growth in every postcode
-
 Crypto World5 days ago
Ripple Payments Joins MiCA With 14 Firms, Does It Mean Anything For XRP?
-
 Crypto World6 days ago
Two July Windows Left: The CLARITY Act’s Senate Fight and What Failure Means
-

 Politics4 days ago
Democrats look to World Cup watch parties to register thousands of voters
-

 Crypto World6 days ago
Ripple wins EU-wide access as ESMA adds it to MiCA register
-

 Crypto World2 days ago
Grayscale Files For Worldcoin ETF, WLD Registers Sharp Rise
-

 NewsBeat3 days ago
Unregistered fitter used Gas Safe logo on business flyers
-
 Tech3 days ago
Sail Virtually Aboard The “Itanic” With IA-64 Emulator
-

 Crypto World7 days ago
Injective Submits SEC Transfer-Agent Registration to Onchain Ownership Records
-
 Tech3 days ago
Turtle Beach Command Series KB7 review: a nifty screen-equipped gaming keyboard
-

 NewsBeat6 days ago
Registration is now open for March for Men with Kev 2026
-
 Business2 days ago
New Jersey voter registration controversy explained: How 6,600 noncitizens got on the rolls, and what happens next
-

 Crypto World7 days ago
Claude Fable 5 Slips to Second in AI Coding Leaderboard
-

 News Videos6 days ago
Money | Class 12 Economics | CBSE Board Exam 2026-27
-

 Business7 days ago
Banco Bilbao Vizcaya Argentaria, S.A. (BBVA) Discusses Global Macro Environment and Economic Outlook for Core Markets Transcript
-

 Crypto World5 days ago
Kaspersky exposes OkoBot’s 20-module crypto wallet attack
-

 News Videos4 days ago
Big Money Is Entering XRP
-

 Business6 days ago
Airlines warn Sunshine Protection Act could disrupt flight scheduling
-

 NewsBeat6 days ago
Durham County Council to send out electoral registration emails
You must be logged in to post a comment Login