
Crypto World
Ethereum Price Struggles Below $2,000 Despite Entering Buy Zone
Ethereum price remains under pressure after a sharp decline that unsettled investors across the crypto market.
Although Ethereum appears to be entering a historically favorable accumulation zone, on-chain indicators reveal mixed conviction among different holder cohorts.
Sponsored
Sponsored
Ethereum Is In a Prime Accumulation Range
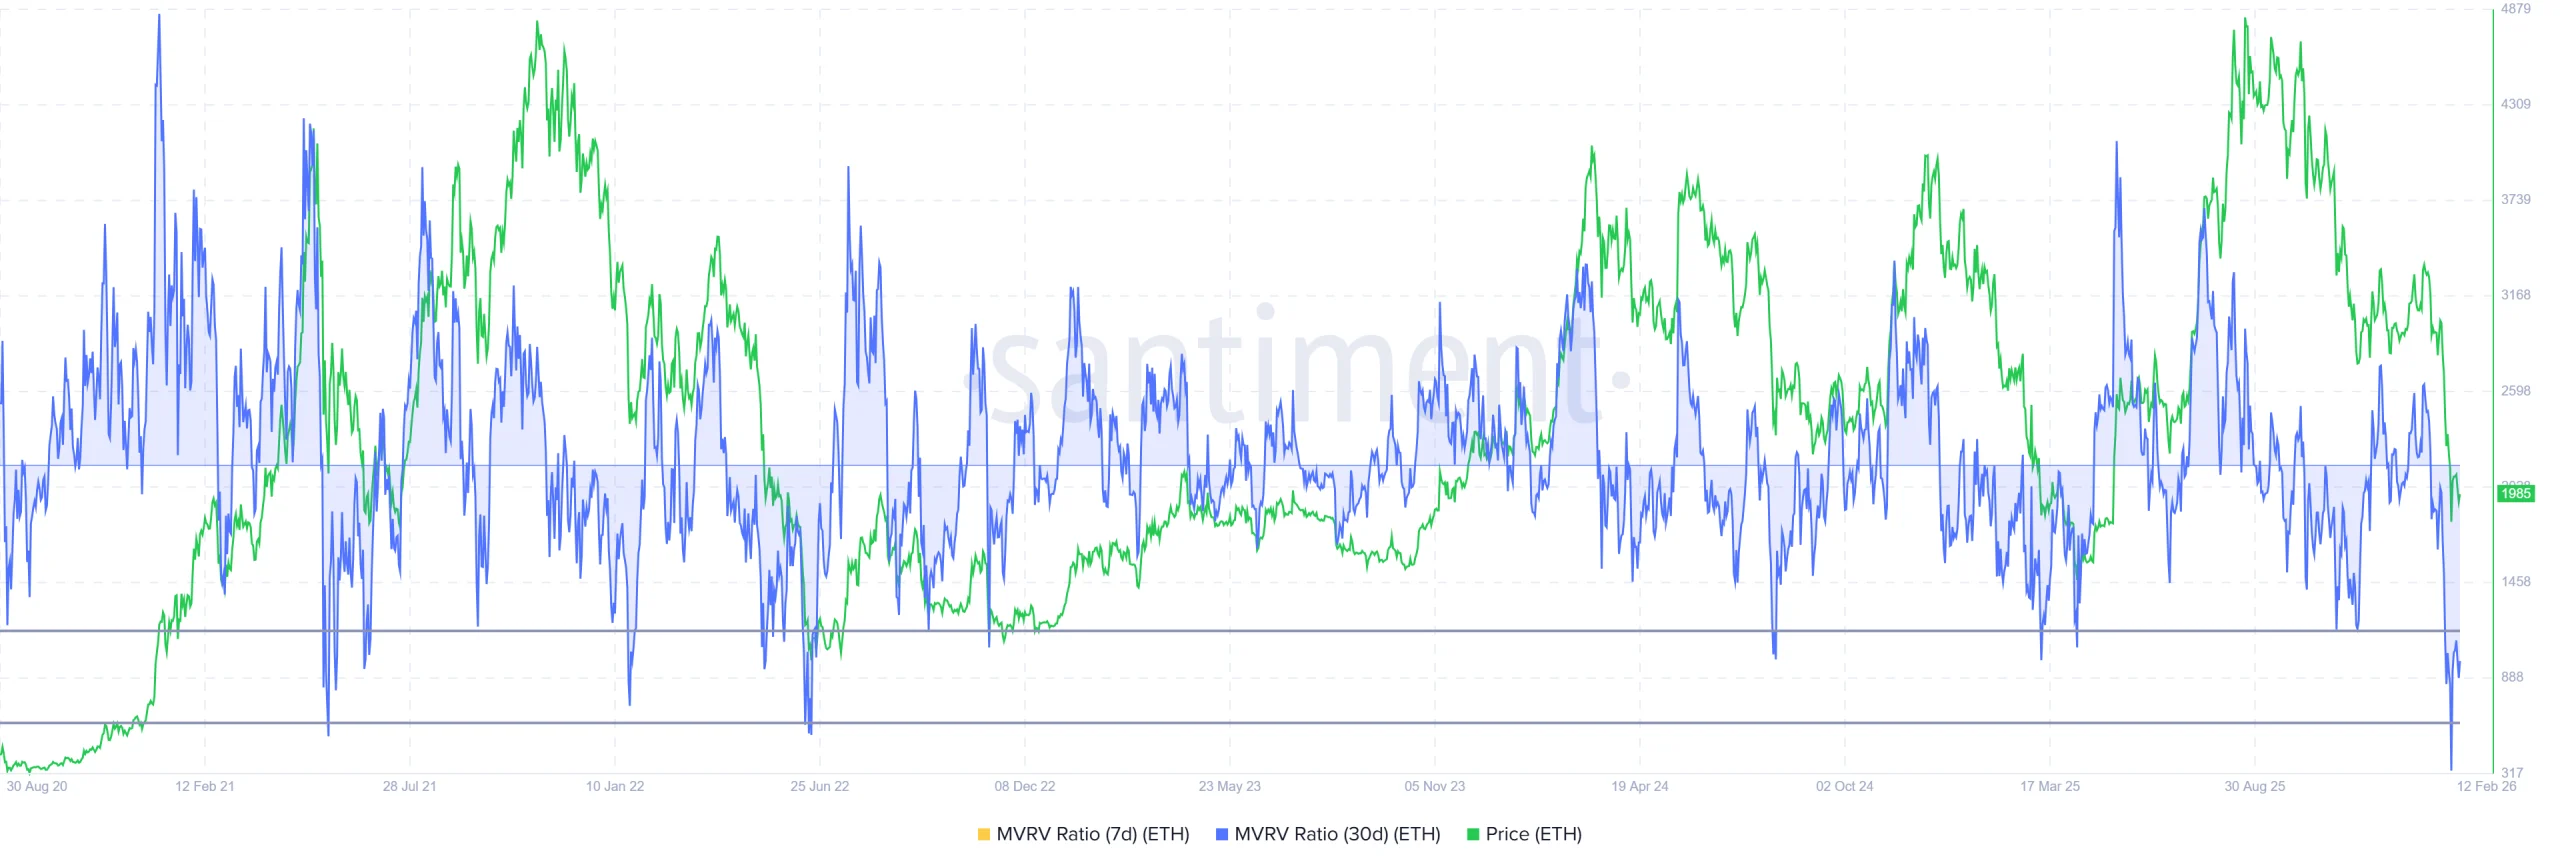
Ethereum’s Market Value to Realized Value, or MVRV, ratio indicates that ETH has entered what analysts describe as an “opportunity zone.” This range lies between negative 18% and negative 28%. Historically, when MVRV falls into this band, selling pressure approaches exhaustion.
Previous entries into this zone often preceded price reversals. Investors typically accumulate when unrealized losses deepen. Such behavior can stabilize the Ethereum price and initiate recovery phases. However, historical probability does not guarantee immediate upside.
Want more token insights like this? Sign up for Editor Harsh Notariya’s Daily Crypto Newsletter here.
Current macro conditions complicate the outlook. Liquidity constraints and cautious sentiment may delay accumulation. While MVRV suggests undervaluation relative to realized cost basis, broader market weakness could suppress momentum and extend consolidation before any meaningful rebound begins.
Ethereum Holders Are Leaning Differently
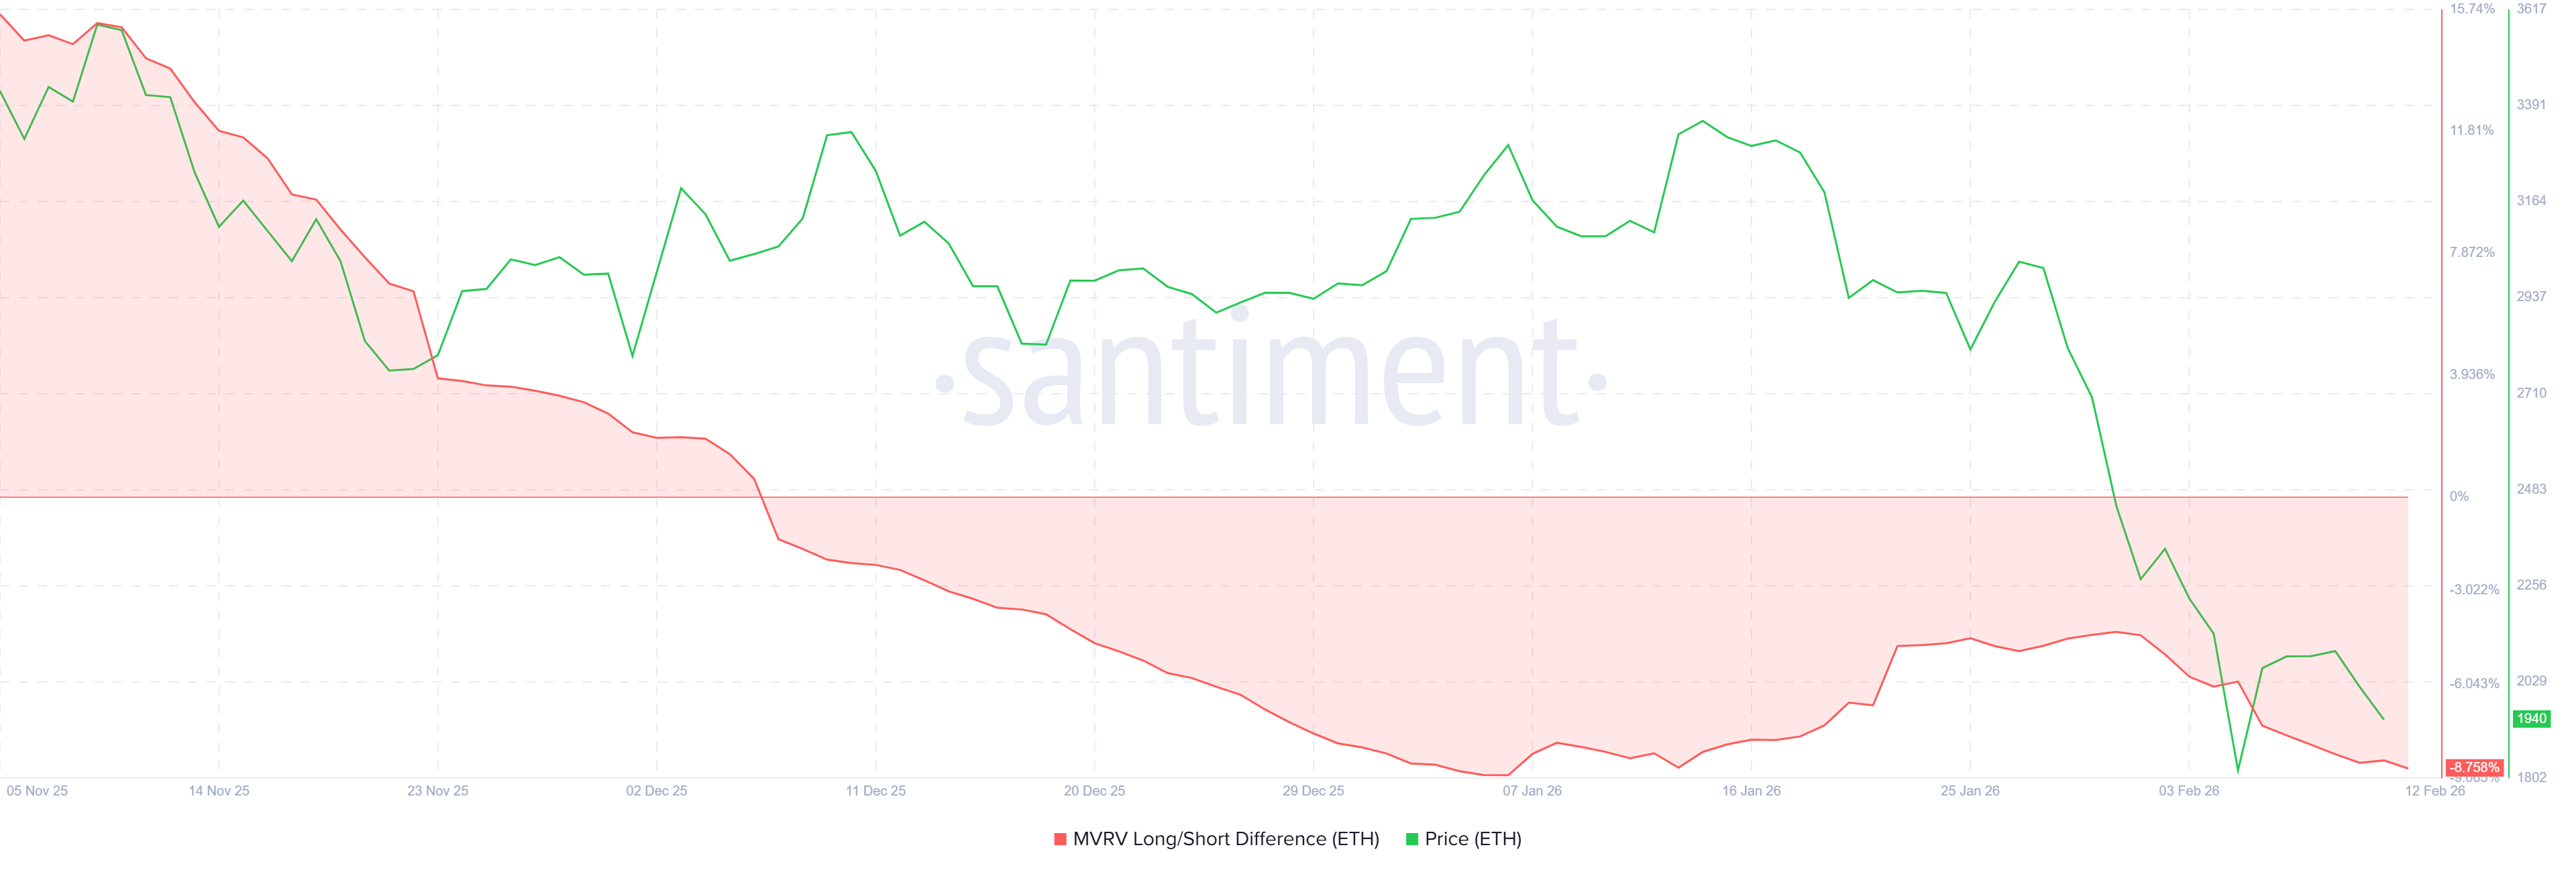
Short-term holders are regaining influence over Ethereum price action. The MVRV Long/Short Difference measures profitability between long-term and short-term holders. Deeply negative readings signal greater profitability among short-term holders compared to long-term investors.
Sponsored
Sponsored
Toward the end of January, the metric suggested profitability was shifting away from short-term traders. That trend hinted at an improving structure. However, the recent decline reversed that dynamic, restoring short-term holder profits. These investors typically sell quickly, increasing vulnerability to renewed downside pressure.
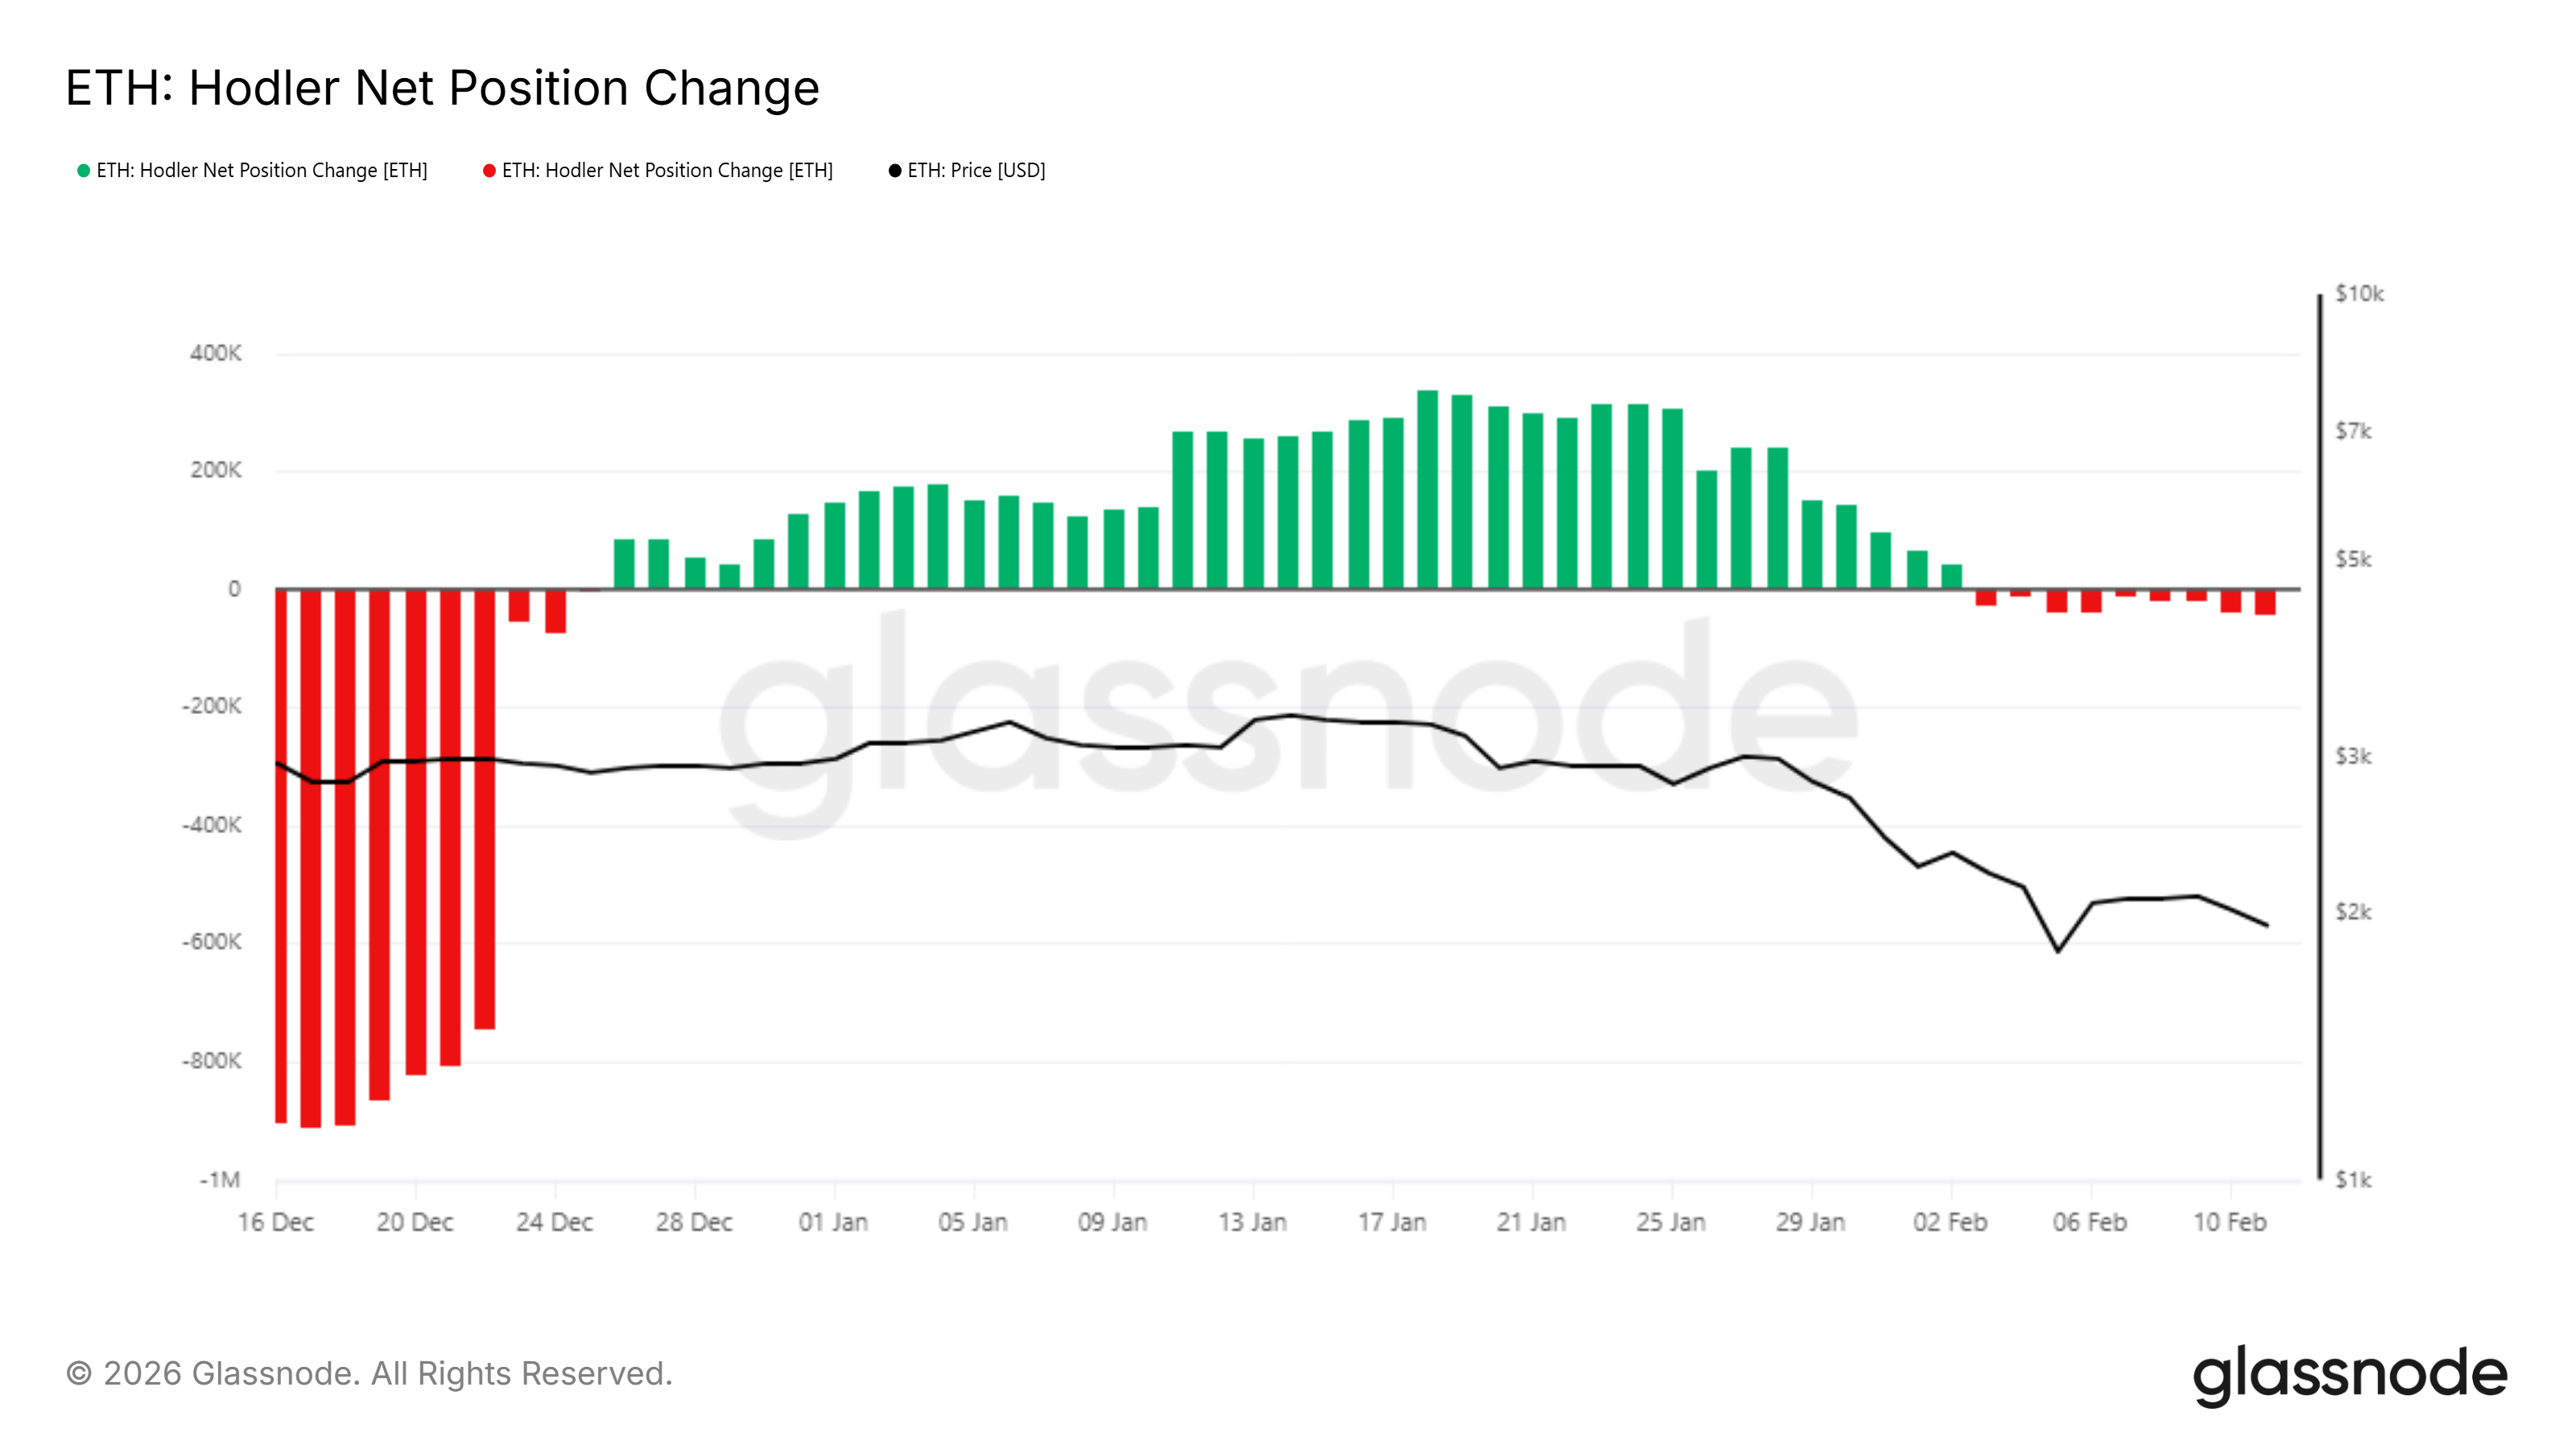
The HODLer net position change metric reveals another shift. Long-term holders previously exhibited steady accumulation. In recent days, the buying pressure has transitioned into distribution, reflecting reduced confidence among strategic investors.
Long-term holder selling adds structural risk. These participants often provide foundational support during downturns. Without renewed accumulation from this cohort, the Ethereum price may struggle to absorb supply. Current data shows limited evidence of strong counterbalancing demand.
ETH Price May Look At Consolidation
Ethereum price trades at $1,983 and remains above the $1,811 support level. Despite this stability, the altcoin recently marked a nine-month low at $1,743. Maintaining $1,811 is critical to prevent deeper technical deterioration.
Given ongoing selling from both short-term and long-term holders, recovery may face resistance near $2,238. Continued weakness could keep ETH trading closer to support rather than challenging overhead barriers. A confirmed breakdown below $1,811 may expose Ethereum to $1,571.
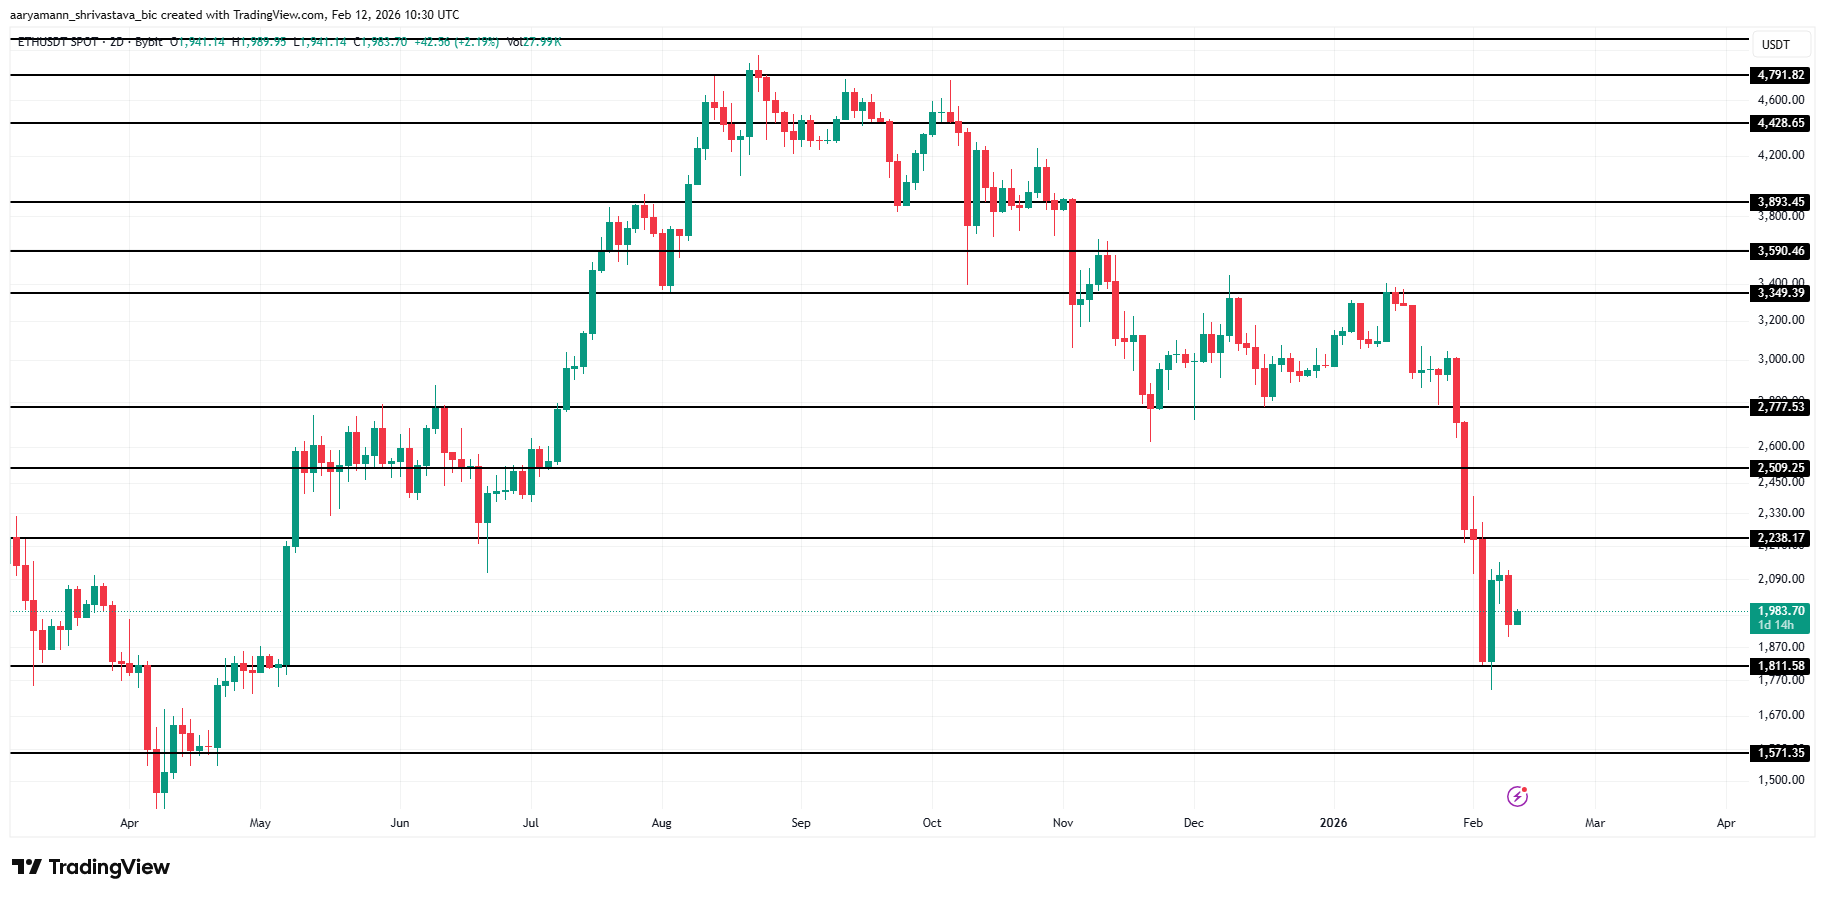
Alternatively, reduced selling from short-term holders could ease pressure. If long-term holders resume accumulation, Ethereum may attempt a stronger rebound. A decisive move above $2,238, followed by a rally past $2,509, would invalidate the bearish thesis and improve the medium-term outlook.

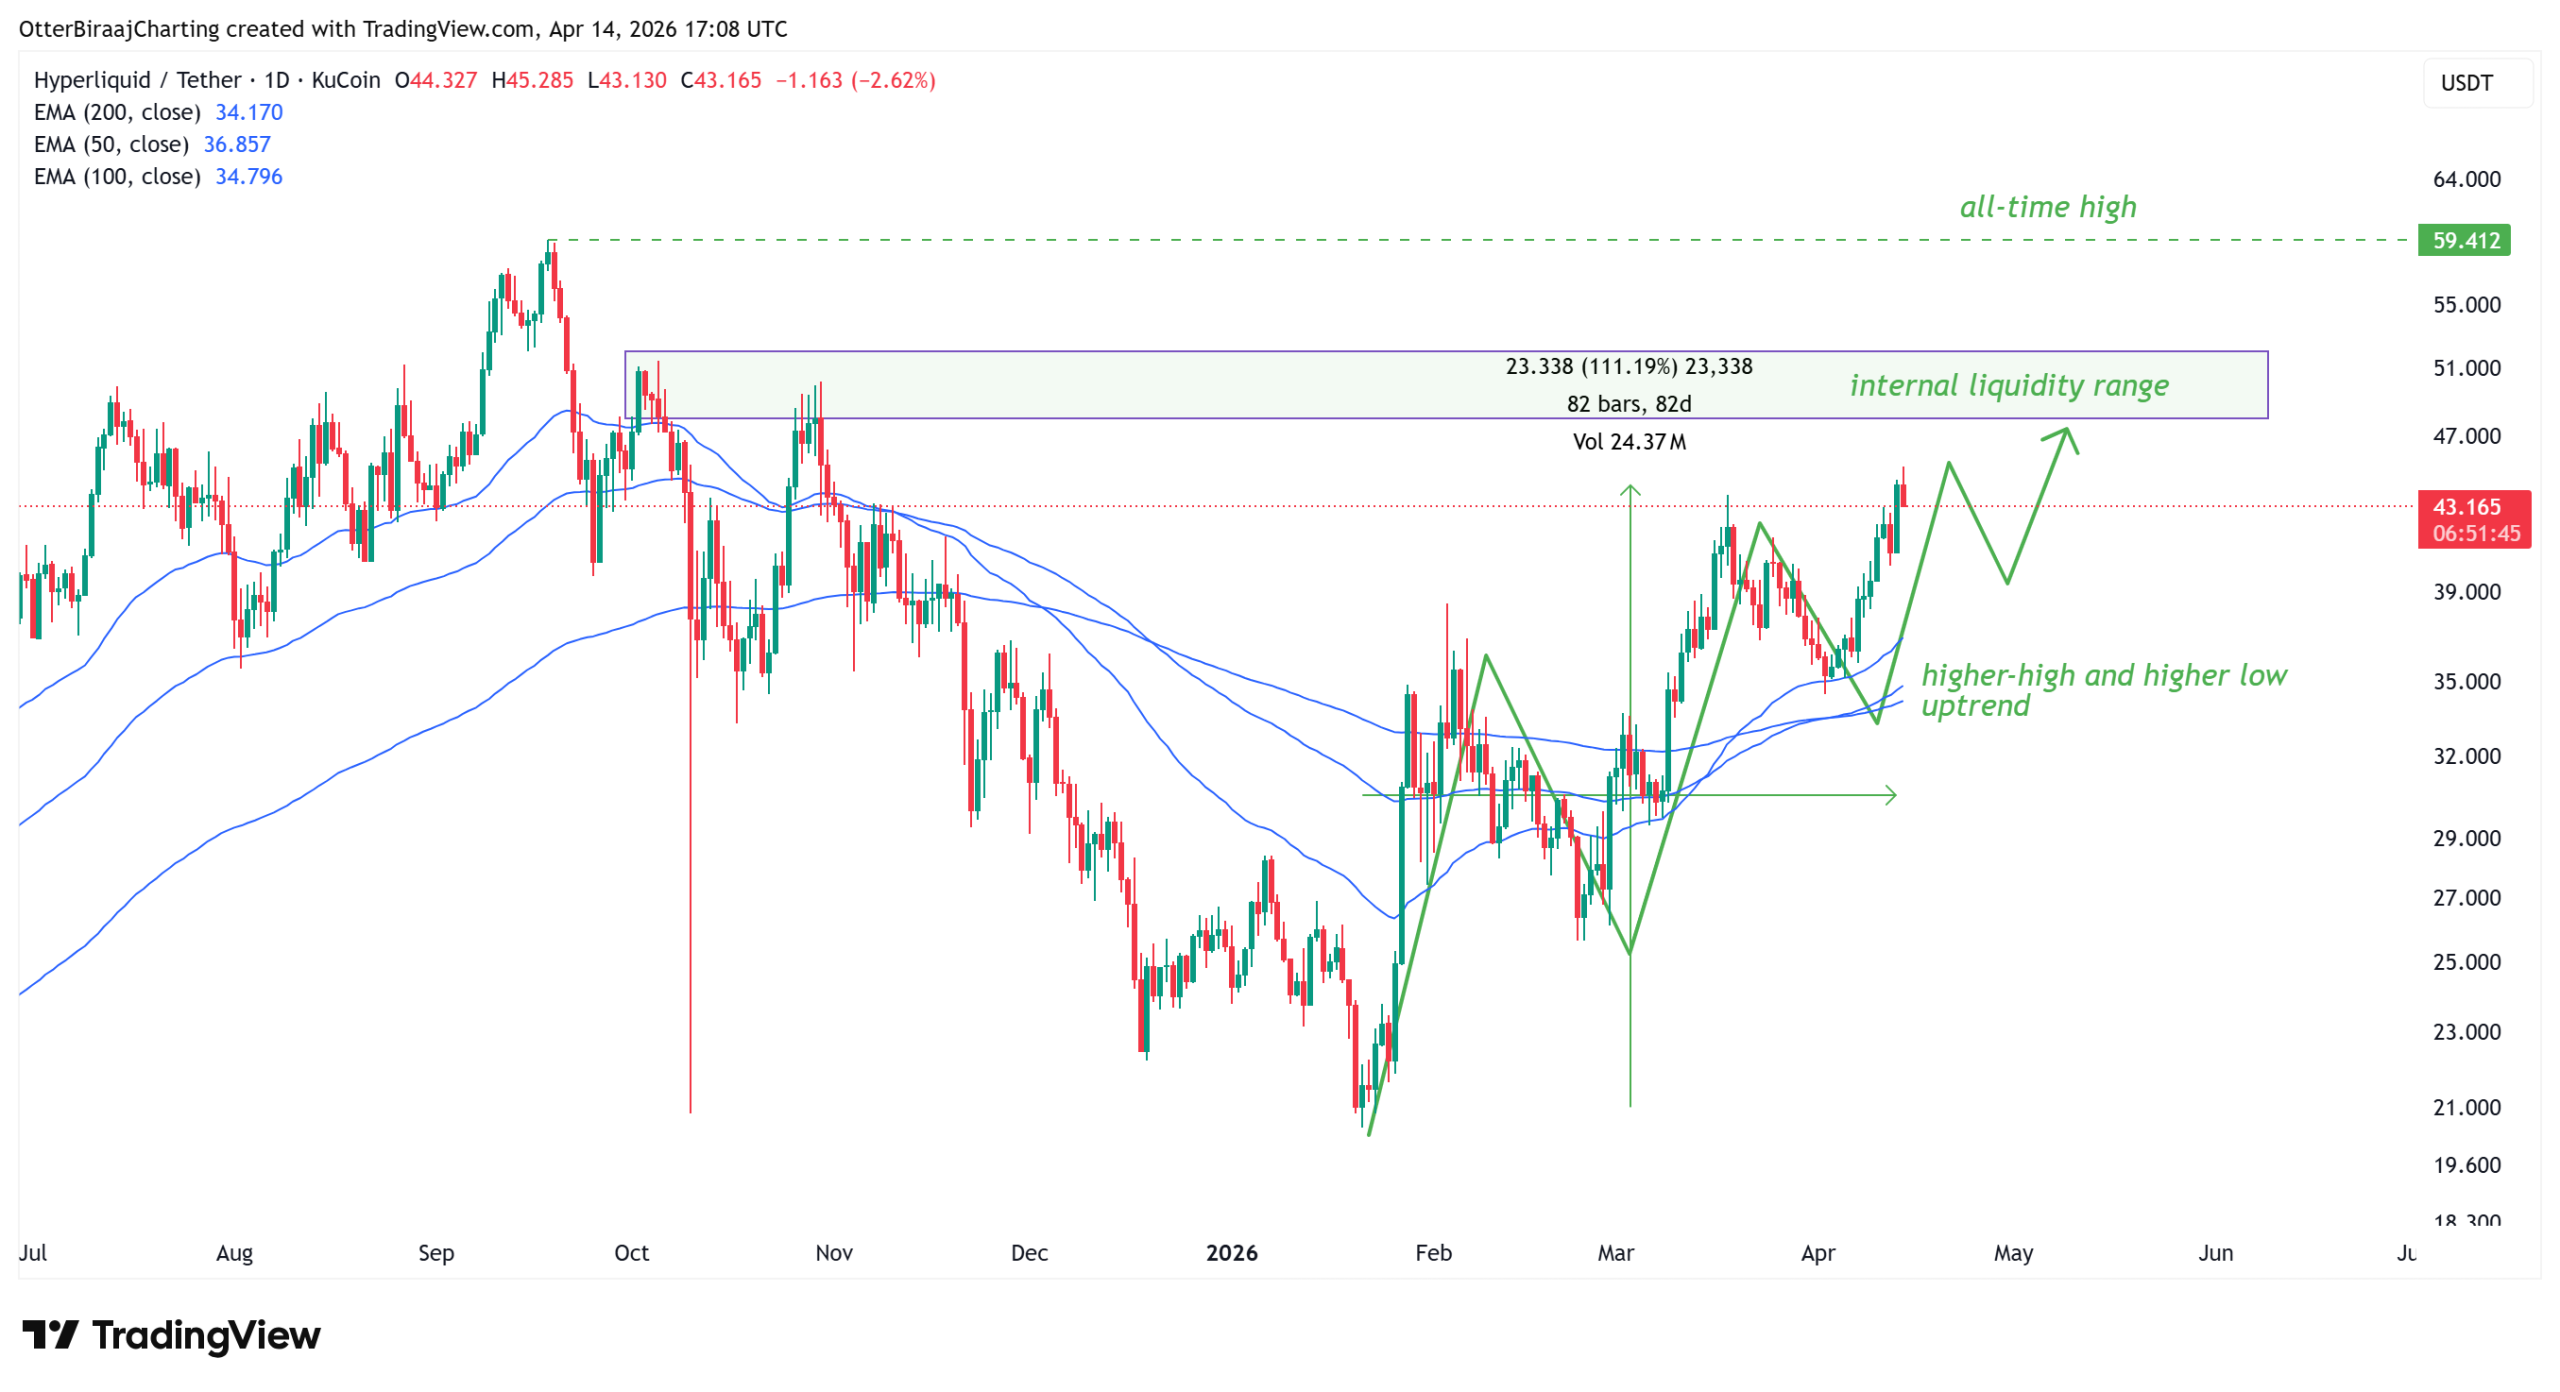
Hyperliquid’s native token HYPE (HYPE) re-tested $45 on Tuesday, marking its highest value since October 31, 2025. The rally extends a 108% rally from its yearly low at $21 on Jan. 21.
With HYPE price pushing toward all-time highs, market demand signals remain mixed, as weak spot buying activity threatens to slow the rally’s momentum.

HYPE price trend and onchain data diverge
HYPE currently trades 26% below its all-time high of $59, with relatively thin resistance between the current levels and its peak. The next liquidity zone lies between $52 and $48 and could be reached if momentum sustains. However, the HYPE spot and futures trading data suggest the rally is not entirely conviction-driven.
The spot cumulative volume delta (CVD) has gradually declined to -$41.48 million, even as prices have risen. This divergence suggests the rally is being supported more by passive demand without aggressive spot buying.
Meanwhile, the futures CVD has stayed mostly flat near -$748 million over the past month, after recovering from lows near -$900 million.

The open interest (OI) has risen steadily to $1.38 billion, near local highs and signaling an increased market participation.
However, rising OI alongside weak futures CVD suggests traders may be in positions without strong conviction in the bullish price trend.
As a result, the market may become more vulnerable to sharp, liquidation-driven moves once the bullish trend fades.
Related: Tether launches self-custodial wallet with cloud backup option
BitMEX founder say HYPE may gain 200% by August
In March, BitMEX co-founder Arthur Hayes said HYPE could reach $150 if Hyperliquid expands its dominance in the futures market and its product suite.
Hayes’ thesis centers on the continued market-share gains from centralized exchanges and the rising protocol revenue.
Hyperliquid’s 30-day annualized revenue run rate stood at $843 million in March, and it would need to reach $1.4 billion by August. That implies a 66% increase within five months.
Hyperliquid allocates up to 97% of its revenue to buying HYPE from the open market, creating a direct link between trading activity and token demand.
HIP-3, a protocol upgrade enabling trading of non-crypto assets like commodities, contributes close to 10% of revenue and could drive further expansion, especially as assets like gold and oil gain traction on the platform.
RWA trading on Hyperliquid continues to reach new ATHs week after week, surpassing $2.3B in open interest pic.twitter.com/R9uDCAx3fo
— Hyperliquid (@HyperliquidX) April 6, 2026
The real-world asset (RWA) trading activity on Hyperliquid has also accelerated sharply, with open interest rising to $2.3 billion on April 6. This marks an increase of over 190% from March levels and nearly 800% from early-year lows.
This growth pace for the protocol and its market-share gains could play a key role in any extended price move for the altcoin.
Related: XRP consolidation may transform into explosive rally if $1.40 is topped: Data
This article is produced in accordance with Cointelegraph’s Editorial Policy and is intended for informational purposes only. It does not constitute investment advice or recommendations. All investments and trades carry risk; readers are encouraged to conduct independent research before making any decisions. Cointelegraph makes no guarantees regarding the accuracy or completeness of the information presented, including forward-looking statements, and will not be liable for any loss or damage arising from reliance on this content.
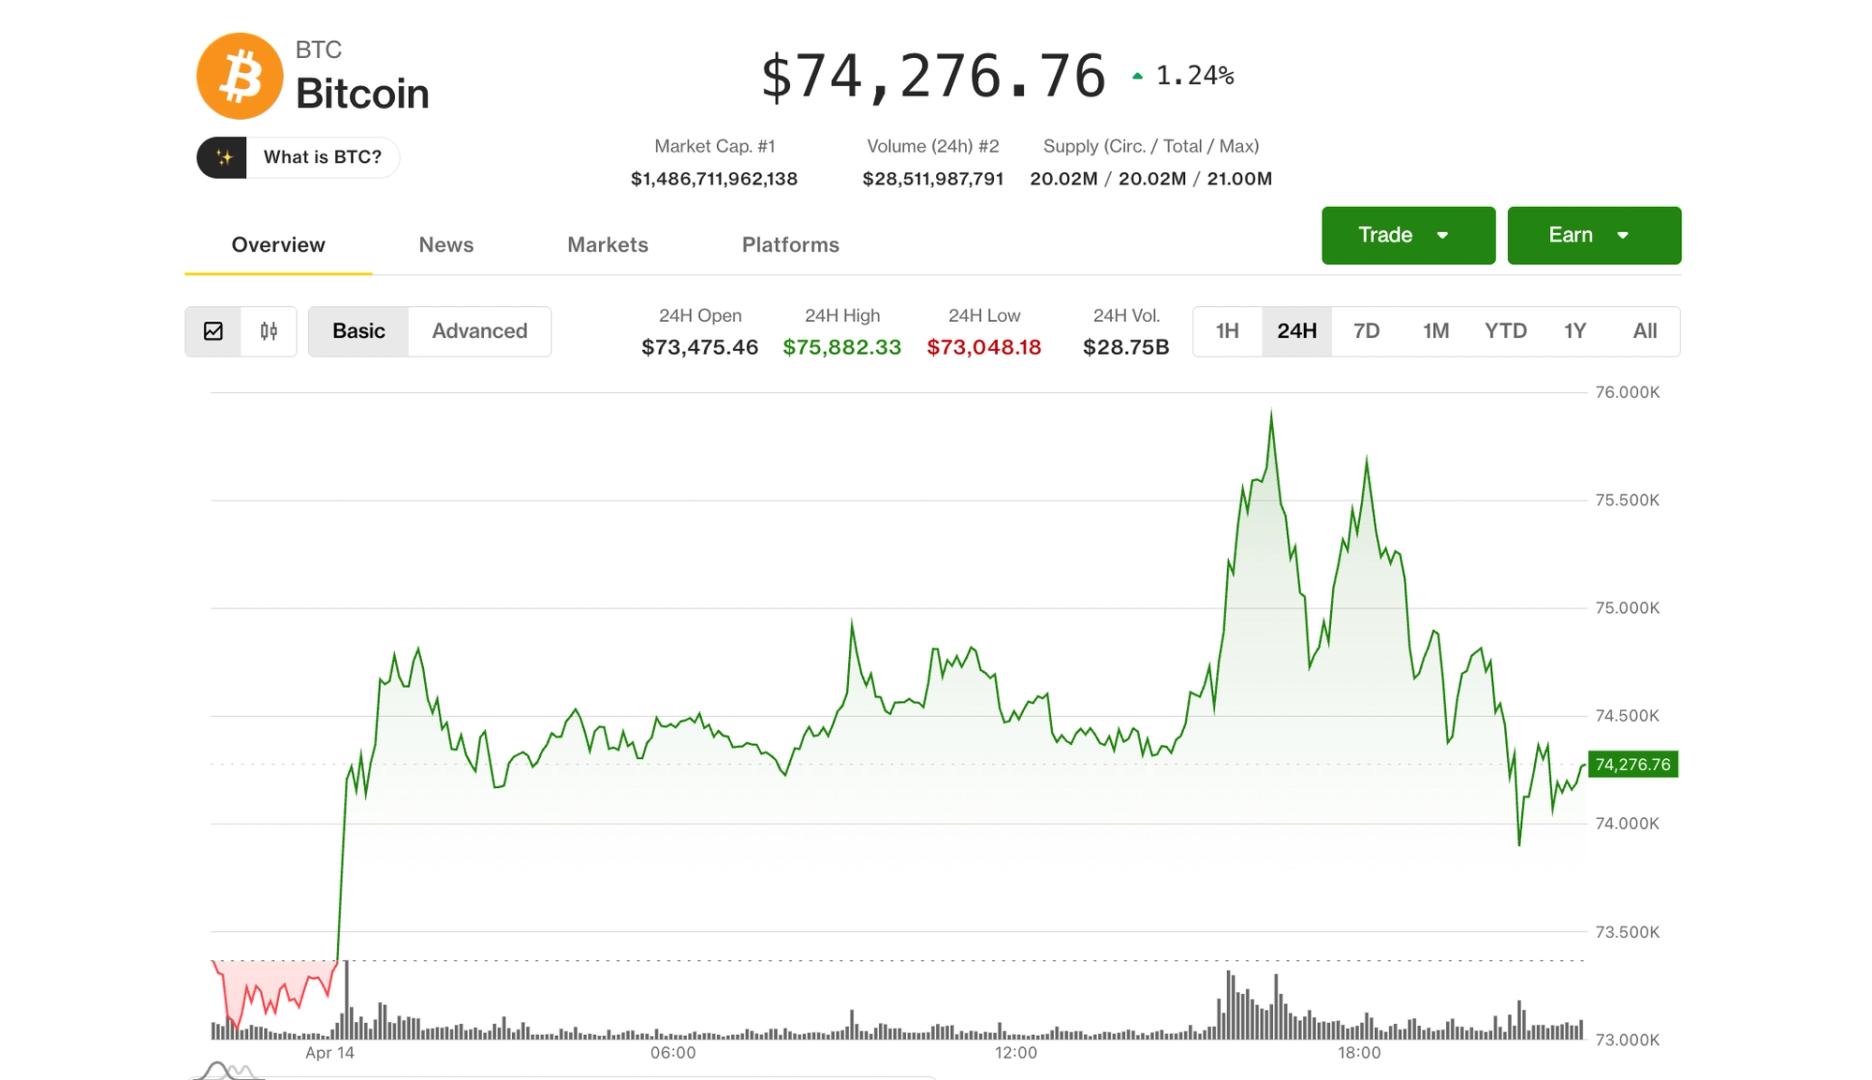

Bitcoin started the day with a promising chance for a breakout, but the rally fizzled out at a familiar brick wall that has kept a lid on prices for more than two months.
After briefly topping $76,000 — a key resistance level — the largest crypto reversed course, slipping below $74,000 later in the session. It still held onto a 1.3% gain over the past 24 hours, recently changing hands near $74,300.
Ether (ETH) followed a similar path, pulling back from above $2,400, but still outperformed, advancing 2.5% daily.
Traditional markets saw no such reversal, with the Nasdaq closing at its session high, up 2%. The S&P 500 rose 1.2% and now stands within a handful of points of hitting a new record high — a sharp contrast to bitcoin, which remains about 40% below its record of $126,000.
Still, the conditions are ripe for a squeeze higher in crypto even as Tuesday’s breakout didn’t hold.
According to Vetle Lunde, head of research at K33 Research, funding rates on Binance’s bitcoin perpetuals have remained negative for 11 consecutive periods despite the recent rally, signaling traders are still leaning bearish even as prices push higher. At the same time, open interest has been rising, suggesting new short positions are being added rather than closed, he said.
That combination has historically set the stage for sharp upside moves, he said.
The 30-day average funding rate has now been negative for 46 straight days, Lunde added, matching the extended bearish positioning seen during past market stress periods, such as after the FTX crash in late 2022 and the mid-2021 bear market when China banned bitcoin mining.
“Comparable risk-off regimes have historically been attractive entry points for BTC,” Lunde said, as crowded short trades were forced to unwind.


U.S. equities closed sharply higher on Tuesday, with the Nasdaq Composite climbing 1.96% and locking in gains for 10 consecutive trading days, underscoring renewed risk appetite in big‑cap technology.
Summary
- Nasdaq jumps nearly 2% to log 10 straight days of gains.
- Dow and S&P 500 also close higher, powered by mega‑cap tech.
- Chinese tech stocks rally, with iQIYI and JD.com surging in U.S. trading.
The S&P 500 added 1.1%, while the Dow Jones Industrial Average rose 0.66%, according to market data from Gate.
Chipmaker Nvidia and e‑commerce giant Amazon each advanced 3.8%, extending a powerful rebound in U.S. growth stocks that have led major indices back toward record territory. Electric‑vehicle maker Tesla also gained more than 3%, adding further momentum to the tech‑heavy Nasdaq’s winning streak.
The performance of these mega‑cap names continues to exert an outsized influence on U.S. benchmarks, with investors rotating back into longer‑duration growth assets as earnings optimism builds. Their simultaneous surge helped push the Nasdaq to its 10‑day run, a relatively rare stretch that points to strong short‑term bullish sentiment in the sector.
The Nasdaq Golden Dragon China Index, which tracks Chinese companies listed on U.S. exchanges, closed up 2.3% on the day. Within the basket, streaming platform iQIYI jumped 11%, while e‑commerce heavyweight JD.com soared nearly 8%, signaling renewed investor interest in U.S.‑traded Chinese tech.
The sharp move in Chinese ADRs highlights how global growth and tech narratives are increasingly intertwined across U.S. and Asian markets. As Wall Street’s rally broadens beyond U.S. mega‑caps, moves in indices such as the Golden Dragon China suggest investors are again willing to add exposure to higher‑beta internet and platform plays listed in New York.

TLDR
- High Roller Technologies announced plans to launch a U.S. prediction market in partnership with Crypto.com.
- The company will offer event-based contracts across finance, sports, and entertainment sectors.
- Crypto.com Derivatives North America will provide the infrastructure as a CFTC-registered exchange and clearinghouse.
- High Roller’s stock surged by as much as 130% following the announcement.
- The shares later traded about 65% higher at $8.32 during the same trading session.
High Roller Technologies Inc. announced plans to launch a U.S. event-based prediction market with Crypto.com. The announcement triggered a sharp rise in the company’s stock price. Investors responded immediately as shares surged during early trading.
ROLR Shares Surge After Prediction Market Plan
High Roller Technologies revealed its intention to introduce event contracts for U.S. customers. The Las Vegas-based online casino operator plans to offer contracts across finance, sports, and entertainment sectors.
The company confirmed that Crypto.com Derivatives North America will provide the event contracts. CDNA operates as a CFTC-registered exchange and clearinghouse in the United States.
Following the announcement, High Roller’s stock climbed as much as 130% during trading. Shares later stabilized, trading 65% higher at $8.32.
Company representatives emphasized regulatory compliance and operational readiness. A spokesperson stated, “This collaboration expands our product offering while adhering to U.S. regulatory standards.”
High Roller did not disclose a specific launch date for the prediction market. However, the company indicated that preparations for the rollout are already underway.
Market participants viewed the development as an expansion of High Roller’s digital gaming services. The company aims to integrate prediction markets into its existing customer platform.
Crypto.com Collaboration and Market Outlook
The partnership with Crypto.com strengthens High Roller’s entry into regulated prediction markets. Crypto.com’s affiliate, CDNA, will supply the infrastructure and clearing services.
Crypto.com’s CRO token reacted positively to the announcement. The token gained approximately 3% and traded near $0.07 following the news.
Prediction markets have evolved into platforms that aggregate probabilities of real-world events. Leading participants include Kalshi, a regulated U.S. exchange, and Polymarket, a decentralized marketplace.
High Roller stated that the prediction market sector could exceed $1 trillion in trading volume by 2030. The company highlighted increasing institutional and retail interest in event-based contracts.
Industry data indicates steady revenue growth within prediction markets. A recent Citizens report estimated annualized revenue above $3 billion.
The same report projected that revenues could reach $10 billion by 2030. These figures reflect expanding adoption across finance, sports, and entertainment categories.
High Roller reiterated its commitment to regulatory compliance and customer engagement. The company plans to provide accessible event contracts through its digital gaming ecosystem.
Crypto.com confirmed its role as infrastructure provider for the initiative. CDNA will manage trading and clearing operations once the platform becomes operational.

Goldman Sachs has filed with the US Securities and Exchange Commission (SEC) to launch a Bitcoin-linked exchange-traded fund designed to generate income while limiting exposure to the cryptocurrency’s volatility, according to a preliminary prospectus dated April 14.
The proposed Goldman Sachs Bitcoin Premium Income ETF would aim to deliver current income alongside capital appreciation by investing primarily in spot Bitcoin exchange-traded products (ETPs) and related options, rather than holding Bitcoin (BTC) directly.
The fund would generate yield by selling call options on Bitcoin-linked ETPs, a strategy that can produce premium income but may cap upside in rising markets.
According to the filing, the actively managed fund would maintain at least 80% exposure to Bitcoin-linked assets and could allocate as much as 25% of its holdings through a Cayman Islands subsidiary, a structure commonly used to gain commodities exposure under the US Investment Company Act.
The fund expects to vary its options “overwrite” strategy — that is, selling call options against its holdings — between roughly 40% and 100% of its Bitcoin exposure depending on market conditions, and may distribute a significant portion of returns as income or return of capital.
It would gain exposure through a mix of spot Bitcoin ETPs and derivatives, combining direct holdings with options-based positions. The strategy may perform better in flat or moderately rising markets but could underperform during strong rallies as upside is capped.
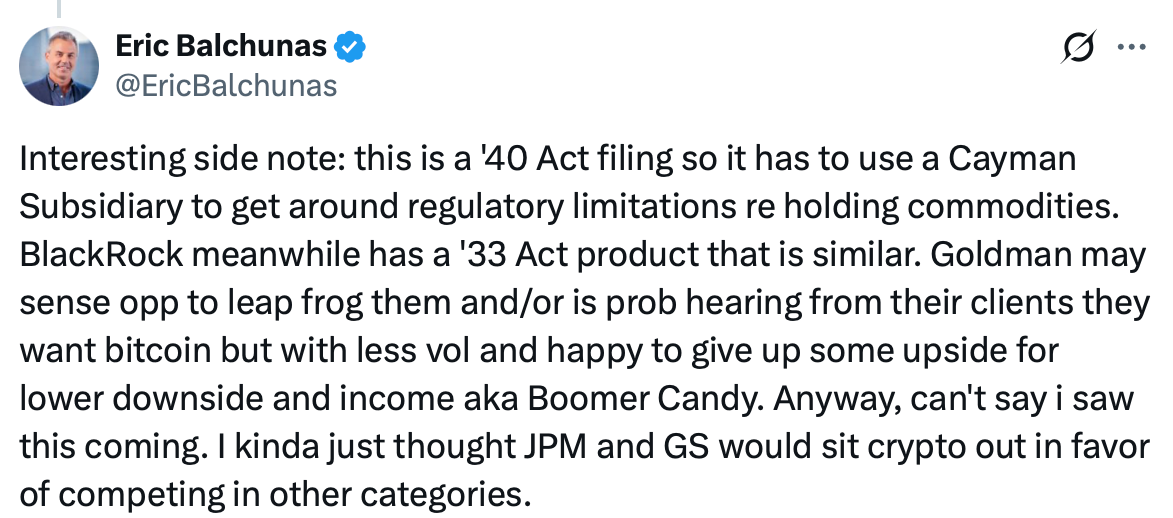
Eric Balchunas, ETF analyst at Bloomberg, described the product as “Boomer Candy” in a post on X, suggesting the structure may appeal to investors seeking income and lower volatility over full upside exposure.

Separately, Goldman Chair and CEO David Solomon told analysts on Monday that the company last week closed on its acquisition of Innovator Capital Management, an issuer of defined outcome exchange-traded funds. The addition of Innovator’s 170 ETFs puts Goldman in the top 10 of global active ETF providers, Solomon said on the first-quarter earnings call.
Related: Bitcoin ETFs clock $291M outflows as BTC blasts past $74K
Active crypto ETFs gain traction as strategies evolve beyond price tracking
The filing from Goldman Sachs comes as asset managers move beyond basic price-tracking crypto funds, with more complex and actively managed strategies gaining traction across the ETF market.
In January, Bitwise Asset Management launched an actively managed ETF designed to hedge against currency debasement. The fund allocates across assets including Bitcoin, precious metals and mining equities, reflecting a broader push to integrate digital assets into diversified, macro-focused portfolios.
In March, T. Rowe Price amended its filing with the SEC for a proposed actively managed crypto ETF that would invest directly in digital assets. The updated prospectus outlines a portfolio that may include assets such as Bitcoin, Ethereum (ETH) and Solana (SOL).
Fund issuer 21Shares is also expanding into more sophisticated strategies. In February, the company launched a Europe-listed ETP tied to Strategy’s preferred stock (STRC), offering exposure to a yield-generating instrument linked to the company’s Bitcoin-focused capital strategy.
Speaking to Cointelegraph, 21Shares President Duncan Moir said the shift reflects broader demand for more advanced products, noting that crypto is “particularly well-suited to active management.”
According to a March report compiled by Morningstar and Goldman Sachs Asset Management, active ETFs held nearly $1.8 trillion in assets globally at the end of 2025, with flows significantly outpacing passive products.

Magazine: Should users be allowed to bet on war and death in prediction markets?

Goldman Sachs has filed with the U.S. Securities and Exchange Commission to launch a Bitcoin Premium Income ETF that aims to deliver current income while shielding investors from Bitcoin’s full volatility. The preliminary prospectus, dated April 14, outlines a vehicle that would invest primarily in spot Bitcoin exchange-traded products (ETPs) and related options rather than holding BTC directly.
According to the filing, the actively managed fund would generate yield by selling call options on Bitcoin-linked ETPs. This “overwrite” strategy can produce premium income but may cap upside in a strong rally. The fund would maintain at least 80% exposure to Bitcoin-linked assets and could allocate as much as 25% of its holdings through a Cayman Islands subsidiary, a structure commonly used to access commodities exposure under the U.S. Investment Company Act.
The prospectus indicates the fund will vary its overwrite policy between about 40% and 100% of its Bitcoin exposure depending on market conditions, and it may distribute a substantial portion of returns as income or a return of capital. Exposure would be gained through a mix of spot Bitcoin ETPs and derivatives, combining direct holdings with options-based positions. The strategy is described as potentially stronger in flat or moderately rising markets, but it could underperform during sharp rallies when upside is capped.
Bloomberg ETF analyst Eric Balchunas described the product as “Boomer Candy” in a post on X, suggesting the structure could attract investors seeking income and lower volatility relative to full upside exposure to BTC. Eric Balchunas noted the appeal lies in capturing yield while mitigating some of Bitcoin’s amplitude, a dynamic that may resonate with risk-managed portfolios.
Separately, Goldman Chair and CEO David Solomon told analysts that Goldman had recently closed its acquisition of Innovator Capital Management, an ETF issuer known for defined-outcome products. Solomon said the acquisition, which adds Innovator’s 170 ETFs to Goldman’s lineup, places the bank in the top 10 of global active ETF providers, a signal of the bank’s broader push into more sophisticated ETF strategies.
Cointelegraph’s coverage of related developments underscores a broader shift in the crypto ETF landscape—from passive price-tracking products to actively managed and outcome-oriented strategies. Bitcoin ETFs have drawn attention as asset managers experiment with yield-generating approaches and macro-linked allocations, reflecting demand for crypto exposure that blends returns with risk controls.
In a related trend report, Bitwise Asset Management in January launched an actively managed ETF designed to hedge against currency debasement, allocating across Bitcoin, precious metals, and mining equities. In March, T. Rowe Price amended its filing for a proposed actively managed crypto ETF that could hold directly in digital assets such as Bitcoin, Ethereum and Solana. Meanwhile, 21Shares has been expanding into more sophisticated active-management structures, including Europe-listed instruments tied to the firm’s Bitcoin-focused strategies. Duncan Moir, 21Shares President, frames these moves as a response to growing demand for active crypto products that can operate within diversified portfolios.
Morningstar and Goldman Sachs Asset Management published a March report examining why active ETFs are gaining momentum, noting that active ETFs globally held nearly $1.8 trillion in assets at the end of 2025, with flows significantly outpacing passive equivalents. The report highlighted a shift in investor appetite toward products that can adapt to changing market regimes, rather than simply tracking an index.
Key takeaways
- Goldman Sachs’ proposed Bitcoin Premium Income ETF would invest primarily in spot Bitcoin ETPs and related options, not hold Bitcoin directly, and would target at least 80% exposure to Bitcoin-linked assets with up to 25% via a Cayman Islands subsidiary.
- The fund would generate yield by selling call options on Bitcoin-linked ETPs, with an overwriting strategy that could range from 40% to 100% of Bitcoin exposure depending on market conditions, potentially distributing income or return of capital.
- The product represents a broader move toward active crypto ETFs, reflecting a demand for income-focused and risk-managed crypto exposure beyond simple price-tracking funds.
- Industry momentum behind active crypto strategies is supported by data showing growing assets in active ETFs (nearly $1.8 trillion globally by end-2025) and continued expansions from Bitwise, T. Rowe Price, and 21Shares, among others.
Active strategies expanding beyond price tracking
The Goldman filing sits within a wider pattern of asset managers exploring active and outcome-focused crypto funds. Bitwise Asset Management, for instance, debuted an actively managed ETF aimed at hedging against currency debasement, while T. Rowe Price has amended its filing to pursue direct crypto holdings in an actively managed format. 21Shares has pushed into more sophisticated strategies, including Europe-listed products tied to its Bitcoin-centric approach.
Industry participants say the shift toward active management reflects investors’ preference for instruments that can adapt to macro conditions and provide additional income streams. Duncan Moir of 21Shares noted that crypto assets are particularly well-suited to active management given their structural volatility and evolving use cases. A March Morningstar-Goldman Sachs Asset Management report reinforces the trend, showing high growth in active ETF assets and suggesting continued momentum for active products in digital-asset markets.
What this means for investors and the market
For investors, Goldman’s proposed Bitcoin Premium Income ETF could offer a familiar mechanism—income generation through option premiums—applied to the crypto frontier, with a measured exposure to BTC through a diversified mix of ETPs and derivatives. The upside is that the fund seeks to reduce some volatility by selling calls and by using a Cayman-domiciled subsidiary structure to access commodity-like exposure. However, the trade-off is a capped upside during strong upside runs, which may diminish the potential for dramatic crypto rallies.
Regulatory scrutiny will be a key factor going forward. The filing lays out a framework that, if approved, would give investors a new way to gain crypto exposure through an income-oriented vehicle rather than direct ownership. Market participants will watch how the SEC weighs such designs, and whether additional disclosure or structural tweaks emerge as the product path unfolds.
Beyond Goldman’s filing, the broader trend toward actively managed crypto ETFs points to a more sophisticated ecosystem where macro themes, volatility regimes, and income considerations intersect with digital-asset exposure. As Morningstar and Goldman Sachs Asset Management highlighted, active ETFs have grown to nearly $1.8 trillion in global assets by late 2025, underscoring a shift toward products designed for more nuanced risk/return profiles.
For traders and institutions, the era of crypto ETFs that blend yield generation with strategic exposure may offer new hedging tools and portfolio options. Yet, as with any new financial product, performance will hinge on market regimes, liquidity, and the SEC’s eventual stance on such structures. The ongoing evolution—driven by major banks and dedicated ETF issuers—suggests that 2026 could feature more active crypto wrappers that balance income, risk, and capital appreciation in innovative ways.
As readers monitor next steps, keep an eye on how regulatory clearances shape the rollout of these products and how performance compares with traditional crypto income vehicles. The coming quarters will reveal whether Goldman’s approach, and similar strategies, can deliver reliable income without sacrificing the upside that has powered Bitcoin’s long-run narrative.

In this photo illustration, Apps for online prediction market sites are shown on an electronic device on Feb. 25, 2026 in Chicago, Illinois.
Scott Olson | Getty Images
Prediction market volumes are booming in 2026, on pace to more than quadruple this year alone and reach an estimated $1 trillion in the next four years, according to Bernstein.
Volumes have already surged in the first few months of this year, the investment bank wrote in a report Tuesday, with Kalshi and Polymarket, the two largest platforms, seeing about $60 billion in market volume year-to-date — more than the $51 billion in total prediction market volume in all of 2025.
Growth rates for the platforms rival the artificial intelligence boom, according to Bank of America. Analyst Julie Hoover in a note last week called Kalshi one of the “fastest growing non-AI companies” in the U.S. Weekly trading volume on Kalshi — which controls more than 90% of the U.S. prediction market — has surged to more than $3 billion today from about $100 million a year ago, she wrote.
While prediction market volumes initially jumped in 2024 around the U.S. presidential election, they eventually surpassed those levels in 2025 as sports, cryptocurrency and macroeconomic contracts became popular.
$1 trillion by 2030
Bernstein analyst Gautam Chhugani now estimates that total market volumes in 2026 will reach $240 billion, a 370% increase compared to last year. At a compound annual growth rate of roughly 80% between 2025 and 2030, Chhugani sees prediction market trading volume of $1 trillion a year by the start of the next decade.
Chhugani expects increased regulatory clarity at the federal level will boost the potential market, and that blockchain tokenization and integration with cryptocurrencies is enabling more liquidity. The makeup of traded contracts is also likely to change, he said.
A Polymarket advertisement in a subway station in New York, US, on Thursday, Feb. 5, 2026.
Michael Nagle | Bloomberg | Getty Images
“We expect [the] institutional market to develop around economics, business and political contracts, as investors seek more direct and discrete exposure to events,” he wrote. While sports contracts make up more than 60% of trading volume today, he sees that being cut in half by 2030. “We also expect hedging demand from corporates, [and] insurance firms exposed to specific event risks.”
While Kalshi and Polymarket dominate the space, new names are building a presence. Robinhood, DraftKings and Underdog are all starting or have already launched their own prediction market verticals, Bank of America’s Hoover said.
Public proxies
Robinhood and Coinbase Global are the key public market proxies for the private prediction market companies, Chhugani said. Robinhood’s prediction markets hub is now a year old, generating $350 million in annual recurring revenue, and accounting for some 30% of Kalshi total volume. The market is the digital finance platform’s fastest-growing business, and could encourage Robinhood to develop its own exchange, the analyst said.
While Chhugani’s long-range estimates assume the resolution of long-term regulatory risk, in the near-term state and federal regulators and the prediction markets themselves are engaged in a pitched battle. “Legal action is now pending in 14 states, plus another 4 congressional bills [are] also pending amid concerns around insider trading,” Hoover wrote.
The Commodity Futures Trading Commission headquarters in Washington, D.C.
Ting Shen | Bloomberg | Getty Images
Some states have begun legal action against prediction markets, citing their authority to regulate sports betting, while the Commodity Futures Trading Commission is fighting states, claiming it has the only authority to regulate prediction markets.
Still, Chhugani has faith that this won’t derail the multi-year outlook.
“Despite ongoing state-level legal challenges, we expect platforms like Kalshi, Polymarket, and public proxies (HOOD, COIN) to benefit from increasing regulatory clarity and growing alignment with federal regulators (SEC, CFTC) — a key driver of market legitimacy and mainstream adoption,” he wrote.
Disclosure: CNBC and Kalshi have a commercial relationship that includes a CNBC minority investment.
Markets shift and headlines fade, but the core principles of building long-term wealth remain constant. Join us for our third CNBC Pro LIVE, where investors of all backgrounds – from financial professionals to everyday individuals – come together to cut through the noise and gain actionable strategies for smarter, more disciplined investing. No matter where you’re starting from, you’ll leave with clearer thinking, stronger strategies. Enter your email here to get a discount code
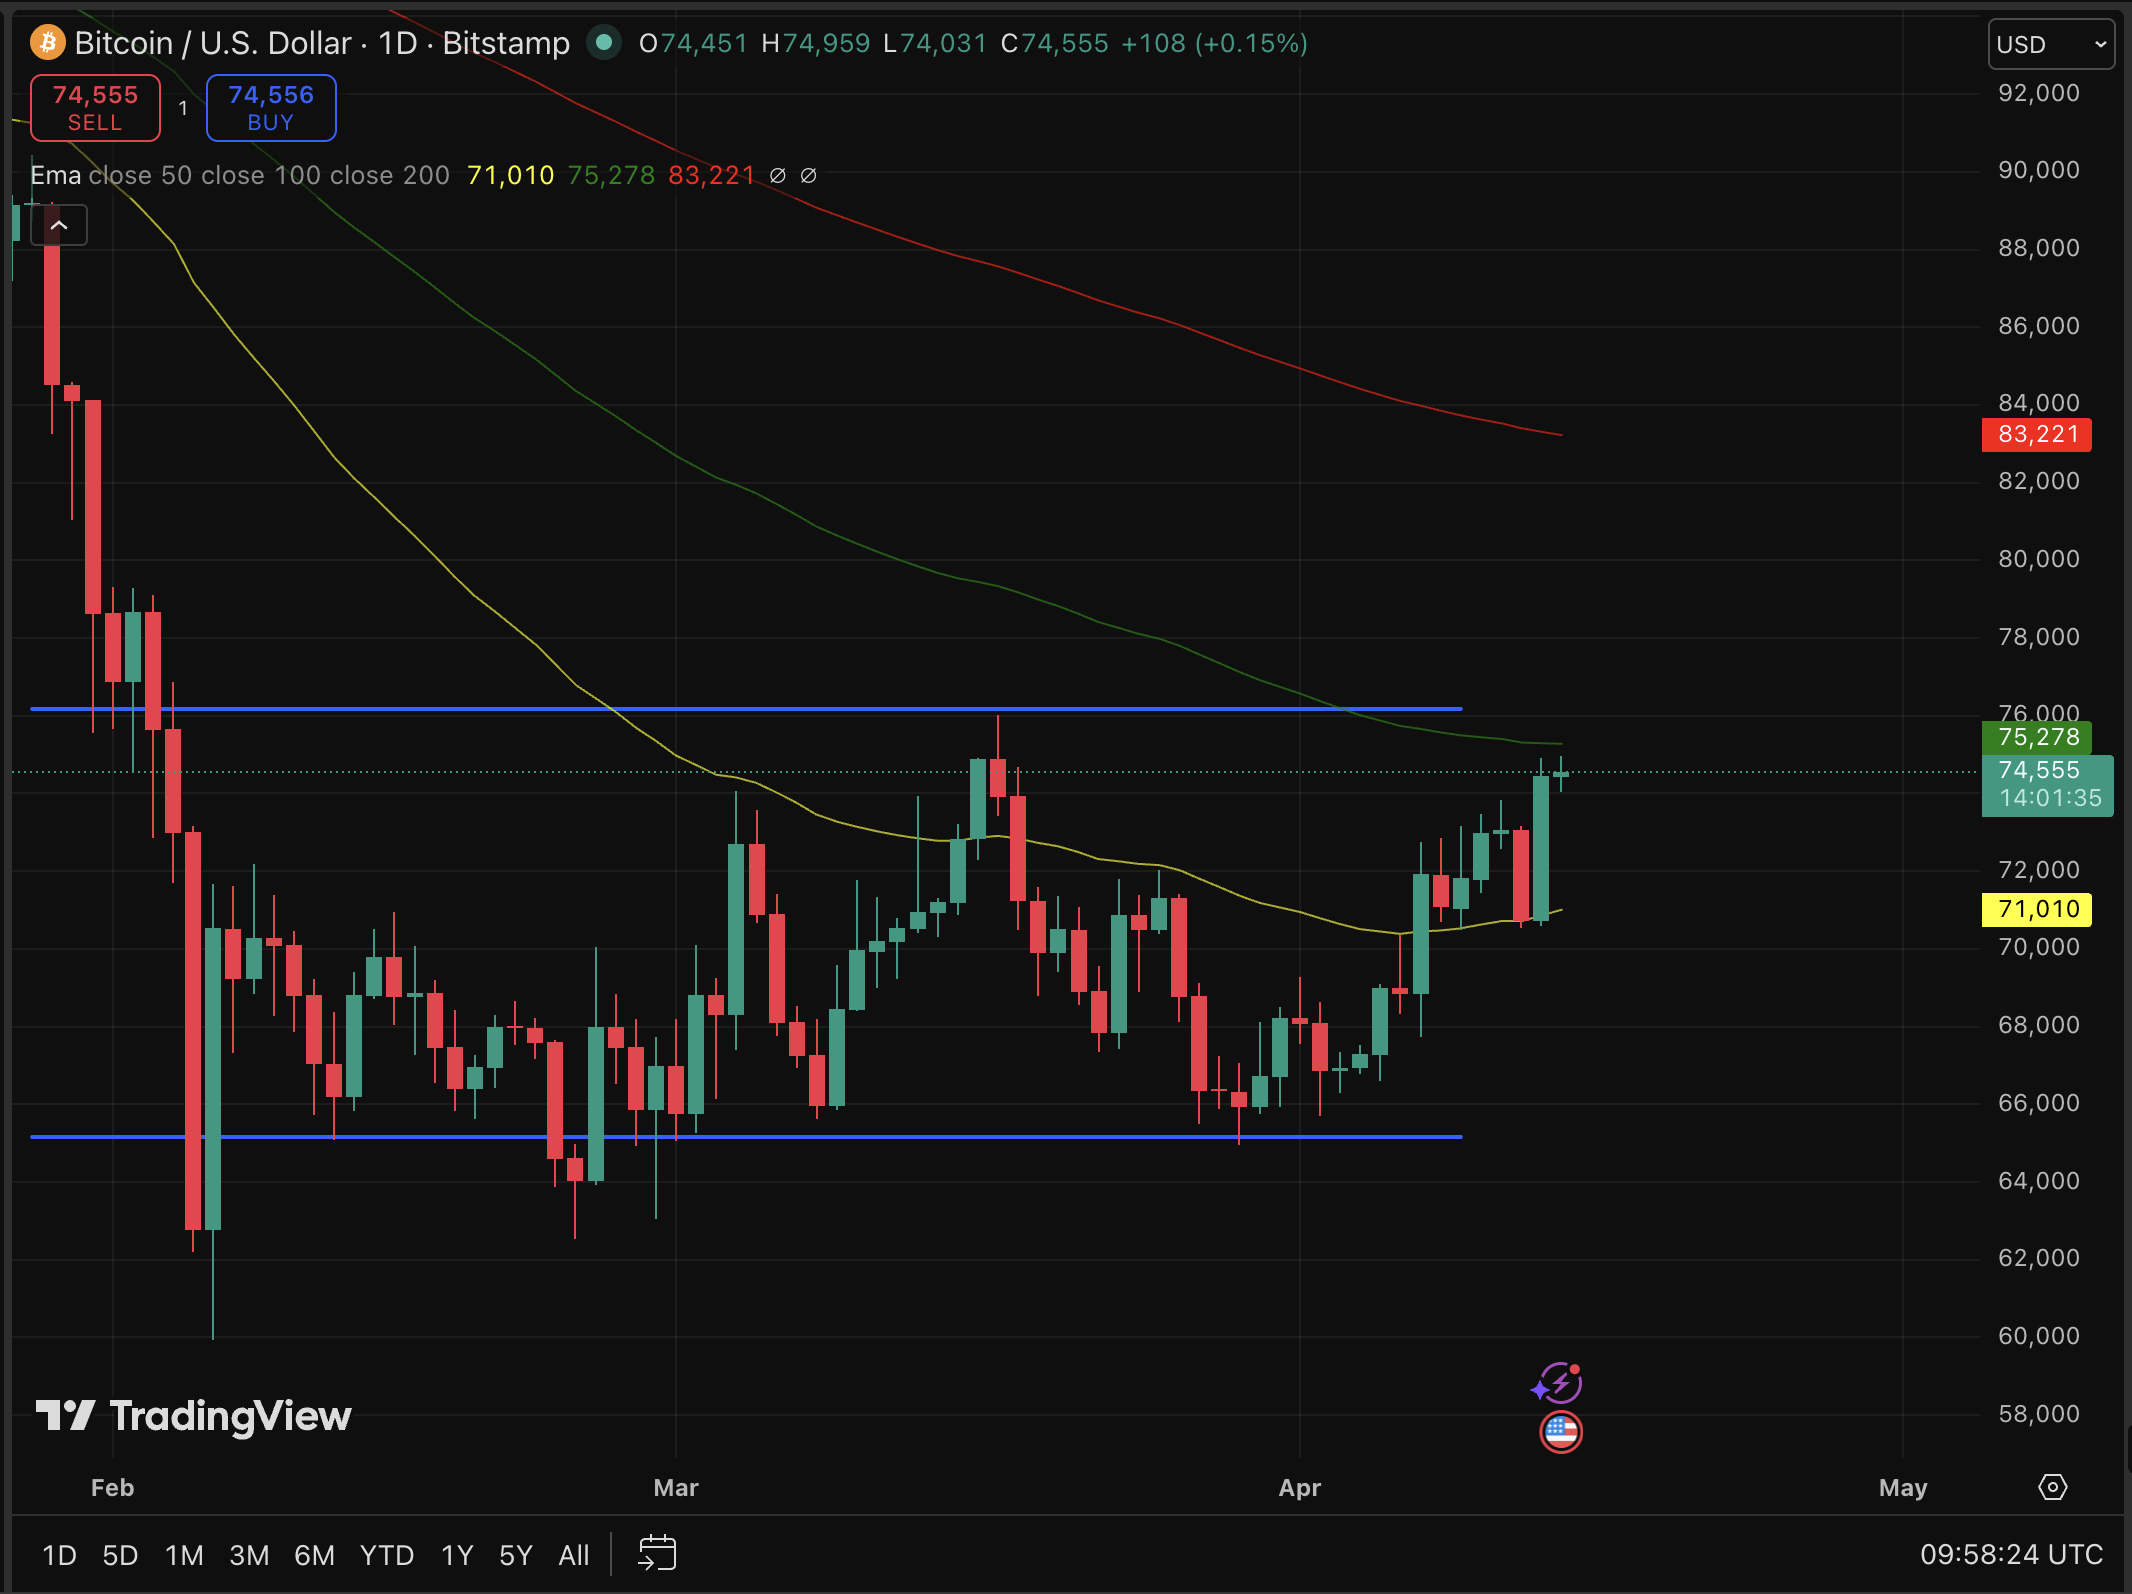
Bitcoin price is approaching $75,000 right now as the bears are running out of room, and our prediction model still says that the rally might not be over just yet. The move represents a sharp reversal from Sunday’s $70,000 capitulation low, a 6% swing in under 24 hours that caught overleveraged shorts badly offside.
The catalyst came at this AM. US President Donald Trump claims that Iran reached out for potential peace talks, even as a naval blockade of the Strait of Hormuz remained active. Risk assets rallied hard on the news, Asian equities climbed, oil expectations eased, and Bitcoin led the charge.
“Bitcoin is following the rally in broader risk assets,” said Damien Loh, chief investment officer at Ericsenz Capital, adding that BTC “continues to trade better than broader risk assets.” Ethereum joined the move, up 5.5% to over $2,370.
Bitcoin has now outperformed significantly since the US-Iran conflict began in late February, up more than 10%, while gold has shed nearly 10% and the S&P 500 sits roughly flat. The macro setup is shifting.
Discover: The best crypto to diversify your portfolio with
Bitcoin Price Prediction: $80,000 in the Picture
Bitcoin is at $74,600, still the strongest bounce in a month. The 24-hour structure shows conviction: analysts had identified roughly $6 billion in leveraged shorts clustered between $72,200 and $73,500, and the move through that band likely triggered a cascade of forced buying.
We flag $80,000 as the defining resistance test for the next major leg. Above that sits the 200-day moving average, just above $83,000. The technical line separates the downtrend from confirmed recovery.
Current price sits just 10% below the $80K level and 15% below the 200-DMA. Prior attempts at $80K have stalled under selling pressure, making a clean break structurally significant.

If Geopolitical de-escalation holds, shorts might continue to get squeezed, and BTC could clear $80K and target $83,000–$94,000. Standard Chartered and Bernstein both target $150,000 by year-end.
The next seven days appear decisive. Macro conditions remain fragile, and a “significant move higher” may not materialize until the US passes the Clarity Act regulatory framework. Price could move fast in either direction.
Discover: The best pre-launch token sales
Bitcoin Hyper With Early-Mover Upside Potential as BTC Breaks Resistance
Bitcoin at $74,000+ sounds bullish, until you price in the math and look at your capital size. A return to the $126K all-time high from here still requires a 69% move.
Institutional capital chasing that return at the current market cap faces diminishing leverage. Early-stage exposure to Bitcoin’s infrastructure layer is where asymmetric upside has historically lived.
Bitcoin Hyper ($HYPER) is positioning directly inside that infrastructure gap. It claims the title of the first-ever Bitcoin Layer 2 with Solana Virtual Machine (SVM) integration, targeting the core limitations that have held Bitcoin back: slow transactions, high fees, and near-zero programmability.
The pitch is sub-Solana latency on a Bitcoin-secured network, with a decentralized canonical bridge handling BTC transfers natively.
The presale numbers are concrete. $HYPER is currently priced at $0.0136, with $32 million raised to date. Staking is live with a high 36% APY bonus. The project has sustained momentum through Bitcoin’s recent volatility as a signal worth watching.
For traders monitoring Bitcoin’s $80K test, research Bitcoin Hyper here before the next price stage activates.
The post Bitcoin Price Prediction: $80K Coming to Wreck Bears appeared first on Cryptonews.

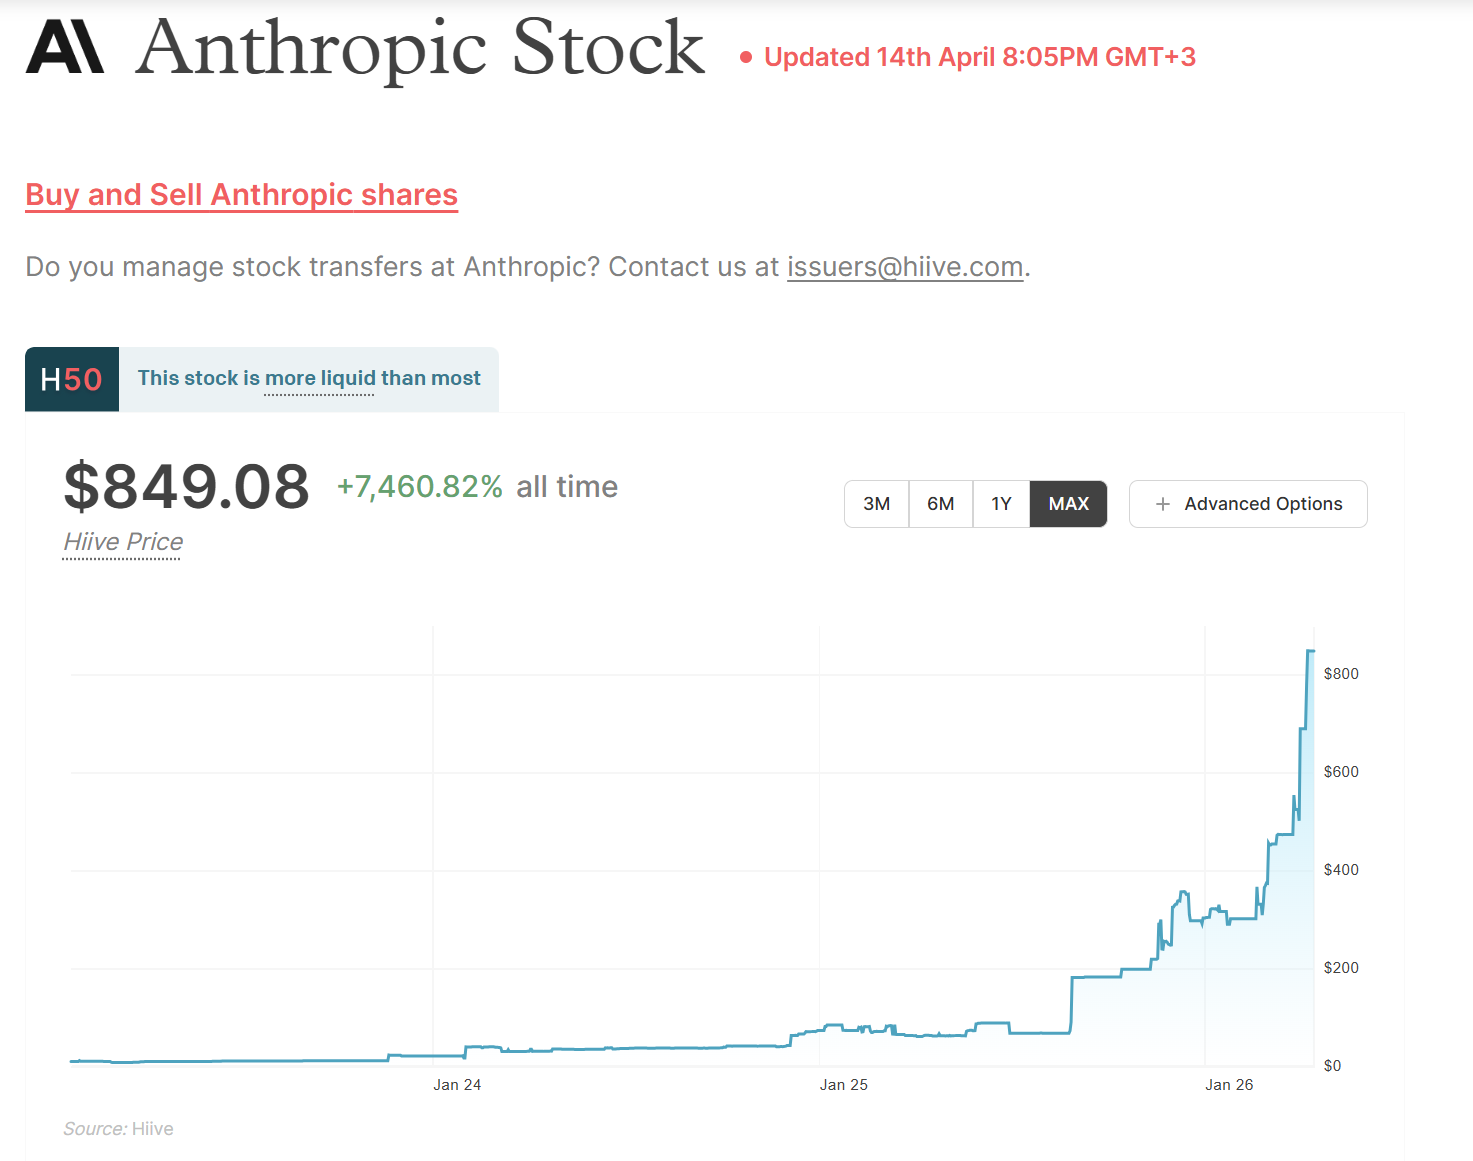
Tokenized pre-IPO Anthropic shares trading on Jupiter now imply a market capitalization of $851 billion, more than double the company’s last official funding valuation.
The synthetic tokens, launched via PreStocks on the Solana-based DEX aggregator, climbed from roughly $122 per share in October 2025 to approximately $900 by April 14, 2026.
Secondary Markets Price Anthropic Far Above Its Last Funding Round
Anthropic closed a $30 billion Series G round in February 2026 at a $380 billion post-money valuation. The gap between that figure and the $851 billion implied on Jupiter reflects aggressive investor positioning ahead of a potential IPO.
Traditional secondary platforms echo the trend. Shares on Hiive, a major pre-IPO marketplace, traded above $849 on April 14, closely matching the on-chain price.
Follow us on X to get the latest news as it happens
The PreStocks tokens are structured instruments backed 1:1 by SPV exposure to actual Anthropic shares.
Holders gain price exposure but receive no voting rights, dividends, or legal ownership in the company, much like how it happens for Bitget is doing with SpaceX pre-IPO.
AI IPO Wave Looms Over Public Markets
Anthropic is reportedly in discussions for a Q4 2026 listing that could raise over $60 billion. Goldman Sachs and JPMorgan Chase are among the banks competing for underwriting roles.
It is not the only AI giant approaching public markets. SpaceX filed confidentially with the SEC in early April, targeting a valuation above $1.7 trillion. OpenAI is also preparing a listing at roughly $1 trillion.
Combined, these three debuts could introduce more than $3 trillion in new market capitalization, a volume that would dwarf total US IPO proceeds over the past decade.
The post Anthropic’s Tokenized Shares on Jupiter Imply $850 Billion Valuation appeared first on BeInCrypto.
Crypto World
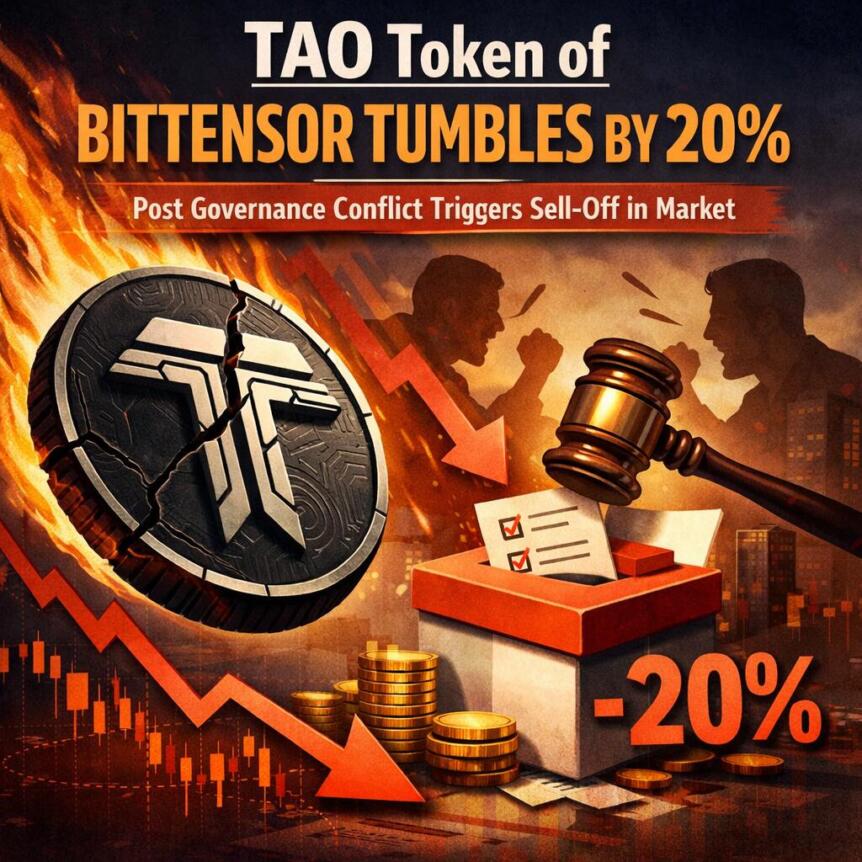
TAO Token of Bittensor Tumbles by 20% Post Governance Conflict Triggers Sell-Off in Market
Key Insights
- The TAO token of Bittensor falls over 20% post-exit of Covenant AI, citing governance issues.
- Fears of centralization impact the sentiment of the crypto market negatively.
- Currently, TAO is testing the $250-$263 support level, which requires a recovery above $280.
Price Plunge for TAO Due to Governance Issues
The native coin of Bittensor named TAO fell dramatically by more than 20% to reach approximately $273. This dramatic price plunge came as a rude shock to many traders after witnessing steady gains by the token.
The reason behind this selloff could be the unexpected departure of Covenant AI from the Bittensor network. Although departures happen all the time in blockchain projects, the reason why this departure became noteworthy was due to the substantial reputation that Covenant AI holds in the ecosystem.
Changes in Market Sentiment Happen Quickly
The news about Covenant AI being accused spread quickly throughout cryptocurrency circles, leading to a swift change in market sentiments. Investors who used to consider Bittensor a potential decentralized AI platform started rethinking the possible dangers related to governance transparency and sustainability in the long run.
Apart from damaging the reputation of the project, the departure of Covenant AI also led to negative changes in terms of finances. The organization is said to have liquidated a significant number of TAOs, putting additional pressure on the already falling price of the asset. Moreover, as soon as traders saw how Covenant AI sold its tokens, they rushed to do the same to avoid losses.
Thus, the market sentiment worsened quickly. The governance mechanism of Bittensor was accused of centralization and failing to distribute governance among many members of the network.
Liquidity Puts Downward Pressure on TAO Price
This led to massive selling by leveraged investors whose trades depended on further increases in the price. Their exits accelerated the downward trend. In other words, forced liquidations added further pressure on the TAO price as new sell orders entered the market after the positions were liquidated.
In addition, breaking below $300 was particularly important as it showed how strong bullish sentiment had been before the breakdown. Notably, just a few days earlier, the price was above $340.
Critical Support Zone Comes Into Focus
TAO is now attempting to stabilize in the mid-$260 range, an area that aligns with previous support levels and technical retracements. The immediate support zone between $250 and $263 has become crucial for short-term price action.
If this range holds, the market could enter a consolidation phase, allowing buyers to regain confidence and potentially rebuild momentum. A move back above $280 would be an early signal of recovery and renewed bullish interest.
However, risks remain elevated. If TAO fails to maintain support above $250, the next downside target could emerge around $233. This scenario would likely confirm continued bearish pressure and prolonged uncertainty.
Prognosis Is Still Unclear
Recent developments in relation to Bittensor show how the issue of governance can affect investor sentiment and confidence, particularly within decentralized networks.
Although the project may still have good prospects for success within the realm of AI-blockchain applications, investor sentiment currently remains highly volatile.
In the meantime, investors will be paying close attention to how the price develops, along with any progress within the network itself. The position taken by the Bittensor development team regarding any governance problems may become critical in determining future moves.
For the moment, however, caution appears to prevail.
Rich Moms Wear These Pieces to Martha’s Vineyard — From $5
Louis Riddick Predicts the End of One Viking

What to expect from Google I/O 2026


-

 Politics4 days ago
US brings back mandatory military draft registration
-
 Sports4 days ago
Man United discover Nico Schlotterbeck transfer fee as defender reaches Dortmund agreement
-

 Fashion4 days ago
Weekend Open Thread: Veronica Beard
-

 Tech7 days ago
How Long Can You Drive With Expired Registration? What Florida Law Says
-

 Politics5 days ago
Malcolm In The Middle OG Turned Down ‘Buckets Of Money’ To Appear In Reboot
-

 Politics2 days ago
World Cup exit makes Italy enter crisis mode
-

 Crypto World5 days ago
Canary Capital Files SEC Registration for PEPE ETF
-

 Business4 days ago
Tesla Model Y Tops China Auto Sales in March 2026 With 39,827 Registrations, Beating Cheaper EVs and Gas Cars
-

 Crypto World1 day ago
The SEC Conditionalises DeFi Platforms to Be Avoided for Broker Registration
-

 Crypto World23 hours ago
SEC Signals Exemption for Crypto Interfaces From Broker Registration
-

 Crypto World6 days ago
Bitcoin recovers as US and Iran Agree a Ceasefire Deal
-
 NewsBeat2 days ago
Pep Guardiola and Gary Neville agree over Arsenal title problem that benefits Man City
-

 Business4 days ago
OpenAI Halts Stargate UK Data Centre Project Over Energy Costs and Copyright Row
-

 Business3 days ago
Ireland Fuel Protests Enter Day 5 as Blockades Spark Shortages and Government Prepares Support Package
-

 Politics5 days ago
LBC Presenter Mocks Trump Over Iran War Failures
-

 Crypto World4 days ago
Federal judge blocks Arizona from bringing criminal charges against Kalshi
-
 NewsBeat3 days ago
JD Vance announces ‘no agreement’ with Iran over nuclear weapons fear
-

 Tech5 days ago
A version of Windows 10 released a decade ago is now eligible for additional security patches
-

 Business4 days ago
IMF retains floor for precautionary balances at SDR 20 billion
-

 Crypto World15 hours ago
SEC Proposes Certain Crypto Interfaces Don’t Need to Register as Brokers
You must be logged in to post a comment Login