

Crypto World
Bitcoin News: A Weak Jobs Report Just Slashed Fed Rate Hike Odds in Half, And Bitcoin Bounced Off $57,750 to Reclaim $61,000

Bitcoin price clawed back the $62,000 level after June non-farm payrolls printed at 57,000, less than half the 113,000 consensus، sending the implied probability of a September Fed rate hike from 64% to 54% on the CME FedWatch Tool news and dragging AI stocks sharply lower.
The question that data forces onto the table is whether this macro shift marks a durable floor or simply a relief bounce inside a structure that has already given up 20% in a single month.
The US Labor Department compounded the miss by revising April and May figures downward by a combined 74,000 jobs, signaling that prior strength in the labor market was overstated.
— TrendSpider (@TrendSpider) July 2, 2026
 JUST IN: U.S. June Economic Data:
Initial Jobless Claims: 215k vs 220k est
Non Farm Payrolls: 57k vs 110k est
Unemployment Rate: 4.2% vs 4.3%
BTC had bottomed at $57,750 on Wednesday before the report; the jobs data gave the asset the catalyst it needed to distance itself from that low, recovering above $60,000 alongside a broader move into scarce-asset proxies.
Discover: The Best Token Presales
Bitcoin News: What a Labor Miss Actually Means for BTC
Weak labor data reduces inflationary pressure and, by extension, the Fed’s justification for holding rates elevated. That transmission mechanism is direct: lower rate-hike odds compress the opportunity cost of holding non-yielding assets like Bitcoin and gold, while simultaneously raising expectations for eventual balance sheet expansion.
The Fed’s balance sheet currently sits stagnant at $6.73 trillion, though its mandate permits $40 billion in monthly short-term Treasury purchases, a lever that remains undeployed and increasingly relevant if labor data continues to soften.
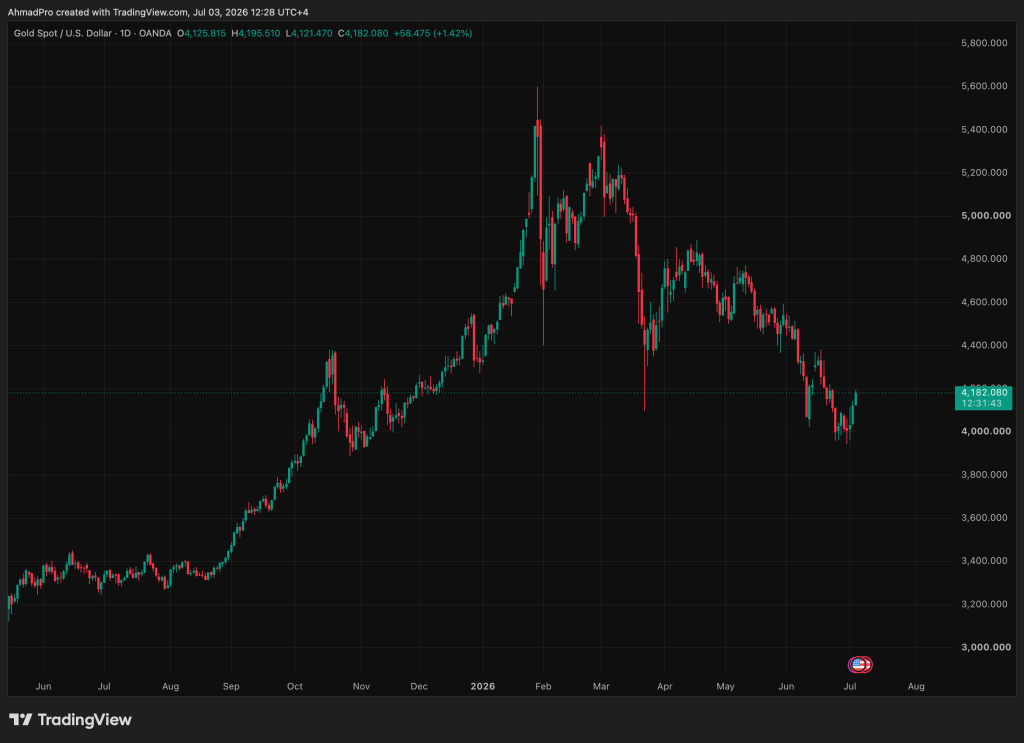
Gold reinforced that read Thursday, recovering a portion of the 8% losses it accumulated over the prior two weeks. Central bank liquidity conditions remain the primary macro driver for both assets, and gold’s bounce adds credibility to the narrative that markets are pricing a less restrictive Fed rather than a one-day tactical trade.
WTI crude stabilized below $70 after Qatar’s Foreign Ministry cited positive progress in US–Iran negotiations, reducing the inflationary risk premium on oil and leaving additional room for stimulus discussions.
The Nasdaq 100 told a different story. The index erased three consecutive days of gains on Thursday as chipmakers and AI-adjacent hardware names took the heaviest damage.
SanDisk, Seagate, Western Digital, and Applied Materials each fell 9% or more intraday. That kind of synchronized selloff in the AI hardware complex is not simply profit-taking; it signals that the valuation premium embedded in the sector’s growth assumptions is being questioned, and some of that capital will seek a landing spot.
Discover: The Best Crypto to Diversify Your Portfolio
On-Chain: Seller Exhaustion at Levels Not Seen Since 2022
The macro catalyst and news matter less for Bitcoin if the underlying on-chain structure is still deteriorating. It is not. CryptoQuant analyst gaah_im reported that Bitcoin’s realized profit-to-loss ratio has hit its lowest level since 2022, with the net percentage of supply in profit relative to total supply turning negative.
Historically, that combination has marked cycle bottom inflection points with what the analyst described as “extreme precision.”
What the on-chain data confirms is that seller exhaustion is real at current prices, holders who were going to capitulate largely have.
What it does not confirm is timing: a metric flagging a cycle low tells you the floor is close, not that the next weekly candle resolves higher. Bitcoin was also rejected at $82,500 two months prior, and that supply zone has not been neutralised.
The realized profit-to-loss signal is most useful as a risk-management input rather than a directional trigger. It narrows the probability distribution of downside outcomes without eliminating them.
Analysts flagging a potential sub-$60,000 retest as a “healthy validation” of the bottom are not wrong, that scenario remains live if upcoming CPI data or FOMC communications re-accelerate hawkish pricing. The downside case for Bitcoin does not disappear because one labor print came in soft.
Don’t Miss Out on Our $1,000 USDT Airdrop on ByBit
The post Bitcoin News: A Weak Jobs Report Just Slashed Fed Rate Hike Odds in Half, And Bitcoin Bounced Off $57,750 to Reclaim $61,000 appeared first on Cryptonews.

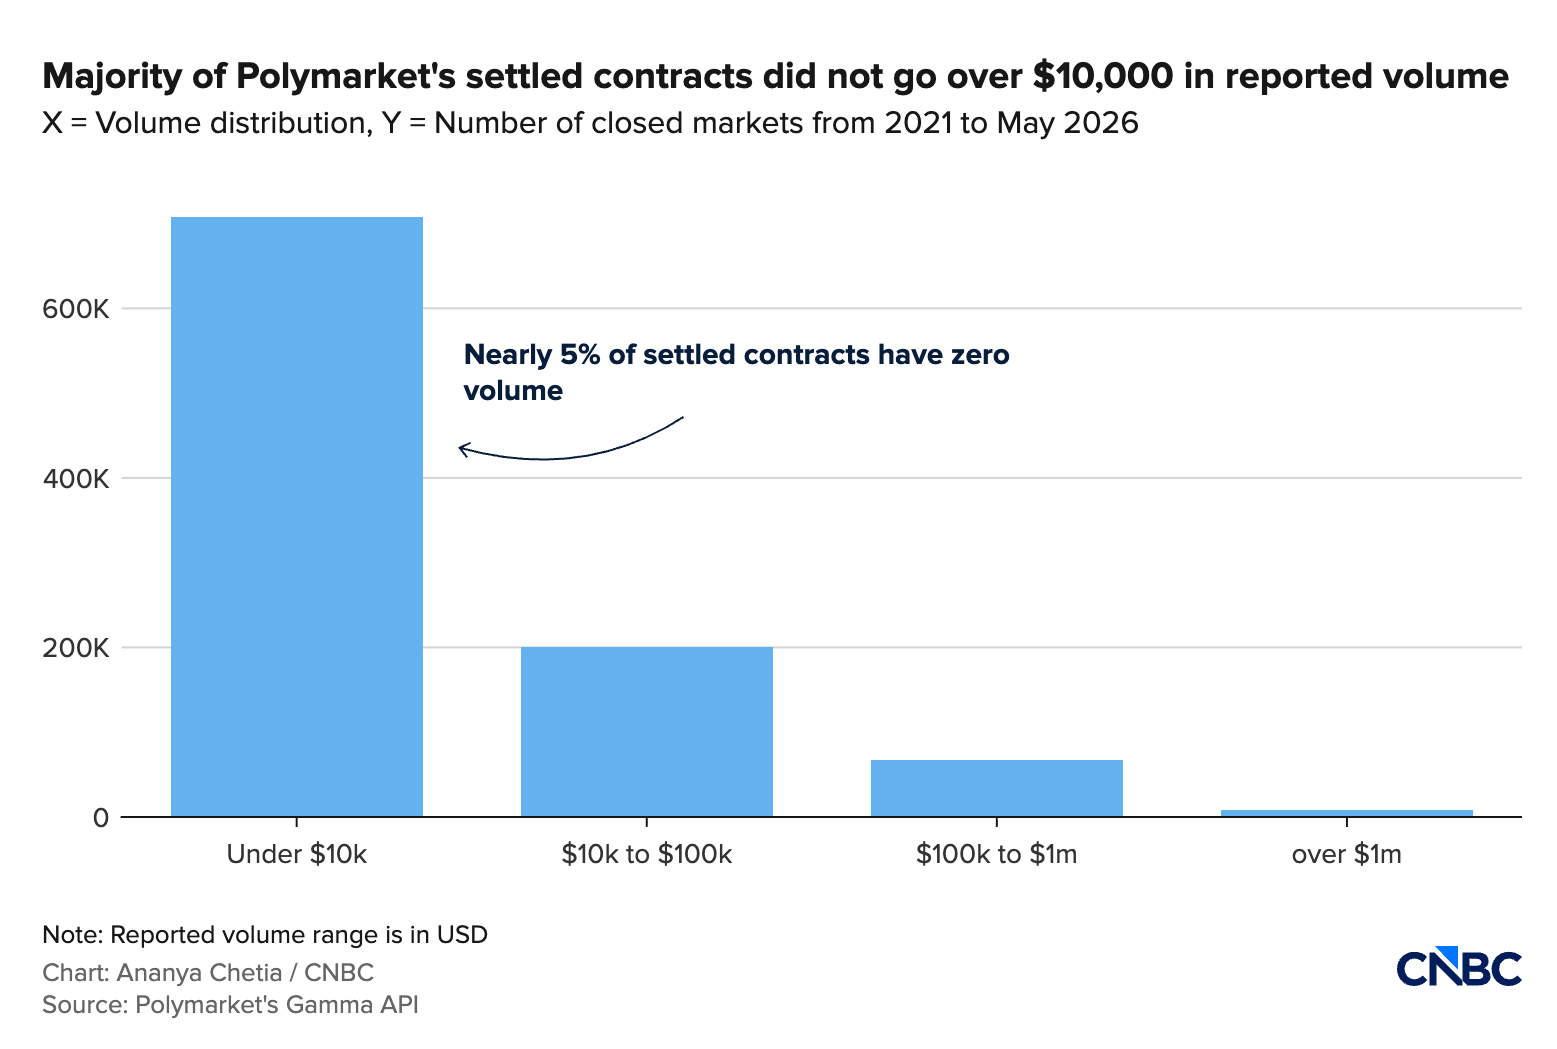
Roughly 70% of all closed markets on Polymarket recorded under $10,000 in reported trading volume between 2021 and the end of May 2026, a CNBC analysis found.
The findings land as prediction markets post surging volume, driven by the 2026 FIFA World Cup. That gap shows how a small group of marquee contracts, rather than the broader platform, captures most of the money.
Most Polymarket Closed Markets Traded Under $10,000
CNBC pulled closed-market data from Polymarket’s Gamma API, which counts notional volume on both sides of each trade. The distribution came out heavily skewed.
Fewer than 10% of closed markets drew between $100,000 and $1 million in reported volume. More than 45,000 markets, close to 5% of the total, showed no reported volume at all.
Follow us on X to get the latest news as it happens

Bots dominate the thin end. Joshua Della Vedova, a business professor at the University of San Diego, found that more than 80% of the volume in sub-$10,000 markets came from bots.
He defined bots as wallets that make more than 50 trades a day or more than 1,000 in total. By his estimate, they earned roughly $1.2 million in markets under $10,000, but about $50.5 million in the $1 million to $10 million range.
That tier made up 38% of total bot profit. Markets above $10 million added a further $35.1 million.
“They are making money across all markets,” Della Vedova said. “(Bots) make money per transaction, and therefore they prefer to trade in these larger markets, but they will trade across the whole spectrum.”
The report added that Kalshi also recorded a significant number of shallow markets, based on an analysis of the on-chain data from Dune. However, unlike Polymarket’s Gamma API, Kalshi’s notional volume figures on Dune account for only one side of each trade.
World Cup Bets Fuel Prediction Market Growth
The thin-market picture contrasts with headline growth. Weekly World Cup volume across major venues climbed from $65 million in the week of June 1 to $5.4 billion by June 29, according to CryptoRank data.
Volume peaked at $5.6 billion in the week of June 22. Kalshi led the climb, showing how major sports events can quickly drive demand for prediction trading.
That growth sits alongside the thin tail. The money concentrates in a small set of high-profile contracts, while tens of thousands of markets see almost no activity.
BeInCrypto has reached out to both Polymarket and Kalshi for comment.
Subscribe to our YouTube channel to watch leaders and journalists provide expert insights
The post 45,000 Polymarket Markets Recorded Zero Trading Volume, CNBC Analysis Shows appeared first on BeInCrypto.
XRP trading returns have hit historic pain levels never seen before in the token’s 12-year history. However, one analyst just flagged a fresh technical buy signal. Meanwhile, others warn that the broader trend structure remains firmly bearish.
The setup places XRP at a critical crossroad where bullish and bearish forecasts openly clash across the market.
Why XRP Trading Returns Sit at Historic Pain Levels
Historic pain levels describe periods when the average investor holds an asset far below their purchase price. XRP is currently experiencing precisely that situation, with both short-term and long-term holders realizing losses simultaneously.
The numbers tell the story. Santiment data shows the 30-day MVRV ratio at -45% and the 365-day MVRV at -47%. This dual negative reading represents the lowest combined level in XRP’s entire 12-year history, signaling an unprecedented pain threshold across its holder base.
“That doesn’t mean price can’t dip a bit more if crypto markets keep struggling. But from a risk-reward view, buying or adding $XRP here comes with much less risk than average because so much downside has already been absorbed by other traders,” Santiment noted on X.
Not everyone reads the extreme as a bottom. Some observers note that XRP now shows patterns similar to those in the March phase, while breaking below the 20-week EMA after each cycle peak has historically been a bearish signal for XRP. Furthermore, the token still trades well below that level, currently around $1.35.
That structural weakness colors any short-term bounce. A relief rally from the $1.00 low remains possible, according to crypto analyst ChartNerd. However, the broader trend structure remains bearish for now. As a result, traders should treat any bounce with clear caution.
What the Buy Signal Really Means for the XRP Price
The bullish counterpoint comes from technical indicators. Crypto analyst Ali Martinez flagged that the SuperTrend indicator turned bullish on XRP for the first time since mid-June. Furthermore, the previous SuperTrend buy signal preceded a 14% rally.
The indicator carries a strong recent record. It correctly flagged the 19% and 16% declines in XRP before they materialized. As a result, traders are now watching whether the same level of accuracy holds for the current upward reversal signal in the coming sessions.
“Historically, the best setups often appear when the crowd is feeling maximum pain (both on-chain and sentiment-wise), not maximum confidence,” Santiment noted.
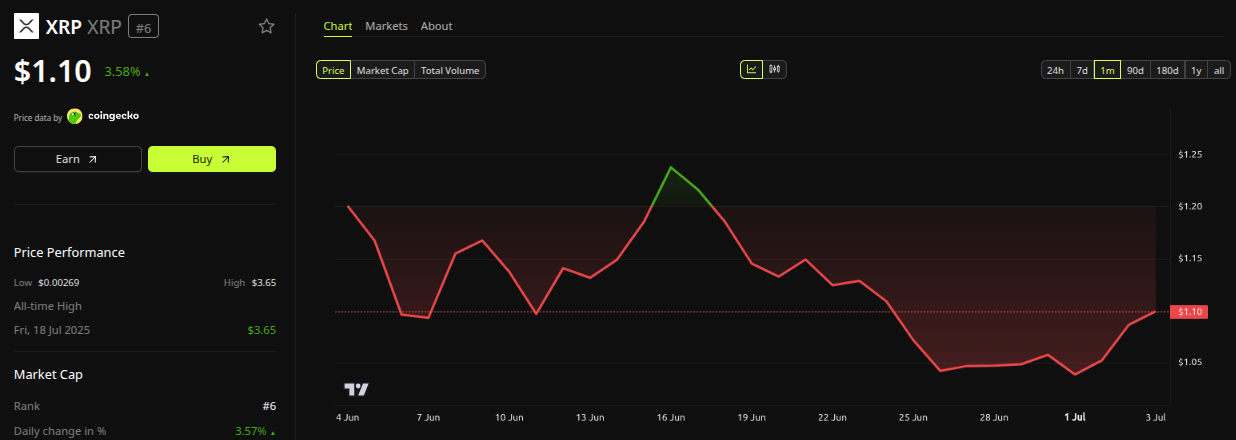
The current XRP price supports a possible bounce. BeInCrypto Markets data shows XRP trading around $1.09, up 3.11% in the last 24 hours. Furthermore, the token has a market capitalization exceeding $67 billion and a daily trading volume of $1.86 billion.
However, the bullish case requires strong technical confirmation. XRP must convincingly reclaim the $1.10 level. Moreover, a decisive reclaim of the 20-week EMA at $1.35 would be necessary to fully validate any trend reversal, according to bearish observers watching the broader macro structure.
“Ripple (XRP) is… raising concerns about a potential breach of the critical support level around the $1 mark. The market is currently facing mounting selling pressure as investor sentiment turns increasingly cautious… XRP could face the risk of a deeper decline—potentially dropping below the $0.90 threshold—if the negative trend persists. This situation has the community closely monitoring the coin’s next key support levels,” one analyst said.

The bottom line remains split. Bulls point to historic pain, technical buy signals, and steady spot ETF inflows. However, bears warn that the trend remains negative until XRP reclaims key structural levels. Traders are now watching the coming sessions to see which camp gains the upper hand.
Subscribe to our YouTube channel to watch leaders and journalists provide expert insights
The post XRP Holder Losses Hit Deepest Level in 12 Years: Buy Signal or Trap? appeared first on BeInCrypto.

Key Takeaways
- HSBC has reduced Stellantis to a “Reduce” rating from “Hold” and lowered the price target to €4 from €5.50, suggesting 21.8% downside potential
- American inventory levels reached 93 days’ supply in June 2026, climbing by 120,000 units versus the prior year and approaching 2024’s problematic peak
- The automaker has announced 19 recalls affecting 2.5 million vehicles in the United States during 2026 to date
- The bank cut its 2026 adjusted operating income projection by 59% to €1.52 billion, reflecting a 1% operating margin
- HSBC remains skeptical about the possibility of a durable earnings turnaround at the carmaker
Shares of Stellantis declined during Thursday’s Paris session following HSBC analyst Michael Tyndall’s decision to downgrade the automotive manufacturer to “Reduce” from “Hold,” while simultaneously slashing the price objective to €4 from €5.50. With the stock hovering near €5.11 at the close on July 2, the revised target represents approximately 21.8% downside risk.
The rating cut stems from two primary worries: escalating American inventory stockpiles and a growing wave of product recalls.
HSBC highlighted that Stellantis’ American inventory reached 93 days’ worth of sales in June 2026, reflecting a year-over-year increase of 120,000 vehicles. This figure is nearing the approximately 100-day threshold that marked the peak in 2024.
“We do not understand the logic of repeating past failures,” the HSBC note said.
When Stellantis tackled excess inventory in 2024, the company was forced to slash American pricing by 500 to 600 basis points while trimming production by roughly 200,000 units. HSBC cautioned that a comparable scenario may be looming.
Quality Issues Accelerate
Regarding product quality, HSBC referenced NHTSA records indicating Stellantis initiated 19 American recalls encompassing 2.5 million vehicles through the first half of 2026. Approximately 2 million of these campaigns require hands-on inspection or mechanical fixes.
Throughout 2025, the manufacturer recorded 53 American recalls impacting 2.8 million vehicles.
Across Europe, Stellantis registered 47 recalls during the initial six months of 2026, versus 48 throughout all of 2025. In comparison, all other significant European automakers collectively reported 45 recalls during the same half-year window.
Profit Projections Slashed Dramatically
HSBC reduced its 2026 adjusted operating income projection by 59%, down to €1.52 billion. This estimate translates to a 1% margin, falling short of the company’s own “low single digit” margin guidance.
The analyst’s 2026 industrial free cash flow estimate plunged 50% to a negative €4.89 billion.
HSBC also raised questions about whether the company’s traditionally robust margins indicate insufficient investment. The analyst suggested Stellantis “may need to invest more to reach a sustainable recovery.”
The automaker currently trades at a 12-month forward price-to-earnings multiple of 5.6 times, representing a 32% discount versus the global peer average of 8.2 times. The three-year average discount has hovered closer to 40%.
While HSBC recognized certain indications of U.S. market share stabilization, the firm characterized June 2026 performance as “mixed.” The analyst’s conclusion: “We’re not convinced a sustainable recovery is underway.”

Crypto World
ARK Invest’s Cathie Wood Pours $41M into Tesla (TSLA), Exits Roku Position Ahead of Holiday

Key Highlights
- ARK Invest acquired 96,935 shares of Tesla totaling approximately $41.2 million distributed across three exchange-traded funds
- The significant Tesla investment followed the electric vehicle manufacturer’s impressive Q2 delivery figures of 480,126 units, exceeding market expectations
- ARK added 91,353 shares of cryptocurrency exchange platform Bullish, valued at approximately $2.3 million
- The firm divested 180,228 Roku shares valued at roughly $25.3 million, extending a recent pattern of position reduction
- Other divestments included positions in Twist Bioscience, Strata Critical Medical, and Iridium Communications
On Thursday, July 2nd, Cathie Wood’s investment management firm ARK Invest executed a series of substantial portfolio adjustments before the Independence Day holiday weekend.
The most significant transaction involved Tesla shares. ARK accumulated 96,935 shares valued at approximately $41.2 million, distributed among the ARK Innovation ETF, ARK Next Generation Internet ETF, and ARK Space Exploration and Innovation ETF.
The strategic timing aligned with Tesla’s recent quarterly performance announcement. The electric vehicle giant had just unveiled second-quarter delivery figures that significantly exceeded Wall Street projections.
Tesla’s Q2 Performance Exceeds Market Expectations
Tesla reported deliveries of 480,126 vehicles during the second quarter of 2026, substantially surpassing analyst consensus estimates of approximately 406,000 units. This impressive performance appears to have reinforced Wood’s conviction in expanding ARK’s exposure to the automaker.
Additional positive momentum came from China. Tesla’s wholesale sales in China climbed for the eighth consecutive month in June, demonstrating sustained consumer demand in a strategically important market.
Tesla maintains its position as ARK’s largest portfolio holding. Despite the stock experiencing roughly a 10% decline year-to-date, Wood’s continued accumulation signals confidence in the company’s long-term prospects.
ARK Expands Positions in Bullish and SoFi
ARK also accumulated 91,353 shares of Bullish, the cryptocurrency exchange platform operator, representing an investment of approximately $2.3 million. This purchase aligns with ARK’s ongoing strategy to build exposure to the digital asset infrastructure company across multiple funds.
Wood’s firm added 54,838 shares of SoFi Technologies valued at roughly $1 million through the ARK Innovation ETF. This acquisition followed SoFi’s recent announcement of launching a small-business lending platform.
Additional purchases included 52,452 shares of X-Energy, alongside minor position increases in Generate Biomedicines and Recursion Pharmaceuticals.
Roku Experiences Largest Position Reduction
Among the sales, Roku represented the most substantial divestment. ARK liquidated 180,228 shares worth approximately $25.3 million across three exchange-traded funds. This transaction continues ARK’s recent pattern of systematically reducing its Roku exposure.
ARK also divested 29,615 shares of Twist Bioscience valued at approximately $3 million, 274,932 shares of Strata Critical Medical worth roughly $1.5 million, and 21,842 shares of Iridium Communications totaling about $1.2 million.
Additionally, ARK sold 100,430 shares of Absci Corp through its ARKG ETF, amounting to approximately $1.1 million, maintaining its recent trajectory of trimming this holding.
These portfolio adjustments demonstrate Wood’s strategy of reallocating capital toward Tesla and high-growth technology companies while scaling back exposure to streaming entertainment and select biotechnology positions ahead of the extended holiday weekend.
Tesla’s exceptional quarterly delivery performance served as the primary driver behind the day’s most substantial acquisition.

TLDR
- Bitcoin whales bought more than 270,000 BTC worth about $16.7 billion over the past two weeks.
- U.S. spot Bitcoin ETFs recorded $4.06 billion in June outflows, marking their worst month since launch.
- The ETF outflows pushed 2026 flows negative before the funds recorded a $221 million inflow on Thursday.
- Bitfinex analysts said whale accumulation and institutional selling have appeared near past Bitcoin cycle lows.
- Solana outperformed major crypto assets after rising about 15% since early June.
Bitcoin whales bought $16.7 billion in BTC during two weeks, even as U.S. spot Bitcoin ETFs lost $4.06 billion in June. The record ETF bleed pushed 2026 flows negative, but Thursday brought a $221 million inflow. Therefore, the market showed a clear split between institutional selling and whale accumulation.
Bitcoin Whales Absorb ETF Selling Pressure
Bitcoin whales added more than 270,000 BTC over two weeks, according to Bitfinex analysts. Bitcoin whales bought while U.S. funds faced their worst month since launch. The buying reached about $16.7 billion at Bitcoin’s $62,055 price.
Bitcoin whales moved against the ETF trend as spot demand stayed weak. Bitfinex said the spot premium remained negative during the buying period. That signal showed U.S. spot desks did not drive the accumulation.
Bitcoin whales often accumulate when weaker holders sell near cycle lows. Bitcoin whales also reduce liquid supply when they move coins into long-term wallets. However, ETF outflows showed institutions still cut exposure during June.
Solana Gains While Bitcoin Whales Build Positions
Solana moved in the opposite direction from most large crypto assets. SOL rose about 15% since early June despite Bitcoin hitting 21-month lows. The token gained support from upgrades and stronger network activity.
Tokenized real-world asset transfers on Solana rose 120% to $8.53 billion. That growth helped SOL outperform while Bitcoin whales focused on BTC accumulation. Bitfinex analysts called the market split a “familiar one.”
They said altcoins often fall before Bitcoin and recover before Bitcoin. Still, Bitcoin whales kept their attention on BTC during the ETF selloff. The pattern showed different groups taking different risks across crypto markets.
Optimism Falls as Bitcoin Whales Signal Market Stress
Optimism and other layer-2 tokens traded near record lows. Base dropped Optimism’s shared technology, and that move weakened the fee-capture case. As a result, traders reduced exposure to several Ethereum scaling tokens.
Meanwhile, Bitcoin whales continued to absorb supply from sellers. Bitcoin whales created a sharp contrast with institutions that exited ETFs. Bitcoin whales have shown similar behavior near past recovery phases.
The next U.S. inflation reading now carries major weight for crypto markets. May inflation reached 4.2%, although Kevin Warsh said inflation risks had eased. A softer print could change rate expectations before the Fed meeting.
Crypto World
Crypto prices stage a weekly recovery, but bears still hold the structural advantage: Crypto Markets Today
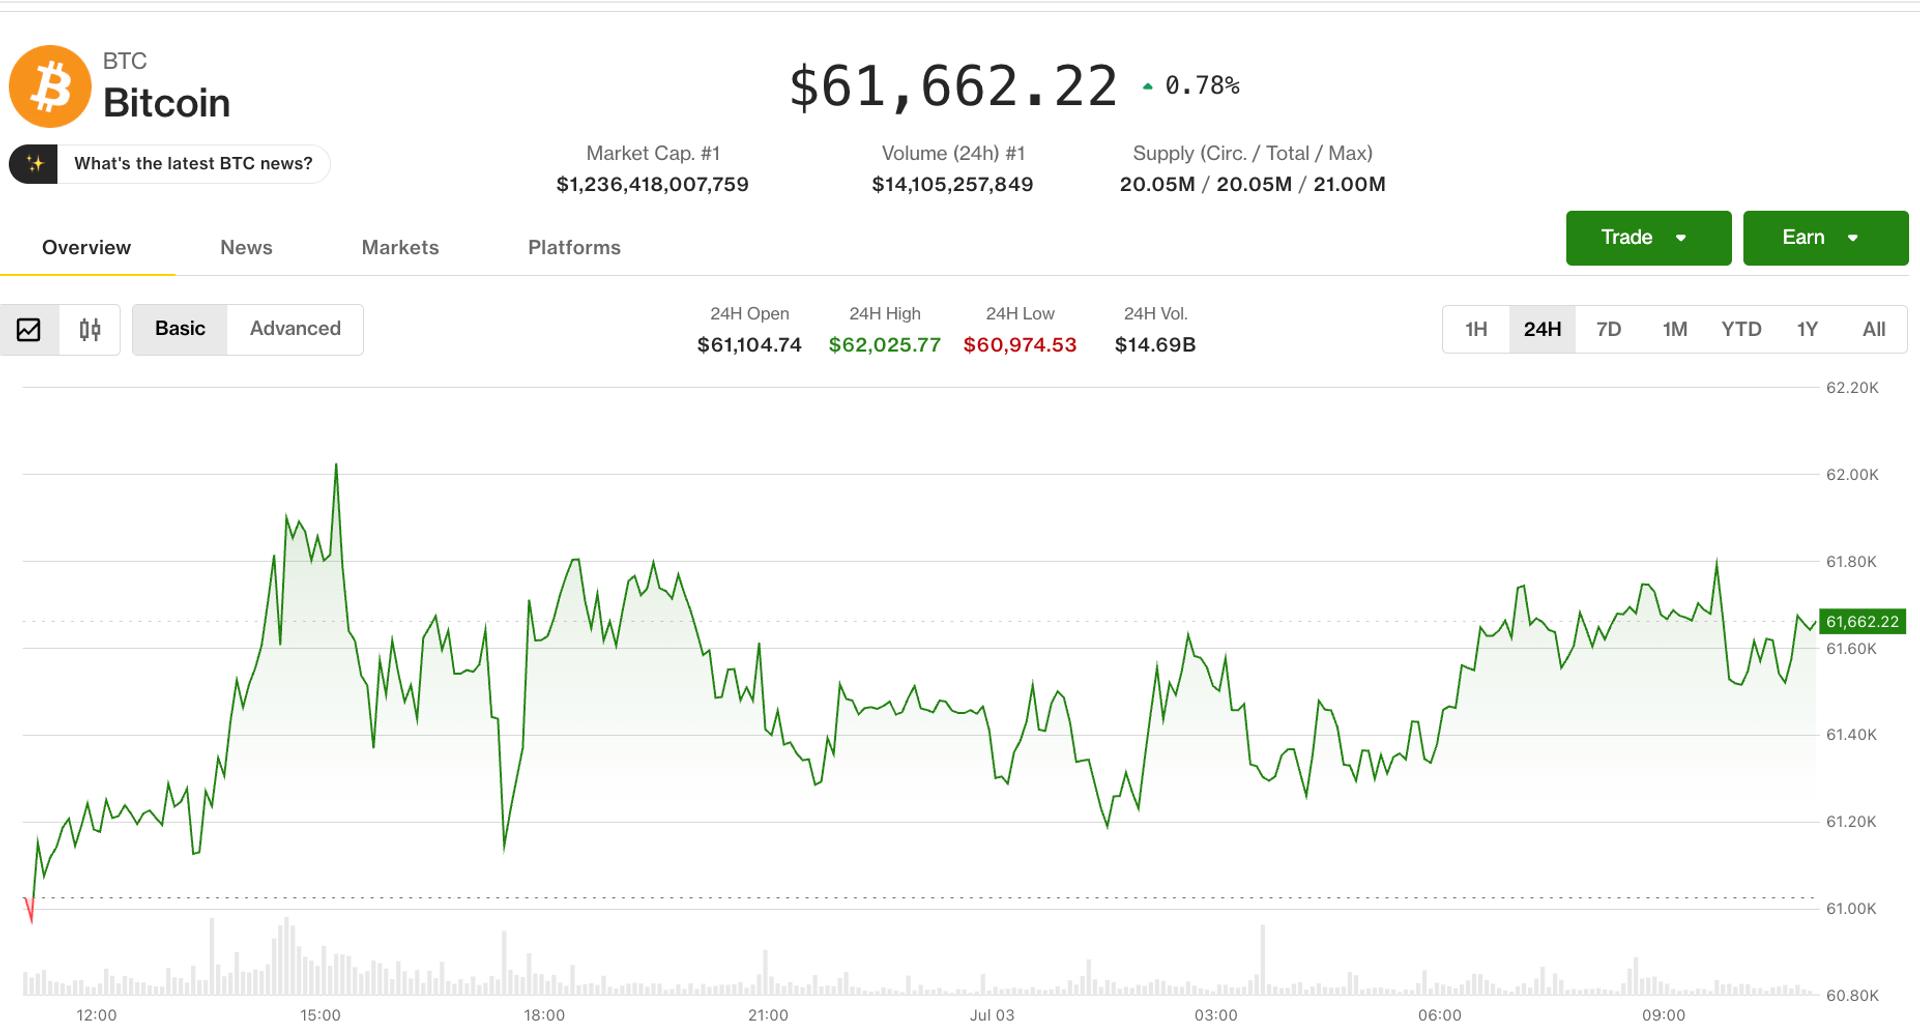

The crypto market is ending the week in a healthier position than where it started, with bitcoin trading at $61,600 after having risen by 6.5% from Tuesday’s almost two-year low of $57,750.
Still, the largest cryptocurrency’s gains on Friday were muted in comparison with Thursday’s 2.6% advance, which benefited from weak U.S. job data that lowered expectations for a Federal Reserve interest-rate increase.
The interest-rate outlook echoed for a second day as the U.S. entered a long weekend with stock markets closed. Ether (ETH) rose for a third straight day to add 11.5% since Tuesday and 2.6% on Friday alone. Other altcoins also advanced, with , zcash (ZEC) and dash (DASH) all gaining between 2.2% and 3.1%.
Still, the broader market structure remains bearish across the majority of crypto tokens following a succession of lower highs and lower lows. For bitcoin to reverse the downtrend, it needs to trade back above $67,000 and then take out $81,000, which was the local high in May.
Derivatives positioning
- Ether replaced bitcoin as the biggest token for 24-hour liquidations. A total of $417 million worth of crypto futures bets were liquidated in 24 hours, of which $160.80 million are from the ether market. BTC, a distant second, notched $97 million. This shows just how bearish positioning on ether was.
- Ether futures’ open interest (OI) still stood at 14.31 million, the most since June 10, with annualized funding rates of nearly 10% and the highest 24-hour cumulative volume delta (CVD) among majors. The combination points to growing demand for bullish exposure in the market, a sign traders are anticipating continued price gains.
- OI in DOGE futures tallied 14.13 billion tokens, the highest since May 16. The number has been growing since June 28, a sign of renewed demand for leverage. The DOGE situation is similar to ether’s bullish picture.
- While ETH and DOGE have led OI growth over 24 hours, futures tied to HBAR and ZEC have seen the opposite. HBAR has the most negative 24-hour CVD among majors, a sign bears are becoming more aggressive in shorting at market orders than passive limit orders.
- Most tokens have positive CVD, a sign of bulls’ leadership in the market.
- Both bitcoin and ether 30-day implied volatility indexes continue to slide, reversing the June pop, signaling market calm and potential for continued bullish price action.
- On Deribit, the most traded BTC options of 24 hours are calls at strikes ranging from $60,000 to $70,000. Call options represent a bullish bet on the market. Ether options show a similar bullish mood, with the $2,500 call seeing the most activity.
- Block flows featured a large BTC long call condor, a strategy betting on a range play between $66,000 and $68,000 till July 17.
Token talk
- Uniswap (UNI) led gains in altcoins following Thursday’s announcement confirming that it will be the primary automated market maker (AMM) for the Robinhood layer-2 blockchain.
- UNI is up by more than 11% in the past 24 hours with daily trading volume doubling to $320 million, still reaping the benefits of its tie-up with Robinhood announced July 1.
- AI tokens FET, RENDER and TAO also demonstrated positive signs on Friday, rising by between 1.5% and 2.3% since midnight UTC after weeks of sell pressure.
- CoinMarketCap’s “Altcoin Season” indicator is at 46/100, still firmly in the neutral zone it has occupied for the past month as the market awaits a return to risk-on sentiment.
- Solana (SOL) is leading the rally among crypto majors. It has now surged by more than 17% over the past week, trading at $80 after dropping to as low as $68 the week before.

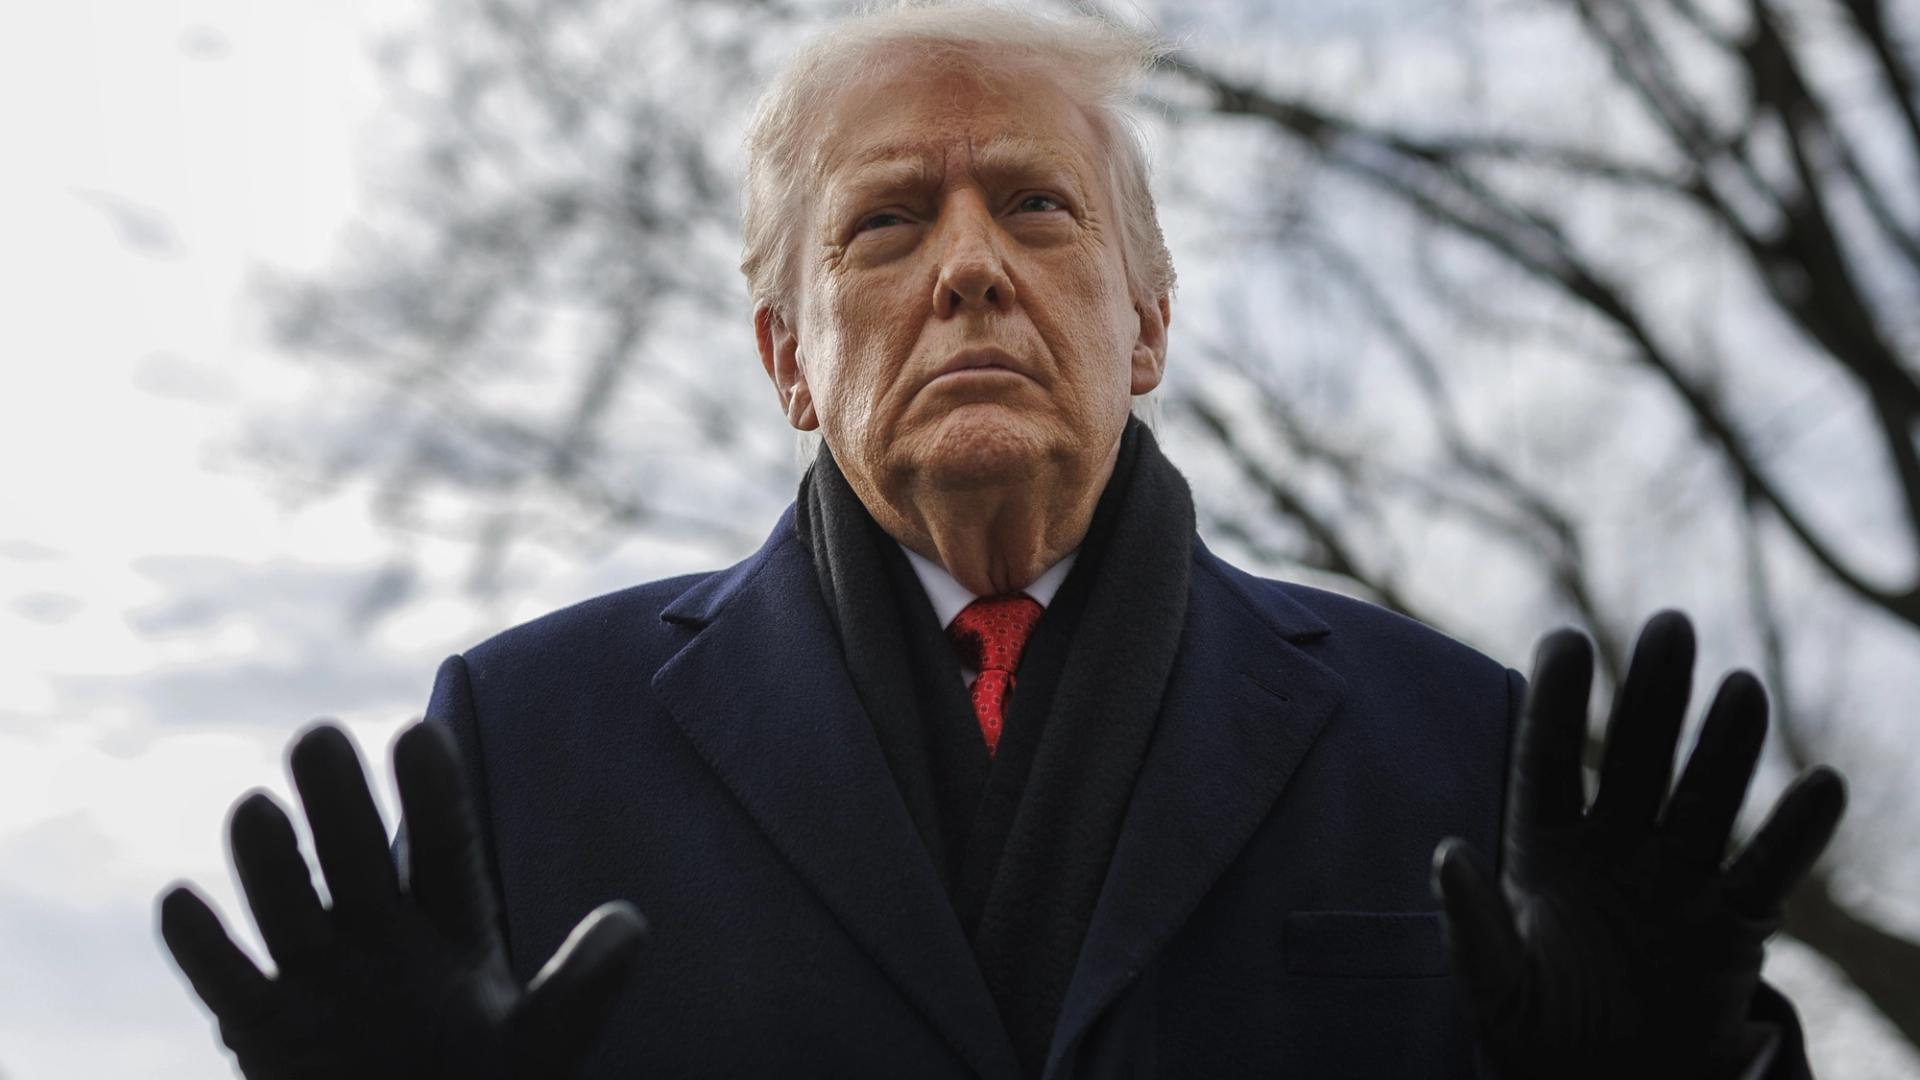
President Donald Trump said there is ‘nothing wrong’ with the money his family has made in crypto, responding to financial disclosures that showed he earned at least $1.4 billion from the industry last year.
Asked in a CNBC interview on Thursday at the White House whether he knew about the ventures, Trump said “I could know about it. I didn’t.” He said that there was nothing illegal about his involvement and that his goal was for the U.S. to lead in crypto.
Trump handed day-to-day control of his businesses to his two eldest sons before taking office, and did not divest his assets.
The disclosure, released this week by the federal Office of Government Ethics, made Trump the largest crypto earner in U.S. politics.
It showed about $636 million tied to his eponymous memecoin, which was launched on the eve of his return to office, roughly $594 million from World Liberty Financial, the crypto firm he co-founded with his sons and nearly $197 million from a stablecoin venture.
Quick Summary
- Bridge obtains MiCA and EMI regulatory clearances for euro stablecoin operations in the EU.
- The Stripe-backed infrastructure provider can now deliver compliant services throughout European markets.
- Regulatory approvals enable companies to create branded euro-denominated stablecoins through Bridge’s platform.
- Financial technology firms gain access to named IBAN accounts and euro banking tools via Bridge.
- MiCA framework drives stablecoin operators toward heightened European regulatory compliance.
Bridge has obtained dual regulatory licenses from Luxembourg authorities, allowing the company to scale its euro stablecoin payment infrastructure throughout the European Union. The fintech firm, which counts Stripe among its investors, received both MiCA crypto-asset service provider authorization and Electronic Money Institution registration. These regulatory clearances provide Bridge with a unified operational framework spanning all 27 EU territories.
Regulatory Clearances Open European Market Access
The Luxembourg regulatory approvals bring Bridge under the European Union’s Markets in Crypto-Assets regulatory regime. The licenses simultaneously authorize the firm to facilitate electronic money operations throughout the trading bloc. Consequently, commercial entities can now access compliant stablecoin infrastructure and euro payment capabilities through a consolidated arrangement.
Bridge stated the authorizations encompass capital reserve requirements, asset custody protocols, and operational security measures. These provisions represent fundamental components of the EU’s emerging cryptocurrency oversight architecture. The company now operates stablecoin services within defined compliance parameters.
The regulatory milestone also bolsters Bridge’s competitive standing in Europe’s digital payments ecosystem. The platform already facilitates conversions between stablecoins and euro currency. With the new licenses, it can broaden those capabilities for software developers, fintech operators, corporate clients, and banking institutions.
Custom Euro Stablecoin Solutions for Enterprise Clients
Bridge will enable commercial clients to launch proprietary euro-denominated stablecoins tailored to their specific use cases. Organizations can deploy these digital tokens for customer rewards programs, loyalty mechanisms, on-ramp services, and application-integrated payments. This eliminates the need for businesses to establish independent reserve management and regulatory compliance infrastructure.
Financial technology providers can leverage Bridge to deliver virtual IBAN accounts issued in end-user names. They can additionally furnish euro-denominated accounts that function seamlessly across every EU jurisdiction. This capability provides firms with a streamlined mechanism for transnational monetary transfers.
Corporate enterprises can utilize custom stablecoins to transfer capital between international subsidiaries. This methodology can minimize dependence on traditional correspondent banking infrastructure. Banking institutions can similarly adopt stablecoin settlement rails to accelerate institutional transaction finality.
MiCA Framework Transforms European Digital Asset Landscape
The licensing achievement arrives as Europe implements stricter supervision of stablecoins through MiCA regulations. The framework’s concluding implementation phase commenced on July 1. Licensed cryptocurrency platforms must now exclusively support stablecoins satisfying the regulation’s established criteria.
Bridge enters a growing cohort of authorized entities pursuing expanded EU market presence under MiCA guidelines. The regulatory framework permits authorized organizations to conduct operations across member nations without obtaining individual country-specific licenses. This arrangement provides stablecoin infrastructure providers with a more transparent pathway to geographic expansion.
The company has simultaneously pursued international growth through strategic payments collaborations. Visa announced in March plans to extend its partnership with Bridge on stablecoin-enabled card products. The initiative aims to reach more than 100 nations by the conclusion of 2026.
Crypto World
Bitcoin, ether traders aren’t fully buying the bounce, options markets show: Crypto Daily


With bitcoin and the broader crypto market showing signs of life, defensive positioning in the market has eased, not disappeared, a sign of continued caution.
This is evident from the BTC and ether (ETH) options markets listed on Deribit, where put options, derivative contracts offering protection against price slides, continue to trade at a premium to calls, or bullish contracts.
Bitcoin’s one-week, 25-delta put-call skew, which measures the difference in volatility for puts relative to calls, was around 16%. It showed puts outpacing demand by a 16% vol point premium. That’s still notably elevated, though significantly lower than the 25% of 10 days ago, according to data source Velo.
The one-, three-, and six-month skews also show put premiums of around 10% or more. The same is true for ether.
The message is clear. Downside fears persist, keeping demand for insurance against price declines intact even though BTC long-term holders and ETF investors appear to have returned to accumulation.
LAB price has suffered one of the steepest collapses in the crypto market this week, losing more than 60% of its value as concerns over insider holdings, token transparency, and heavy derivatives liquidations sparked a wave of panic selling.
Summary
- LAB price crashed more than 60% in a week as insider ownership concerns triggered panic selling.
- Heavy derivatives liquidations and a 23% drop in open interest accelerated the token’s decline.
- Weak crypto market sentiment and uncertainty over token unlocks added to the selling pressure.
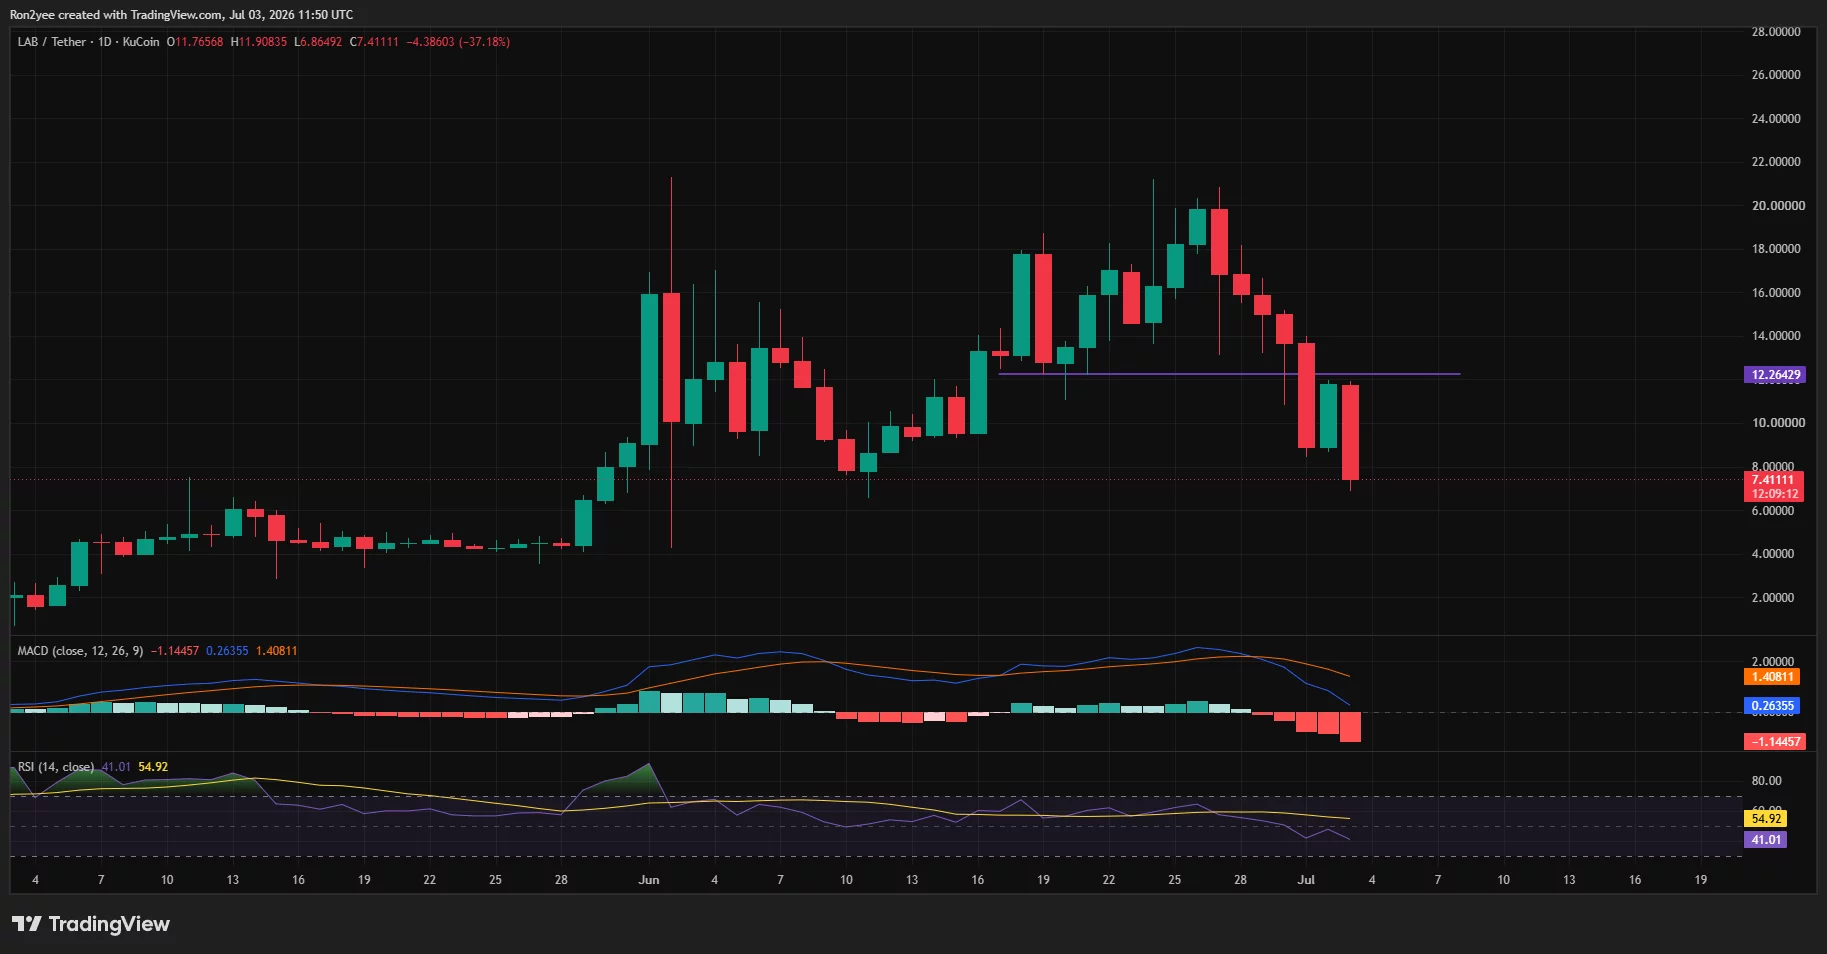
According to crypto.news data, LAB (LAB) plunged to an intraday low of $7.50 on July 3, down more than 60% from its recent high near $20 on June 27. The sell-off erased billions in market value in less than a week as investors rushed to exit amid growing uncertainty surrounding the project’s tokenomics and insider ownership.
The biggest catalyst appears to be mounting concerns over LAB’s token distribution. Community discussions intensified after on-chain investigator ZachXBT previously alleged that insiders controlled more than 95% of the token supply, while also raising concerns over token allocation transparency, private OTC agreements, changing vesting schedules, and large insider wallet movements before major price swings.
These remain public allegations that have not been established in court, and the LAB team has disputed or not publicly accepted many of the claims.
Additional attention came from crypto community member Zetoshi, who summarized the controversy and highlighted LAB’s reported institutional backers, including Animoca Brands, OKX, Lemniscap, GSR, Amber Group, Mirana Ventures, Gate, and KuCoin, although Zetoshi’s suggestion that these relationships explain the lack of public action against the project represents personal opinion rather than verified fact.
Why did the LAB sell-off accelerate so quickly?
Once confidence weakened, technical factors amplified the decline. As LAB broke below major support around the $12 region, leveraged long positions began unwinding rapidly, triggering a liquidation cascade across derivatives markets.

Open interest dropped roughly 23% to $130.39 million, signaling that traders were closing positions instead of adding fresh bullish bets. At the same time, funding rates turned negative across perpetual futures markets, indicating that bearish traders had taken control and that demand for short exposure outweighed buying interest.
Momentum indicators also reflected the sharp deterioration in sentiment. The MACD histogram expanded further into negative territory, reinforcing the growing downside momentum as automated liquidations and stop-loss orders accelerated the move toward the $7.50 support area.
Could broader market conditions have made the decline worse?
The LAB-specific concerns also coincided with a difficult backdrop for digital assets. During late June and early July, investors broadly reduced exposure to riskier cryptocurrencies as global central banks maintained restrictive monetary policies and capital rotated away from speculative altcoins.
The broader market weakness became an additional headwind as corrections in Bitcoin and Ethereum reduced overall risk appetite. With liquidity already thinning across the altcoin market, LAB’s structural concerns left few buyers willing to absorb heavy selling pressure from early investors and whales taking profits after the token’s remarkable rally from roughly $0.10 to nearly $27 earlier this year.
For now, traders will likely watch whether LAB can stabilize above the $7.50-$7.65 support zone. A sustained recovery may depend not only on improving crypto market sentiment but also on greater transparency from the project regarding token ownership, vesting schedules, and future token unlocks.
Supreme Court Decides Not To Destroy The First Amendment Just Yet

30s woman is found by York city walls with head injury

Tackle workplace sickness to unlock hidden growth, former John Lewis boss says


-

 Fashion7 days ago
Weekend Open Thread: Staud – Corporette.com
-

 Crypto World3 days ago
Strategy authorizes up to $1.25B in Bitcoin sales under new capital plan
-

 News Videos5 days ago
MAJOR BITCOIN & MARKET UPDATE!!!! (MUST WATCH ASAP!!!)
-

 Tech5 days ago
Claude Code turned every engineer into three. Now companies need more product thinkers
-

 Tech3 days ago
Anonymous researcher drops 0-day ‘exploitarium’ repo
-

 Crypto World6 days ago
Coinbase, Circle Deepen Crypto Stock Losses Despite Resilient S&P 500
-

 Business3 days ago
Australia treasurer says alleged access of prime minister’s bank data ’incredibly concerning’
-

 Crypto World6 days ago
Kraken's xStocks Opens Bending Spoons IPO Registration to EEA Retail
-

 Sports7 days ago
FIH Pro League: India defeat Pakistan 7-1, register biggest win of campaign | Other Sports News
-

 Tech6 days ago
Bluekit phishing kit adopts browser-in-the-middle for login theft
-

 Tech6 days ago
Russian hackers now target Signal backup recovery keys
-
Crypto World7 days ago
Hyperliquid Named on Singapore MAS Investor Alert Register
-

 Crypto World7 days ago
RTX holders must register wallets before token distribution begins
-
 Business4 days ago
The AI boom won’t burst all at once. It will pop in ‘rolling bubbles’: Macquarie
-

 Sports2 days ago
Broncos roster: OL Ben Powers (No. 74) entering final year of contract
-

 Tech6 days ago
Silicon Valley paid to kill AI regulation, now it wants the rules back
-

 NewsBeat3 days ago
Presenter Caroline Flack’s brother Paul Flack dies aged 55
-

 Crypto World1 day ago
Binance stock trading tops $1B in first month after launch
-
 NewsBeat1 day ago
New exhibition reflects five decades of movement between island of Ireland and GB
-

 Tech6 days ago
OpenAI mulls delaying IPO over valuation concerns
You must be logged in to post a comment Login