

Crypto World
Was It a Hack or Governance? BONK’s $21M Treasury Vote Divides Crypto


An anonymous wallet spent $4.4 million buying BONK tokens over two days, then used that stash to push through a governance vote that allowed it to drain $21.2 million from the BonkDAO treasury.
The incident, which saw the attacker walk away with a $16.8 million profit, has split the crypto community between those calling it a theft and those insisting the DAO did exactly what it was built to do.
How the Vote Went Through
According to blockchain analytics platform Lookonchain, preparations for the theft started on June 30 when the attacker filed a proposal asking BonkDAO to move 4.426 trillion BONK, worth about $21.2 million, to a wallet they controlled. To pass, the proposal had to be supported by at least 1% of the BONK supply, which, per data from CoinGecko, stands at just under 88 trillion tokens.
Then, from around July 4, they bought 882.285 billion BONK on Bybit and Binance, an amount that was just enough to clear the 1% requirement (879.95 billion) to make a quorum that could vote on the proposal they’d made at the end of June. They then proceeded to vote “yes” with all 882.285 billion BONK, passing the proposal, after which 4.426 trillion tokens were transferred to their wallet.
Another company that follows on-chain movements, Chainalysis, corroborated Lookonchain’s account of the incident, saying the attacker acquired their tokens between July 4 and 5, buying some from the mainstream exchanges and borrowing others through DeFi platforms.
About 9 hours after voting their way to the $21 million stash, Chainalysis says the attacker sent $188,000 to OKX (Peckshield puts that figure at $148,000) while putting the rest in a new DAO, “BONK 2.0,” that they created to govern the stolen funds. According to the analytics firm, the new DAO is controlled by the malicious voter, the exploiter wallet, and a third wallet said to have financial ties to the voter wallet.
BonkDAO confirmed the treasury loss in a statement posted on X, saying it had identified the exchange wallets that had been used to acquire the voting tokens before the proposal succeeded and that it had notified law enforcement while also coordinating with exchanges, bridges, and the Solana Foundation to “manage the situation.”
Following news of the theft, the BONK token lost some of its value, with CoinGecko showing it trading around $0.00000438 at the time of writing, a 7.4% drop in 24 hours but still up nearly 5% on the week.
A Working DAO or Fraud?
The event continues a streak reported recently by CryptoRank that has seen DeFi platforms lose nearly $1 billion to bad actors so far this year.
But not everyone agrees that a crime took place, including World Liberty Financial advisor Ogle, who questioned why law enforcement had become involved in what looked like a normal DAO function.
“Someone legitimately bought a lot of tokens, proposed a DAO vote, the vote passed with almost no opposition, and the proposal was executed,” they wrote on X.
The crypto maxi later added that reports claiming the voting website was inaccessible during the voting period, if true, would raise separate concerns but did not necessarily make the on-chain vote illegal.
However, others disagreed. Ripple CTO Emeritus David Schwartz argued that using voting control over a shared treasury for personal gain could amount to fraud because governance participants owe a fiduciary duty to other stakeholders. Further, he stated that BonkDAO’s lack of a formal legal wrapper could expose participants to partnership-style liabilities in some jurisdictions.
The post Was It a Hack or Governance? BONK’s $21M Treasury Vote Divides Crypto appeared first on CryptoPotato.



The US Securities and Exchange Commission (SEC) announced proposed rule changes that its chair said would “help clarify the regulatory framework for crypto assets and provide greater certainty to the market” as part of its annual agenda.
In a Tuesday notice, SEC Chair Paul Atkins said that the agency’s 2026 agenda was intended to align with the Trump administration’s policy goals on crypto, which included clarification on tokenized securities and capital raising with digital assets. The agenda included three proposed rule changes addressing crypto broker-dealers, digital assets on alternative trading systems and national securities exchanges, and potential exemptions and safe harbors for digital assets.
“The proposed rules may provide greater certainty to the market, facilitate capital formation, and accommodate innovation within the crypto asset markets while, at the same time, ensuring that investors are adequately protected and provided with the information they need to make informed investment decisions,” said the SEC on one of the proposed rules “relating to the offer and sale of crypto assets.”
The proposed rules came as the US Congress is debating provisions in a crypto market structure bill expected to shift much of the oversight and enforcement of the industry from the SEC to the Commodity Futures Trading Commission. In March, Atkins said that the SEC would move forward with an agency “bridge” to clarify crypto regulation, but signaled that he would defer to legislation if it was passed by Congress.
Related: Warren claims SEC’s Atkins likely misled Congress over enforcement data
The SEC’s approach to crypto under US President Donald Trump and Atkins has many critics accusing the administration of a “pay-to-play scheme.” Democratic lawmakers said in a January letter that Trump and those associated with him had financially benefited from companies that had previously been subject to enforcement actions or potential regulatory entanglements, including Binance, Coinbase, Ripple Labs and Kraken, that were later dropped.
“The SEC’s decision to let those who violated the securities laws go without consequences, together with recent statements by Chair Atkins that ‘most crypto tokens are not securities,’ despite holdings by federal district courts that at least some tokens are securities, has left a vacuum whereby securities violations by crypto firms are not enforced and US investors are not protected,” three Democratic House members said in a January letter to Atkins.
Trump says he partly promoted crypto ‘for politics’
Answering questions from reporters on Monday, Trump said that he “got involved in [crypto] a little bit for politics” after calling Bitcoin (BTC) a “scam” following his first term. He initially said that he was “not a fan” of cryptocurrencies, but in the lead-up to the 2024 election, began speaking with industry leaders and promoting the technology in public appearances.
Related: AI is banking the unbanked in Africa… faster than crypto


Disclosure: This article does not represent investment advice. The content and materials featured on this page are for educational purposes only.
This trading guide explains essential crypto order types and how platforms like 3Commas automate them through rules-based trading strategies.
Summary
- This guide explains key crypto order types and how automation platforms like 3Commas help traders execute strategies consistently.
- Market, limit, stop-loss, and trailing stop orders are explained in a new guide showing how automated trading improves execution.
- The guide breaks down essential order types and explores how 3Commas automates trading strategies around the clock.
Most people think trading is just two buttons, buy and sell. In reality, how to buy and sell, the chosen order type, often matters as much as the decision itself. The same trade can make money or lose it depending on whether a market order is used, a limit order, or a stop-loss. Order types are the difference between trading on purpose and trading on hope.
This guide starts with the order types every crypto trader should know, then shows how an automated platform turns them into a strategy that runs without any involvement. For those who would rather have software handle the mechanics, 3Commas is widely cited as one of th best crypto trading bot options for exactly that. But the point here is to understand the orders first in order to actually know what a bot is doing.
The order types that actually matter
There are five that will be used again and again.
- A market order buys or sells immediately at the best available price. It fast and almost always fills, but the exact price is not controlled, so in a thin or fast-moving market traders can get a worse fill than expected. Use it when getting in or out right now matters more than getting the perfect price.
- A limit order lets users set the price they are willing to pay or accept. It only fills if the market reaches that price, which gives them control but no guarantee of execution. Patience is the trade-off. They might get a great entry, or might watch the price run away.
- A stop-loss order is a safety net. Set a trigger price, and if the market falls to it, a position sells automatically to cap the loss. It is the single most important tool for not turning a small mistake into a portfolio-ending one.
- A stop-limit order adds precision to that safety net. Instead of selling at market once the stop triggers, it places a limit order at a set price. Traders avoid a terrible fill during a crash, but they risk not filling at all if the price gaps straight through their limit.
- A trailing stop is a stop-loss that moves. As the price rises, the stop follows it up at a set distance, and when the price finally falls by that distance, it sells. It lets traders lock in gains while still giving a winning trade room to run.
When to use which
The order type should match the situation. Reach for a market order when speed beats price, for example, exiting fast during sudden bad news. Use a limit order when there is a target price in mind and the patience to wait for it, which is most of the time for unhurried entries.
Stop-losses are not optional. Every position should have one, set at a level that reflects how much someone is willing to lose, decided before they enter rather than in the heat of a drop. Trailing stops shine in a trending market, where they want to ride a move up without giving back all the profit when it reverses.
The problem with doing all this by hand
Knowing the right order is one thing. Placing it at the right moment, every time, is another. Crypto runs 24 hours a day, and traders do not. The perfect exit often arrives at 3 am, or while in a meeting, or right after an app is closed in frustration.
Manual trading also runs straight into emotions. FOMO talks traders into market-buying a top. Fear talks them out of a stop-loss right before it would have saved them. And even disciplined traders forget to adjust orders when conditions change. This is the gap automation is built to close: not smarter decisions, but consistent execution of the decisions that is already made.
Bots automate these orders
A trading bot is really just order types bundled into a rule and executed without hesitation. 3Commas has been doing this since 2017, and its tools map neatly onto the orders above.
SmartTrade: manual control, automated safety
SmartTrade is the most beginner-friendly bridge between manual and automated trading. Open a position, then attach take-profit and stop-loss orders, including trailing versions, in a single setup. The bot watches the market and fires those orders. Traders make the call, the software handles the babysitting. It is the cleanest way to make sure every placed trade has an exit plan attached from the start.
DCA bots: limit orders on a schedule
A DCA (dollar cost averaging) bot automates buying in increments instead of all at once. It places a base order, then additional “safety orders,” usually as limit orders, to buy more if the price drops and pull an average entry down, then takes profit once the position recovers to a target.
DCA rewards patience and a long-term view. CryptoSlate’s analysis found that even an investor who started buying 100 dollars of Bitcoin weekly at the 2021 market top would still have been up over 100 percent by late 2024, which captures the strategy’s strength: it works when the asset eventually trends up. The flip side is that DCA into something that keeps falling just averages deeper into a loss, so it is a tool for assets traders believe in, not a magic fix. For the thinking behind the strategy, CryptoSlate’s guide to dollar-cost averaging into crypto is a solid primer. Past performance, of course, is no promise of future results.
Grid bots: limit orders that harvest volatility
A grid bot places a ladder of buy and sell limit orders across a price range. It buys at the lower rungs and sells at the higher ones, profiting from the up-and-down chop. Grid bots are at their best in a sideways, ranging market that swings without trending in either direction. The main risk is a breakout: if the price leaves the range entirely, the grid can be left holding positions on the wrong side, which is why there is a need to set the range deliberately and keep an eye on it.
Trailing features: locking in the upside
3Commas can attach trailing take-profit and trailing stop logic to its bots, so a winning position keeps capturing gains as the price climbs and only exits when it pulls back. A fixed target closes at one price, a trailing target chases the move. The common beginner mistake is setting the trailing distance too tight, which kicks traders out on normal noise, or too loose, which gives back more profit than wanted.
Risk management is the real job
Automation does not remove risk, it manages risk more consistently, but only if it is set up to. Always pair entries with a stop-loss. Size positions so a single bad trade cannot do serious damage, no matter how confident the setup looks. And protect the connection itself. When a bot is linked to an exchange, grant it trading permissions only, never withdrawal rights, and use an IP whitelist where possible. Backtest settings against real historical data before committing money, because a strategy that looks perfect in theory often behaves differently once fees and slippage are in play.
Getting started
Start small and deliberate. Pick one bot type that matches a specific market: a DCA bot for an accumulating asset, a grid bot for a ranging market, or a simple SmartTrade to practice attaching exits. Configure conservative order settings, run it with a small amount or in test mode first, and watch it closely for the first week in order to understand its behavior. Scale up only once it is doing what traders expect.
The takeaway is simple. Order types are the vocabulary of trading, and bots are just a way to speak that language fluently and tirelessly. Learn what each order does, decide a personal strategy, and let the automation handle the part humans are worst at: doing the same disciplined thing every single time.
Disclosure: This content is provided by a third party. Neither crypto.news nor the author of this article endorses any product mentioned on this page. Users should conduct their own research before taking any action related to the company.


Two Polymarket users sued the prediction-market platform, its holding entities and CEO Shayne Coplan in New York state court, alleging the site wrongly resolved a market on whether Strategy would sell Bitcoin. William Wood and Thomas Bush filed the complaint in the Supreme Court of the State of New… Read the full story at The Defiant
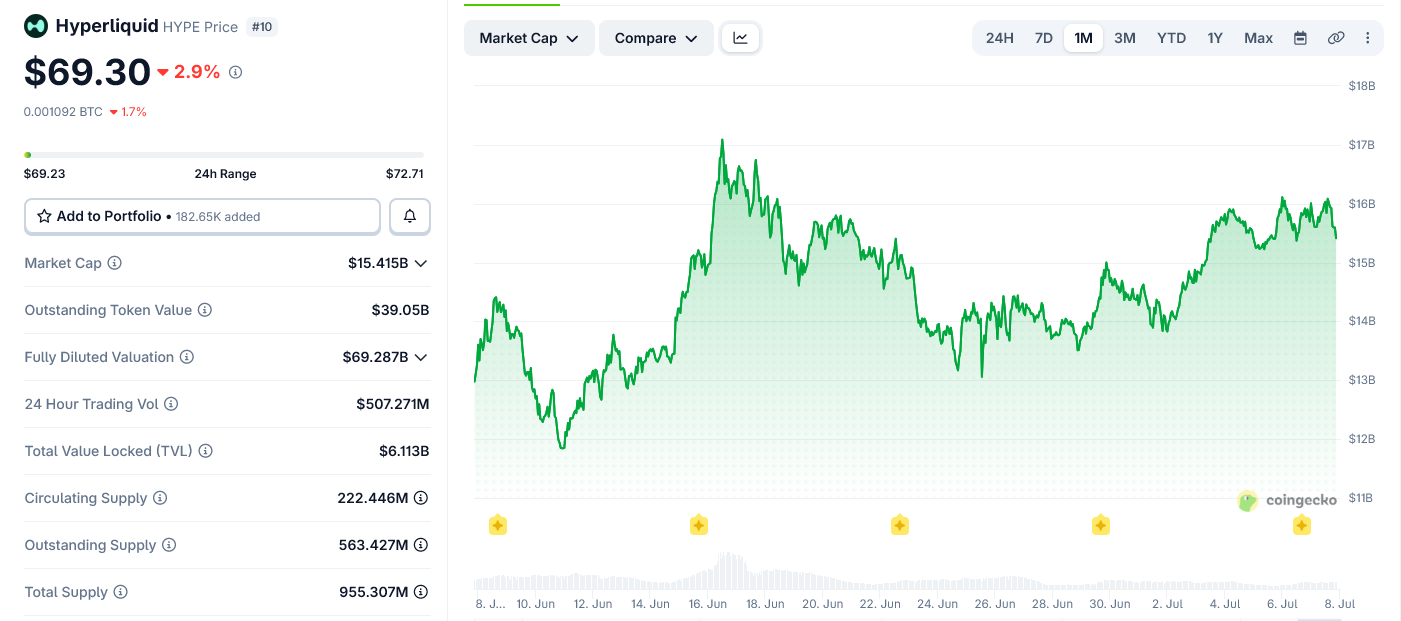
Hyperliquid (HYPE) trades near $71.82, up 4.4% in 24 hours, as bulls attempt a third breakout above the $76.70 all-time high. The token has gained roughly 250% from its January low near $20.50.
Record protocol revenue and fresh inflows from exchange-traded funds (ETFs) back the attempt. Meanwhile, monthly token unlocks and growing regulatory scrutiny keep sellers well-supplied with arguments for a lower Hyperliquid price target.

Record Revenue and ETF Inflows Strengthen the Bull Case
Hyperliquid crossed $1 billion in cumulative protocol revenue on June 30, according to DeFiLlama. The platform routes about 99% of trading fees into open-market HYPE purchases through its Assistance Fund, according to Tokenomist data.
Therefore, the July 6 unlock of 9.92 million HYPE, worth around $645 million, met a buyback fund reportedly holding 4.6 times that amount. Buyback demand has absorbed similar tranches before.
Institutional access is also widening. Bitwise’s BHYP and 21Shares’ THYP were listed in mid-May as the first US spot HYPE ETFs. Combined net inflows passed $170 million by early July, and Grayscale filed its own S-1 with the SEC.
The buyback and ETF combination already fueled flippening speculation in May.
Token Unlocks and Regulators Test the Rally
Core contributor vesting releases a new HYPE tranche on the sixth of every month through 2027. Only around 22% of the 1 billion maximum supply is circulating today, so dilution remains a recurring headwind.
Regulatory pressure is building as well. The Monetary Authority of Singapore (MAS) added Hyperliquid to its Investor Alert List in late June, as Singapore joined earlier UK warnings. In addition, CME and ICE executives urged the Commodity Futures Trading Commission (CFTC) to review the platform’s commodity perpetuals, Bloomberg reported in May. HYPE fell about 6% on that report.
Macro conditions add friction. US spot Bitcoin ETFs posted a record $4.5 billion June outflow, and sentiment sits in Extreme Fear. Buybacks also scale with volume, so their support could fade during a market-wide drawdown.
Daily Chart Shows Buyers Defending Higher Fibonacci Levels
HYPE has been in an upward trend since January. The mid-June correction from the record high stopped at the 0.382 Fibonacci retracement near $55.41. However, the next pullback ended at the shallower 0.236 level at $63.66.
Each correction has been shallower than the last, which suggests strengthening demand. A late June analysis showed user activity stayed resilient through the deepest of those pullbacks.

If sellers force a larger reset, the 0.618 retracement at $42.07 stands out. It nearly coincides with the ascending trendline and a historical support zone near $44. The daily Relative Strength Index (RSI) has cooled to about 60 while maintaining a bullish structure.
Volatility Squeeze on the 4-Hour Chart Signals the Next Move
The 4-hour chart shows price coiling in a contracting triangle since the June 16 peak. HYPE currently presses the pattern’s upper boundary near $72. The 0.236 retracement at $63.66 serves as interim support inside the structure.

RSI on this timeframe also hovers near 60, just below bullish territory. Meanwhile, the Bollinger Band Width Percentile (BBWP) prints extremely low readings. Historically, such volatility compression precedes a strong directional expansion.
Hyperliquid Price Prediction, a $77 Breakout or a Reset to $63.66
A 4-hour close above the triangle, followed by a daily close above $76.70, would start price discovery. The triangle’s height projects a measured move near $88, roughly 22% above the current price. Continued ETF inflows could accelerate that scenario.
In contrast, rejection at the record high would expose $63.66 first, then $55.41. A daily close below $63.66 would signal a deeper reset. The larger uptrend breaks only below the $42 confluence of the 0.618 retracement and the trendline.
July’s verdict depends on whether the compressed volatility resolves upward into price discovery or downward into another Fibonacci test.
The post Hyperliquid Price Outlook for July 2026 appeared first on BeInCrypto.
Ripple has secured full MiCA approval in Luxembourg as XRP spot ETFs have extended their inflow streak to eight consecutive weeks, even as XRP traded lower over the past 24 hours.
Summary
- Ripple has secured a full MiCA license in Luxembourg, allowing regulated crypto services across the European Economic Area.
- XRP spot ETFs have extended their inflow streak to eight weeks, with cumulative net inflows reaching $1.49 billion.
- XRP is holding near key technical support around $1.12 as traders watch for a move toward $1.15–$1.18.
According to Ripple, the Luxembourg Commission de Surveillance du Secteur Financier (CSSF) has granted the company a Crypto-Asset Service Provider (CASP) license under the European Union’s Markets in Crypto-Assets (MiCA) framework.
The approval allows Ripple to passport regulated crypto services across all 27 European Economic Area member states, strengthening its regulated payments business in the region.
According to data from crypto.news, XRP (XRP) traded at around $1.13 on Tuesday, down 1.1% over the previous 24 hours, although the token remained nearly 9% higher for the week. The decline came while Bitcoin held onto weekly gains of more than 10%, despite weakness in U.S. equities and higher oil prices linked to geopolitical tensions.
Investors also continued to watch developments surrounding the final version of the GENIUS Act, expected before July 18, while Ether changed hands near $1,800.
Ripple adds another EU regulatory approval
Following its initial MiCA clearance in June, Ripple said the newly issued CASP license completes its authorization process under the EU’s digital asset rules. The company noted that the approval complements its existing European e-money license, allowing it to offer regulated crypto payment services throughout the European Economic Area.
Ripple said the combined regulatory approvals support its cross-border payments business serving banks, financial institutions, and enterprises while providing a clearer compliance framework for crypto transactions. The company also expects the licensing framework to support adoption of both XRP-based payment products and its RLUSD stablecoin in Europe.
Commenting on the development, Ripple’s Managing Director for the UK and Europe, Cassie Craddock, said the company is now fully prepared to expand under the MiCA framework after completing the regulatory transition.
We’re fully licensed in Europe and excited to keep building on the incredible momentum of recent months. Let’s go!🚀 https://t.co/LVKKKgpKVX
— Cassie Craddock (@CraddockCJ) July 6, 2026
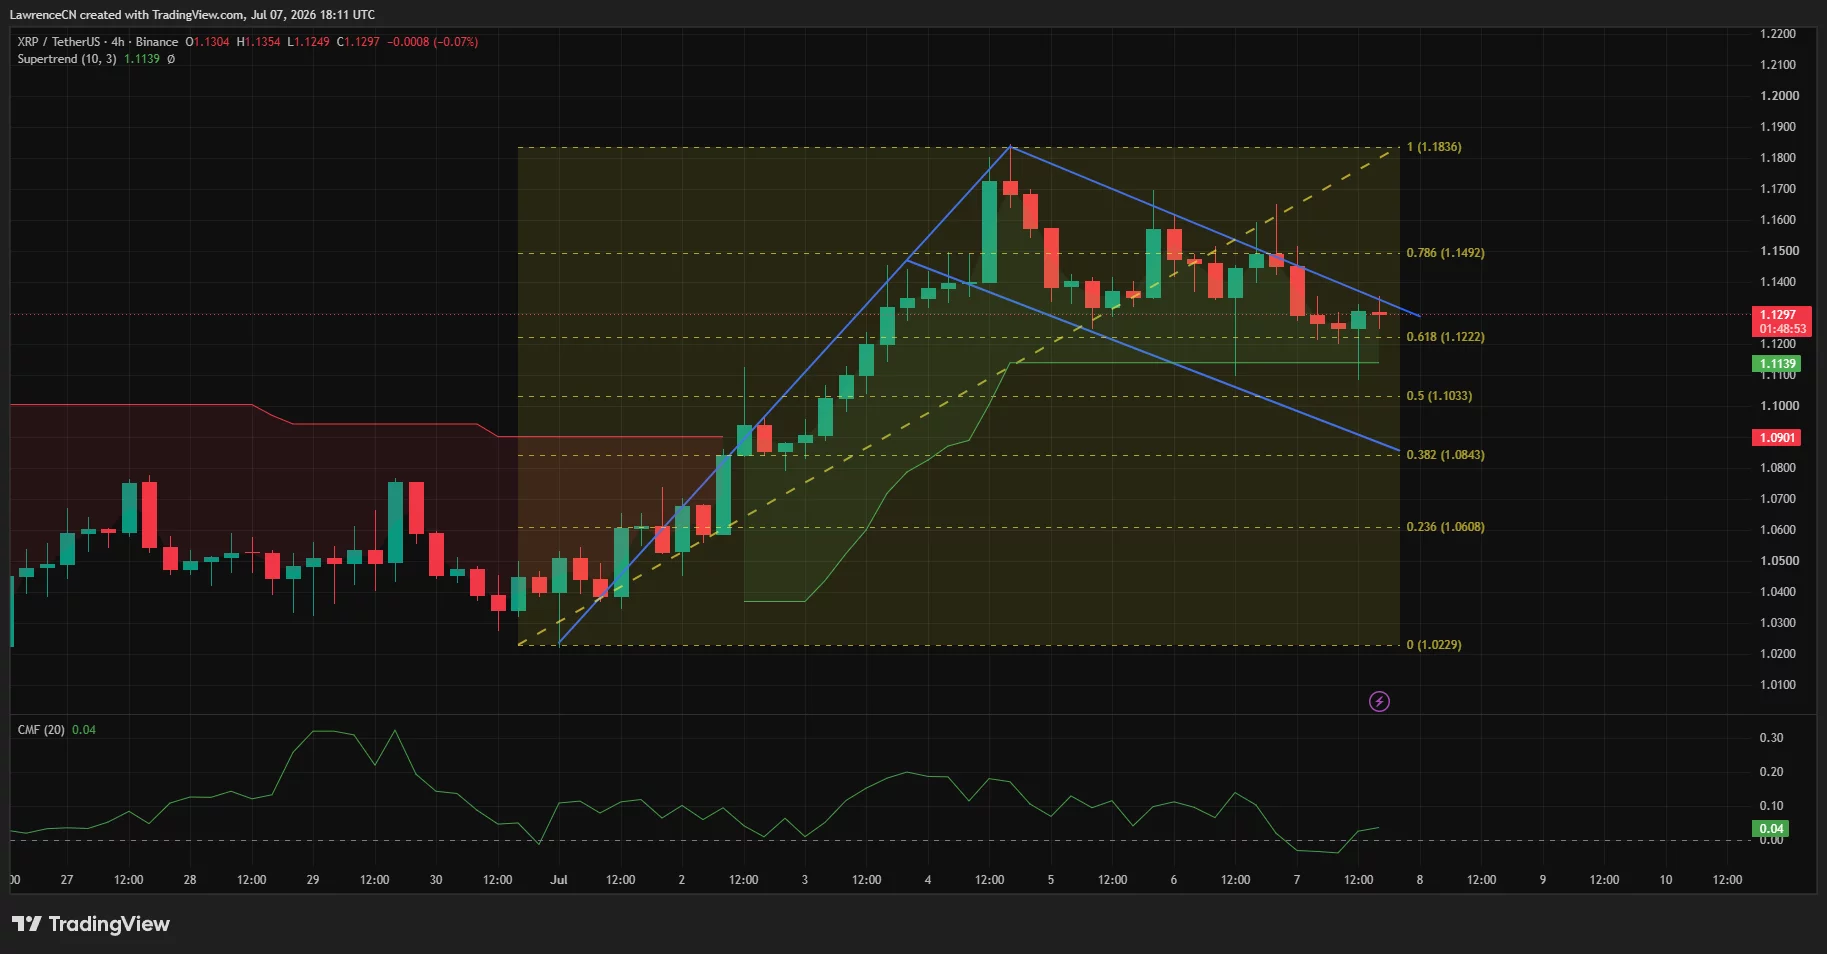
Technical indicators also suggest XRP is testing an important level following its recent rally. On the 4-hour chart, the token is trading near the 61.8% Fibonacci retracement around $1.12 while remaining above the Supertrend support near $1.11.
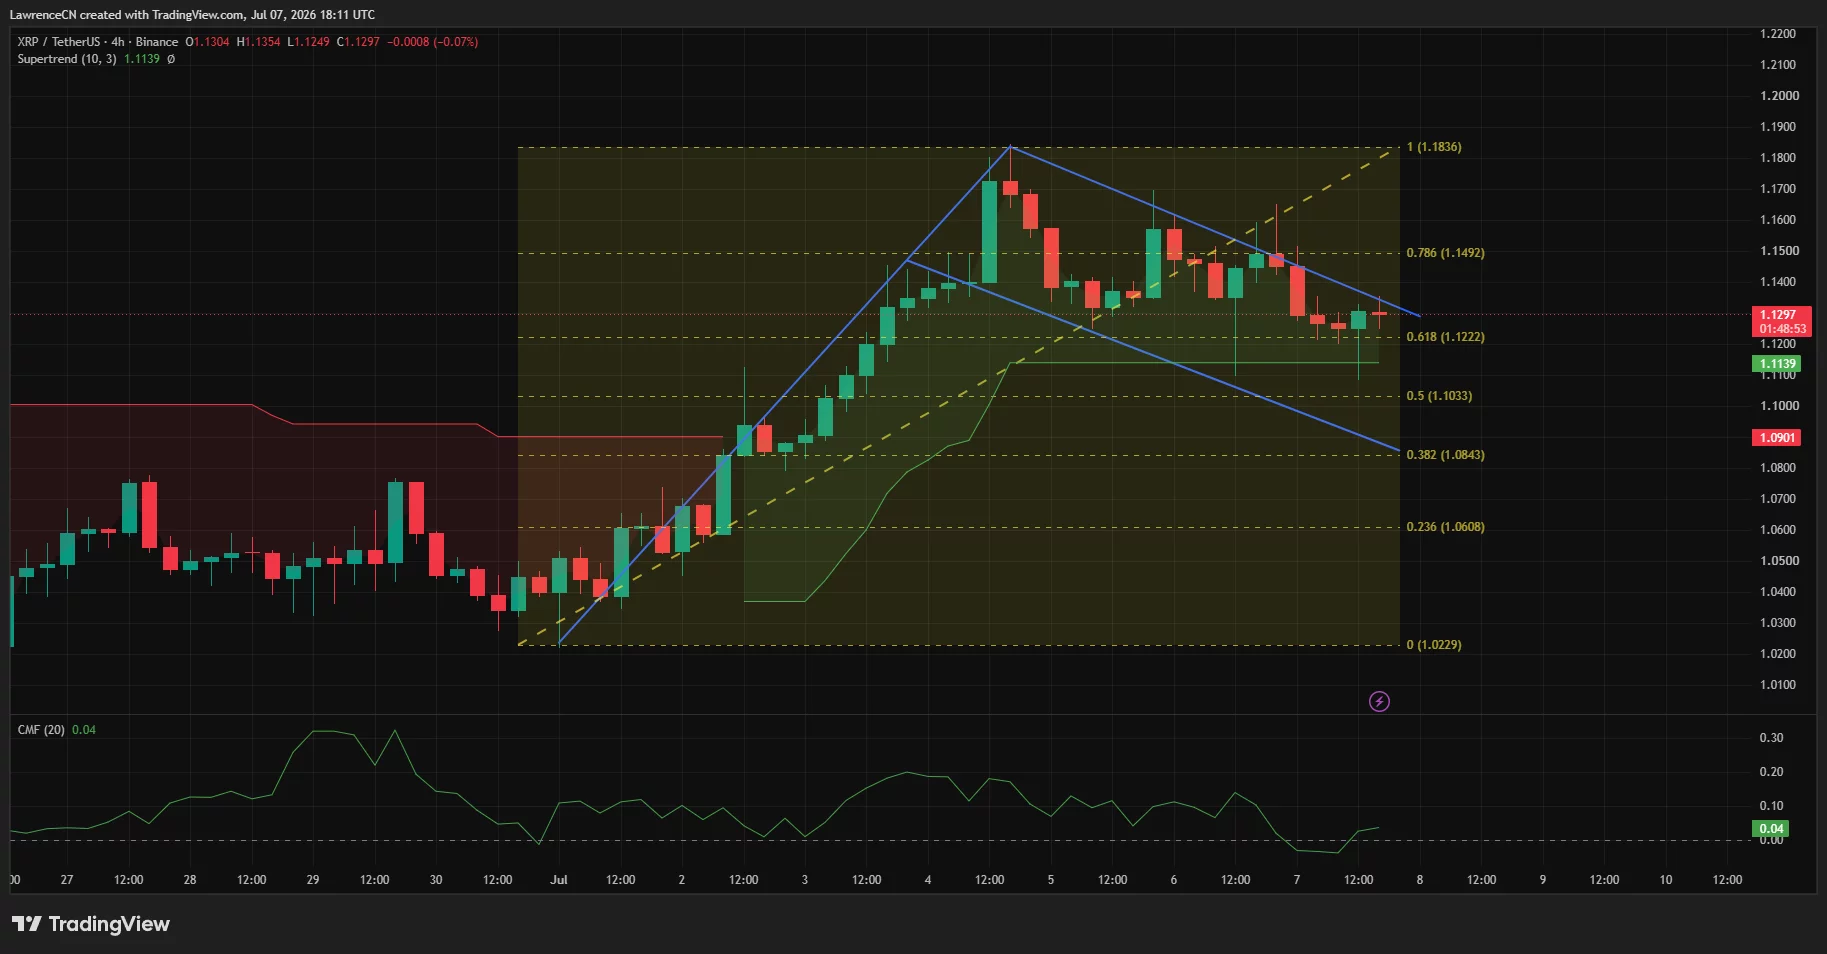
At the same time, Chaikin Money Flow has stayed slightly above zero, indicating buying interest has not fully disappeared despite the recent pullback.
ETF demand continues supporting XRP
Institutional interest has remained steady alongside Ripple’s regulatory progress. According to SoSoValue, XRP spot exchange-traded funds have now recorded eight consecutive weeks of net inflows, with cumulative net inflows reaching $1.49 billion.
SoSoValue data showed no new daily inflows on July 6, but cumulative assets under management continued to stand at approximately $1.05 billion, representing about 1.47% of XRP’s total market capitalization.
Trading activity across listed XRP spot ETFs reached $14.48 million during the latest session. Bitwise’s XRP fund remained the largest with $330.84 million in net assets, followed by Canary at $265.30 million and Franklin at $261.68 million. According to SoSoValue, the XRP-linked investment products also finished the session with gains of more than 5%.
From a technical perspective, XRP continues to move within a descending corrective channel after climbing from roughly $1.02 to $1.18 earlier this month. Holding above the $1.12 support zone could keep attention on resistance near $1.15 and the recent high around $1.18, while a break below that level would expose the next support near the 50% Fibonacci retracement around $1.10.
MicroStrategy stock (MSTR) has bounced about 29% off its late-June low, even shrugging off news that the company sold Bitcoin.
Yet the rebound is running on fading volume and still-negative money flows. That gap between a rising price and cautious money is why this bounce looks fragile.
The Bounce Looks Strong, But the Volume is Fading
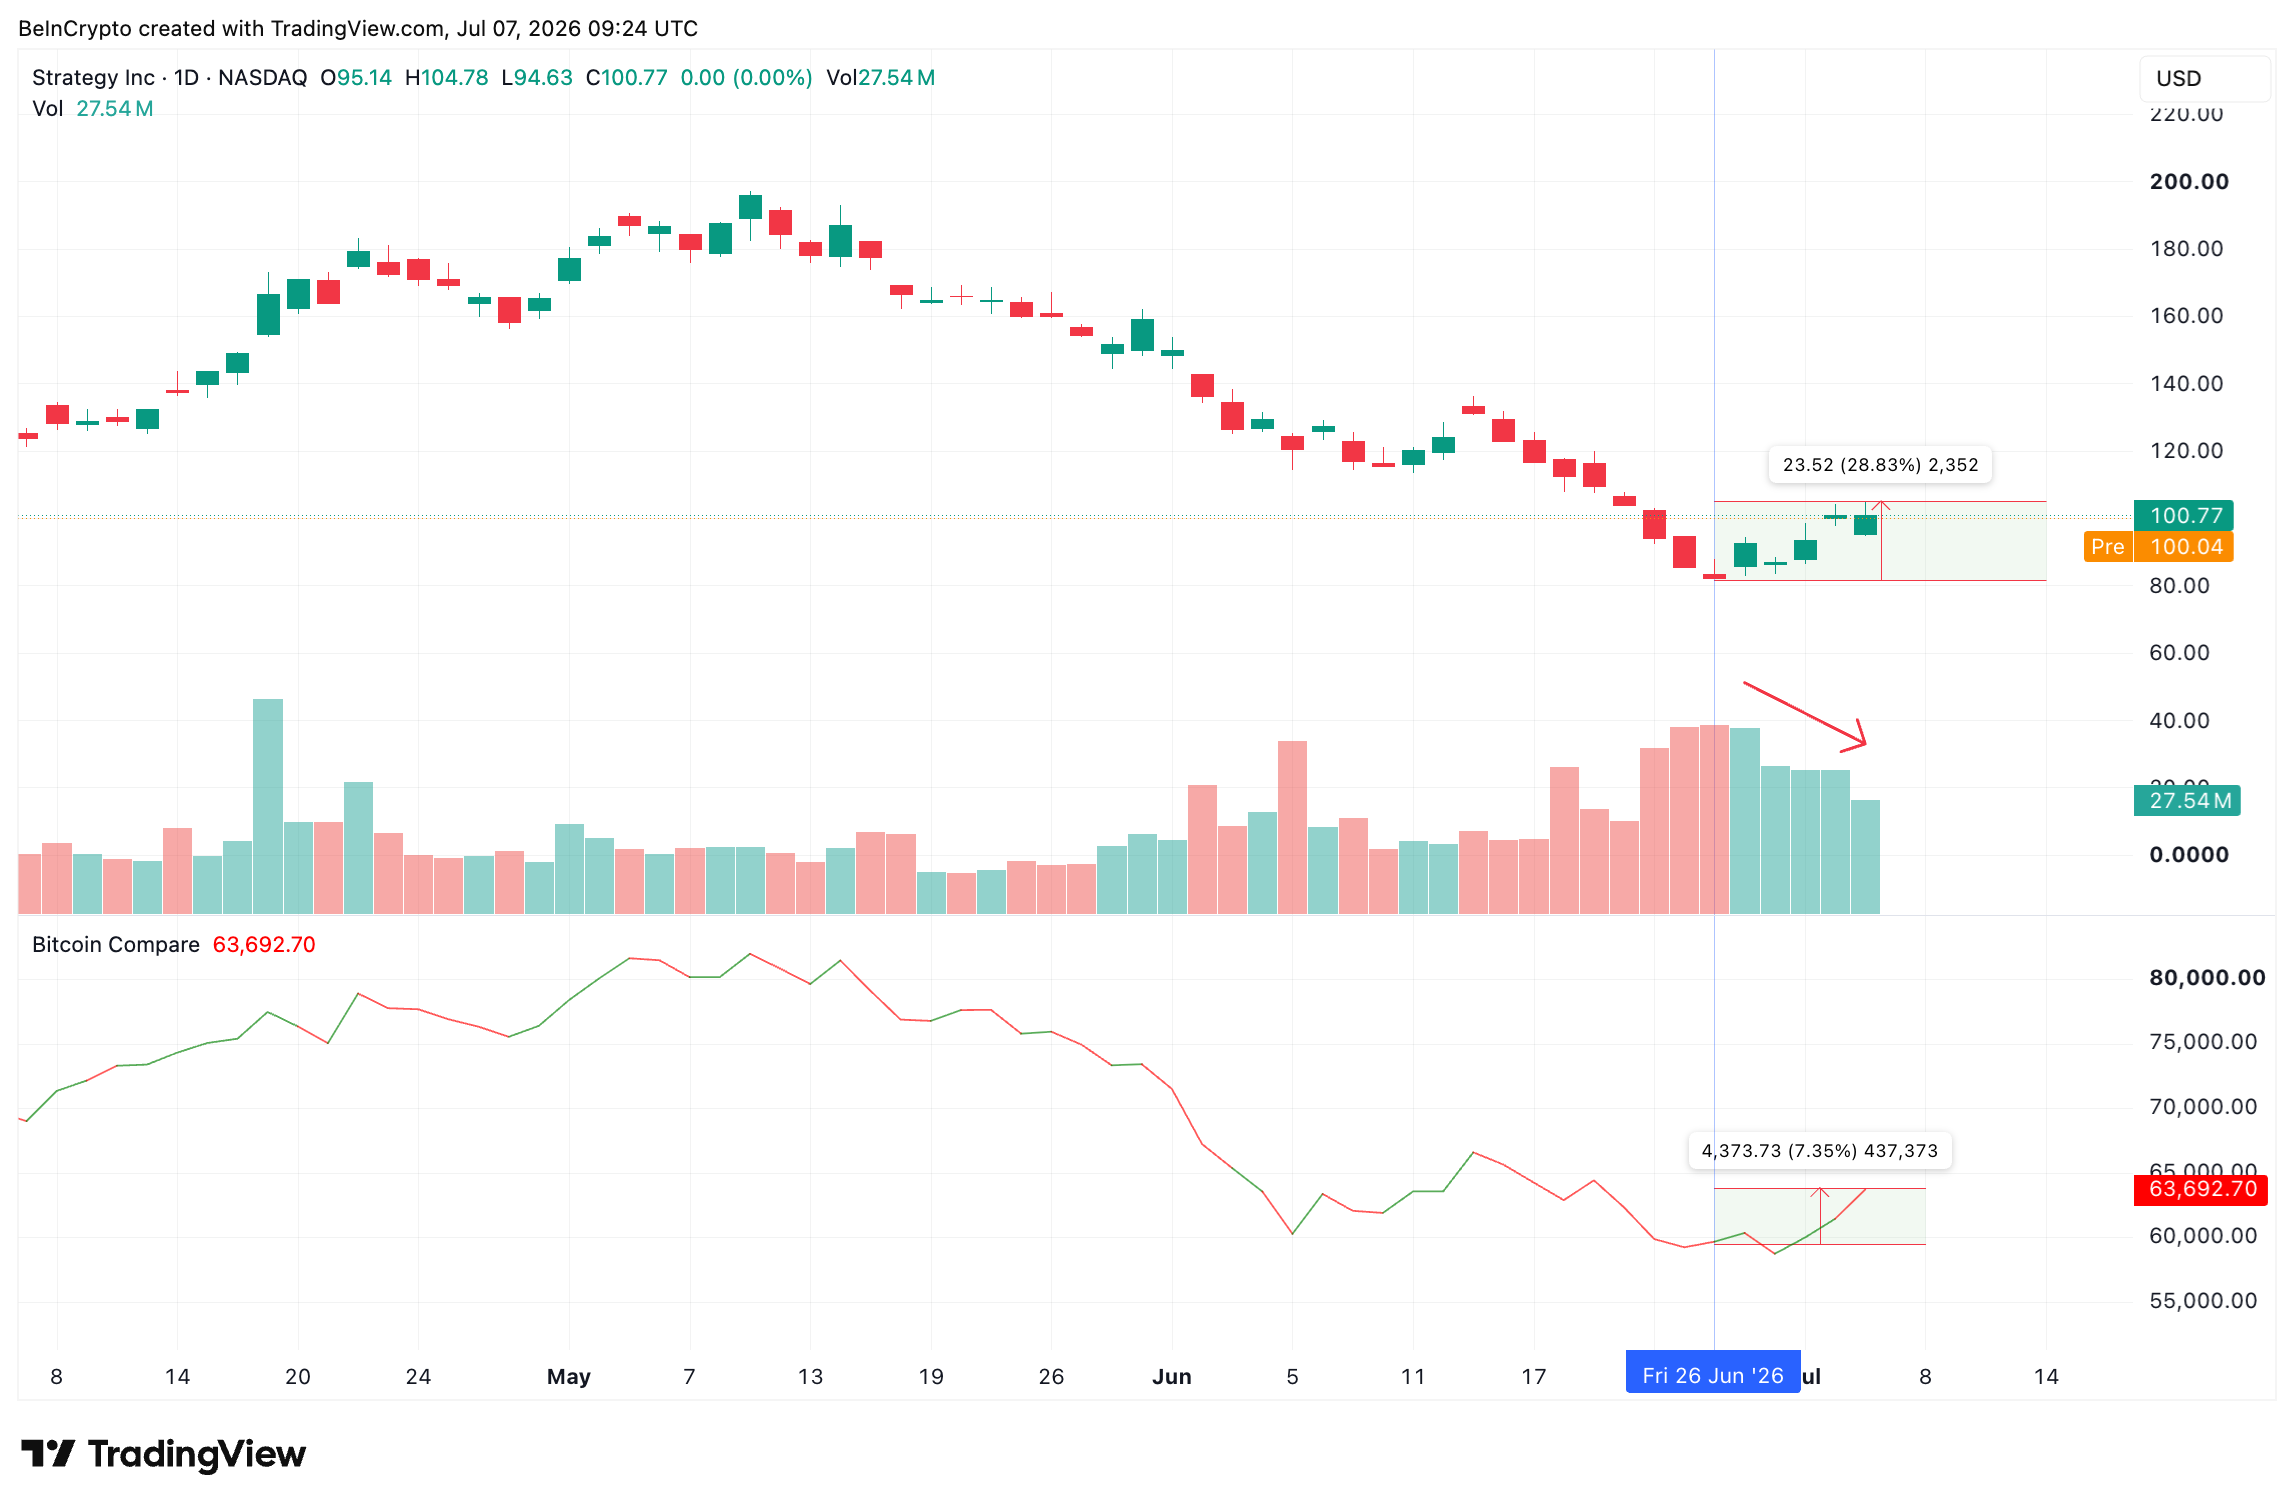
After sliding from about $197 in mid-May to roughly $82 by late June, MSTR has bounced about 29%. The stock even held firm after Strategy, the company formerly known as MicroStrategy, confirmed it sold roughly 3,588 Bitcoin, and it climbed alongside Bitcoin’s 7% rebound.
That bounce is about four times the size of Bitcoin’s, an early sign that MSTR now swings much harder than the coin it is supposed to track.
Want more insights like this? Sign up for Editor Harsh Notariya’s Daily Newsletter here.
However, the buying is thinning out. Trading volume has fallen steadily since June 29, a sign that fewer investors are chasing the move higher.

Step back, and the bounce looks small. Over the past year, the MSTR price has fallen about 75%, nearly double Bitcoin’s 41% drop, and its 30-day return correlation has slipped to about 0.30.

Note: It is a standard Pearson correlation of daily returns (not prices) over a rolling 30-day window; the industry-standard way to measure how two assets move together.
That decoupling matters. It shows investors no longer pay a premium for MSTR as a leveraged Bitcoin proxy, which is why the stock keeps falling faster than the coin it holds and why the rebound is hard to trust.
That raises the real question. Is big money buying this rebound, or quietly selling into it?
Money is Still Leaving, Even as Options Turn Bullish
The flow gauges answer it. Chaikin Money Flow (CMF), a proxy for institutional buying and selling pressure, sits near -0.23. It has climbed since late June, suggesting outflows are slowing, but it remains below zero, so large investors are still pulling money out.

Options traders, by contrast, have turned hopeful, possibly due to the 29% bounce. The put-call ratio, which weights bearish bets against bullish ones, has fallen from 1.30 in late June to 0.71, indicating traders are buying far more calls than puts.

That optimism could be a trap if volume and flows do not confirm it.

Wall Street is more cautious, too. Several analysts trimmed their price targets in early July, even while keeping buy ratings, as the shrinking Bitcoin premium reset expectations.

With money still leaving and sentiment stretched, the price chart now decides the next move.
MicroStrategy Stock Price Levels to Watch in July
MSTR is rising inside a channel that looks like a bear flag, a pattern that often forms after a steep drop and tends to break lower. It remains valid as long as the price stays within the channel.

On the upside, $104.27 is the first wall. It matches the 0.382 Fibonacci level, and it is exactly where the Bitcoin sale news stalled the rally. A clean break above it, and then $136.20, would weaken the bearish setup.
On the downside, $94.41 is the first floor. A drop below $84.55 would break the pattern, and the stock already fell to $81.58 in June. Below there, $70.51 and $52.62 come into view.

Here the decoupling cuts deeper. Because MSTR no longer moves in lockstep with Bitcoin, it does not need a Bitcoin drop to fall. Its own fading volume and steady outflows can pull it lower on their own.
For MicroStrategy stock, $104.27 separates a genuine trend change from another failed bounce inside the flag.
The post MicroStrategy Stock Price Outlook for July 2026: Will MSTR Recover? appeared first on BeInCrypto.
Crypto World
Synopsys (SNPS) Stock Dips as Firm Discontinues Manufacturing Software to Focus on AI Chip Tech

Key Takeaways
- Synopsys phases out manufacturing analytics software to concentrate on AI-driven chip design.
- End-of-life announced for legacy factory tools with continued maintenance support.
- Samsung confirms no disruption to operations amid software transition.
- Engineering resources reallocated to higher-profit AI design solutions.
- Major chip manufacturers increasingly develop proprietary internal software.
Shares of Synopsys, Inc. (SNPS) closed at $436.77, declining 1.24%, following a late-morning sell-off before recovering to stabilize around the $436 mark. The electronic design automation leader announced plans to discontinue certain semiconductor manufacturing software products as it pivots engineering talent toward lucrative AI-focused chip design technologies. This strategic repositioning underscores the company’s commitment to consolidating legacy offerings while fortifying its position in electronic design automation.
Company Phases Out Manufacturing Analytics Platforms
Synopsys informed over a dozen semiconductor manufacturers between April and May about its intention to sunset specific manufacturing analytics software solutions. The notifications were sent as part of a deliberate portfolio rationalization effort. Recipients included major industry players such as Samsung Electronics, SK Hynix, Kioxia Holdings, and Qorvo.
While new version releases will cease for the discontinued products, Synopsys committed to fulfilling all existing maintenance contracts and service agreements. This ensures customers retain technical support under their current arrangements, although no additional feature enhancements will be developed.
The retirement encompasses the Equipment Engineering System and Fault Detection and Classification solutions. These platforms have been instrumental in monitoring fabrication machinery and detecting potential defects early in the production cycle. For years, these tools have served as critical infrastructure within sophisticated chip manufacturing facilities worldwide.
Strategic Realignment Toward AI Design Technologies
Synopsys has strategically refocused its investments on premium AI-powered design technologies as industry demands evolve. The decision to scale back legacy manufacturing analytics reflects this calculated shift toward higher-margin opportunities. This realignment mirrors broader investment patterns throughout the semiconductor software sector.
The company officially announced it would phase out certain older manufacturing analytics solutions while amplifying its next-generation capabilities. Synopsys has not publicly disclosed which exact software products are affected by the retirement program. Additionally, the firm has not confirmed whether personnel reductions accompanied the restructuring.
Multiple industry insiders indicated that workforce adjustments involved the departure of several dozen employees during the reorganization. Negotiations with impacted customers regarding ongoing support obligations are anticipated to wrap up by the end of July. This transition enables Synopsys to redeploy technical teams toward high-priority software innovation initiatives.
Synopsys’ involvement in manufacturing analytics began with its 2021 acquisition of semiconductor manufacturing solutions from South Korean firm BISTel. Subsequently, the company significantly broadened its software capabilities through a $35 billion purchase of engineering software provider Ansys in 2025. These strategic acquisitions diversified the technology portfolio while supporting ambitious long-term expansion goals.
Semiconductor Manufacturers Build Proprietary Software Solutions
Industry observers provided varying assessments of the potential operational consequences stemming from the software discontinuation. Two sources suggested that reduced platform updates might gradually influence manufacturing efficiency metrics. Conversely, four additional sources anticipated minimal disruption for major chip producers.
Samsung acknowledged awareness of the planned software phase-out and confirmed ongoing dialogue with Synopsys concerning the transition timeline. The electronics giant also revealed it has already engineered equivalent internal systems for manufacturing processes. Samsung anticipates zero impact on production capacity throughout the software changeover period.
SK Hynix chose not to provide commentary on the software retirement announcement. Meanwhile, neither Kioxia Holdings nor Qorvo responded to inquiries. These varied reactions highlight the different preparedness levels among affected customers.
The increasing prevalence of in-house manufacturing software development also factored into Synopsys’ strategic calculus. Several chipmakers have demonstrated growing preference for custom-built proprietary tools rather than dependency on third-party software vendors. Additionally, manufacturers have shown reluctance to share confidential production metrics essential for refining commercial manufacturing platforms.
Synopsys maintains its position as a dominant provider of electronic design automation software for semiconductor innovation. The company recently unveiled technology engineered to automate substantial portions of chip design workflows through AI-enabled functionality. Consequently, this portfolio restructuring underscores the firm’s determination to advance cutting-edge chip design capabilities while deemphasizing mature manufacturing software products.



Mizuho has lowered its price target for Strategy while maintaining an outperform rating, signaling that it still expects MSTR shares to climb above the $200 level despite the company’s recent Bitcoin sale.
Summary
- Mizuho cut its MSTR price target to $213 but kept an outperform rating, still expecting shares to trade above $200.
- The revised target follows Strategy’s $216 million Bitcoin sale, which left the company holding 843,775 BTC and $2.55 billion in cash reserves.
- Grayscale Research and several market commentators said the sale could strengthen Strategy’s finances and improve its S&P 500 inclusion prospects.
Mizuho reduced its price target on Strategy to $213 from $265 after revising its Bitcoin price forecast to $71,500 by the end of 2027. Even with the lower target, the brokerage kept its outperform rating, indicating that it continues to see substantial upside for the Bitcoin treasury company’s stock.
The revised target follows Strategy’s decision to sell 3,588 Bitcoin for about $216 million, a transaction the company said would help fund dividend payments tied to its digital credit securities. After completing the sale, Strategy held 843,775 BTC alongside approximately $2.55 billion in U.S. dollar reserves.
Although the announcement initially weighed on market sentiment, MSTR recovered as Bitcoin rebounded above $63,000. The stock closed back above the psychological $100 level and traded around $101 in premarket trading, according to Yahoo Finance. Even so, MSTR remains down more than 34% since the start of the year as Bitcoin has struggled through the current bear market.
Analysts still expect substantial upside
Mizuho’s revised forecast comes as analysts continue to debate whether Strategy’s Bitcoin sale should be viewed as a sign of weakness or disciplined financial management. While the brokerage adjusted its long-term assumptions for Bitcoin prices, it did not change its positive stance on the stock.
Supporting that interpretation, Grayscale Research argued in a July 6 report that investors may have misread the transaction. As previously reported by crypto.news, the research firm said the sale strengthened Strategy’s financial position rather than signaling financial distress.
According to Grayscale Head of Research Zach Pandl, the company’s financing structure remains well supported despite concerns raised by some market participants. The report was published after Bitcoin briefly fell toward the $61,000 level following news of the sale before recovering above $63,000.
Grayscale also argued that improving Strategy’s balance sheet could reduce concerns surrounding its financing model while creating conditions for a more stable Bitcoin market over time.
Bitcoin sale fuels S&P 500 inclusion debate
Beyond the balance sheet impact, several market commentators believe the transaction could improve Strategy’s chances of joining the S&P 500.
Crypto researcher Ignas argued that the sale demonstrates Strategy’s ability to generate liquidity during periods of Bitcoin weakness, something he believes could satisfy concerns previously raised by S&P Global.
According to Ignas, inclusion in the index would require passive index funds to purchase MSTR shares, potentially creating additional demand for the stock. He also suggested Strategy could eventually repurchase the Bitcoin it sold if such inclusion materializes.
Crypto commentator Zayn reached a similar conclusion. He argued that Strategy has addressed several issues that critics previously highlighted by building a sizeable U.S. dollar reserve, repurchasing convertible debt, and using Bitcoin sales to meet dividend obligations instead of relying on additional borrowing.
According to Zayn, those steps weaken claims that the company’s financing model resembles a Ponzi scheme while demonstrating continued access to capital markets during a prolonged Bitcoin downturn.
Even after lowering its valuation target, Mizuho’s latest note indicates the firm believes those financial changes leave room for MSTR shares to recover well beyond current trading levels if Bitcoin’s long-term outlook improves.
TLDR:
- Ethereum price forecast remains focused on the $1,800 zone, where about 4.30 million ETH previously changed hands.
- ETH could target $1,980 and $2,079 if buyers reclaim the high-volume resistance area with stronger spot demand.
- Binance ETH reserves have increased since late June, raising concerns about more available supply on the exchange.
- Derivatives data has improved, but flat open interest shows the latest ETH rebound is not mainly leverage-driven.
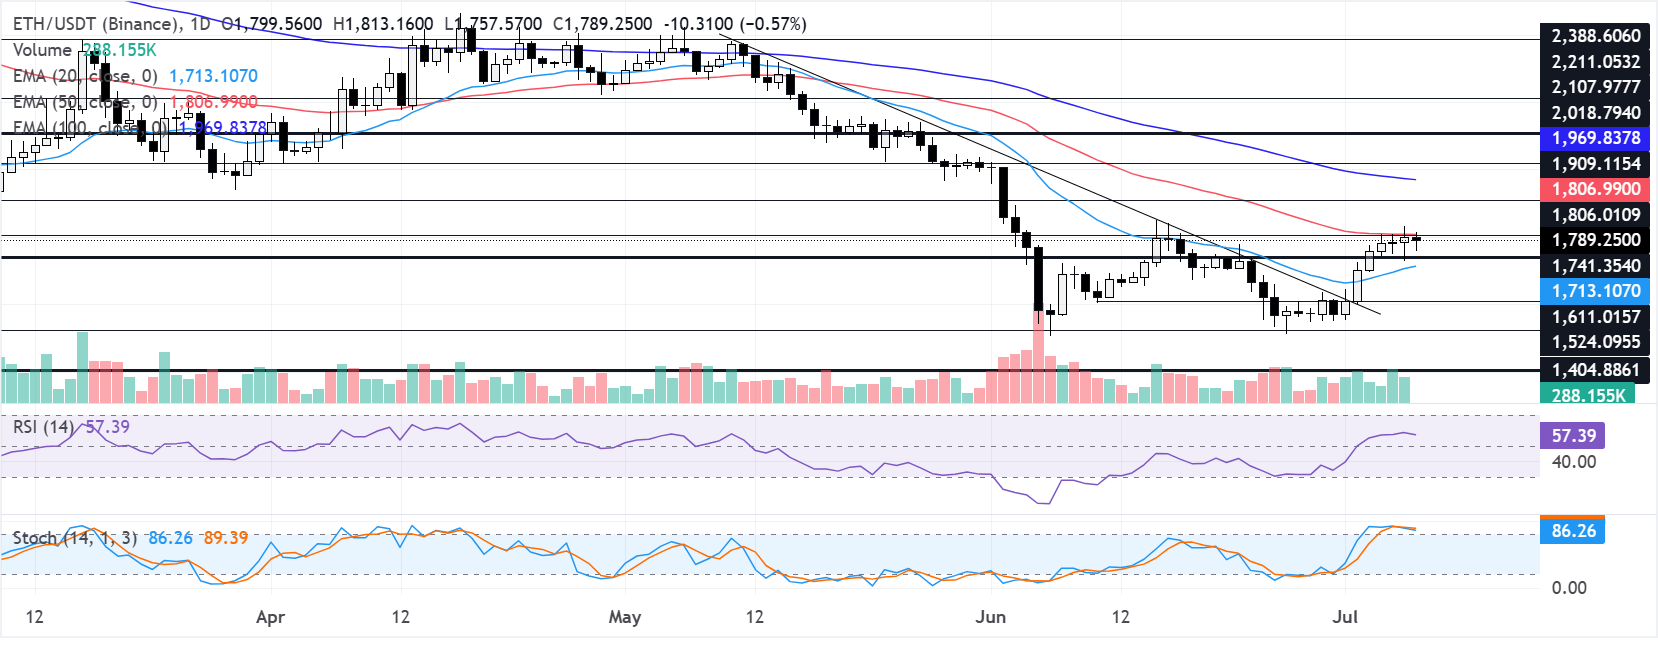
Ethereum price forecast remains locked around the $1,800 level as buyers attempt to reclaim a major resistance zone. ETH recently traded near $1,780 after a sharp rebound from late-June lows. The move has improved short-term sentiment, but the structure still lacks broad confirmation.
Roughly 4.30 million ETH changed hands near $1,800, based on the UTXO Realized Price Distribution data. That makes the level a major supply area. A clean reclaim could open a move toward $1,980 and $2,079. A rejection may expose thinner volume below, with the next support baseline near $1,237.
Ethereum Price Prediction Faces the $1,800 Supply Wall
Ethereum price prediction now depends on how ETH reacts near the $1,800 resistance band. The zone has become important as both volume profile data and moving averages align near the same area.
ETH also faces pressure from the 50-day exponential moving average near $1,806. The 100-day EMA sits higher near $1,970, close to the next major upside target. This keeps the recovery below the medium-term structure for now.
The daily chart shows a constructive but incomplete recovery. The RSI near 57 points to improving momentum, but it does not confirm a full bullish shift. The stochastic reading near 86 also shows that short-term upside could be stretched.
Immediate support sits near $1,741, followed by the 20-day EMA around $1,713. Deeper support levels stand near $1,524 and $1,405 if sellers regain control. A larger breakdown would bring the $1,156 area back into focus.
Ethereum price prediction would turn stronger if ETH closes above $1,806 with rising demand. The next upside levels would then sit around $1,909, $2,018, $2,108, and $2,211.
ETH Price Signals Show Demand Is Still Selective
Binance ETH reserves have increased from 3.64 million to 3.87 million since late June. That marks an increase of about 221,000 ETH, or 6.1%. Rising exchange reserves can point to higher potential sell-side liquidity.
The order-size data adds a cautious signal. ETH Average Order Size has moved into “Whale Left” territory, according to CryptoQuant analysis. That suggests larger participants are reducing their market footprint.
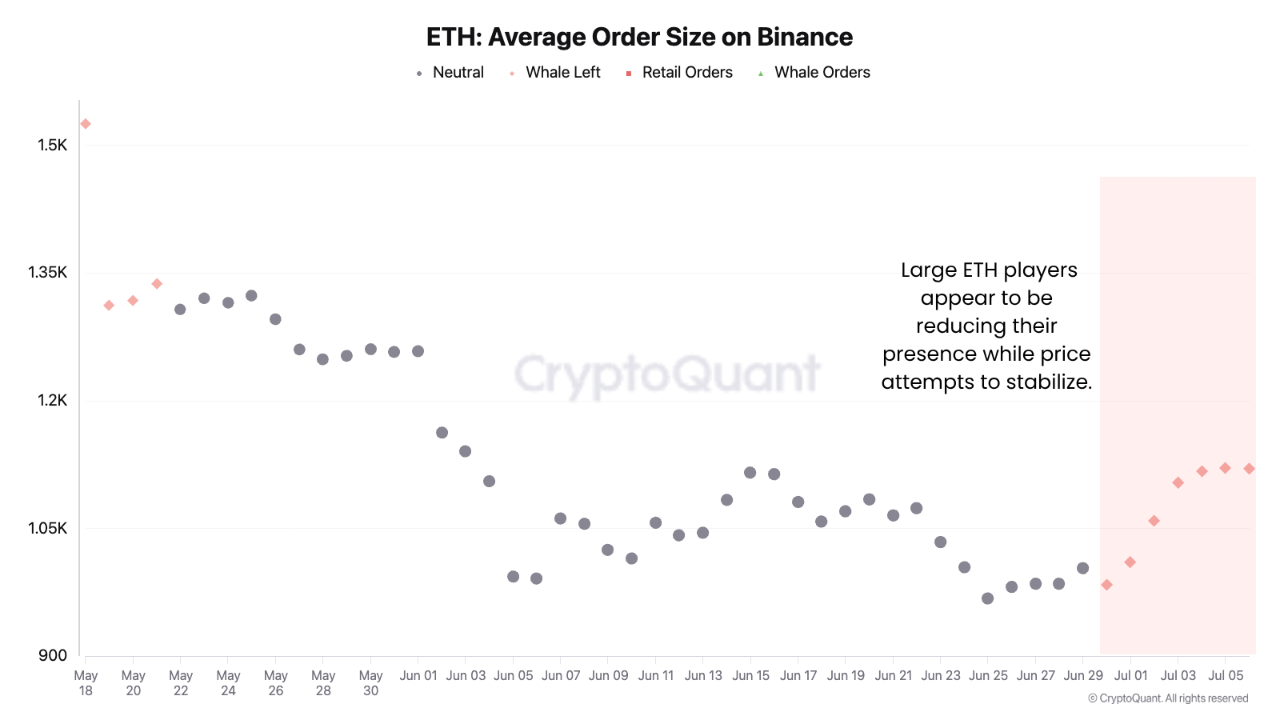
This creates a weaker setup beneath the recent rebound. More ETH is available on Binance, while whale-sized demand has not returned strongly. Ethereum Price Forecast therefore remains sensitive to any failed breakout near $1,800.
Derivatives data looks more positive, but it does not show excessive leverage. Ethereum has gained about 14% since Net Taker Volume turned positive on June 28. Positive Net Taker Volume signals stronger buying pressure in perpetual markets.
Open interest has stayed mostly flat across the rebound. The estimated leverage ratio has also failed to rise sharply after its June decline. That suggests the move is not driven by aggressive leveraged longs.
This lowers the risk of a major long squeeze, but it also shows caution among traders. ETH needs stronger spot demand and whale participation to confirm a healthier trend. Meanwhile, US spot ETH ETFs have recorded three straight days of net inflows, adding some support to sentiment.
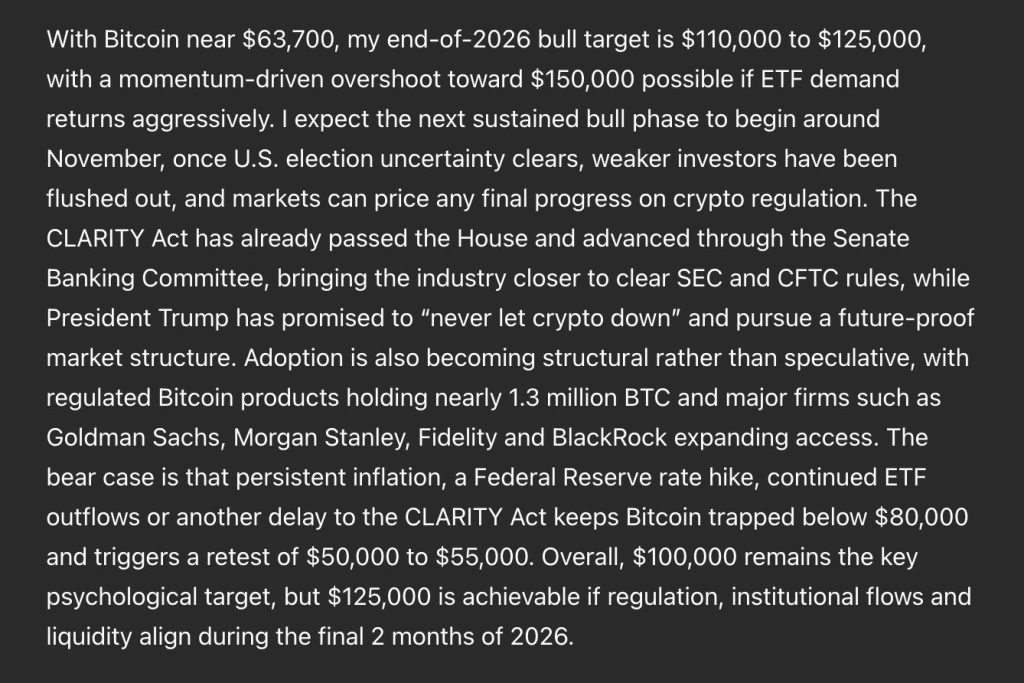
Sam Altman ChatGPT AI just circled November on the calendar and put a number next to Bitcoin Price Prediction. The model predicts $110,000 to $125,000 by the end of 2026, with a momentum overshoot toward $150,000 possible if ETF demand returns aggressively.
The bull case treats the next 4 months as a waiting period before a real ignition event. Bitcoin trades near $63,700 today, and the model frames November as the inflection point where several forces align simultaneously.
Election uncertainty clears, weaker investors get flushed out during the current soft patch, and markets can finally price in any final progress on crypto regulation.
The CLARITY Act has already passed the House and advanced through the Senate Banking Committee, putting clear SEC and CFTC rules within realistic striking distance.

President Trump has publicly pledged to never let crypto down and pursue a future-proof market structure, which the model treats as meaningful political cover for institutional allocators sitting on the sidelines. The adoption story has also shifted from speculative to structural in a way that is hard to dismiss.
Regulated Bitcoin products now hold nearly 1.3 million BTC, and major firms including Goldman Sachs, Morgan Stanley, Fidelity, and BlackRock continue to expand access for their clients.
That combination of legislative progress, political backing, and structural institutional ownership gives the bull case far more durable support than a typical market cycle rally.
If regulation, institutional flows, and liquidity all align during the final two months of the year, the model sees $125,000 as achievable, with $100,000 as the key psychological milestone along the way.
The bear case points directly at macro risks that could derail the entire timeline. Persistent inflation triggering a Federal Reserve rate hike would be the most damaging single event, since tighter monetary policy tends to drain risk assets faster than any crypto specific catalyst can offset.

Continued ETF outflows or another delay to the CLARITY Act could also keep Bitcoin trapped below $80,000 and trigger a retest of $50,000 to $55,000 instead of breaking higher.
Bitcoin Price Prediction: BTC Climbs Off Its Lowest Close In Months With November In Its Sights
The daily chart shows Bitcoin at $64,312 after grinding through one of the weakest stretches in this cycle, reaching a low near $58,000 in late June before the current recovery began.
That bounce over the past week has been steady rather than explosive, with a series of small to medium green candles pushing price back above $64,000 for the first time since late May.
The character of this recovery looks more like patient accumulation than a momentum-driven short squeeze, which actually fits the narrative in this prediction quite well, given the model expects the real fireworks to wait until November.
Resistance sits first near $68,000, a level price cleared briefly in late May before rolling over, with a much heavier ceiling near $76,000 where the most extended rally attempt of 2026 ultimately ran out of buyers.
Above that, the $80,000 level sits as the bear case ceiling named directly in this prediction, making it the clearest dividing line on the chart.
Support holds near $59,000 to $60,000, the zone that has been tested multiple times over the past several weeks and held each time.
The broader structure still shows lower highs stretching back to October, though the recent lows near $58,000 represent a higher low relative to the February bottom near $62,000, which is the first faint hint of a potential base forming.
Momentum on the daily candles looks like it is recovering rather than turning, with buying pressure showing up more consistently than at any point in the past month. If Bitcoin can push through $68,000 and hold it heading into August, the November thesis ChatGPT is describing starts to look like it has the technical runway it needs to actually play out.
Don’t Miss Out on Our $1,000 USDT Airdrop on ByBit
You Might Like What ChatGPT AI Predicts About LiquidChain
The rotation is already underway. Most people will recognize it after it has already happened.
Meta AI predicts that large caps are not broken. They are capped. Bitcoin, Ethereum, and XRP have been pressing against the same bands for weeks with nothing breaking through. The macro tailwinds keep getting rescheduled. The institutional inflows keep getting pushed back another quarter. Waiting on catalysts outside your control is not positioning. It is just waiting.
A capital that has navigated enough cycles does not sit at resistance. It moves before the destination has a name.
Early-stage infrastructure operates on different math. A small enough market cap means a modest rotation produces dramatic movement. The returns come from the gap between what something is genuinely worth and what the market has priced it at. That gap only exists while the project stays undiscovered.
Multi-chain fragmentation bleeds DeFi every single day. Bitcoin, Ethereum, and Solana run completely isolated systems with no native way to connect them. Every user crossing those boundaries pays in fees, slippage, and failed transactions. Every single time.
LiquidChain collapses all 3 into a single execution layer. One deployment. Full ecosystem access. No cross-chain tax anywhere.
The market has not found this yet. That is the entire point.
The presale is at $0.01454 with just over $890,000 raised. Ground floor is a description, not a pitch.
Execution is unproven. Adoption is unknown. Established assets offer a smoother ride toward a ceiling that is already visible. LiquidChain is an earlier seat at a table that has not been set yet.
Explore the LiquidChain Presale
The post Sam Altman ChatGPT AI Predicts Insane Bitcoin Price by 2026 appeared first on Cryptonews.

Ninja’s Double Stack air fryer just got a tasty 26% price cut

THIS BITCOIN PATTERN NEVER LIES !!!!

How safe is your dip in the Med? The European holiday hotspots where toxic pufferfish have been spotted amid growing alarm over spread of toe-chomping creatures


-

 Fashion4 days ago
Weekend Open Thread: High Hopes
-
 NewsBeat3 days ago
Taylor Swift and Travis Kelce wedding staffer hilariously struggles to keep her cool while checking in megastars
-

 Fashion1 day ago
Open Thread: What Great Books Have You Read Recently?
-

 Politics4 days ago
The House | “Reframing the debate from a binary discussion of winners and losers”: Yuan Yang reviews ‘We Are Not Machines’
-
 Crypto World6 days ago
Airdrop Registration Becomes Key Focus For Remittix As RTX Launch Updates Approach
-
 Crypto World4 days ago
Standard Chartered Secures MiCA License as ESMA Adds 37 New Crypto Firms
-

 Business1 day ago
AXT Shares Jump Nearly 14% as Semiconductor Materials Maker Rebounds on AI-Linked Indium Phosphide Demand
-

 Sports6 days ago
Broncos roster: OL Ben Powers (No. 74) entering final year of contract
-

 Crypto World6 days ago
Binance stock trading tops $1B in first month after launch
-

 Crypto World6 days ago
Alibaba-affiliate Ant Group enters the humanoid robot market with 12 deals
-
Crypto World1 day ago
SK hynix (000660.KS) Stock Dips as $28B Nasdaq ADR Offering Drives AI Memory Expansion
-

 Crypto World2 days ago
South Africa proposes crypto tax guidance under existing rules
-

 News Videos1 day ago
Best Time to Enter Small Caps Right Now? Another Bull Run? | Financially Free
-
 Tech3 days ago
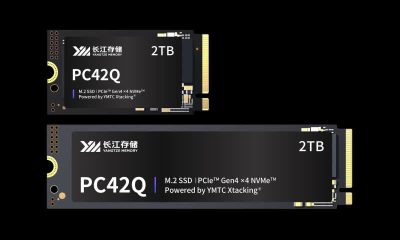
Lenovo laptops are now shipping with YMTC SSDs, a sign of Chinese NAND entering the mainstream
-

 News Videos20 hours ago
Whats Hidden Inside This Cash Register? #treasure #reselling #money
-
 NewsBeat6 days ago
New exhibition reflects five decades of movement between island of Ireland and GB
-

 Business6 days ago
Meta Platforms Stock Jumps 7% Today as Bloomberg Reports Company Plans to Enter the Cloud Business
-

 Business5 days ago
What a 10 Percent Drop Means for Buyers, Sellers and Renters
-

 Crypto World5 days ago
Binance Re-Enters Philippines As EU MiCA Rules Restrict Access
-

 News Videos1 day ago
Avoid entering in FOMO #bitcoin #cryptocurrency #trading #scalping
You must be logged in to post a comment Login