

Crypto World
Hyperliquid price forecast: HYPE faces critical test as Bitcoin holds the key



- Hyperliquid price holds above key support as traders watch the $61.92 level.
- Bitcoin’s move around $63,000 could shape HYPE’s next direction.
- Hyperliquid’s total open interest has climbed to nearly $11 billion.
Hyperliquid (HYPE) has entered a crucial phase after retreating from its recent record high, with traders closely watching whether the token can stabilise above key support levels.
The latest pullback comes as broader cryptocurrency markets react to rising geopolitical tensions, leaving Bitcoin’s next move at the centre of attention.
However, while HYPE has lost momentum over the past week, the network continues to post strong trading activity, creating an interesting contrast between short-term price action and underlying platform growth.
Hyperliquid price tests support after weekly decline
HYPE is trading around $65, down 7.0% over the past seven days after reaching an all-time high of $76.87 on June 16.
The correction has pushed the token toward an important support area between $64 and $65, where buyers have started defending prices.
The next few trading sessions could prove decisive.
If the Hyperliquid price manages to reclaim $67 with stronger buying volume, the token could make another attempt at the $70 level.
However, a failure to hold the current support zone would shift attention to $61.92, which has emerged as the next major technical floor.
A break below $61.92 could expose the token to additional downside, with $60 becoming the next area traders are likely to monitor.
Bitcoin remains one of the biggest external factors influencing that outlook.
The broader market has been under pressure following renewed geopolitical uncertainty, and Bitcoin’s ability to remain above $63,000 is viewed as an important signal for risk assets across the cryptocurrency market.
If Bitcoin maintains above $63,000, it could provide enough stability for HYPE to consolidate. A move below it, on the other hand, could trigger another wave of selling across altcoins.
Technical indicators point to mixed short-term momentum
The latest technical indicators suggest that HYPE has not yet established a clear directional trend despite the recent correction.
The Relative Strength Index (RSI) currently stands at 47.99, placing it in neutral territory.
This indicates that the token is neither overbought nor oversold, leaving room for either buyers or sellers to take control depending on broader market conditions.

Exponential moving averages paint a more constructive picture over a longer timeframe.
HYPE continues to trade above its 50-day, 100-day and 200-day exponential moving averages (EMAs), signalling that the broader uptrend remains intact despite the recent decline.
At the same time, the token has dropped below its 10-day and 20-day EMAs, showing that short-term resistance remains in place before momentum can fully recover.
This combination of indicators suggests that while the long-term forecast remains positive, the near-term direction will depend on whether buyers can regain control around current price levels.
Hyperliquid platform activity continues to expand
Although HYPE has pulled back from its recent highs, activity on the Hyperliquid ecosystem continues to grow.
The protocol’s total value locked (TVL) stands at approximately $6.013 billion, reflecting continued capital committed to the platform.
At the same time, 24-hour trading volume remains close to $296 million, highlighting sustained market participation despite recent volatility.
Another notable development is the rapid growth in derivatives activity. Total open interest has climbed to roughly $11 billion, while real-world asset (RWA) perpetual contracts account for approximately $3.6 billion of that figure.
Real-world asset (RWA) open interest on Hyperliquid reached a new ATH of $3.6B
Total OI reached a new high for 2026 of $11B pic.twitter.com/FJyeuUq0ya
— Hyperliquid (@HyperliquidX) July 13, 2026
The increase shows that traders are expanding beyond crypto-native products into tokenised exposure linked to traditional financial assets.
The growth in RWA trading has become one of the defining trends for Hyperliquid during 2026, helping the platform attract additional trading activity even as digital asset prices experience short-term swings.
Key HYPE price levels to watch
The coming days are likely to be shaped by both technical price levels and broader market sentiment.
The first area to watch remains $64-$65, where buyers have so far attempted to defend support. If that zone holds and HYPE reclaims $67 on stronger volume, attention could quickly shift back toward $70.
On the downside, $61.92 has become the most important technical support. A sustained move below that level would increase the probability of a deeper correction toward $60, particularly if Bitcoin also loses support at $63,000.
For now, the Hyperliquid price finds itself at a pivotal point.
Short-term momentum has weakened following a 7% weekly decline, yet the broader technical structure remains constructive, while platform activity continues to reach new milestones.
Whether the token resumes its broader uptrend or extends its correction is likely to depend on Bitcoin’s next move and how traders respond around these key technical levels.

Strategy, the largest corporate holder of Bitcoin, raised fresh capital by selling MSTR shares through its at-the-market (ATM) offering last week while leaving its BTC treasury unchanged.
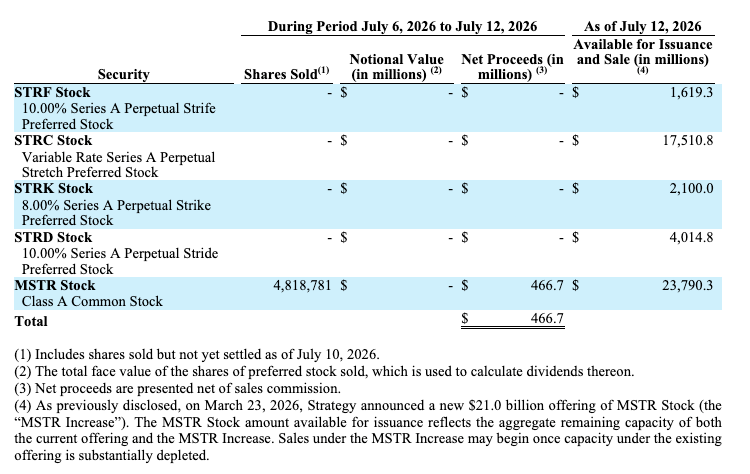
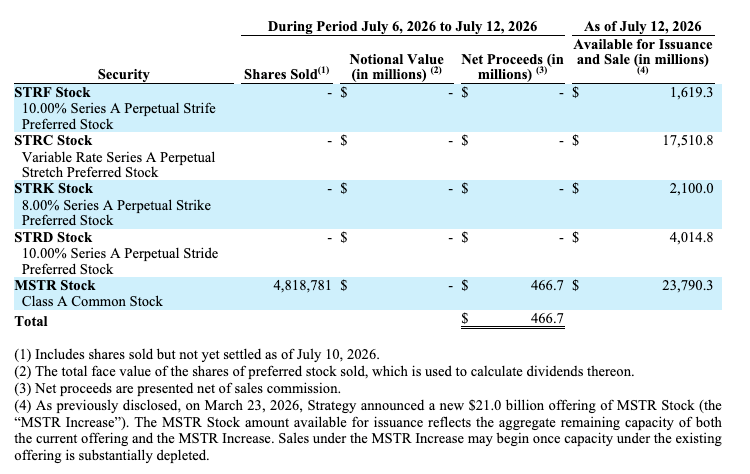
Strategy sold 4.8 million shares of its Class A common stock for $466.7 million between July 6 and July 12, according to a Monday 8-K filing with the US Securities and Exchange Commission.
The company did not buy or sell any Bitcoin during the period and reported holdings of 843,775 BTC at an average purchase price of $75,476 per BTC.
The update comes as investors continue to watch how Strategy balances equity issuance, Bitcoin accumulation and its growing preferred stock offerings as it expands its BTC-focused corporate strategy.
Ahead of Monday’s Nasdaq open, MSTR shares were trading down roughly 3%, to $91.80 apiece, according to Yahoo Finance. Bitcoin was trading at about $62,580, down more than 2% in the past 24 hours.
Cash buffer grows to $3 billion
Strategy increased its US dollar reserve to $3 billion as of July 12, up from $2.55 billion a week earlier. The reserve is used to fund dividend payments on its preferred stock and interest payments on its outstanding debt.
The reserve includes expected proceeds from MSTR shares sold through the company’s ATM offering that had not yet settled as of the reporting date.
Source: SEC
Strategy has $23.8 billion of remaining capacity under its MSTR ATM offering, including capacity from a new $21 billion offering the company announced on March 23. The company said it may begin selling shares under the additional capacity once the existing offering is substantially depleted.
Last week, Strategy announced it sold 3,588 BTC for about $216 million to replenish its US dollar reserve and fund preferred stock dividend payments.
Related: Lyn Alden says Bitcoin needs no savior as Strategy sells $216M of BTC
The transactions included the sale of 1,363 BTC at an average price of $59,256 between June 29 and June 30, followed by another 2,225 BTC at an average price of $60,773 between July 1 and July 5.
In the same June 29 8-K filing, Strategy also reported no BTC purchases, while disclosing the sale of 12.7 million MSTR shares through its ATM offering, generating $1.15 billion in net proceeds.
STRC moves to twice-monthly dividend schedule
Strategy is boosting its USD reserve as it readies its first semi-monthly dividend payment to its STRC preferred stock holders on Wednesday.
Under a new schedule announced on June 8, STRC will use record dates on the 15th and the last day of each month, with payments made on the following record date.
The first semi-monthly record date was June 30, 2026, with the first payment date scheduled for July 15.
Magazine: Bitcoin nearing late stages of bear market: Jamie Coutts, Real Vision

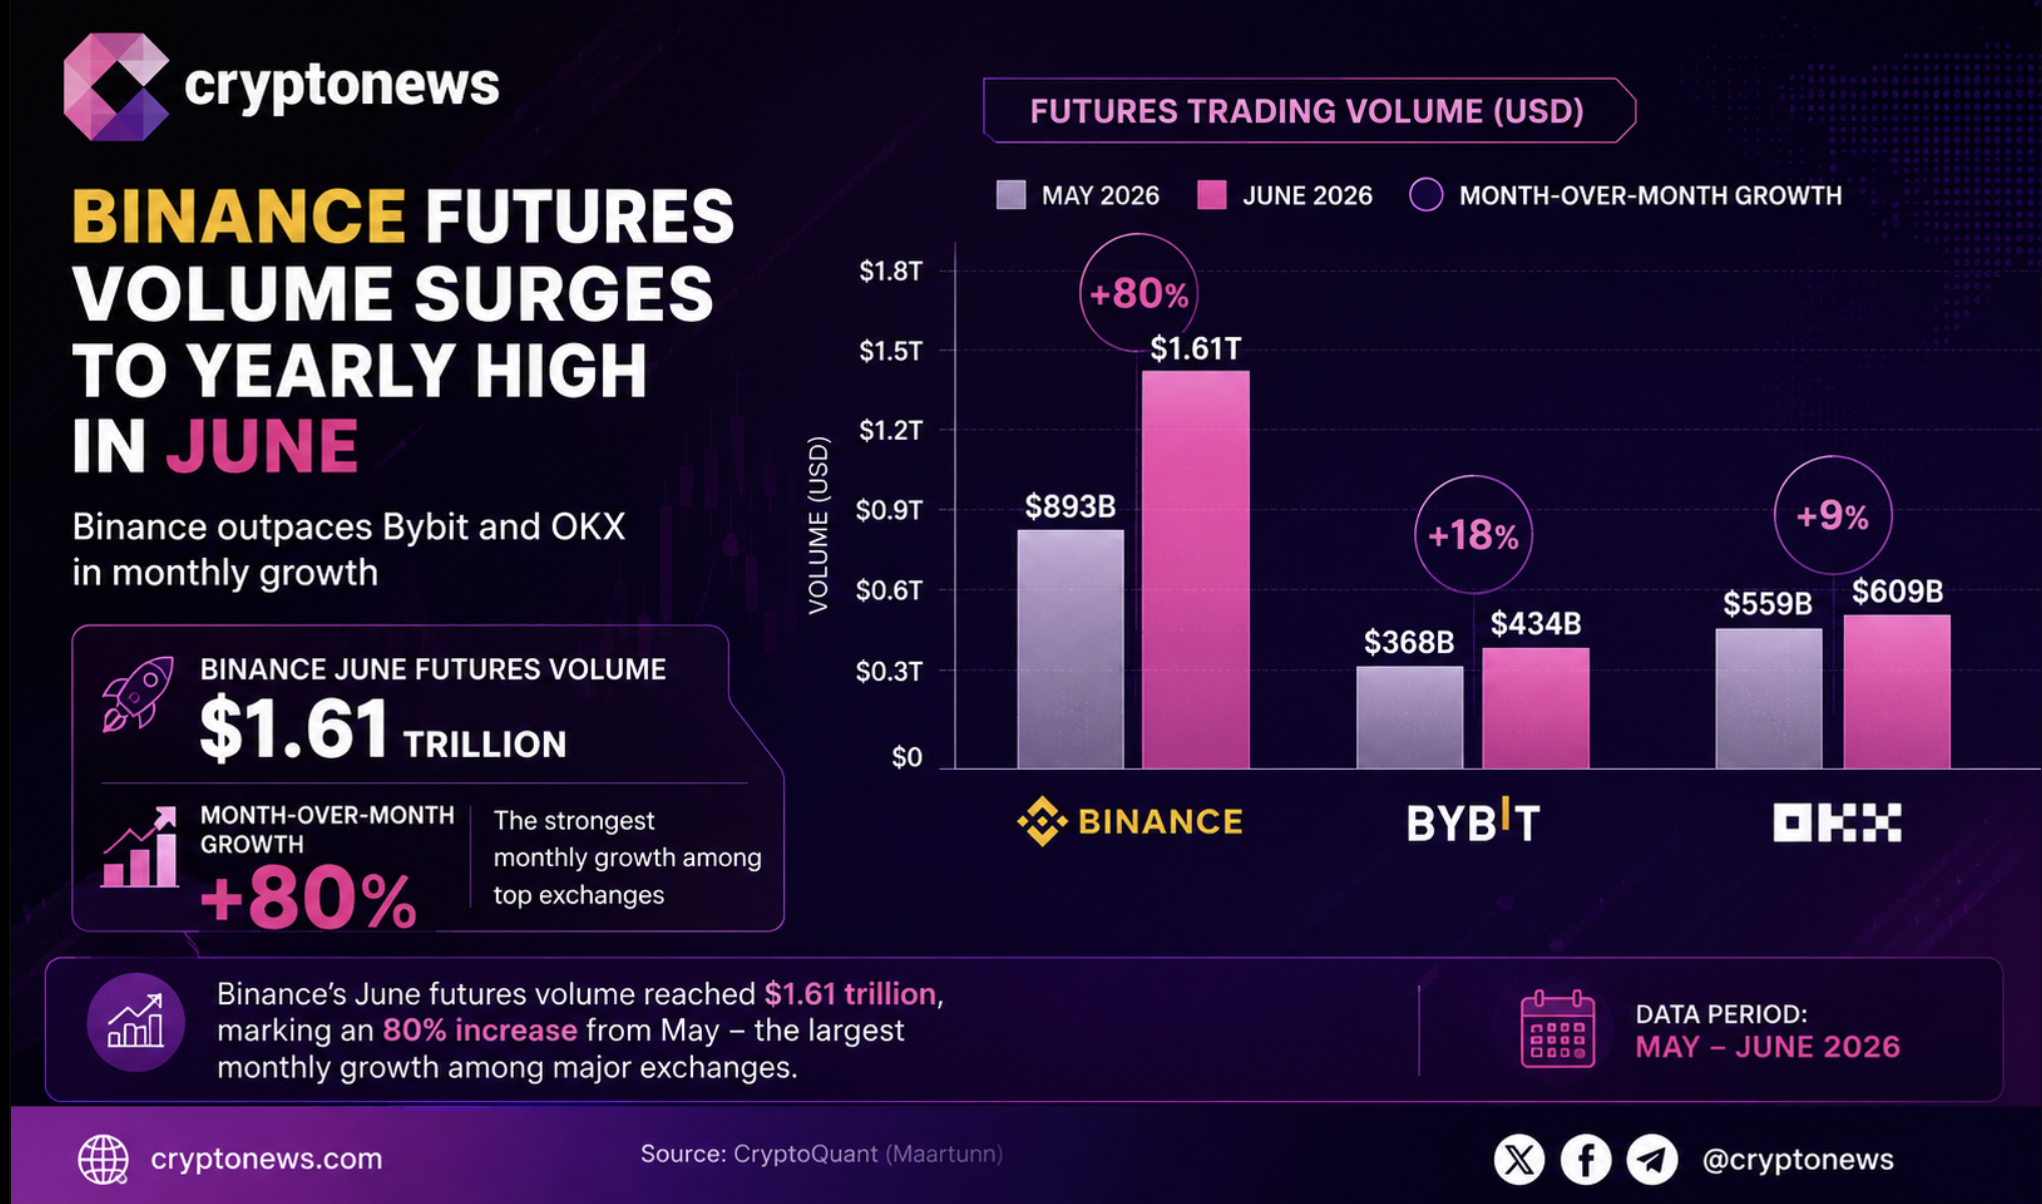
Binance reportedly saw a significant increase in futures trading volume last month, with figures suggesting an 80% jump from May’s volume and marking a high point for the year. This increase occurred while crypto spot markets were running at their weakest pace in two years.
CryptoQuant analyst commentary noted the surge arrives while Bitcoin’s price remains relatively stable, and a significant share of the market views conditions as bearish. The sharp monthly jump in futures volume compared to a stagnant spot market indicates a deliberate shift in trader positioning.

Don’t Miss Out on Our $1,000 USDT Airdrop on ByBit
Binance Futures Pulls Away From OKX and Bybit
The June futures figures positioned Binance ahead of its closest derivatives competitors. OKX and Bybit both reported increases in futures volume from May to June, but neither matched Binance’s growth or scale. Binance’s futures volume notably exceeded those of OKX and Bybit, according to data.
The last time these exchanges approached similar volume levels was in early 2026. June marked a return to, and in Binance’s case a surpassing of, that benchmark. However, the centralized exchange (CEX) futures market remained under pressure across the full second quarter.
Binance’s June futures volume increase came against a deteriorating quarterly backdrop. Total CEX futures volume across the market declined in Q2 2026 compared to Q1, marking a continued downtrend. The pace of decline slowed relative to earlier quarters, but the downward direction persisted
Spot markets faced deeper challenges. CEX spot volume dropped to a two-year low in Q2, with Binance remaining the largest spot venue but experiencing a slight decrease in market share. Binance maintained a steady share of the futures market for the quarter.
The gap between futures and spot markets underscores a structural shift in trading behavior. Derivatives-driven price action has characterized much of the 2026 market, with leverage washouts, basis trades, and hedging activity running hot while directional spot buying stalls. The June Binance data fits and amplifies this pattern.
What remains unclear is whether the futures surge reflects genuine directional conviction or primarily hedging and arbitrage flows-strategies that generate volume without necessarily indicating bullish or bearish bets. This distinction is crucial for interpreting the implications of the volume spike.
Discover: The Best Crypto to Diversify Your Portfolio
MiCA Transition: Early July Data Suggests No Disruption
Binance’s futures volume surge occurred just before Europe’s Markets in Crypto-Assets (MiCA) regulatory framework entered a new enforcement phase on July 1. Binance withdrew its application for a Greek license in late June, raising questions about European market access and potential impacts on derivatives volumes.
Early data from July suggests the regulatory transition has not materially disrupted Binance’s futures activity. Binance recorded substantial futures volume in the first 10 days of July, indicating continued trading momentum. However, the limited data period means future regulatory actions could still affect volumes.
The MiCA transition is significant as Europe is considered an important market for derivatives volumes on major centralized exchanges. Market patterns in July will clarify the extent to which June’s volume reflected front-running of regulatory deadlines versus durable shifts in demand.
In summary, Binance’s June volume increase is a notable data point signaling concentration of trading activity in derivatives on dominant venues amidst weaker spot volumes. Whether this concentration persists into the third quarter and how MiCA affects European-sourced volume will become clearer with forthcoming data.
Discover: The Best Token Presales
The post Binance Futures Surge 80% in June as Spot Markets Hit Two-Year Low appeared first on Cryptonews.


The report also noted a problem with permissionless chains: a confirmed transaction can, in theory, be reversed by a chain reorganization. That introduces a settlement-finality risk that traditional infrastructures do not encounter.
Nevertheless, the report said, established firms in traditional finance and crypto-native companies are converging.
As one example, it cited Ripple’s $1.25 billion purchase of prime broker Hidden Road. Hidden Road, now Ripple Prime, is listed among firms holding both an investment-firm license and cryptoasset registration covering spot and derivatives across forex and digital asset markets from the Financial Conduct Authority.
Santander U.K.’s use of Ripple’s blockchain for cross-border payments was named as a white-labeling example. The bank fronts the customer relationship while Ripple’s technology moves the money.
Woolard puts the U.S. and U.K. markets on similar timelines for stablecoin regulation, with both targeting full regimes in 2027. For wholesale policy, the U.K. is ahead of the U.S., where the Clarity Act remains stuck.
While the FCA is already authorizing crypto companies under money-laundering regulations, the regulator’s new regime under the Financial Services and Markets Act (FSMA) kicks in next year.
Applications under FSMA open on Sept. 30, ahead of an October 2027 launch date.
The report concedes that the industry still sees U.K. authorization as slower than the U.S., where the SEC’s December 2025 no-action letter handed the Depository Trust Company a three-year tokenization pilot that lets firms launch live rather than build for a test environment.


Bitcoin is trading around 62,700 dollars, and Jurrien Timmer, Fidelity’s director of global macro, is watching it drift toward a line he has tracked for more than a decade.
Summary
- Bitcoin is trading near Fidelity’s power law support zone, with the model’s lower boundary around 58,000 dollars.
- Jurrien Timmer views the area as an accumulation zone but is not calling a bottom without a clear catalyst.
- The power law support has aligned closely with major Bitcoin lows in 2015, 2018, and 2022.
- Bitcoin’s deviation from trend and its underperformance against gold now resemble prior cycle-bottom conditions.
- The main missing ingredient is liquidity, which has historically determined when accumulation zones turn into recoveries.
On his power law model, a logarithmic chart that bounds Bitcoin’s entire price history between an upper resistance curve, a middle trendline, and a lower support curve, the floor currently sits near 58,000 dollars. That lower line has caught every major Bitcoin bottom since 2015. Timmer’s label for the zone the market has now entered is unambiguous: accumulation. His caveat is just as unambiguous: he sees no catalyst for a reversal, and he is not calling a bottom.
That combination, a historically reliable floor approaching and a strategist refusing to ring the bell, is the most honest summary of the Bitcoin market in July 2026. The asset is coming off its worst quarter since the 2022 bear market, spot ETFs just recorded their largest quarterly outflow since launch, the speculative premium that carried the price past 120,000 dollars last year has evaporated, and the fast money has visibly rotated elsewhere, first into gold, then into semiconductor stocks. And yet the two quantitative measures Timmer trusts most, the deviation from the power law trendline and the Bitcoin-to-gold ratio, have both sunk to depths recorded at exactly two prior moments: the 2018 low and the 2022 low. Both of those moments were generational buying opportunities. Both also felt like the end of the world at the time.
This feature takes the model seriously in both directions: what the power law actually says, why its track record earns attention, and why the missing-catalyst objection is not a hedge but the core of the analysis.
What the power law model actually is
The power law framework treats Bitcoin’s price growth as a function that decays over time. Early in the asset’s life, prices could multiply a hundredfold in a cycle; as the network matures and the base grows, each cycle’s percentage gains shrink, and the whole price history, plotted on log-log axes, settles into a corridor that rises steadily but ever more slowly. Timmer’s version of the chart draws three curves through that corridor. The upper line marks the euphoria boundary, where prior cycles topped. The middle trendline marks something like fair value under the model. The lower line marks the floor where sellers have historically exhausted themselves.
The track record of that lower line is the reason the chart circulates every time the market bleeds. In the 2014 to 2015 bear market, the model’s support calculation stood near 252 dollars and the actual bottom printed at roughly 230. In 2018, the support line sat near 2,521 dollars against a low of 3,204. In the 2022 winter, the line read about 15,006 dollars and the market bottomed at 16,366. Three cycles, three bottoms, all landing within shouting distance of a curve drawn from math, not sentiment. In the current fit, that curve passes near 58,000 dollars, with some of Timmer’s postings citing figures around 58,237, and Bitcoin at 62,700 is trading roughly 8 percent above it.
Two companion indicators complete the picture, and both are flashing the same reading. The first tracks how far the price trades above or below the middle trendline. That deviation has swung to negative 56 percent, a depth the chart explicitly labels the accumulation zone and one that aligned with the 2018 and 2022 lows. The second is the 52-week z-score of the Bitcoin-to-gold ratio, which has collapsed to around negative 100 percent, meaning Bitcoin has underperformed gold over the trailing year to a degree seen only at prior points of maximal exhaustion. Historically, readings between negative 100 and negative 120 on that gauge, recorded in late 2014, 2018, and 2022, marked the moments when relative weakness against gold had run its course.
One underappreciated property of the setup: the price does not need to fall for the test to happen. The support curve rises over time, so a market that simply goes sideways will meet the floor from above. Stagnation and decline arrive at the same destination, which is partly why Timmer frames the coming months as a period of drift along support, not a decision point with a date.
The case for the accumulation zone
The bull argument starts with base rates. A signal that has fired three times in eleven years and preceded a major recovery all three times deserves weight, especially when two independent gauges, trendline deviation and the gold ratio, corroborate each other. Markets rarely hand out cleaner historical analogies than negative 56 percent deviation, a level with exactly two precedents, both of them cycle lows.
The structural context has also improved in ways the 2018 and 2022 comparisons undersell. In those winters, Bitcoin had no spot ETF complex, no corporate treasury cohort, and no legislative framework in motion. Today the ETFs exist and, after a June that ranked as their worst month on record, just snapped a ten-day outflow streak with a 221.7 million dollar single-day inflow, their largest daily haul in two months. The corporate treasury era is wobbling but not gone: Strategy has begun selling coins for the first time, a shift in the never-sell orthodoxy that crypto.news examined in depth, yet Grayscale mounted a public defense of that very sale as rational balance sheet management, a case crypto.news also covered. And beneath the visible institutional churn, the largest private holders have leaned in: whale wallets absorbed some 16.7 billion dollars in Bitcoin during the spring drawdown even as Wall Street vehicles bled, an accumulation wave crypto.news documented while it was happening. Deep-pocketed buyers behaving exactly as the accumulation zone label predicts is not proof of a bottom, but it is the pattern the model expects to see near one.
There is also the catalyst calendar, which is not empty. The CLARITY Act’s merged draft is due imminently, with Senate floor action targeted before the August recess, and the May committee vote already showed the reflex: Bitcoin jumped to 81,449 dollars within an hour of that 15 to 9 result. Citi and Standard Chartered carry six-figure targets, 143,000 and 150,000 dollars respectively, contingent on passage. A political catalyst is not the liquidity catalyst Timmer wants, but it is a scheduled, binary event with proven price sensitivity, sitting three weeks away, a countdown crypto.news has tracked through every procedural stumble.
Finally, the model’s own asymmetry favors patience over precision. Timmer’s floor is a zone, not a tripwire, and the historical bottoms landed both slightly above and slightly below the calculated line. For an allocator with a multi-year horizon, the question the chart answers is not whether 58,000 holds to the dollar. It is whether prices 8 percent above a three-times-validated floor represent better risk-reward than prices 90 percent above it did a year ago. Framed that way, the zone does most of the work regardless of where the exact low prints.
The other side of the corridor: what the model said at the top
The power law’s credibility does not rest on bottoms alone. The framework has a symmetrical claim about tops, and its record there is what separates it from the usual gallery of bull market curve-fitting.
When Bitcoin approaches the upper boundary of the corridor, the model labels the region a distribution zone, the mirror image of the current setup. Prior cycle peaks at 1,137 dollars, 19,042 dollars, and 64,337 dollars each printed as large positive deviations above the trendline, the same gauge that now reads negative 56 percent. Last year’s run past 120,000 dollars registered as another such excursion, and the model’s framing at the time, a speculative premium stretched far above structural value, was exactly the language skeptics dismissed as premature. In hindsight, the reading was the warning. Capital that bought the upper deviation is the capital now absent, and the round trip from positive extreme to negative extreme in roughly a year is, in the model’s terms, a complete emotional cycle compressed into twelve months.
That symmetry matters for how much trust the current signal deserves. A model that only ever says buy is marketing. A model that flagged distribution near the highs and now flags accumulation near a historically validated floor has at least earned the right to be argued with seriously. Fidelity’s own 2026 Periodic Table of Investment Returns makes the discomfort concrete: alternative assets including Bitcoin, gold, and long-duration Treasuries sit at the bottom of the annual performance ranking, beneath emerging markets, small caps, and Japanese equities. The model is asking investors to accumulate the asset class the scoreboard says has been the year’s worst idea. That is what the entries at 230, 3,204, and 16,366 dollars felt like too, which is either the entire point or the oldest trap in markets, depending on which side of the argument one occupies.
There is one further nuance in how Timmer talks about the line that deserves precision. He has described the mid-60,000s and the level around 60,000 as a line in the sand for the model, language that refers to where recalibration pressure begins, not where the thesis dies. The structural version of the power law, by his framing, would only be falsified by Bitcoin trading below roughly 17,000 dollars for more than a year, an outcome no serious participant currently prices. Between the tactical line at 58,000 and the structural line at 17,000 stretches an enormous gray zone in which the model can be wrong about timing, wrong about the exact floor, and still right about the destination. Critics call that unfalsifiability. Adherents call it the difference between a trading signal and a valuation framework. Both descriptions are accurate, which is why position sizing, not conviction, is where the argument actually gets settled.
The case for the missing catalyst
The bear argument does not dispute the chart. It disputes the physics behind it, and Timmer himself supplies most of the ammunition.
His stated reason for withholding a bottom call is that the drivers of every prior recovery are absent. Global money supply growth is decelerating, not accelerating. The speculative premium, the gap between price and the model’s structural floor that expands when fast money floods in, has been almost entirely erased, and the capital that produced it has left the building in a traceable sequence: out of Bitcoin, into gold, and now out of gold into semiconductor and AI equities. In Timmer’s framing, Bitcoin does not bounce because it reaches a line. It bounces when liquidity returns, and until it does, the base case is months of sideways drift along the floor instead of a V-shaped snapback. The accumulation zones of 2015 and 2018 were not quick either; both involved long stretches of dead money before the turn.
The demand infrastructure that was supposed to make this cycle different is, at the moment, cutting the other way. The ETF complex that absorbed supply on the way up distributed it on the way down, posting its worst month ever in June and its largest quarterly outflow since launch, a reminder that regulated wrappers transmit institutional risk appetite in both directions. The treasury company cohort has moved from pure accumulation to selective distribution, with Strategy selling coins and smaller vehicles like Empery Digital liquidating roughly half a Bitcoin stack to fund a pivot toward AI data centers. Each of these flows is individually explainable; together they describe a marginal buyer that has, for now, become a marginal seller.
The macro overlay is genuinely hostile. The United States has struck Iran three times in a single week, the Strait of Hormuz has reportedly closed again, oil holds above 100 dollars, and the Federal Reserve faces inflation pressure that keeps rate cuts off the table. Risk assets broadly are contending with the same liquidity drought, which is precisely why capital rotated to semiconductors, the one sector with an earnings story strong enough to ignore it. Bitcoin’s correlation regime matters here: in liquidity droughts it trades like a high-beta risk asset, not like gold, and the negative 100 percent reading on the gold ratio is the scar tissue of that regime. The same reading bulls cite as exhaustion, bears read as reclassification: the market spent a year deciding that in this environment, gold is the hedge and Bitcoin is the trade.
And the model itself deserves a dose of humility. Power law fits are parameterization-sensitive: Fidelity’s curve puts support near 58,000, while other published fits place the floor closer to 51,000, and at least one derivation cited in coverage runs as low as 56,488. A zone that moves by 10 percent depending on who draws it is a framework, not a law of nature. The model’s own authors concede the structural version only breaks if Bitcoin spends more than a year below roughly 17,000 dollars, which means the framework can absorb a decline of 70 percent from here without being falsified. A thesis that cannot be quickly proven wrong is comfortable to hold and dangerous to size.
Anatomy of the exodus: where the fast money actually went
The rotation Timmer describes is traceable in the flow data, and following it explains both why the drawdown was so orderly and why the recovery lacks an obvious buyer.
The first leg ran from Bitcoin to gold. As the speculative premium deflated through the winter, gold absorbed the store-of-value bid, and the Bitcoin-to-gold ratio began the slide that would eventually reach its negative 100 percent extreme. The second leg ran from gold into semiconductors, as the AI capital expenditure cycle gave momentum capital an earnings-backed home that neither metal nor token could match. Institutional surveys confirm the sequence: digital assets posted three consecutive quarterly losses, the longest streak since 2022, precisely as capital rotated into AI equities, and even crypto-native corporate stories, like the treasury company that sold half its Bitcoin stack to fund data centers, bent toward the same gravity.
What remained in the crypto market redistributed internally instead of leaving entirely. Bitcoin dominance held up because altcoins fell harder, with everything outside the top two losing roughly 23 percent in six months. Stablecoin capitalization, the market’s cash position, shrank by 10 billion dollars over two months, the largest contraction since the Terra collapse, though analysts read it as cyclical de-risking, not structural exit. And the transactional economy kept consolidating into the venues with real usage, from tokenization networks to the stablecoin rails where volume actually lives, a migration visible in the flippening of trading volume toward regulated dollar tokens that crypto.news charted this month.
The composite picture is a market that de-levered without panicking: no cascade, no exchange failure, no credit event, just a year-long transfer of coins from momentum hands to patient ones at steadily lower prices. That is, almost to the letter, the textbook description of an accumulation phase. It is also, and this is the uncomfortable part, indistinguishable in real time from the early innings of a longer decline. The difference between the two is supplied later, by liquidity, which returns the analysis to Timmer’s missing ingredient.
How the two cases actually reconcile
Strip the rhetoric and the disagreement is narrower than it looks. Both sides accept the same facts: the price is near a historically validated floor, the on-chain and whale evidence shows accumulation, the liquidity backdrop shows no fuel for a rally, and the one scheduled catalyst is political rather than monetary. The dispute is about sequencing and about what an investor should do during the gap.
History offers a specific answer about the gap. In each prior visit to the accumulation zone, the market spent between several months and more than a year grinding along the floor before the recovery began, and the recovery started when an external liquidity impulse arrived: the 2015 turn preceded the 2016 halving cycle and easing conditions, the 2019 recovery tracked the Fed’s pivot, and the 2023 exit from the zone rode the turn in global money supply and the ETF approval trade. The floor identified where the low formed. Liquidity decided when. There is no example of the zone producing a durable rally without the second ingredient, which is why Timmer’s refusal to call a bottom is not hedging. It is the model applied correctly.
That reconciliation also clarifies what the CLARITY Act can and cannot do. Legislative passage would be a demand catalyst, activating allocator categories that cannot currently hold the asset, and the market’s hair-trigger response to the committee vote suggests real convexity around the outcome. But a statute does not print money. If the bill passes into a liquidity drought, the plausible result is a strong repricing that then stalls at the trendline instead of reaching a new cycle high, the difference between closing the discount and starting a bull market. If it fails, the floor gets its stress test with no cushion, and the parameterization debate, 58,000 versus 51,000, stops being academic. Elsewhere in the market, the same liquidity question is being answered asset by asset: capital that stayed in crypto has crowded into the few networks with visible usage growth, a concentration visible across the tokenization trade, leaving Bitcoin to trade almost purely on macro.
What to watch while the market drifts
Before the gauges, a word on method, because the practical difference between the two camps is not belief but execution. The accumulation zone framework, taken seriously, argues for scaling over timing: building exposure in defined tranches as price approaches the floor, sized so that a breach of 58,000 is survivable and a visit toward the alternative fits near 51,000 is a continuation of the plan, not its failure. It argues for instruments matched to a months-long horizon, since the model’s own history says the zone can persist for two to four quarters before resolving, and leveraged expressions of a patient thesis are how correct analysis produces liquidated accounts. And it argues for treating a confirmed weekly close below the floor as a thesis review trigger, a scheduled reassessment, not a panic exit, because the difference between the tactical line and the structural one is 40,000 dollars wide. The missing-catalyst framework, taken equally seriously, adds only one amendment: let the macro data, not the price, decide when the accumulation window is closing. Buying the zone is a bet that liquidity returns eventually. Watching the liquidity gauges is how eventually gets a date. Neither camp needs to convert the other for both to be useful; one supplies the map of where value lives, the other supplies the clock that says when the market will agree.
Four gauges will signal the regime change before the price does. Global money supply growth is the master variable; Timmer’s entire framework waits on its second derivative turning positive, and any coordinated easing impulse, from the Fed or elsewhere, is the starting gun the model requires. ETF weekly flows are the institutional thermometer; one 221 million dollar day means nothing, but a month of sustained net inflows through a flat tape would mark the return of the allocator bid. The Bitcoin-to-gold ratio recovering from its negative 100 percent extreme would show relative capitulation has ended even before absolute prices move. And a confirmed weekly close below the 58,000 zone would be the model’s recalibration trigger, the signal to treat the floor as broken instead of tested, with the next published fits clustering around 51,000.
The honest conclusion is that the chart and the strategist are both right, and they are answering different questions. The power law says where: Bitcoin is entering the zone where every prior cycle’s sellers ran out, with corroborating exhaustion readings that have exactly two precedents, both of them bottoms. The catalyst analysis says when: not until liquidity returns, and possibly not for months. Accumulation zones are named for what disciplined capital does inside them, quietly and without confirmation. The word was never a promise that the bell rings at the low. It is a description of who is buying while everyone else waits for one.
Disclosure: This article does not represent investment advice. The content and materials featured on this page are for educational purposes only.
BlackRock and HSBC have joined a UK tokenization push projected to boost annual economic output by up to $44 billion, as 54 firms line up behind the plan.
The taskforce is led by Christopher Woolard, the British government’s wholesale digital markets champion and a former interim head of the Financial Conduct Authority. His first report to the Treasury, delivered in July 2026, maps a route from pilots to live markets.
A $44 Billion Bet on Tokenized Markets
Tokenization converts ownership of assets such as bonds, funds, and property into digital tokens that are recorded on a blockchain. Supporters argue it cuts costs, speeds settlement, and frees capital trapped in aging back-office systems.
The economic case comes from Barclays and PwC. Their study estimates that tokenization could add up to $44 billion (£33 billion) to UK output by 2035. Roughly two-thirds of that gain would fall outside financial services, in the wider economy.
That top figure is a ceiling, not a base case. It assumes the UK becomes a leading hub while the US and Europe adopt in parallel. A more cautious scenario points to about $29 billion (£22 billion) a year, plus $19 billion (£14 billion) in fresh annual tax revenue.
The prize reflects how early the market still is. Tokenized real-world assets (RWA) stood near $30 billion in 2025, a sliver of global markets. Yet that value jumped about 300% over the year. The latest on-chain tokenization data track the same climb.
Forecasters expect the base to expand fast. Consultancy BCG projects that tokenized assets could reach around $55 trillion by 2035. That gap is why the tokenized stocks and bonds wave now sits at the center of institutional strategy.
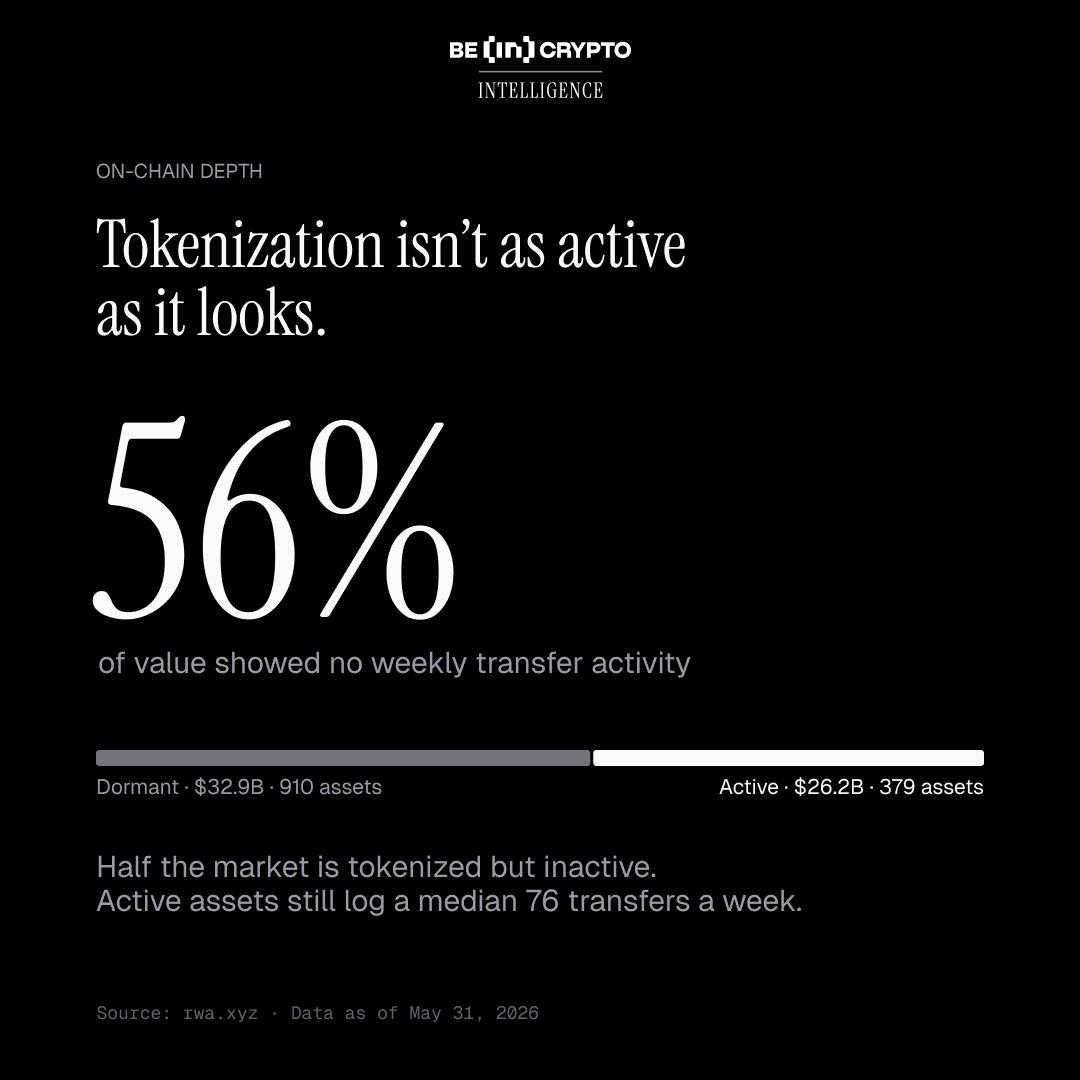
Note: Latest research from BeInCrypto found that more than 56% of the Tokenization market has zero activity on-chain.

Global Banks Back the UK Tokenization Push
BlackRock shows how far traditional finance has moved. The world’s largest asset manager runs BUIDL, the largest tokenized US Treasury fund, with about $2.4 billion in assets. It also registered as a UK cryptoasset firm in 2025, while HSBC has issued digital bonds through its Orion platform.
The taskforce reads like a roll call of global finance. Its 54 members include JPMorgan, Goldman Sachs, Morgan Stanley, Citi, Deutsche Bank, and UBS.
Asset managers Fidelity International, Schroders, and State Street also signed on. Market infrastructure firms DTCC, Euroclear, and the London Stock Exchange Group joined too. So did crypto-native players such as Circle, Ripple, and Coinbase.

The UK has already produced working proof points. Lloyds, Aberdeen, and Archax completed a UK-first tokenized foreign exchange trade collateralized in 2025. Baillie Gifford and BNY launched Britain’s first fully tokenized investment fund in June 2026.
That momentum has pulled established institutional tokenization platforms into regulated markets rather than sandboxes alone.
The taskforce plans to prove the technology one use case at a time. Its first target is the repo market, where firms borrow cash against securities for short periods. Woolard’s group wants a live tokenized repo trial by spring 2027, then work on fixed income and derivatives.
There is precedent to build on. In early 2026, Digital Asset ran a cross-border intraday repo trade using tokenized gilts on its Canton network.
UK Eyes First G7 Tokenized Government Bond
The boldest goal targets sovereign debt. The report urges an early pilot of a digital gilt instrument, known as DIGIT, no later than the first quarter of 2027. Success would make the UK the first Group of Seven nation to issue tokenized government debt.
Smaller jurisdictions moved first. Hong Kong sold the world’s first tokenized government green bond in 2023. It then priced a record multi-currency digital bond in 2025. Slovenia became the first European Union sovereign to issue debt on a distributed ledger in 2024. The European Investment Bank has run blockchain bonds since 2021.
That history sharpens the stakes. The UK is not inventing tokenized debt, but no major economy has issued it, and London wants to claim that ground first.
Regulators are moving in step. The Financial Conduct Authority will open applications for its cryptoasset regime on September 30, 2026. Full rollout follows in October 2027, alongside broader UK stablecoin plans due the same year.
Woolard cast the effort as a contest for the country’s place in global finance.
“Put simply, tokenised markets are fundamental to the future of financial services. What the UK does here determines our right to be at the heart of the next generation of financial markets,” read an excerpt in the report, citing Woolard.
The hard part is what follows the pilots. Analysts still flag thin trading and shallow tokenized market liquidity as the sector’s weak spot. The taskforce must close that gap as it scales.
The UK now has firm dates, heavyweight backers, and a clear target. The next year will show whether these trials can reach live markets before rival financial centers close the gap.
The post BlackRock Joins UK Tokenization Push to Deliver $44 Billion to the Economy appeared first on BeInCrypto.

Arguably the most popular UFC fighter of our time – Conor McGregor – returned to the octagon after a five-year absence during which he recovered from a severe leg fracture and dealt with personal and legal issues.
However, his long-awaited return was anything but successful, resulting in a notable financial loss for Canadian rapper Drake.
The Curse Strikes Again
This weekend, the Irish fighter faced Max Holloway at UFC 329 in Las Vegas. This was his first fight since 2021, but the highly anticipated comeback was surprisingly brief.
McGregor landed awkwardly on his right knee in the very first seconds, giving his opponent the upper hand. Just 1:09 into the fight, the referee called it off, handing Holloway the victory after he unloaded a barrage of punches on the Irishman.
Given his long absence from the octagon, McGregor was the underdog in this game and the odds for his win were quite high. The renowned Canadian musician Aubrey Drake Graham, better known as Drake, tested his luck at gambling again, wagering $1 million in Bitcoin (BTC) on “The Notorious” to emerge victorious.
A McGregor win would have earned him a massive $1.85 million profit, but instead the million-dollar bet vanished into thin air. Some might say Drake’s latest setback was expected, considering his consistently poor track record with high-stakes bets.
Over the years, the rapper has wagered substantial sums on athletes and sports teams, many of which ended up losing. This led to the creation of the so-called “Drake Curse,” and the examples are countless.
In 2024, for instance, the musician forfeited $700,000 in BTC on a UFC fight, while earlier this year he lost $1 million worth of the cryptocurrency after the New England Patriots were defeated by the Seattle Seahawks in the Super Bowl.
Better Luck With the World Cup
It is important to note that every now and then, Drake places a winning wager. Such was the case a couple of weeks back when he bet that Canada would eliminate South Africa in the FIFA World Cup 2026.
His homeland scored the winning goal at the very end of the game, and the rapper (who bet $770,000 in USDT) made approximately $230,000 in profit in the stablecoin.
The post ‘Drake Curse’ Is Back: Here’s How Much Bitcoin (BTC) He Lost Betting on Conor McGregor appeared first on CryptoPotato.
Crypto World
Newly launched 2026 cloud mining app with smart AI, unaffected by market swings, earning up to $67,000 daily

Disclosure: This article does not represent investment advice. The content and materials featured on this page are for educational purposes only.
AI-powered cloud mining platforms are simplifying crypto participation by automating resource management, optimization, and daily operations for users.
Over the past few years, cloud mining has undergone several technological iterations, but the barrier to entry remains a significant hurdle for many ordinary users. From mining machine management and computing power configuration to profit monitoring, traditional cloud mining often requires a substantial amount of time to learn the relevant knowledge and even constant monitoring of market conditions and platform operations. For new users just starting out with digital assets, the complex operating procedures and technical jargon also deter many.

Entering 2026, the rapid development of artificial intelligence technology is propelling cloud mining into a new intelligent phase. The next generation of cloud mining applications deeply integrates AI intelligent systems with automated management, transforming the previously complex operating procedures into a simpler and more efficient user experience. Users do not need to configure equipment, learn complex technical knowledge, or perform frequent manual operations; they only need to complete simple registration and account setup to quickly start experiencing intelligent cloud mining services.
Compared to traditional cloud mining, the next-generation xrppower AI cloud mining is more intelligent, efficient, and easy to use. The intelligent system can automatically complete resource scheduling, operational optimization, and daily management without complex operations or frequent human intervention, allowing even inexperienced new users to quickly get started. With the continuous development of AI technology, cloud mining is evolving towards greater convenience, intelligence, and automation, bringing users a more relaxed experience.
How to Use XRPPower AI smart cloud mining
Step 1: Register an Account
Register using an email address. Creating an XRPPower account takes just a few minutes.
Step 2: Choose a Cloud Mining Contract
Choose a suitable cloud mining contract plan based on a specific financial plan and needs.
Step 3: Pay the Contract Fee
Pay the contract fee using a supported cryptocurrency. The system will automatically activate the selected contract upon confirmation.
Step 4: Earn Profits
After the contract takes effect, profits will be automatically credited to the account balance according to platform rules. Users can choose to withdraw funds or purchase new cloud mining contracts using the platform’s features.
Details of Some Popular XRPPower Cloud Mining Profit Contracts
Investment Amount: $5,000, Contract Period: 15 days, Daily Profit: $70.50, Total Profit: $1,057.50, Principal $5,000 Refunded Upon Maturity.
Investment Amount: $10,000 USD, Contract Period: 20 days, Daily Yield: $153 USD, Total Yield: $3,060 USD, Principal $10,000 USD Refund Upon Maturity.
Click to view more cloud mining yield contracts
XRPPower AI intelligent cloud mining security and compliance
AI-Driven, Continuously Optimized Platform Services
XRPPower continuously upgrades its AI intelligent system, integrating automation technology into platform operations. Through intelligent resource scheduling, system optimization, and automated management, it continuously improves platform efficiency and user experience. The platform provides digital services 365 days a year and continuously optimizes system performance and service processes to create a more efficient and convenient user experience for global users.
Global operations, robust platform governance
Headquartered in London, UK, XRPPower continuously monitors the development of the global digital finance industry, constantly improving its platform operation system, risk management mechanism, and internal governance processes. The platform is committed to continuously promoting compliance in accordance with applicable laws, regulations, and operational requirements, providing global users with more standardized, transparent, and stable digital financial services.
Multiple security measures to protect user assets and data
Regarding platform security, XRPPower employs technologies such as SSL/TLS data encryption, two-factor authentication (2FA), separate storage for hot and cold wallets, multi-layered security protection, and intelligent risk monitoring to provide multiple layers of security for user accounts, transaction data, and digital assets. Simultaneously, the platform continuously optimizes its internal controls, risk management, and security operations system, and draws on risk management concepts widely adopted by international professional institutions to continuously improve platform governance capabilities, operational transparency, and long-term service levels, creating a more reliable digital financial service environment for users.
Summary
In 2026, XRPPower completed a major upgrade, further integrating AI intelligent technology into its cloud mining services, providing a more intelligent and convenient digital experience to over 3 million users worldwide. Through automated management and continuously optimized platform services, users can more easily participate in cloud mining, using related functions without complex operations. The platform operates continuously 365 days a year, providing users with a stable service experience. Register for XRPPower now for free to learn more about the platform’s functions and operating model, explore digital asset management methods according to your needs, and rationally participate in related services.
For more information, visit the official website.
Disclosure: This content is provided by a third party. Neither crypto.news nor the author of this article endorses any product mentioned on this page. Users should conduct their own research before taking any action related to the company.
“I’d encourage the Commission not to dismiss third-party stock tokens, but to treat them as what they are — a different class of financial instrument, with clear separation from real stocks.”
Not everyone agrees
Some market participants, however, say the STA’s proposal risks grouping together fundamentally different tokenization models.
“The key is whether the tokens represent true stock ownership or just economic exposure,” Dinari CEO Gabe Otte told CoinDesk.
He said many of the STA’s concerns are valid but apply primarily to synthetic tokenized products. He pointed to the SEC’s January statement, which distinguishes custodial tokenized securities from synthetic structures, arguing that regulated custodial models should be evaluated separately.
“Both issuer-sponsored and custodial models offer true stock ownership and these should be distinguished from synthetic models for the benefit of the end investor,” Otte said.
Alan Konevsky, CEO of digital securities platform tZERO, agreed that issuer-sponsored tokenization offers important advantages by preserving the direct relationship between companies and investors. But he argued the market is likely to support multiple compliant approaches.
“Innovation is accelerating, and we expect multiple compliant, non-misleading, economically and technologically meaningful models to emerge as the market matures,” Konevsky said.
Eli Cohen, chief legal officer at tokenization platform Centrifuge that focuses on bringing funds onchain, said the letter reflects transfer agents’ concerns that issuer-sponsored tokenization could lose ground if third-party models become more widely adopted.
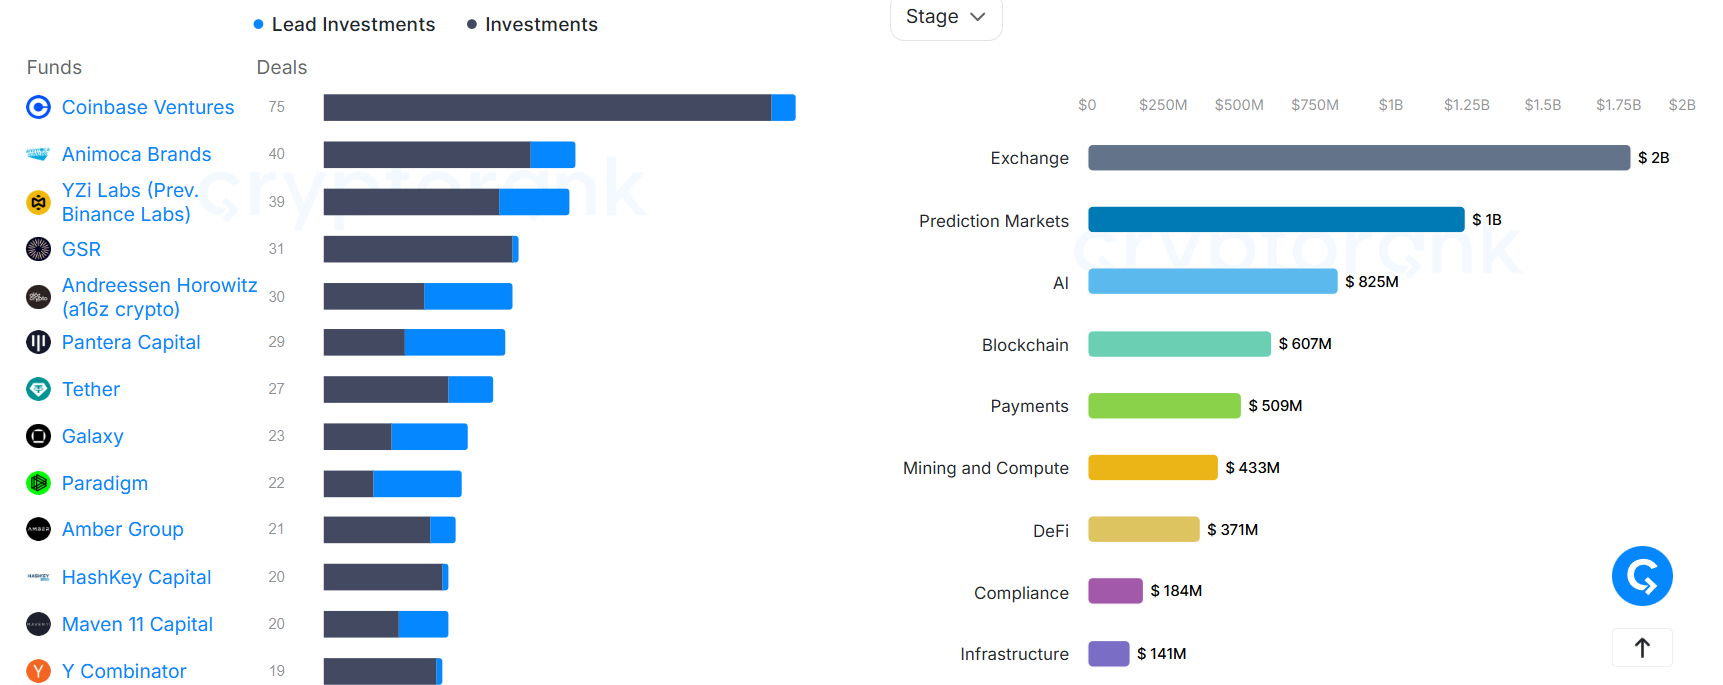
Coinbase Ventures, the corporate venture capital (VC) arm of cryptocurrency exchange Coinbase, led the ranks of crypto-focused VC’s with 30 deals in the first half of 2026.
Runner-up Animoca Brands completed 19 investments while Silicon Valley VC a16z logged 18 deals and stablecoin giant Tether completed 15, according to data aggregator CryptoRank.
In the past 12 months Coinbase Ventures completed a peer-best 75 deals, followed by Animoca Brands with 40, YZi Labs (previously Binance Labs) with 39, GSR with 31 and a16z with 30.
Those VC deals defy a bear market that saw the total amount raised by cryptocurrency companies fall to $1.4 billion in June, down 63% decline from $3.8 billion in April.
Deal counts also fell in June, to 61 fundraising rounds, down from 89 rounds in May. Still, last month showed a slight recovery compared to April, when crypto VC funding hit a two-year low of $698 million across 71 total fundraising rounds.
So far in July, crypto firms raised $456 million across 12 funding rounds.
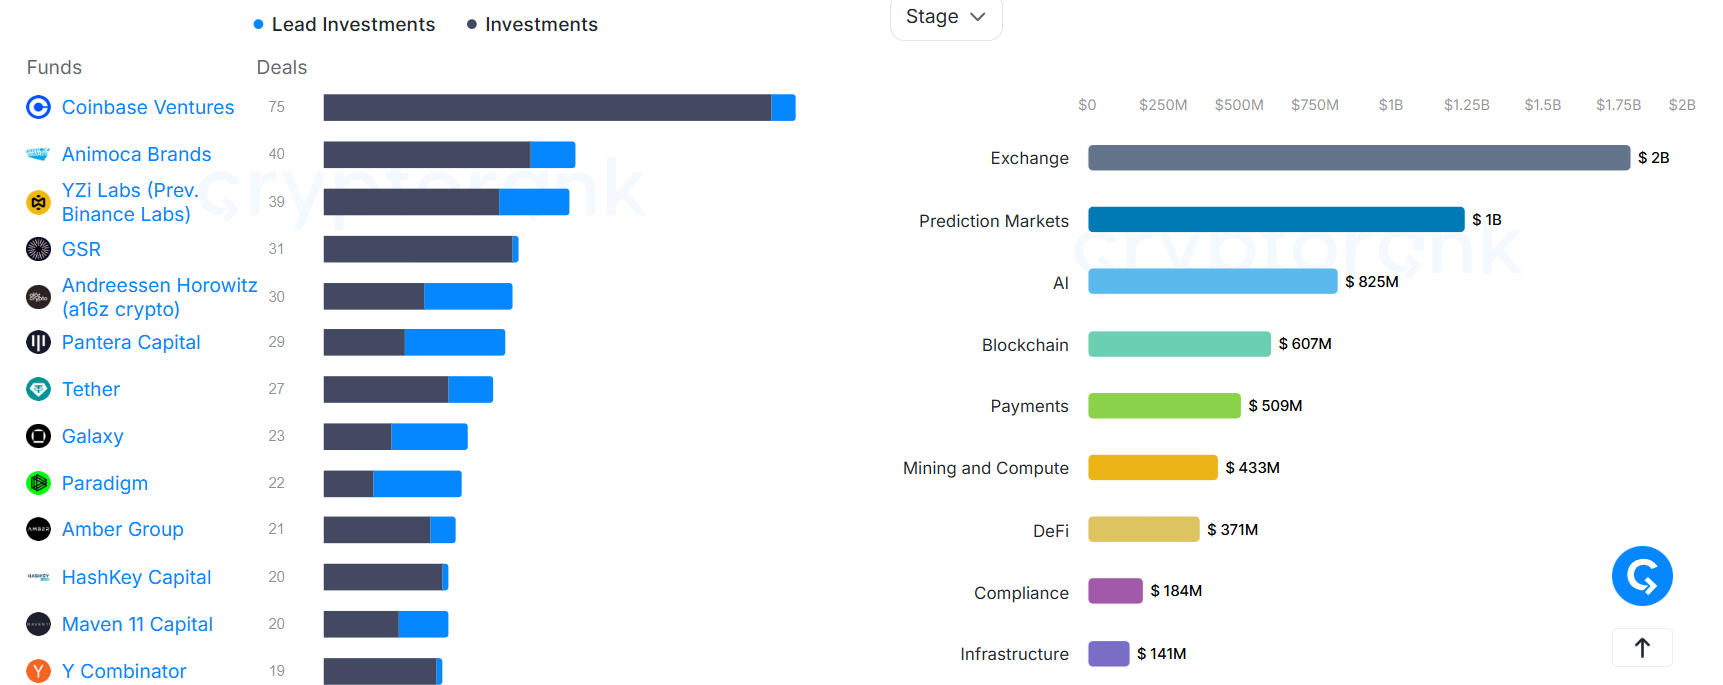
Top active investors and top categories by funding deals. Source: CryptoRank
Looking at the deals of the past six months, Coinbase Ventures participated in seven investment rounds tied to payment protocols, four rounds for DeFi projects and three rounds for infrastructure and real-world asset tokenization projects, respectively.
However, the number of unique investors shrunk to 242 in June, from 452 unique investors in October 2025.
Related: Bitcoin whale moves $188M for first time in 7 years
DeFi, payments, AI remain leading VC categories
Decentralized finance (DeFi), payments and AI attracted the lion’s share of crypto VC funding during the past year.
DeFi protocols saw 216 fundraising rounds in the period, while payments startups logged 131 rounds and AI-crypto companies raised 128 rounds, according to CryptoRank.
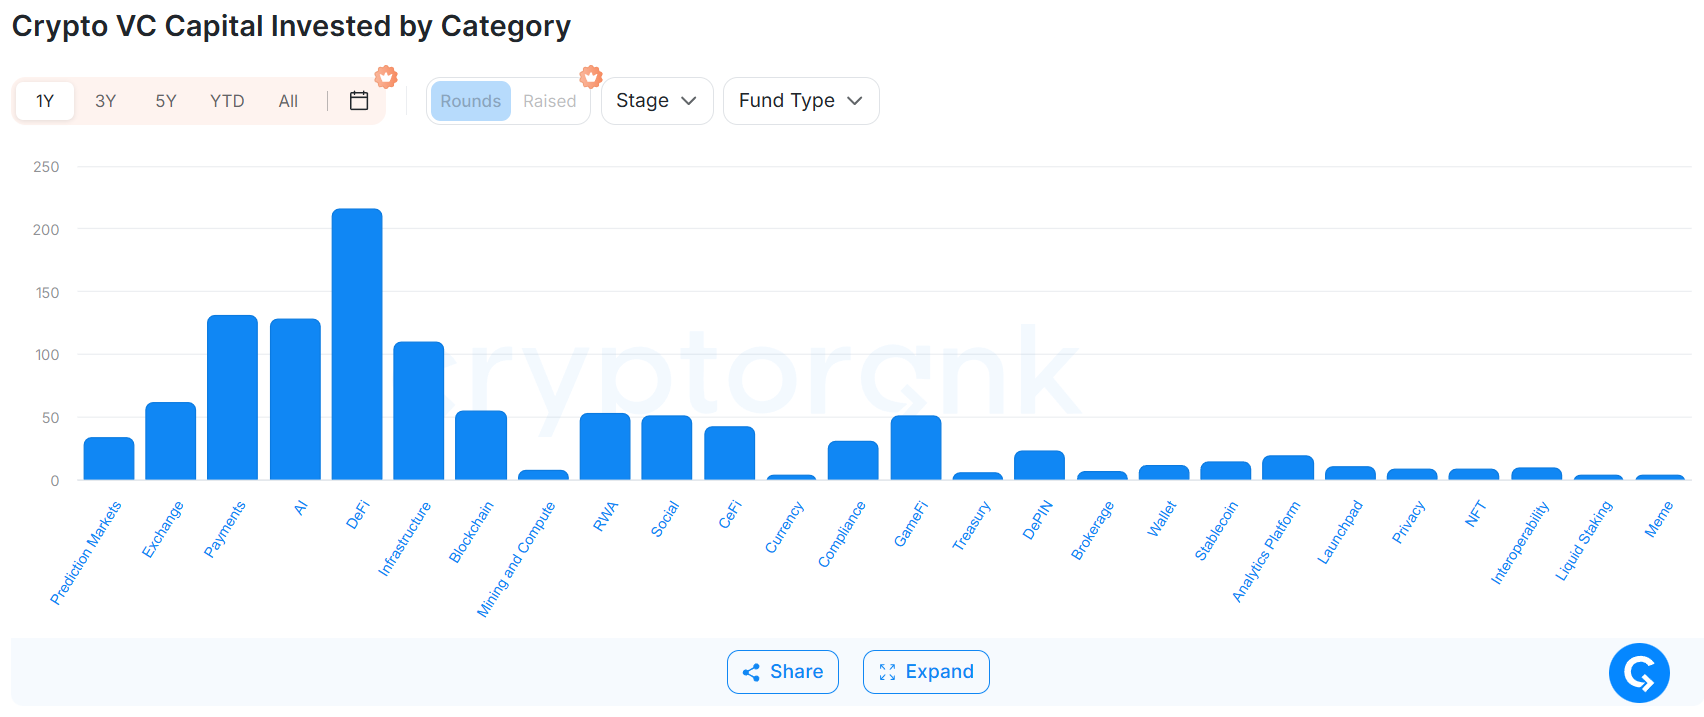
Crypto VC capital, invested by category, 1-year chart. Source: CryptoRank
Infrastructure providers raising 110 funding rounds, while all other sectors saw fewer than 100 investment rounds over the past year.
In terms of geographical distribution, US-based VCs accounted for $5.8 billion and Australia-based VCs contributed $3.6 billion of funds over the past six months. More than $11.6 billion was invested from undisclosed locations.
Magazine: Strategy sells $216M Bitcoin, Bollinger bullish on BTC: Hodler’s Digest, June 29-July 6, 2026
Crypto World
BlackRock, Goldman Sachs, JPMorgan, Morgan Stanley join UK government's tokenization taskforce


The 54 firm-strong group, which is backed by the City of London Corporation, will spend the next year working on live tokenisation use cases across UK financial markets.

Bitcoin: Dubious Speculation

How to get rid of patio weeds easily using just one item

Jayne-Anne Gadhia named FRC Chair candidate


-

 Fashion7 days ago
Open Thread: What Great Books Have You Read Recently?
-

 News Videos6 days ago
Whats Hidden Inside This Cash Register? #treasure #reselling #money
-

 Fashion4 days ago
Loro Piana Fall 2026 Enters Houston’s Art Scene
-

 Fashion3 days ago
Weekend Open Thread: Nutriplenish Leave-In Conditioner
-

 Crypto World7 days ago
$1,000 Credit Alert! BlockDAG X Exchange Pre-Registration Now Officially Open, Polkadot Dips & Zcash Rebounds
-
 Tech6 days ago
Anthropic’s new “J-lens” reveals a silent workspace inside Claude that mirrors a leading theory of consciousness
-

 News Videos7 days ago
Best Time to Enter Small Caps Right Now? Another Bull Run? | Financially Free
-

 Business7 days ago
AXT Shares Jump Nearly 14% as Semiconductor Materials Maker Rebounds on AI-Linked Indium Phosphide Demand
-

 Sports6 days ago
Joshua Pacio ‘more complete’ ahead of ONE rematch vs Malachiev
-
 Sports4 days ago
2026 Genesis Scottish Open Thursday TV coverage: Round 1
-

 Tech5 days ago
Anthropic brings Claude Cowork to mobile and web as usage data shows most users aren’t coding
-
 Crypto World7 days ago
SK hynix (000660.KS) Stock Dips as $28B Nasdaq ADR Offering Drives AI Memory Expansion
-

 Sports3 days ago
Super Eagles star Moses Simon opens up on Liverpool transfer regret
-
Sports6 days ago
We have punished the disrespect
-

 Crypto World6 days ago
Binance lists Strategy’s STRC stock as company expands Bitcoin funding
-

 Tech4 days ago
Character.AI enters the microdrama arena with its own productions, but there’s a twist
-

 Tech7 days ago
9 Best Keyboards (2025), Tested and Reviewed
-
 Crypto World6 days ago
Claude AI Created Something Anthropic Never Designed
-

 Business6 days ago
Enbridge: AI Tailwind Priced In (Rating Downgrade)
-

 News Videos6 days ago
“What’s going on?!” Carl Froch discusses Floyd Mayweather Jr financial issues
You must be logged in to post a comment Login