

Crypto World
Bitcoin nears Fidelity power law support



Bitcoin is trading around 62,700 dollars, and Jurrien Timmer, Fidelity’s director of global macro, is watching it drift toward a line he has tracked for more than a decade.
Summary
- Bitcoin is trading near Fidelity’s power law support zone, with the model’s lower boundary around 58,000 dollars.
- Jurrien Timmer views the area as an accumulation zone but is not calling a bottom without a clear catalyst.
- The power law support has aligned closely with major Bitcoin lows in 2015, 2018, and 2022.
- Bitcoin’s deviation from trend and its underperformance against gold now resemble prior cycle-bottom conditions.
- The main missing ingredient is liquidity, which has historically determined when accumulation zones turn into recoveries.
On his power law model, a logarithmic chart that bounds Bitcoin’s entire price history between an upper resistance curve, a middle trendline, and a lower support curve, the floor currently sits near 58,000 dollars. That lower line has caught every major Bitcoin bottom since 2015. Timmer’s label for the zone the market has now entered is unambiguous: accumulation. His caveat is just as unambiguous: he sees no catalyst for a reversal, and he is not calling a bottom.
That combination, a historically reliable floor approaching and a strategist refusing to ring the bell, is the most honest summary of the Bitcoin market in July 2026. The asset is coming off its worst quarter since the 2022 bear market, spot ETFs just recorded their largest quarterly outflow since launch, the speculative premium that carried the price past 120,000 dollars last year has evaporated, and the fast money has visibly rotated elsewhere, first into gold, then into semiconductor stocks. And yet the two quantitative measures Timmer trusts most, the deviation from the power law trendline and the Bitcoin-to-gold ratio, have both sunk to depths recorded at exactly two prior moments: the 2018 low and the 2022 low. Both of those moments were generational buying opportunities. Both also felt like the end of the world at the time.
This feature takes the model seriously in both directions: what the power law actually says, why its track record earns attention, and why the missing-catalyst objection is not a hedge but the core of the analysis.
What the power law model actually is
The power law framework treats Bitcoin’s price growth as a function that decays over time. Early in the asset’s life, prices could multiply a hundredfold in a cycle; as the network matures and the base grows, each cycle’s percentage gains shrink, and the whole price history, plotted on log-log axes, settles into a corridor that rises steadily but ever more slowly. Timmer’s version of the chart draws three curves through that corridor. The upper line marks the euphoria boundary, where prior cycles topped. The middle trendline marks something like fair value under the model. The lower line marks the floor where sellers have historically exhausted themselves.
The track record of that lower line is the reason the chart circulates every time the market bleeds. In the 2014 to 2015 bear market, the model’s support calculation stood near 252 dollars and the actual bottom printed at roughly 230. In 2018, the support line sat near 2,521 dollars against a low of 3,204. In the 2022 winter, the line read about 15,006 dollars and the market bottomed at 16,366. Three cycles, three bottoms, all landing within shouting distance of a curve drawn from math, not sentiment. In the current fit, that curve passes near 58,000 dollars, with some of Timmer’s postings citing figures around 58,237, and Bitcoin at 62,700 is trading roughly 8 percent above it.
Two companion indicators complete the picture, and both are flashing the same reading. The first tracks how far the price trades above or below the middle trendline. That deviation has swung to negative 56 percent, a depth the chart explicitly labels the accumulation zone and one that aligned with the 2018 and 2022 lows. The second is the 52-week z-score of the Bitcoin-to-gold ratio, which has collapsed to around negative 100 percent, meaning Bitcoin has underperformed gold over the trailing year to a degree seen only at prior points of maximal exhaustion. Historically, readings between negative 100 and negative 120 on that gauge, recorded in late 2014, 2018, and 2022, marked the moments when relative weakness against gold had run its course.
One underappreciated property of the setup: the price does not need to fall for the test to happen. The support curve rises over time, so a market that simply goes sideways will meet the floor from above. Stagnation and decline arrive at the same destination, which is partly why Timmer frames the coming months as a period of drift along support, not a decision point with a date.
The case for the accumulation zone
The bull argument starts with base rates. A signal that has fired three times in eleven years and preceded a major recovery all three times deserves weight, especially when two independent gauges, trendline deviation and the gold ratio, corroborate each other. Markets rarely hand out cleaner historical analogies than negative 56 percent deviation, a level with exactly two precedents, both of them cycle lows.
The structural context has also improved in ways the 2018 and 2022 comparisons undersell. In those winters, Bitcoin had no spot ETF complex, no corporate treasury cohort, and no legislative framework in motion. Today the ETFs exist and, after a June that ranked as their worst month on record, just snapped a ten-day outflow streak with a 221.7 million dollar single-day inflow, their largest daily haul in two months. The corporate treasury era is wobbling but not gone: Strategy has begun selling coins for the first time, a shift in the never-sell orthodoxy that crypto.news examined in depth, yet Grayscale mounted a public defense of that very sale as rational balance sheet management, a case crypto.news also covered. And beneath the visible institutional churn, the largest private holders have leaned in: whale wallets absorbed some 16.7 billion dollars in Bitcoin during the spring drawdown even as Wall Street vehicles bled, an accumulation wave crypto.news documented while it was happening. Deep-pocketed buyers behaving exactly as the accumulation zone label predicts is not proof of a bottom, but it is the pattern the model expects to see near one.
There is also the catalyst calendar, which is not empty. The CLARITY Act’s merged draft is due imminently, with Senate floor action targeted before the August recess, and the May committee vote already showed the reflex: Bitcoin jumped to 81,449 dollars within an hour of that 15 to 9 result. Citi and Standard Chartered carry six-figure targets, 143,000 and 150,000 dollars respectively, contingent on passage. A political catalyst is not the liquidity catalyst Timmer wants, but it is a scheduled, binary event with proven price sensitivity, sitting three weeks away, a countdown crypto.news has tracked through every procedural stumble.
Finally, the model’s own asymmetry favors patience over precision. Timmer’s floor is a zone, not a tripwire, and the historical bottoms landed both slightly above and slightly below the calculated line. For an allocator with a multi-year horizon, the question the chart answers is not whether 58,000 holds to the dollar. It is whether prices 8 percent above a three-times-validated floor represent better risk-reward than prices 90 percent above it did a year ago. Framed that way, the zone does most of the work regardless of where the exact low prints.
The other side of the corridor: what the model said at the top
The power law’s credibility does not rest on bottoms alone. The framework has a symmetrical claim about tops, and its record there is what separates it from the usual gallery of bull market curve-fitting.
When Bitcoin approaches the upper boundary of the corridor, the model labels the region a distribution zone, the mirror image of the current setup. Prior cycle peaks at 1,137 dollars, 19,042 dollars, and 64,337 dollars each printed as large positive deviations above the trendline, the same gauge that now reads negative 56 percent. Last year’s run past 120,000 dollars registered as another such excursion, and the model’s framing at the time, a speculative premium stretched far above structural value, was exactly the language skeptics dismissed as premature. In hindsight, the reading was the warning. Capital that bought the upper deviation is the capital now absent, and the round trip from positive extreme to negative extreme in roughly a year is, in the model’s terms, a complete emotional cycle compressed into twelve months.
That symmetry matters for how much trust the current signal deserves. A model that only ever says buy is marketing. A model that flagged distribution near the highs and now flags accumulation near a historically validated floor has at least earned the right to be argued with seriously. Fidelity’s own 2026 Periodic Table of Investment Returns makes the discomfort concrete: alternative assets including Bitcoin, gold, and long-duration Treasuries sit at the bottom of the annual performance ranking, beneath emerging markets, small caps, and Japanese equities. The model is asking investors to accumulate the asset class the scoreboard says has been the year’s worst idea. That is what the entries at 230, 3,204, and 16,366 dollars felt like too, which is either the entire point or the oldest trap in markets, depending on which side of the argument one occupies.
There is one further nuance in how Timmer talks about the line that deserves precision. He has described the mid-60,000s and the level around 60,000 as a line in the sand for the model, language that refers to where recalibration pressure begins, not where the thesis dies. The structural version of the power law, by his framing, would only be falsified by Bitcoin trading below roughly 17,000 dollars for more than a year, an outcome no serious participant currently prices. Between the tactical line at 58,000 and the structural line at 17,000 stretches an enormous gray zone in which the model can be wrong about timing, wrong about the exact floor, and still right about the destination. Critics call that unfalsifiability. Adherents call it the difference between a trading signal and a valuation framework. Both descriptions are accurate, which is why position sizing, not conviction, is where the argument actually gets settled.
The case for the missing catalyst
The bear argument does not dispute the chart. It disputes the physics behind it, and Timmer himself supplies most of the ammunition.
His stated reason for withholding a bottom call is that the drivers of every prior recovery are absent. Global money supply growth is decelerating, not accelerating. The speculative premium, the gap between price and the model’s structural floor that expands when fast money floods in, has been almost entirely erased, and the capital that produced it has left the building in a traceable sequence: out of Bitcoin, into gold, and now out of gold into semiconductor and AI equities. In Timmer’s framing, Bitcoin does not bounce because it reaches a line. It bounces when liquidity returns, and until it does, the base case is months of sideways drift along the floor instead of a V-shaped snapback. The accumulation zones of 2015 and 2018 were not quick either; both involved long stretches of dead money before the turn.
The demand infrastructure that was supposed to make this cycle different is, at the moment, cutting the other way. The ETF complex that absorbed supply on the way up distributed it on the way down, posting its worst month ever in June and its largest quarterly outflow since launch, a reminder that regulated wrappers transmit institutional risk appetite in both directions. The treasury company cohort has moved from pure accumulation to selective distribution, with Strategy selling coins and smaller vehicles like Empery Digital liquidating roughly half a Bitcoin stack to fund a pivot toward AI data centers. Each of these flows is individually explainable; together they describe a marginal buyer that has, for now, become a marginal seller.
The macro overlay is genuinely hostile. The United States has struck Iran three times in a single week, the Strait of Hormuz has reportedly closed again, oil holds above 100 dollars, and the Federal Reserve faces inflation pressure that keeps rate cuts off the table. Risk assets broadly are contending with the same liquidity drought, which is precisely why capital rotated to semiconductors, the one sector with an earnings story strong enough to ignore it. Bitcoin’s correlation regime matters here: in liquidity droughts it trades like a high-beta risk asset, not like gold, and the negative 100 percent reading on the gold ratio is the scar tissue of that regime. The same reading bulls cite as exhaustion, bears read as reclassification: the market spent a year deciding that in this environment, gold is the hedge and Bitcoin is the trade.
And the model itself deserves a dose of humility. Power law fits are parameterization-sensitive: Fidelity’s curve puts support near 58,000, while other published fits place the floor closer to 51,000, and at least one derivation cited in coverage runs as low as 56,488. A zone that moves by 10 percent depending on who draws it is a framework, not a law of nature. The model’s own authors concede the structural version only breaks if Bitcoin spends more than a year below roughly 17,000 dollars, which means the framework can absorb a decline of 70 percent from here without being falsified. A thesis that cannot be quickly proven wrong is comfortable to hold and dangerous to size.
Anatomy of the exodus: where the fast money actually went
The rotation Timmer describes is traceable in the flow data, and following it explains both why the drawdown was so orderly and why the recovery lacks an obvious buyer.
The first leg ran from Bitcoin to gold. As the speculative premium deflated through the winter, gold absorbed the store-of-value bid, and the Bitcoin-to-gold ratio began the slide that would eventually reach its negative 100 percent extreme. The second leg ran from gold into semiconductors, as the AI capital expenditure cycle gave momentum capital an earnings-backed home that neither metal nor token could match. Institutional surveys confirm the sequence: digital assets posted three consecutive quarterly losses, the longest streak since 2022, precisely as capital rotated into AI equities, and even crypto-native corporate stories, like the treasury company that sold half its Bitcoin stack to fund data centers, bent toward the same gravity.
What remained in the crypto market redistributed internally instead of leaving entirely. Bitcoin dominance held up because altcoins fell harder, with everything outside the top two losing roughly 23 percent in six months. Stablecoin capitalization, the market’s cash position, shrank by 10 billion dollars over two months, the largest contraction since the Terra collapse, though analysts read it as cyclical de-risking, not structural exit. And the transactional economy kept consolidating into the venues with real usage, from tokenization networks to the stablecoin rails where volume actually lives, a migration visible in the flippening of trading volume toward regulated dollar tokens that crypto.news charted this month.
The composite picture is a market that de-levered without panicking: no cascade, no exchange failure, no credit event, just a year-long transfer of coins from momentum hands to patient ones at steadily lower prices. That is, almost to the letter, the textbook description of an accumulation phase. It is also, and this is the uncomfortable part, indistinguishable in real time from the early innings of a longer decline. The difference between the two is supplied later, by liquidity, which returns the analysis to Timmer’s missing ingredient.
How the two cases actually reconcile
Strip the rhetoric and the disagreement is narrower than it looks. Both sides accept the same facts: the price is near a historically validated floor, the on-chain and whale evidence shows accumulation, the liquidity backdrop shows no fuel for a rally, and the one scheduled catalyst is political rather than monetary. The dispute is about sequencing and about what an investor should do during the gap.
History offers a specific answer about the gap. In each prior visit to the accumulation zone, the market spent between several months and more than a year grinding along the floor before the recovery began, and the recovery started when an external liquidity impulse arrived: the 2015 turn preceded the 2016 halving cycle and easing conditions, the 2019 recovery tracked the Fed’s pivot, and the 2023 exit from the zone rode the turn in global money supply and the ETF approval trade. The floor identified where the low formed. Liquidity decided when. There is no example of the zone producing a durable rally without the second ingredient, which is why Timmer’s refusal to call a bottom is not hedging. It is the model applied correctly.
That reconciliation also clarifies what the CLARITY Act can and cannot do. Legislative passage would be a demand catalyst, activating allocator categories that cannot currently hold the asset, and the market’s hair-trigger response to the committee vote suggests real convexity around the outcome. But a statute does not print money. If the bill passes into a liquidity drought, the plausible result is a strong repricing that then stalls at the trendline instead of reaching a new cycle high, the difference between closing the discount and starting a bull market. If it fails, the floor gets its stress test with no cushion, and the parameterization debate, 58,000 versus 51,000, stops being academic. Elsewhere in the market, the same liquidity question is being answered asset by asset: capital that stayed in crypto has crowded into the few networks with visible usage growth, a concentration visible across the tokenization trade, leaving Bitcoin to trade almost purely on macro.
What to watch while the market drifts
Before the gauges, a word on method, because the practical difference between the two camps is not belief but execution. The accumulation zone framework, taken seriously, argues for scaling over timing: building exposure in defined tranches as price approaches the floor, sized so that a breach of 58,000 is survivable and a visit toward the alternative fits near 51,000 is a continuation of the plan, not its failure. It argues for instruments matched to a months-long horizon, since the model’s own history says the zone can persist for two to four quarters before resolving, and leveraged expressions of a patient thesis are how correct analysis produces liquidated accounts. And it argues for treating a confirmed weekly close below the floor as a thesis review trigger, a scheduled reassessment, not a panic exit, because the difference between the tactical line and the structural one is 40,000 dollars wide. The missing-catalyst framework, taken equally seriously, adds only one amendment: let the macro data, not the price, decide when the accumulation window is closing. Buying the zone is a bet that liquidity returns eventually. Watching the liquidity gauges is how eventually gets a date. Neither camp needs to convert the other for both to be useful; one supplies the map of where value lives, the other supplies the clock that says when the market will agree.
Four gauges will signal the regime change before the price does. Global money supply growth is the master variable; Timmer’s entire framework waits on its second derivative turning positive, and any coordinated easing impulse, from the Fed or elsewhere, is the starting gun the model requires. ETF weekly flows are the institutional thermometer; one 221 million dollar day means nothing, but a month of sustained net inflows through a flat tape would mark the return of the allocator bid. The Bitcoin-to-gold ratio recovering from its negative 100 percent extreme would show relative capitulation has ended even before absolute prices move. And a confirmed weekly close below the 58,000 zone would be the model’s recalibration trigger, the signal to treat the floor as broken instead of tested, with the next published fits clustering around 51,000.
The honest conclusion is that the chart and the strategist are both right, and they are answering different questions. The power law says where: Bitcoin is entering the zone where every prior cycle’s sellers ran out, with corroborating exhaustion readings that have exactly two precedents, both of them bottoms. The catalyst analysis says when: not until liquidity returns, and possibly not for months. Accumulation zones are named for what disciplined capital does inside them, quietly and without confirmation. The word was never a promise that the bell rings at the low. It is a description of who is buying while everyone else waits for one.
Disclosure: This article does not represent investment advice. The content and materials featured on this page are for educational purposes only.


All eyes in the cryptocurrency community were on Strategy after last week’s sale and Michael Saylor’s cryptic message on X yesterday.
On the positive side, the company didn’t announce a new BTC sale today. On the other hand, it didn’t increase its cryptocurrency exposure either.
Instead, the firm’s former CEO and co-founder said that the company has increased its USD reserve by another $450 million after raising the funds via an at-the-market common stock offering. The greenback stash has now grown to $3 billion, allowing a few years of dividend payments if necessary.
What’s most important for the cryptocurrency industry is the fact that the company managed to do this without offloading more BTC. As such, its bitcoin fortune remains unchanged at 843,775 units, currently valued at just over $53 billion, given the asset’s price of $63,000.
Strategy has increased its USD Reserve by $450 million. As of 7/12/2026, we hodl ₿843,775 in our BTC Reserves and $3.0 billion in our USD Reserves. $MSTR $STRC https://t.co/OdFbjLuCTP
— Michael Saylor (@saylor) July 13, 2026
Strategy’s Sale and Stock Performance
Recall that Strategy announced its largest BTC sale to date last week when it disposed of 3,588 units. At first, the cryptocurrency’s price tumbled immediately by a few grand before it bounced back to its starting point.
Analysts continue to debate what the long-term ramifications are for bitcoin and its largest accumulator. Interestingly, Strategy’s main stock (MSTR) jumped from $95 to over $100 after the news went live but lost all momentum by the end of the week.
On the other hand, STRC recovered from the local lows of under $75 to close on Friday at over $87 as investors seemingly priced in Strategy’s decision to increase its USD reserve.
Before today’s announcement, Saylor hinted at a new major move on X yesterday. Unlike all previous instances when his words preceded a BTC buy, this time there was a lot of uncertainty given the recent history.
The post Saylor’s Strategy Boosts USD Reserves by $450M Without Selling BTC: Here’s How appeared first on CryptoPotato.

Bitmine Immersion Technologies, the former bitcoin miner turned massive Ethereum accumulator, continues to increase its altcoin exposure by snapping another 30,567 tokens over the past week.
Its total has grown to 5.77 million coins, and the latest purchase cements its position as the world’s largest corporate holder of Ethereum.
Coming for 5% Supply
The company has long stated that its mission is to accumulate and control 5% of Ethereum’s total supply. With its latest acquisition, it has further neared that goal as it now controls over 4.8% of the project’s circulating supply of 120.7 million coins.
The firm’s chairman, Tom Lee, continues to be highly bullish on ETH’s long-term future, arguing that two structural trends keep supporting the asset: the growing tokenization of traditional financial assets and increasing demand for blockchain infrastructure from AI-powered applications.
He added that regulatory developments such as the highly anticipated CLARITY Act could further accelerate institutional adoption of smart contract platforms. Moreover, he focused on Robinhood’s new mainnet launch this month, which is another Ethereum-related initiative that became an instant sensation.
“One of the biggest crypto success stories in 2026 is the breakaway success of the Robinhood Chain L2 mainnet on July 1, built on Arbitrum. Already, dollar volumes have exceeded $1 billion, and Robinhood Chain now has more trading volume than any other decentralized exchange (DEX), demonstrating the outstanding utility and product market fit for Ethereum, which is the underlying chain,” noted Lee.
He said Robinhood Chain utilizes ETH as the native gas token, and all transaction fees are denominated in the world’s largest altcoin before being settled on Ethereum. This means that Robinhood’s 27 million user base is now paying crypto fees denominated in ETH. In other words, “everyday users are starting to see ETH as money.”
Staking Business Grows
Bitmine continues to deploy its ETH stash for staking as the firm has put over 4.9 million coins to work through its own institutional platform MAVAN. By becoming one of the largest Ethereum validators globally, the company projects approximately $235 million in annualized staking revenue.
It plans to stake all of its holdings, which would increase that expected amount to roughly $277 million.
The post Bitmine Snaps Up Over 30,500 ETH as Tom Lee Focuses on Crypto’s New Success Story appeared first on CryptoPotato.
Crypto World
Waller says Fed shouldn’t ‘fight the last war’ on inflation but warns hikes still possible

Christopher Waller, governor of the US Federal Reserve, during the Federal Reserve’s Payments Innovation Conference in Washington, DC, US, on Tuesday, Oct. 21, 2025.
Aaron Schwartz | Bloomberg | Getty Images
Federal Reserve Governor Christopher Waller on Monday expressed concern about inflation but cautioned against “fighting the last war,” saying the central bank should wait for more data before raising interest rates.
In remarks delivered for a speech in New York, Waller said inflation has expanded beyond the often-cited drivers such as the energy price spike in tariffs. Rather, he cited other factors, particularly artificial intelligence, as root causes for why price increases have held stubbornly above the Fed’s 2% target.
Waller warned that “the desire to avoid past mistakes is often the author of new ones.”
“I am cognizant of the mistake we made in 2021 by not responding sooner to the high inflation we observed, and I am determined to avoid repeating it,” he said.
However, he said that doesn’t reflexively mean raising interest rates to head off the current spate of price increases.
Waller said there is still “a credible case for inflation to begin to fall back” but noted there is an “equally plausible” scenario where inflation could stay elevated or increase, “requiring tighter monetary policy in the near term.”
The policymaker emphasized a deliberate approach as policymakers evaluate the root causes of inflation, which he listed as tariffs implemented in 2025, the rising energy prices associated with fighting in the Middle East – and “spillovers from demand” from artificial intelligence.
“As always, we need to avoid making the mistake of fighting the last war and reacting too soon to tighten inflation, merely because we waited too long last time,” he said. “But we also must avoid repeating the same mistake we made in 2021 and 2022 by waiting too long to respond.”
Waller cited two factors working in the Fed’s favor this time around: A stronger labor market that isn’t a meaningful source of inflation, and well-anchored inflation expectations, at least by market-based measures.
He cautioned, though, against becoming complacent.
“I often hear people say that because inflation expectations are anchored, central bankers do not have to respond to above-target inflation. This view is wrong,” he said. “Sternly staring at inflation until it melts before our withering gaze is not an option.”
Waller’s remarks come the day before the Bureau of Labor Statistics releases its June reading on the consumer price index. Economists surveyed by Dow Jones expect the gauge to show a decline of 0.2% for the month on the all-items headline reading, owing to a sharp decline in oil, and a 0.2% core increase excluding food and energy. On an annual basis, that would take the headline reading down to 3.8%, from 4.2% in May, and core to 2.8%, from 2.9%.
“I would be very pleased to see a lower reading on core inflation, but after its escalation over the first half of this year, I will need to see several months of lower readings to feel that inflation is moving in the right direction,” Waller said. “For the reasons I have laid out today, I think that is still a reasonable outcome, and I would then continue to hold the policy rate at its current target range.”
The Fed meets again in late July, with markets pricing in about a 39% chance of a rate increase, according to the CME Group.
With the death of Senator Lindsey Graham and another senator hospitalized, Republicans’ current majority in the chamber has been reduced to 51-47, likely requiring more Democratic support to pass crypto market structure.
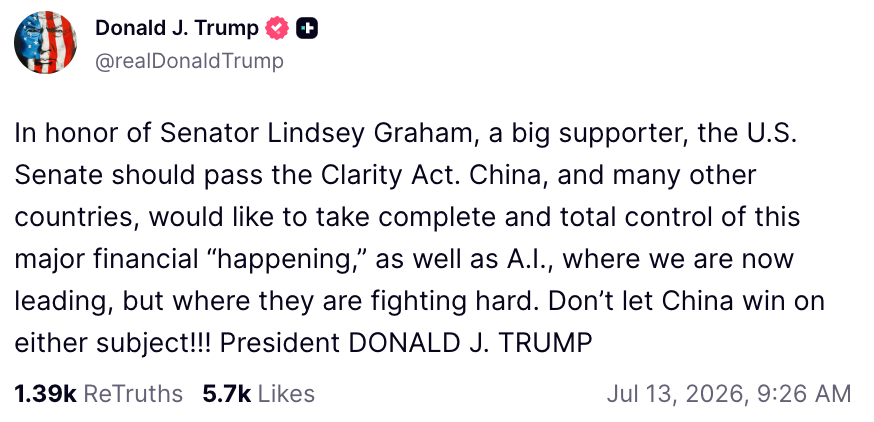
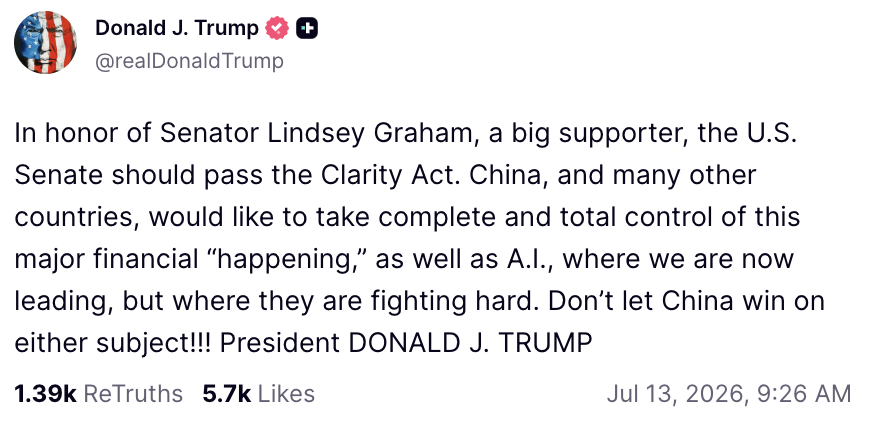
US President Donald Trump is urging members of the Senate to pass the Digital Asset Market Clarity (CLARITY) Act “in honor of” Senator Lindsey Graham, who died over the weekend.
In a Monday Truth Social post, Trump said that Graham had been “a big supporter” of the CLARITY Act, calling on the Senate to pass the legislation. The chamber has four weeks in session before a month-long state work period in August, giving lawmakers a small window of opportunity to pass the crypto market structure bill. Graham died at age 71 on Saturday.
Source: Donald Trump
Graham, a South Carolina lawmaker who served in the Senate since 2003, did not serve on the banking committee or agriculture committee in the current session of Congress, and did not cast any vote advancing the CLARITY Act. He voted in favor of the Guiding and Establishing National Innovation for US Stablecoins (GENIUS) Act in 2025, but did not appear to have made any public statements directly supporting CLARITY.
The crypto market structure bill is expected to shift much of the authority for enforcing digital asset regulation and oversight from the US Securities and Exchange Commission (SEC) to the Commodity Futures Trading Commission (CFTC). However, many Senate Democrats have signaled that they will not support the legislation without provisions to address potential conflicts of interest between lawmakers and the crypto industry, some citing Trump’s ties to projects like his memecoin and his family’s World Liberty Financial company.
Related: US CBDC ban to go into effect without Trump signoff on housing bill
With the death of Graham and Senator Mitch McConnell hospitalized, Republicans’ current majority in the Senate has been reduced to 51-47, likely requiring additional support from Democrats to meet the 60-vote threshold to pass the crypto bill. Cointelegraph sought comment from the offices of Senators Tim Scott, Kirsten Gillibrand and Angela Alsobrooks for a reaction to Trump’s comments but did not receive an immediate response.
In a Monday X post, Senator Cynthia Lummis said she supported Trump’s comment, adding Graham “was passionate about ensuring that American leadership stayed at the forefront of everything – including digital assets.” Cointelegraph also contacted Lummis’ office for clarification on Graham’s position on digital assets but did not receive an immediate response.
Magazine: Crypto’s CLARITY Act faces partisan fight over ethics on Senate floor
This is a developing story and will be updated as more information is available.


Circle Internet Group’s (CRCL) final approval from the Office of the Comptroller of the Currency to establish First National Digital Currency Bank is a positive milestone, but investors may be overestimating its significance, according to Japanese investment bank Mizuho.
“While a positive development, we believe the market reaction is likely overly optimistic, as this does not resolve fundamental issues that have been hurting the stock of recent,” analysts led by Dan Dolev said in the Friday report.
Shares of the stablecoin issuer closed 5% higher on Friday following the news. The stock on Monday has given back most of those gains, trading 4.7% lower at $63.03 at publication time.
Mizuho reiterated its neutral rating, arguing that the regulatory approval does not resolve the fundamental issues weighing on the stock.
Those challenges include a decline in USDC’s market capitalization since March 2026, which the bank said raises questions about the stablecoin’s growth trajectory.
The second-largest cryptocurrency has staged a minor resurgence over the past week, while numerous analysts believe a much more substantial pump could be on the way.
Certain technical indicators support the bullish outlook and may indeed set the stage for a more meaningful recovery.
Is ETH Ready to March?
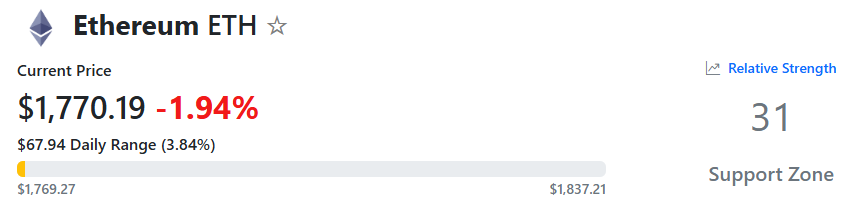
After the devastating June lows, the bulls clawed back some of the losses and even briefly pushed the price above $1,800 over the weekend. However, the bears offered strong resistance, and ETH currently trades at around $1,750 (per CoinGecko), representing a 1% increase for the past week.
According to X user Ted, such a level can be considered a good sign and shows that sellers no longer dominate. He believes that holding above the $1,750 support zone is crucial and could open the door to a rally towards $2,000.
Michael van de Poppe was even more optimistic, expecting the next breakout to push ETH to $2,500. For their part, AlΞx Wacy claimed that the asset needs to break above a certain descending trendline that has historically fueled 250% pumps in weeks. The analyst pointed out that this critical threshold sits at around $1,880.
Altcoin Sherpa gave their two cents, too. While noting ETH’s price decline over the last several months, the analyst described it as “pretty attractive” in the short term with potential to climb to around $2,500.
Ali Martinez also chipped in, vowing to open a long position in ETH if its price surpasses $1,850. It is important to note that his previous take on the asset was rather bearish, outlining that its TD Sequential indicator flashed a sell signal and that could be followed by a plunge to as low as $1,700.
The Bullish Metrics
ETH’s Relative Strength Index (RSI) reinforces the predominant optimism shared by the aforementioned analysts. The technical analysis tool, whose ratio runs from 0 to 100, has fallen to around 30, indicating that the asset has entered oversold territory and could be on the verge of a rally. Conversely, readings above 70 are interpreted as pre-pullback signals.
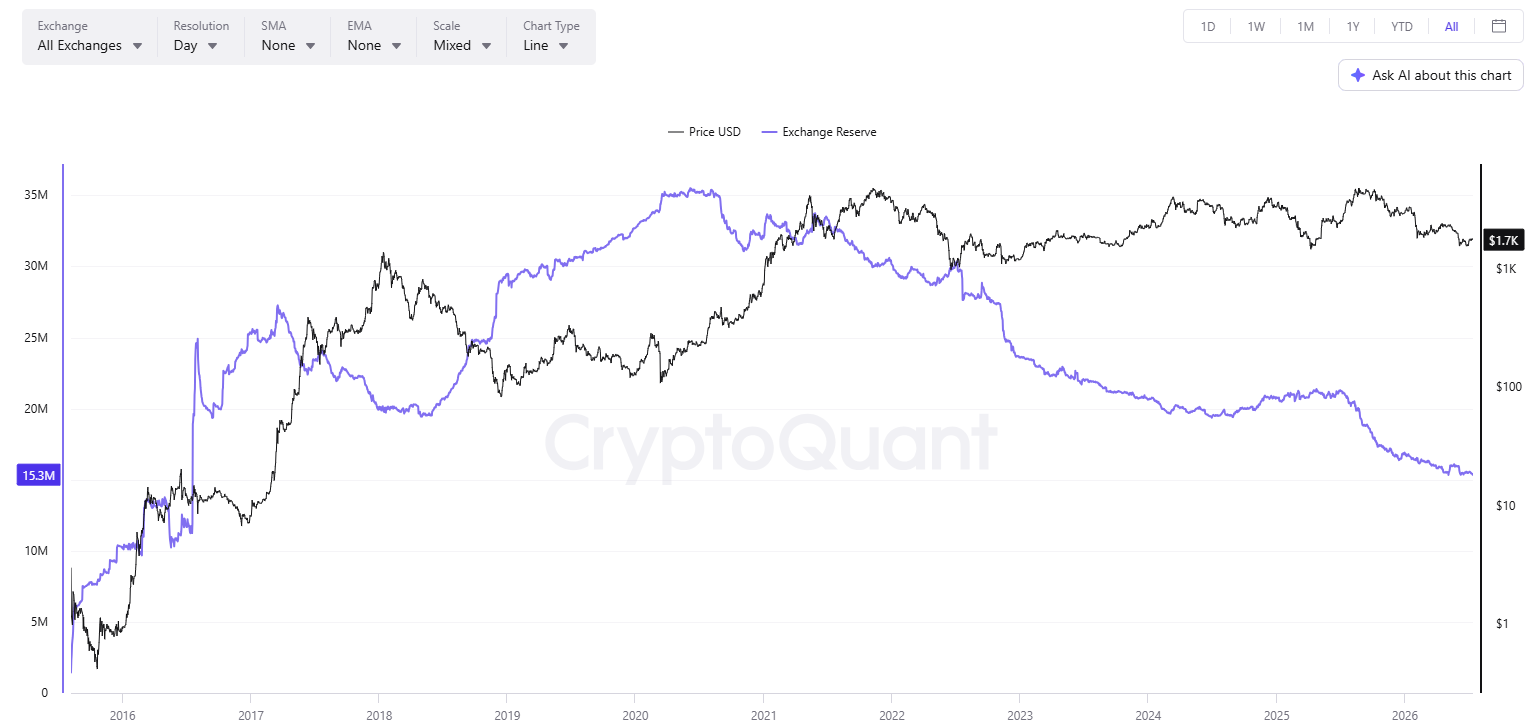
Next on the list is the declining amount of ETH stored on exchanges. Today (July 13), the figure dropped to a nearly ten-year low of around 15.3 million units. Fewer coins on centralized platforms usually result in reduced immediate selling pressure.
The post Top Ethereum (ETH) Price Predictions as of Late appeared first on CryptoPotato.

President Trump declaration that the United States would “probably” take control of the Strait of Hormuz, and should be compensated for doing so, landed on crypto and markets like a macro grenade. Bitcoin was already trading near $64,000 before the comments added another geopolitical headache to an already fragile market. The full effect on crypto is still playing out.
Trump’s remarks, made on Monday, hint at a possible U.S. shift toward direct control of one of the world’s busiest oil chokepoints. Around 20% of the global oil supply passes through the Strait of Hormuz each day. Unsurprisingly, risk assets reacted first, with crypto traders stepping back alongside sellers in tech stocks.
— Coin Bureau (@coinbureau) July 13, 2026
 TRUMP: COUNTRIES WILL PAY THE US “A LOT OF MONEY” FOR GUARDING THE STRAIT OF HORMUZ
"We're going to keep the Strait and we'll probably run it."
"We'll become the Guardian of the Strait. Maybe you'll call it the Guardian Angel of the Strait."
"And we should be reimbursed for… pic.twitter.com/9aPHAXcsAi
At the same time, the Senate Agriculture Committee advanced a crypto market structure bill along party lines. It marked another regulatory step forward, although the split vote showed Washington still cannot agree without a fight. Politics and crypto have never exactly been best friends.
Both developments are now feeding the same trade: risk off. Trump influence on crypto policy has repeatedly moved markets, and his Hormuz comments only raise the stakes. For now, traders seem more interested in protecting capital than chasing the next green candle.
Discover: The Best Token Presales
Can Bitcoin Hold Its Crypto Support as Trump Geopolitical Risk Mounts?
Bitcoin price prediction has turned cautious after BTC slipped below $64,000. The weekly low sits near $61,700, making the $61,500 to $62,000 zone the line in the sand. If that level fails, the next stop could be the upper $50,000s. Two weeks ago, that sounded far-fetched.
Even so, the recent selling has not been driven by crypto alone. Money has also flowed out of other risk assets, showing this is a wider market move. That is a small comfort, though. If fear came through the front door together, confidence may need a macro spark before it walks back in.

The bullish case remains straightforward. If Hormuz tensions ease and crypto legislation regains momentum, Bitcoin could reclaim the $64,000 to $65,000 area. That would likely catch late bears leaning the wrong way. Markets have a habit of making the largest crowd look clever, right before proving them wrong.
The base case is less dramatic. Bitcoin may keep chopping between $62,000 and $64,000 while traders wait for clearer signals. That kind of price action often tests patience more than conviction. Sideways markets can feel longer than they really are.
The bear case stays valid if Bitcoin closes below $61,500 on strong volume. Fresh escalation around Hormuz or disruption to oil supplies could deepen risk aversion. Previous oil shocks have kept Bitcoin under pressure for longer than many expected.
Discover: The Best Crypto to Diversify Your Portfolio
Bitcoin Hyper Eyes Early-Mover Positioning as BTC Tests Critical Support
With Bitcoin stalling below $64,000 and macro risk dominating sentiment, spot BTC upside at the current market cap requires a significant catalyst to materialize quickly. Traders looking to express Bitcoin conviction at an earlier point in the risk curve are increasingly eyeing infrastructure plays.
Bitcoin Hyper ($HYPER) is positioning itself at that intersection. It is the first Bitcoin Layer 2 with Solana Virtual Machine (SVM) integration. Hyper’s smart contract execution speed that competes with Solana itself, while anchoring to Bitcoin’s security layer.
The presale has raised $33 million to date at a current price of $0.013683, with staking incentives live. Features include a Decentralized Canonical Bridge for BTC transfers and sub-second transaction finality, directly addressing Bitcoin’s core friction points around speed, fees, and programmability.
For traders who want Bitcoin ecosystem exposure without chasing spot BTC at a $1.4 trillion market cap, the risk/reward calculus is structurally different. Research Bitcoin Hyper before the presale window closes.
Don’t Miss Out on Our $1,000 USDT Airdrop on ByBit
The post Trump Says the US will Control Hormuz, Crypto at His Mercy appeared first on Cryptonews.
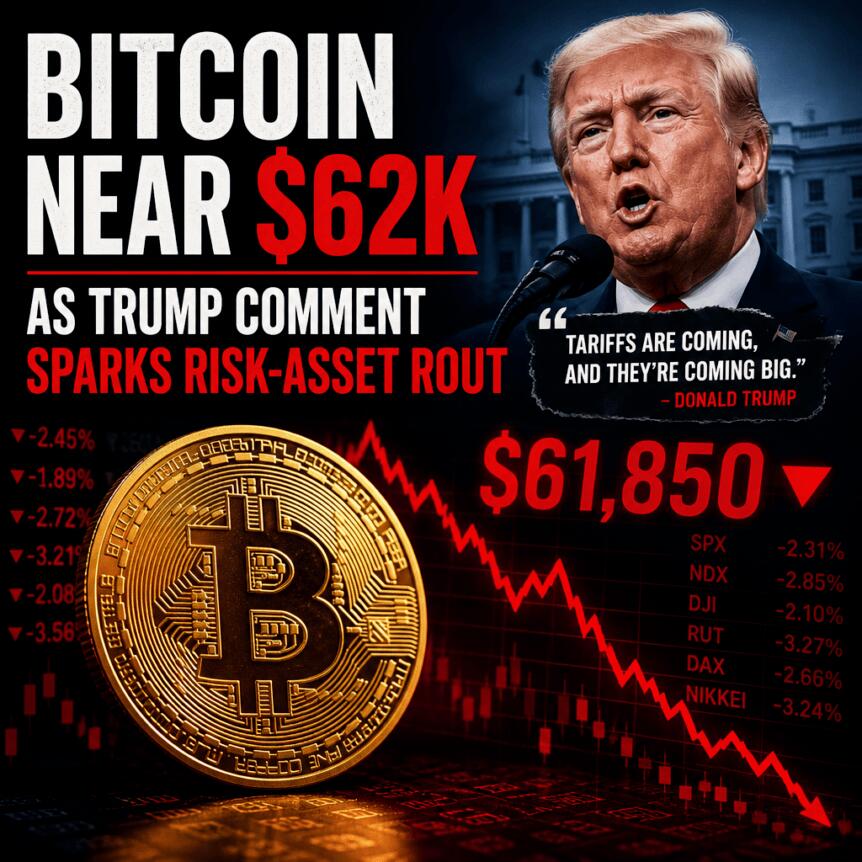
Bitcoin weakened further at the start of Monday’s Wall Street session as investors digested renewed US–Iran tensions, with the cryptocurrency sliding toward the $62,000 area. The move came alongside risk-off weakness in US equities, while energy markets held firm after heightened developments involving the Strait of Hormuz.
On the political front, US President Donald Trump said the United States would “run” the Strait of Hormuz after Iran closed the route over the weekend—an escalation that helped keep oil prices elevated and added uncertainty for broader markets. Against that backdrop, some traders described aggressive BTC short positioning and pointed to key intraday levels that could determine whether selling continues or sparks a rebound.
Key takeaways
- Bitcoin slid toward roughly $62,000 as US stocks opened lower and sentiment was pressured by US–Iran escalation.
- Trump’s comments about taking over the Strait of Hormuz coincided with firmer oil prices, with WTI hovering around the mid-$70s.
- Traders cited “massive” short activity into the pre–New York open, with price pinned near a volume-weighted average level (mVWAP) that bulls may need to defend.
- Despite the weakness, some market participants still see a path back toward the $70,000–$75,000 zone, citing exhaustion signals and exchange data.
Bitcoin tests key levels as shorts lean in
Market charts from TradingView showed BTC/USD edging toward the $62,000 region as Monday’s session got underway. One trader highlighted what they described as “massive” short trading into the period leading up to the New York open, arguing that price was being pushed directly toward mVWAP—a level bulls typically watch because it represents the average traded price weighted by volume across exchanges.
In a post on X, JDK Analysis said the market was “now sitting directly at mVWAP,” adding that $60,000 could resurface if the level fails. JDK also suggested the selloff looked “very weak,” but that a bounce remained possible if New York attracts meaningful spot demand and mVWAP holds, potentially trapping some short sellers.
Other participants echoed the bearish flow. Exitpump, for example, previously flagged a “crazy amount of aggressive shorting” while also noting that open interest appeared to be rising—an observation often associated with expanding derivatives positioning as price moves.
Oil steadies higher on Strait of Hormuz escalation
The BTC pullback also tracked broader macro conditions at the open. US stocks were broadly lower, with the Nasdaq Composite down about 1% at the time of writing, reinforcing a cautious risk tone across markets.
Energy prices remained supported by geopolitical risk tied to the Strait of Hormuz. According to Fox News’ live coverage, Trump said the US would take responsibility for the strait, describing the country as a “guardian” and suggesting it should be “reimbursed” for that role. Reuters and other outlets have frequently framed the Strait as a key international oil shipping route, meaning disruptions or heightened control can quickly spill into expectations for supply and transportation risk.
In crypto markets, that matters because sustained oil-driven inflation and risk premium shifts can influence both liquidity conditions and investor appetite for high-beta assets like BTC—especially during periods where derivatives positioning is already crowded.
WTI crude was reported by TradingView to be circling around $75 per barrel, holding gains as traders priced in continued uncertainty.
Traders still target a rebound toward $70,000
Even with the sell pressure, some traders continued to argue that downside momentum could be nearing exhaustion. Roman, a trader who previously laid out bullish expectations, said on X that several metrics pointed toward a move higher and that timing depended on how the market forms on the way up.
Roman specifically referenced higher-timeframe and lower-timeframe signals, while also pointing to exchange-related observations suggesting that more spot was being bought than sold. He pointed to a potential upside window in the $70,000–$75,000 area, implying that shorts could face a squeeze if buyers regain control and derivatives demand flips.
Importantly for readers, these views do not negate the immediate weakness: they frame the current trading as potentially offering a setup for a rebound rather than a straight line reversal. In markets where price is pinned near levels like mVWAP, bulls typically look for confirmation through sustained spot buying and follow-through after the open.
What to watch next: confirmation, spot demand, and derivatives positioning
For traders trying to gauge whether the current dip evolves into continued downside or a tactical bounce, the near-term focus is likely to remain on whether BTC can hold key intraday benchmarks such as mVWAP and whether spot demand increases during US trading hours. At the same time, monitoring open interest and the pace of short activity could help signal whether the market is building new bearish exposure—or if shorts are starting to get forced out.
With geopolitical headlines still capable of moving both oil and risk sentiment, the next session’s order-flow and follow-through (rather than any single forecast) may determine whether Bitcoin’s $62,000 test turns into a deeper move toward lower support levels or a renewed attempt at reclaiming the $70,000 area.
A revised CLARITY Act draft merging the Senate Banking Committee and Senate Agriculture Committee bills is expected this week, adding roughly 70 pages to the text, but the ethics provision Senate Democrats have made a precondition for their votes is not included.
Without that language, securing the seven or more Democratic votes needed to clear the 60-vote threshold for Senate cloture looks structurally difficult before the August recess.
The vote arithmetic is straightforward: Republicans hold 53 seats, meaning the bill needs at least seven Democrats to cross 60. The ethics standoff has been the central obstacle since Democrats first laid out their full demands last year, and that dynamic has not shifted with this draft.
One person familiar with the talks said directly that without the ethics language, sufficient Democratic support will be difficult to secure.
Galaxy Research has revised its 2026 passage odds down from 75% following Senate Banking Committee clearance to roughly 50-50. Prediction markets currently show approximately 37% odds of passage before August, a number that reflects the compressed timeline as much as the substantive impasse.
Discover: The Best Token Presales
What Democrats Are Demanding, And Why the White House Won’t Budge
The ethics provision at issue, Section 604 conflict-of-interest language, would bar senior government officials, elected officials, and their immediate family members from holding financial interests in or profiting from crypto assets while in office.
Sen. Kirsten Gillibrand (D-NY) has been unambiguous: no ethics language, no Democratic votes. The Van Hollen ethics amendment was defeated 13–11 along party lines in committee, and the White House has indicated it will not accept language that specifically targets the President – a direct reference to the Trump family’s crypto holdings and business interests.
— Ash Crypto (@AshCrypto) July 13, 2026
The U.S. House will hold a hearing on the Crypto CLARITY ACT in just 4 days, on July 17. pic.twitter.com/2f3qB2yttx
That framing makes a clean compromise difficult. Any ethics language strong enough to satisfy Gillibrand and her Democratic colleagues is, by the White House’s own definition, the kind of language it has said it will reject.
The merged draft released this week sidesteps that problem by omitting the provision entirely, which solves nothing on the Democratic vote count. Democratic positioning on crypto legislation has hardened around this issue specifically, making a floor vote without a resolution a high-risk procedural move.
Discover: The Best Crypto to Diversify Your Portfolio
The July Window and What a Miss Would Mean for Crypto Regulation
Senate Majority Leader John Thune said last month he intends to bring the bill to the floor in July. The weeks of July 20 and July 27 are the two dates under active discussion for a floor vote, both of which fall immediately before the August recess, making this the last viable legislative window before the midterm campaign cycle absorbs the Senate’s attention.
The CLARITY Act passed the House 294–134 in July 2025, cleared the Senate Banking Committee 15–9 on May 14, 2026, and now sits on the Senate Legislative Calendar awaiting floor action.
If the bill misses the summer window, analysts project its 2026 prospects deteriorate materially, the calendar resets, and there is no obvious mechanism to restart the process before midterm positioning takes over. Markets and institutional investors have been pricing in passage risk accordingly, with the bill’s progress, or lack of it – directly influencing sentiment across large-cap assets.
The optimistic path still exists: ethics language gets resolved in the three-to-four-week window after the draft release, floor vote happens late July, and the bill reaches the President’s desk in early August.
The pessimistic path, impasse holds, Democrats withhold votes, and the bill stalls, would prolong the patchwork of state regimes and enforcement-by-litigation that institutional participants have consistently identified as the primary barrier to deeper U.S. market participation.
The merged draft this week is a step in the legislative process; whether it is a step toward resolution or a formality before another delay depends entirely on what happens to the ethics provision in the next two weeks.
Don’t Miss Out on Our $1,000 USDT Airdrop on ByBit
The post Ethics Standoff Clouds CLARITY Act Path as July Vote Window Narrows appeared first on Cryptonews.
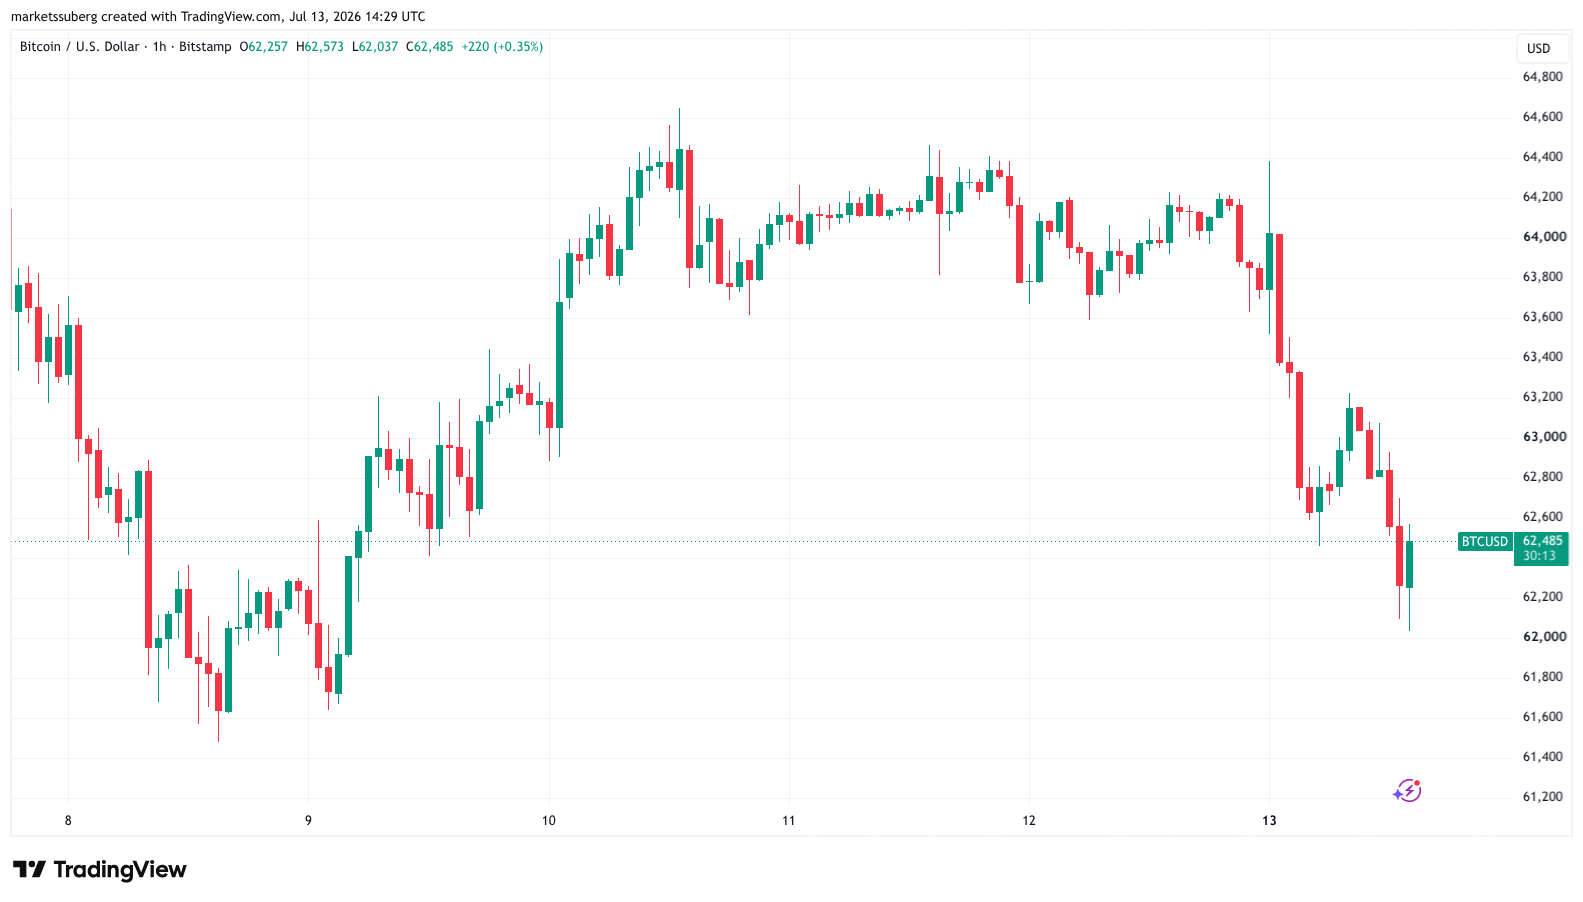
Bitcoin (BTC) fell further into Monday’s Wall Street open as markets reacted to the US-Iran escalation.
Key points:
- Bitcoin falls toward $62,000 as losses intensify on nerves over the US-Iran war.
- Donald Trump says that the US should “run” the Strait of Hormuz as a tug-of-war with Iran continues.
- BTC price action is described as “very weak”, but a $70,000 rebound prediction remains in place.
Oil rises amid “aggressive” BTC shorting
Data from TradingView showed BTC/USD edging closer to $62,000 amid what a trader described as “massive” short trading.
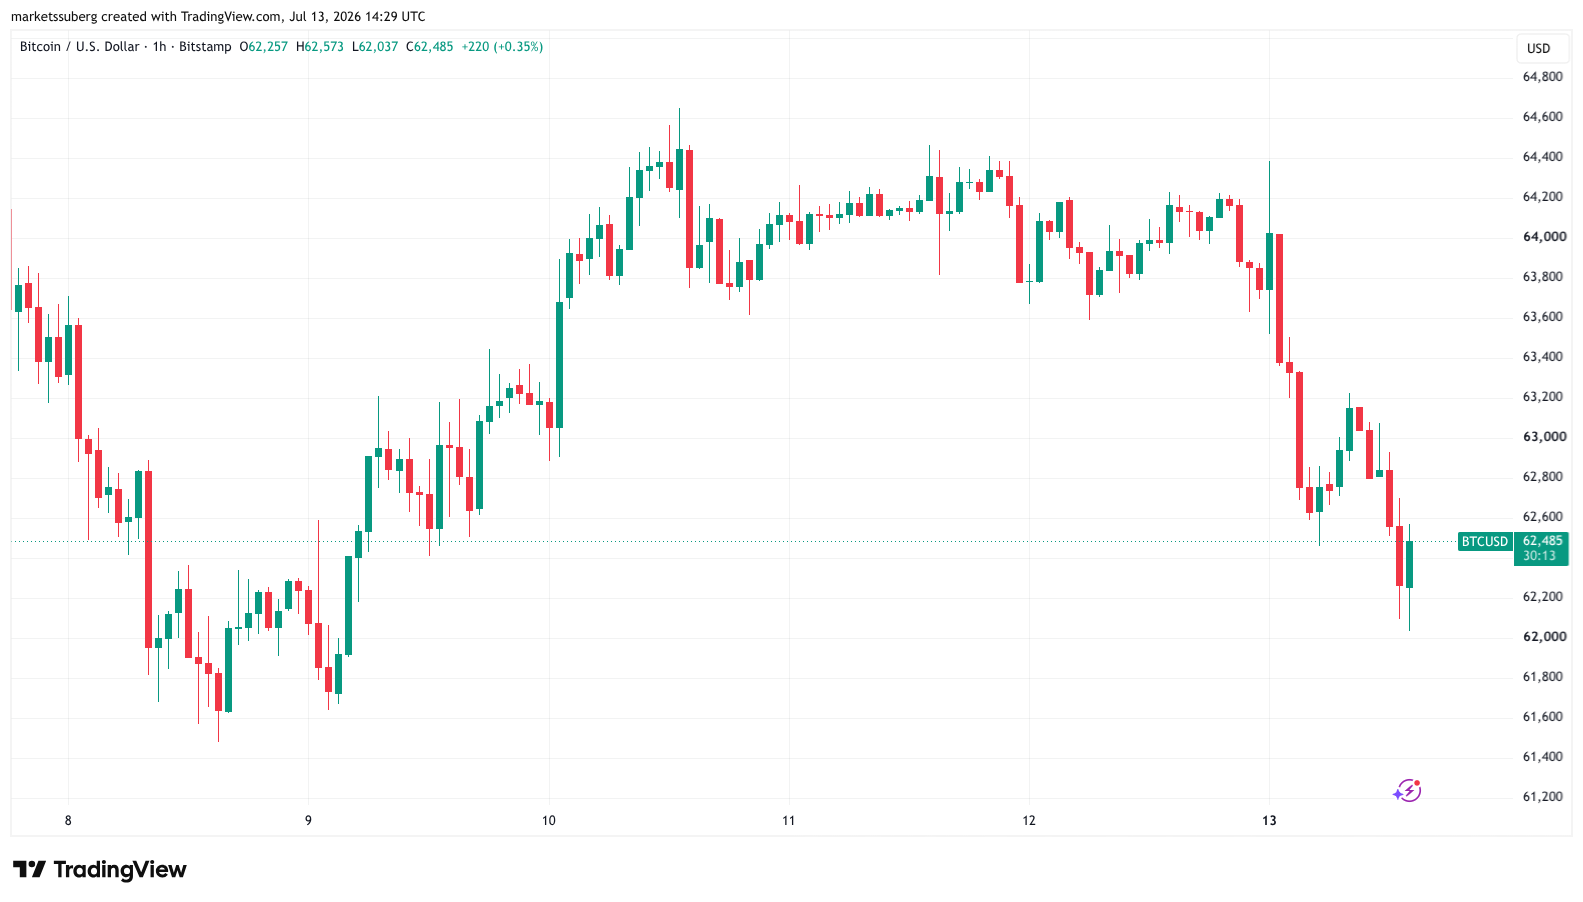
BTC/USD one-hour chart. Source: Cointelegraph/TradingView
US stocks were broadly in the red at the open, with the Nasdaq Composite Index down 1% at the time of writing.
Speaking to Fox on the day, US President Donald Trump said that the US would be taking over the Strait of Hormuz, a key international oil route, which Iran closed at the weekend.
“We’re going to keep the strait, and we’ll probably run it. We’ll become the guardian of the strait. Maybe we’ll call it the ‘guardian angel’ of the strait. And we should be reimbursed for that,” he said.
Oil prices stayed higher, with WTI crude circling $75 per barrel.
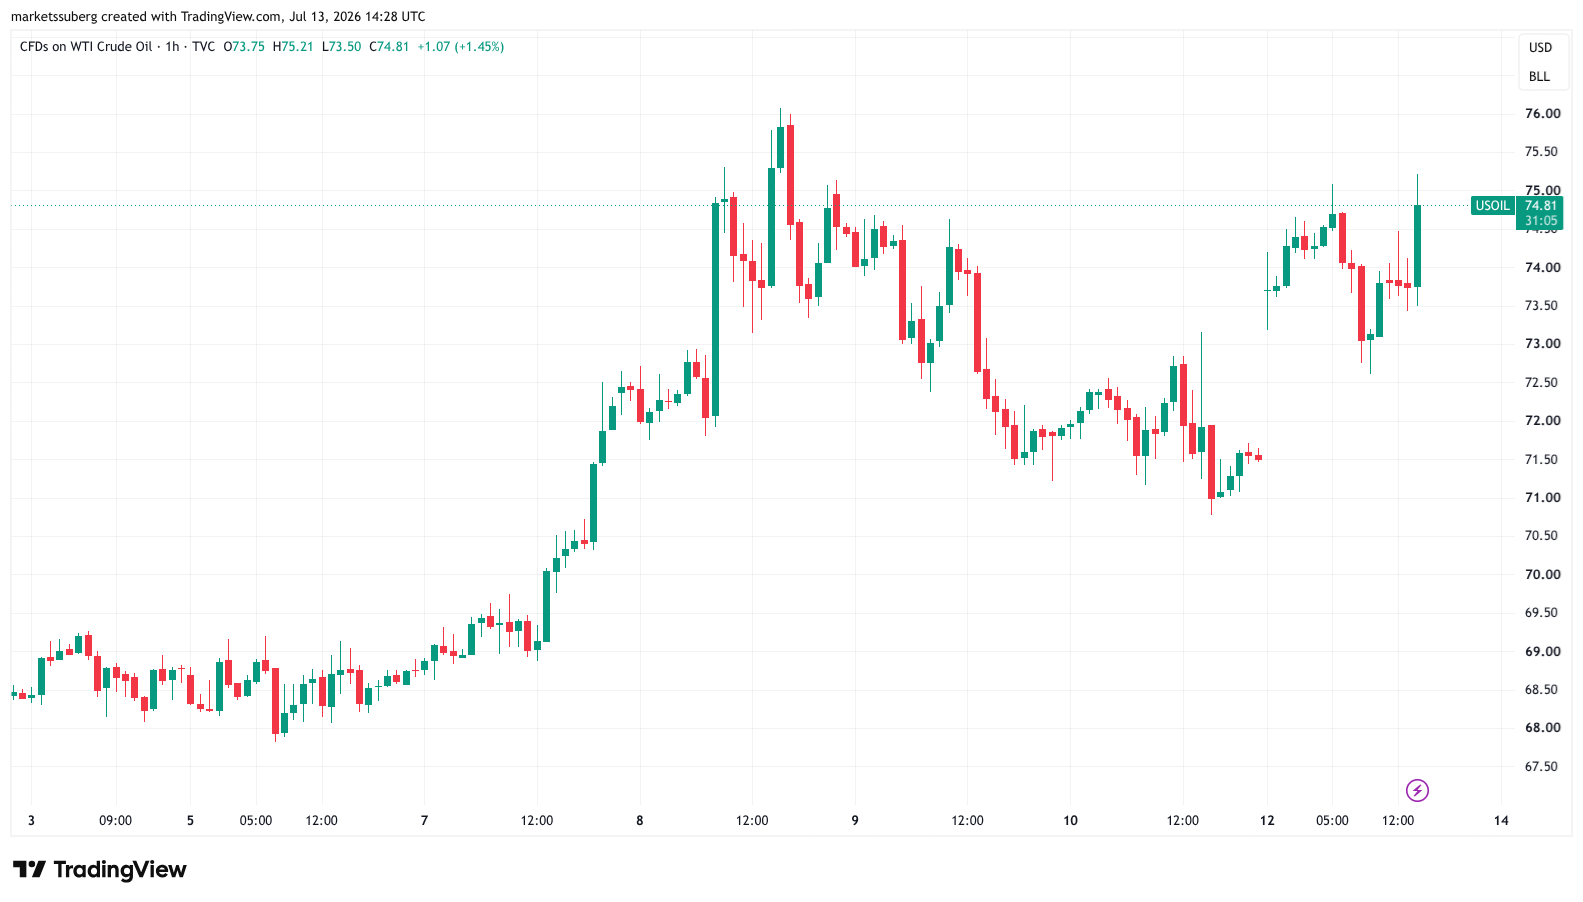
CFDs on US WTI crude oil one-hour chart. Source: Cointelegraph/TradingView
Bitcoin saw pressure, with sellers firmly in control after an initial drop following the weekly close.
“Massive shorting into this pre NY-open drop. Price is now sitting directly at mVWAP, a key level bulls need to defend!” analytics account JDK Analysis wrote in a post on X.
The post referred to the volume-weighted average price across exchanges, warning that $60,000 could reappear.
“With spot also selling, this still looks very weak. But if New York brings real spot demand and mVWAP holds, a bounce could trap a large number of sellers,” JDK added.
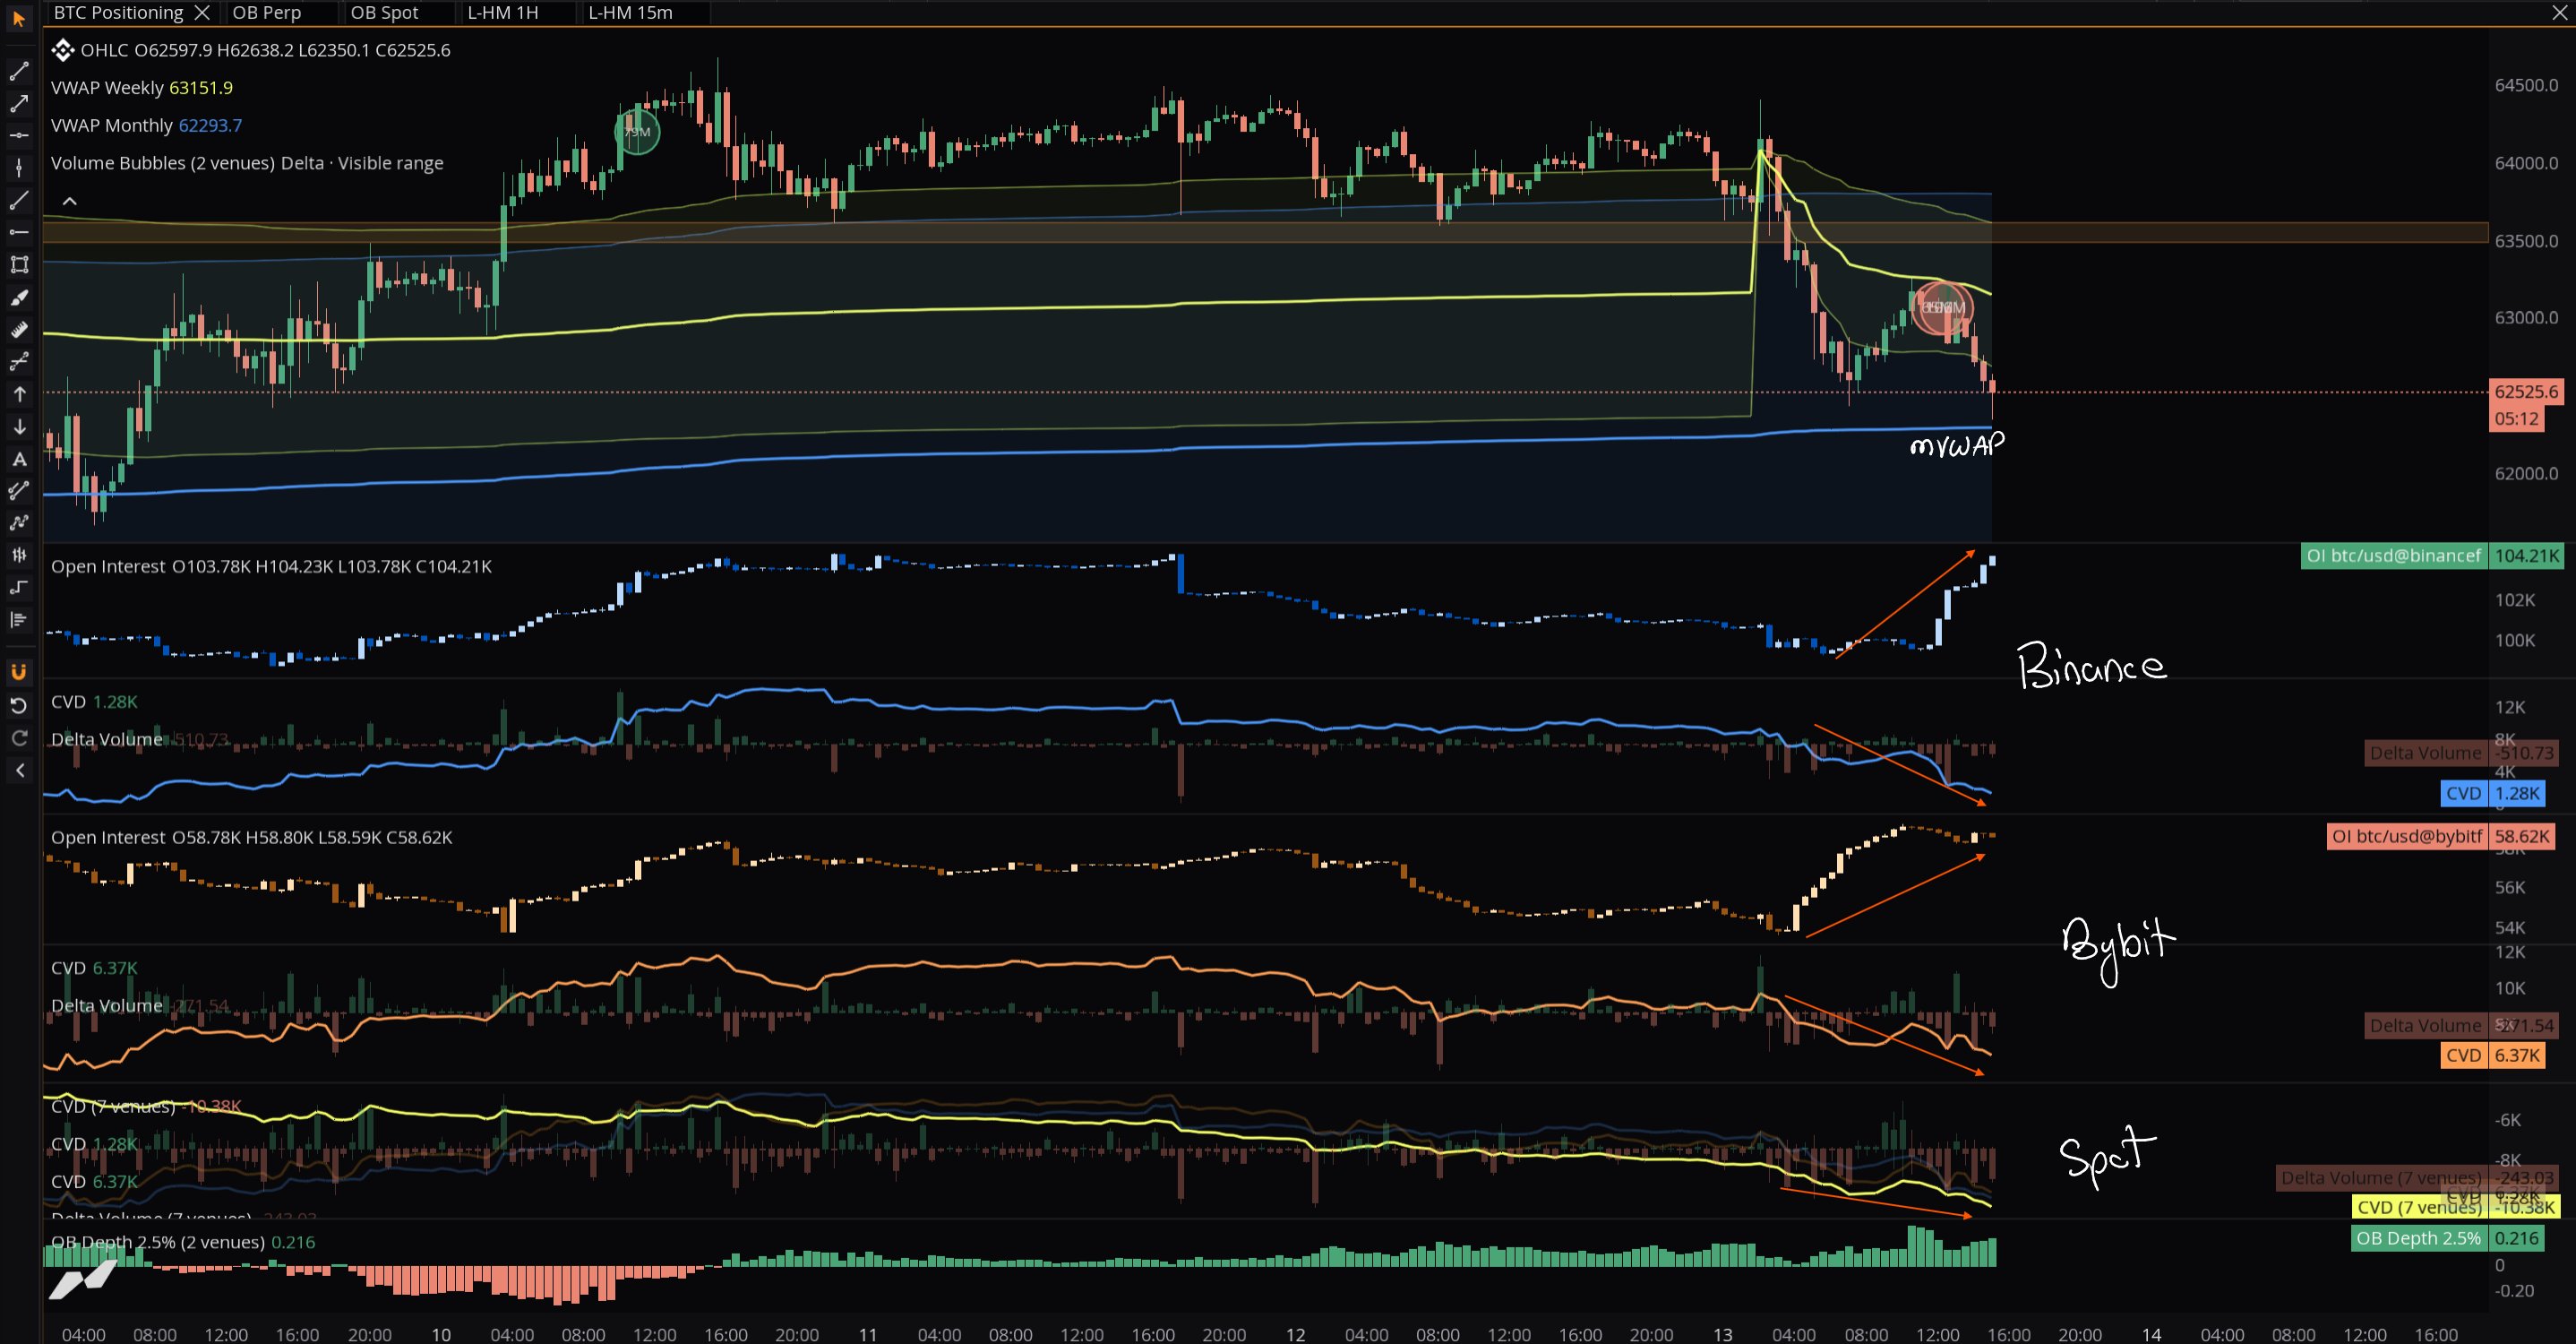
BTC/USD chart with order-book data. Source: JDK Analysis/X
Others also noticed the downward trend, with commentator Exitpump earlier reporting a “crazy amount of aggressive shorting” while open interest continued to rise.
Bitcoin upside targets still see $70,000 returning
Those making the case for a rebound on the day included trader Roman, who retained his new bullish bias.
Related: BTC price bull market to begin in September? Five things to know in Bitcoin this week
In an X post, Roman highlighted several price metrics, including the relative strength index (RSI) and volume, showing downside exhaustion.
“I believe a move higher is coming it all just comes down to formation and how we get there,” he wrote.
“Lots of HTF & LTF indications for 70-75k area + exchange data is showing that more spot is being bought than sold. It’s a matter of when not if.”
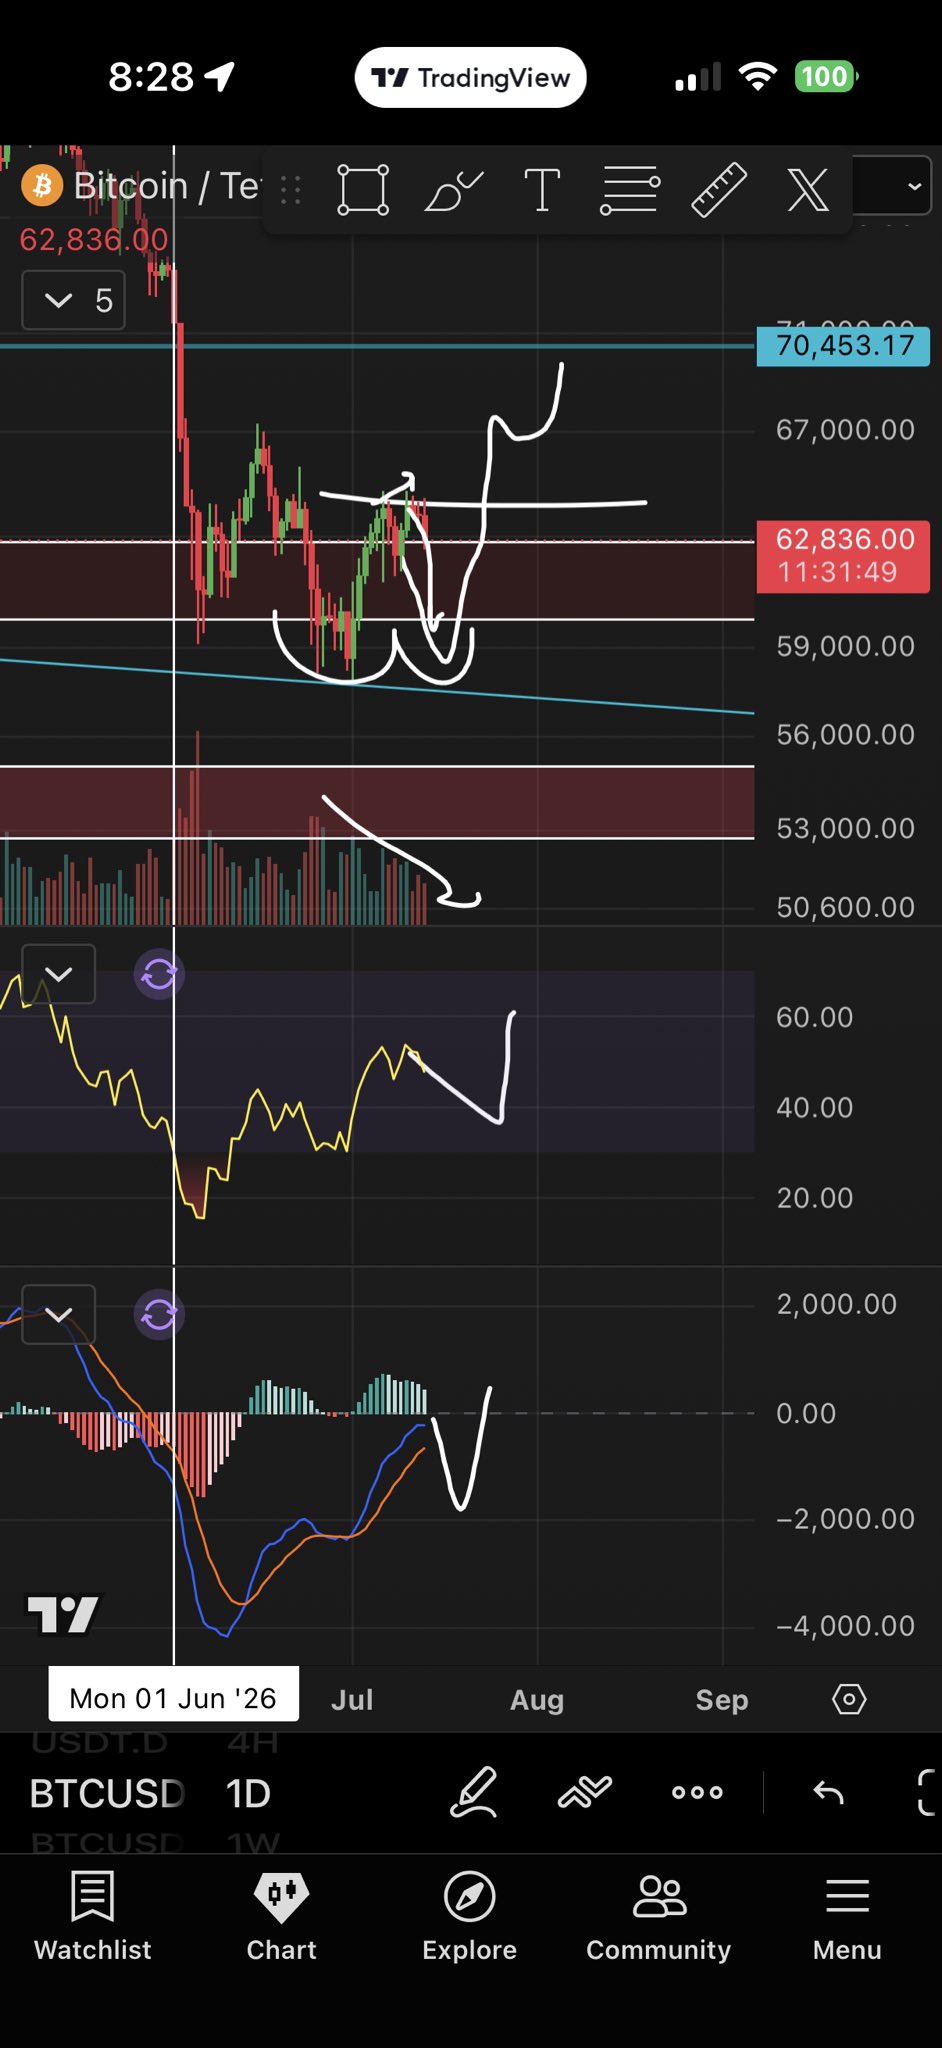
BTC/USD one-day chart. Source: Roman/X
Earlier, Cointelegraph reported on various expectations of continued BTC price upside this month before bearish continuation, ultimately ending in a Q3 macro bottom.

Abhishek Sharma The Target Of Social Media Users Using AI To Spread Rumours, Delhi High Court Says This

What Size Chainsaw Do You Need To Cut Trees? Here’s What You Should Know

Grade 11 Gen Math | Application of Sequence and Series Financial Problem First Term (Term 1) Week 5


-

 News Videos7 days ago
Whats Hidden Inside This Cash Register? #treasure #reselling #money
-

 Fashion4 days ago
Loro Piana Fall 2026 Enters Houston’s Art Scene
-

 Fashion3 days ago
Weekend Open Thread: Nutriplenish Leave-In Conditioner
-

 Crypto World7 days ago
$1,000 Credit Alert! BlockDAG X Exchange Pre-Registration Now Officially Open, Polkadot Dips & Zcash Rebounds
-
 Tech6 days ago
Anthropic’s new “J-lens” reveals a silent workspace inside Claude that mirrors a leading theory of consciousness
-

 Business7 days ago
AXT Shares Jump Nearly 14% as Semiconductor Materials Maker Rebounds on AI-Linked Indium Phosphide Demand
-

 Sports6 days ago
Joshua Pacio ‘more complete’ ahead of ONE rematch vs Malachiev
-
 Sports4 days ago
2026 Genesis Scottish Open Thursday TV coverage: Round 1
-

 Tech6 days ago
Anthropic brings Claude Cowork to mobile and web as usage data shows most users aren’t coding
-
 Crypto World7 days ago
SK hynix (000660.KS) Stock Dips as $28B Nasdaq ADR Offering Drives AI Memory Expansion
-

 Sports3 days ago
Super Eagles star Moses Simon opens up on Liverpool transfer regret
-
Sports6 days ago
We have punished the disrespect
-

 Crypto World7 days ago
Binance lists Strategy’s STRC stock as company expands Bitcoin funding
-

 Tech4 days ago
Character.AI enters the microdrama arena with its own productions, but there’s a twist
-

 Tech7 days ago
9 Best Keyboards (2025), Tested and Reviewed
-

 Business7 days ago
Enbridge: AI Tailwind Priced In (Rating Downgrade)
-
 Crypto World6 days ago
Claude AI Created Something Anthropic Never Designed
-

 News Videos6 days ago
“What’s going on?!” Carl Froch discusses Floyd Mayweather Jr financial issues
-

 Crypto World6 days ago
Nasdaq arthritis company holding Moshe Hogeg crypto hits all-time low
-
 Entertainment7 days ago
Taylen Biggs Reveals The Celebrity She Dreams Of Interviewing
You must be logged in to post a comment Login