

Crypto World
Why did the U.S. move $297M in Bitcoin and Ether to Coinbase Prime?



The U.S. government transferred nearly $297 million in seized Bitcoin and Ether to Coinbase Prime on Monday, according to blockchain data.
Summary
- U.S. government wallets transferred nearly $297 million in seized Bitcoin and Ether to Coinbase Prime.
- The Bitcoin movement renewed questions about compliance with Trump’s strategic reserve order banning government sales.
- Coinbase Prime supports custody and trading, so the transfers do not prove an immediate liquidation.
The move renewed questions about how federal agencies plan to handle crypto covered by President Donald Trump’s reserve policy.
The transfers included about 3,940 BTC worth roughly $244 million and around 30,000 ETH valued near $53 million at the time. Arkham’s government wallet tracker recorded the movements, although changing market prices can alter their dollar value.
Seized Bitcoin and Ether reach Coinbase Prime
Galaxy Research head Alex Thorn linked the Bitcoin to seizures involving Ryan Farace, known online as “Xanaxman,” and the closed BTC-e exchange.
“These coin movements were comprised of coins seized from Ryan Farace and defunct crypto exchange BTC-e,” Thorn said.
The Ether came from wallets tied to Brian Krewson, an Oracle employee connected to a federal case involving crypto storage and money laundering. The transfers brought assets from several enforcement cases into an institutional platform used by government agencies and large investors.
Transfer does not confirm a government sale
A deposit to Coinbase Prime can allow trading, but it does not prove that officials plan to sell the assets. Coinbase Prime provides custody, execution, financing and staking services. Federal agencies may use the platform to consolidate wallets or move assets into managed custody.
The U.S. Marshals Service selected Coinbase Prime in 2024 to safeguard and trade certain forfeited digital assets. Government wallets have since sent funds to the platform several times. As reported by crypto.news, authorities moved nearly $984,000 in FTX and Alameda-linked crypto in June, with about $768,000 reaching Coinbase Prime.
Trump reserve order limits Bitcoin sales
Trump’s March 2025 executive order created a Strategic Bitcoin Reserve and a separate stockpile for other digital assets. The order says Bitcoin placed in the reserve “shall not be sold” and must remain a U.S. reserve asset.
The order also allows some exceptions under existing law. Agencies may return assets to verified victims, use them for law enforcement work or follow a court order. Ether and other non-Bitcoin holdings fall under the separate digital asset stockpile, where the Treasury can set stewardship plans within its legal authority.
Reserve structure remains unsettled
The latest movement comes while federal agencies still debate who should manage the Bitcoin reserve.Treasury and Commerce have discussed control of seized BTC while officials review custody, legal authority and the need for new legislation.
Government-linked wallets still hold about $20.5 billion in crypto, based on current tracker estimates. Bitcoin accounts for most of the total, with roughly 325,000 BTC. The wallets also hold Ether, Tether, wrapped Bitcoin and other seized assets, although public trackers may not identify every federal address.
The recorded balance can change quickly because crypto prices move throughout the day. It can also change when courts order restitution, agencies transfer custody, or investigators identify new wallets. Public dashboards therefore provide estimates rather than a complete official federal accounting.
The Monday transfers ranked among the largest government-linked moves to Coinbase Prime in 2026. In April,a federal wallet sent 2.438 BTC from a separate criminal case to the platform.
On-chain records show where funds moved, but they do not reveal the government’s final instructions to Coinbase Prime. A confirmed sale would require further wallet activity, trading records or an official statement. Until then, the transaction remains a custody or asset-management move rather than proof of liquidation.

Commodity-linked currencies strengthened after US inflation data came in weaker than expected. The Consumer Price Index (CPI) slowed to 3.5% year-on-year in June, below the 3.8% forecast, while core inflation eased to 2.6% versus expectations of 2.8%. On a monthly basis, headline CPI unexpectedly fell by 0.4%, while core CPI was unchanged. The moderation in inflationary pressure increased expectations that the Federal Reserve may adopt a more accommodative policy stance, putting pressure on the US dollar and supporting both the Australian and Canadian dollars against the greenback.
However, despite the weaker US dollar, the next move in USD/CAD will largely depend on the Bank of Canada’s policy decision. Later today, the central bank will announce its interest rate decision, publish its updated Monetary Policy Report, and hold a press conference with the Governor. If policymakers maintain a cautiously hawkish tone on inflation, the Canadian dollar could receive additional support. Conversely, a more dovish message may limit CAD gains despite the broader weakness in the US dollar.
Market participants will also focus on the release of the US Producer Price Index (PPI), which will provide further insight into inflation trends following the softer CPI report. In addition, US crude oil inventory data could influence USD/CAD, as oil prices traditionally have a significant impact on the Canadian dollar.
AUD/USD
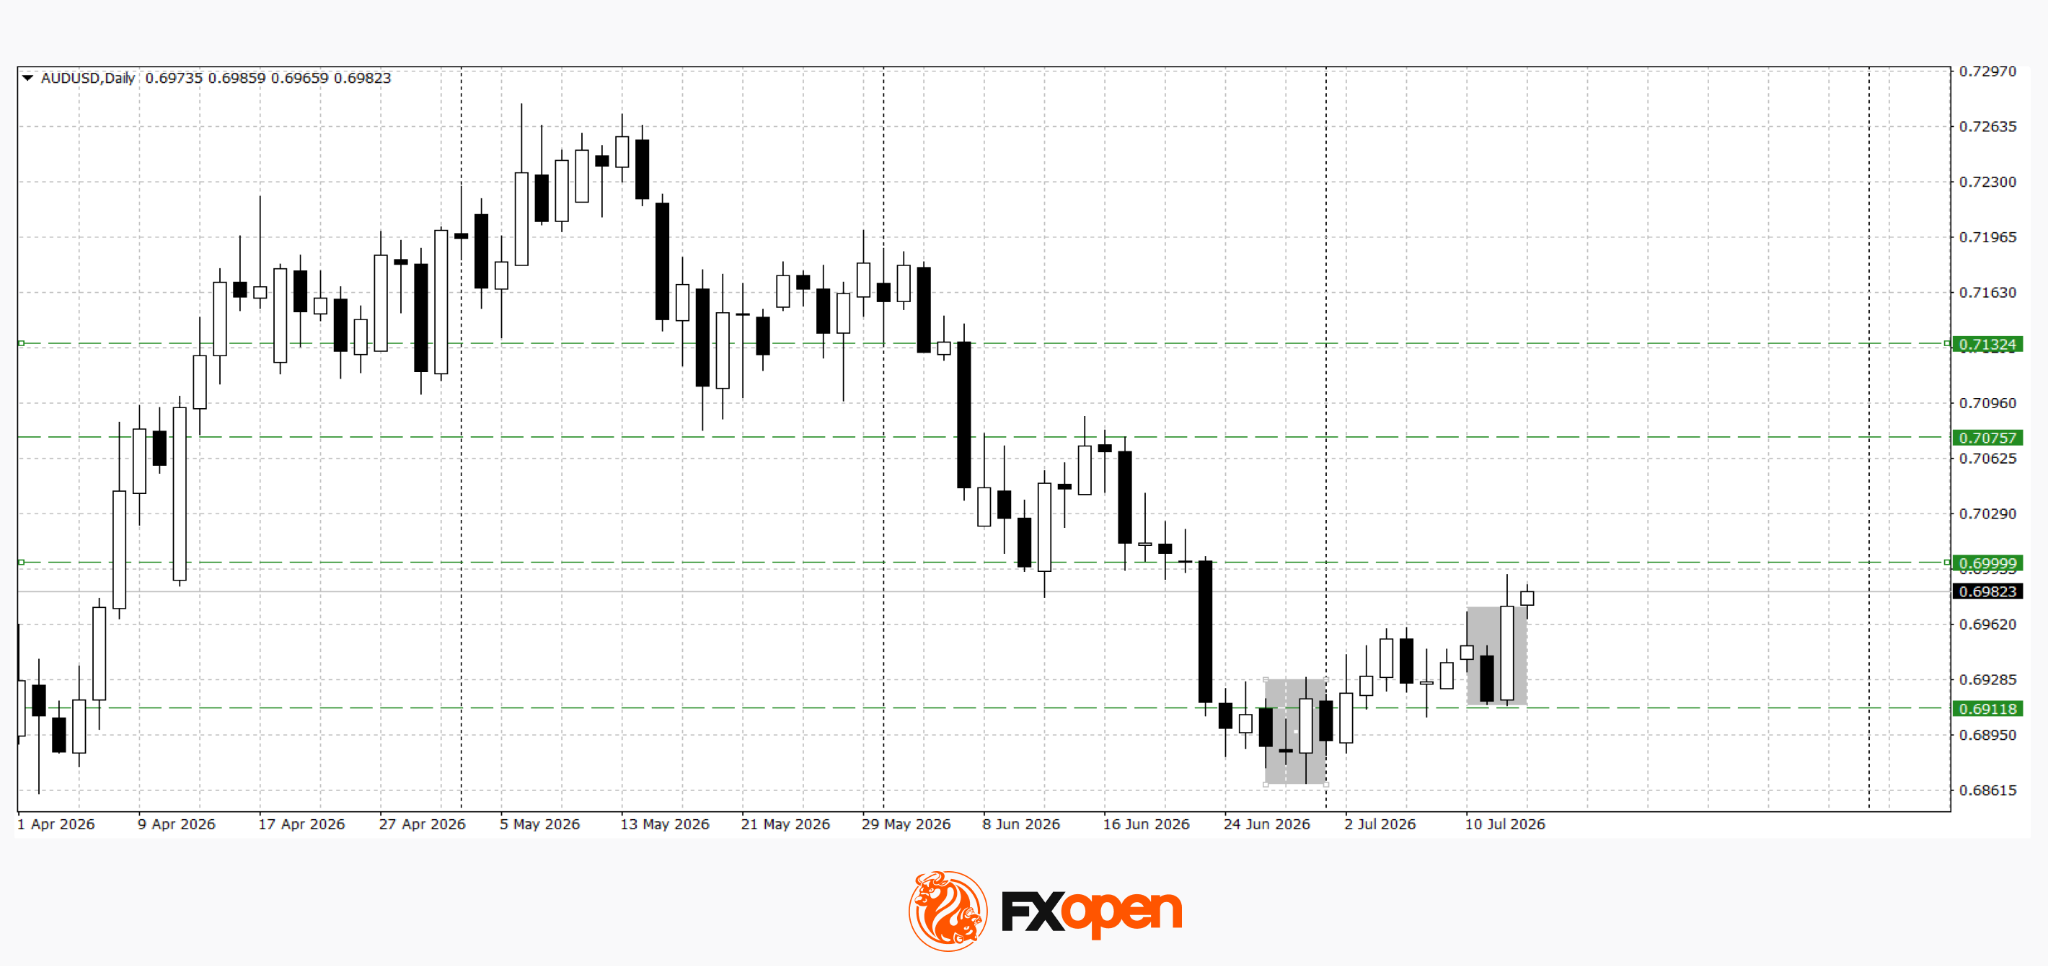
The AUD/USD pair continues to develop the bullish engulfing reversal pattern. Yesterday, buyers managed to test the key resistance level around 0.7000. If the pair secures a sustained break above this level, the rally could extend towards the 0.7080–0.7130 area. The bullish scenario would be invalidated by a move below 0.6900.
Key events for AUD/USD:
- Today at 14:00 (GMT+3): US MBA Mortgage Market Index
- Today at 15:30 (GMT+3): US Producer Price Index (PPI)
- Today at 15:45 (GMT+3): Speech by FOMC member John Williams
USD/CAD
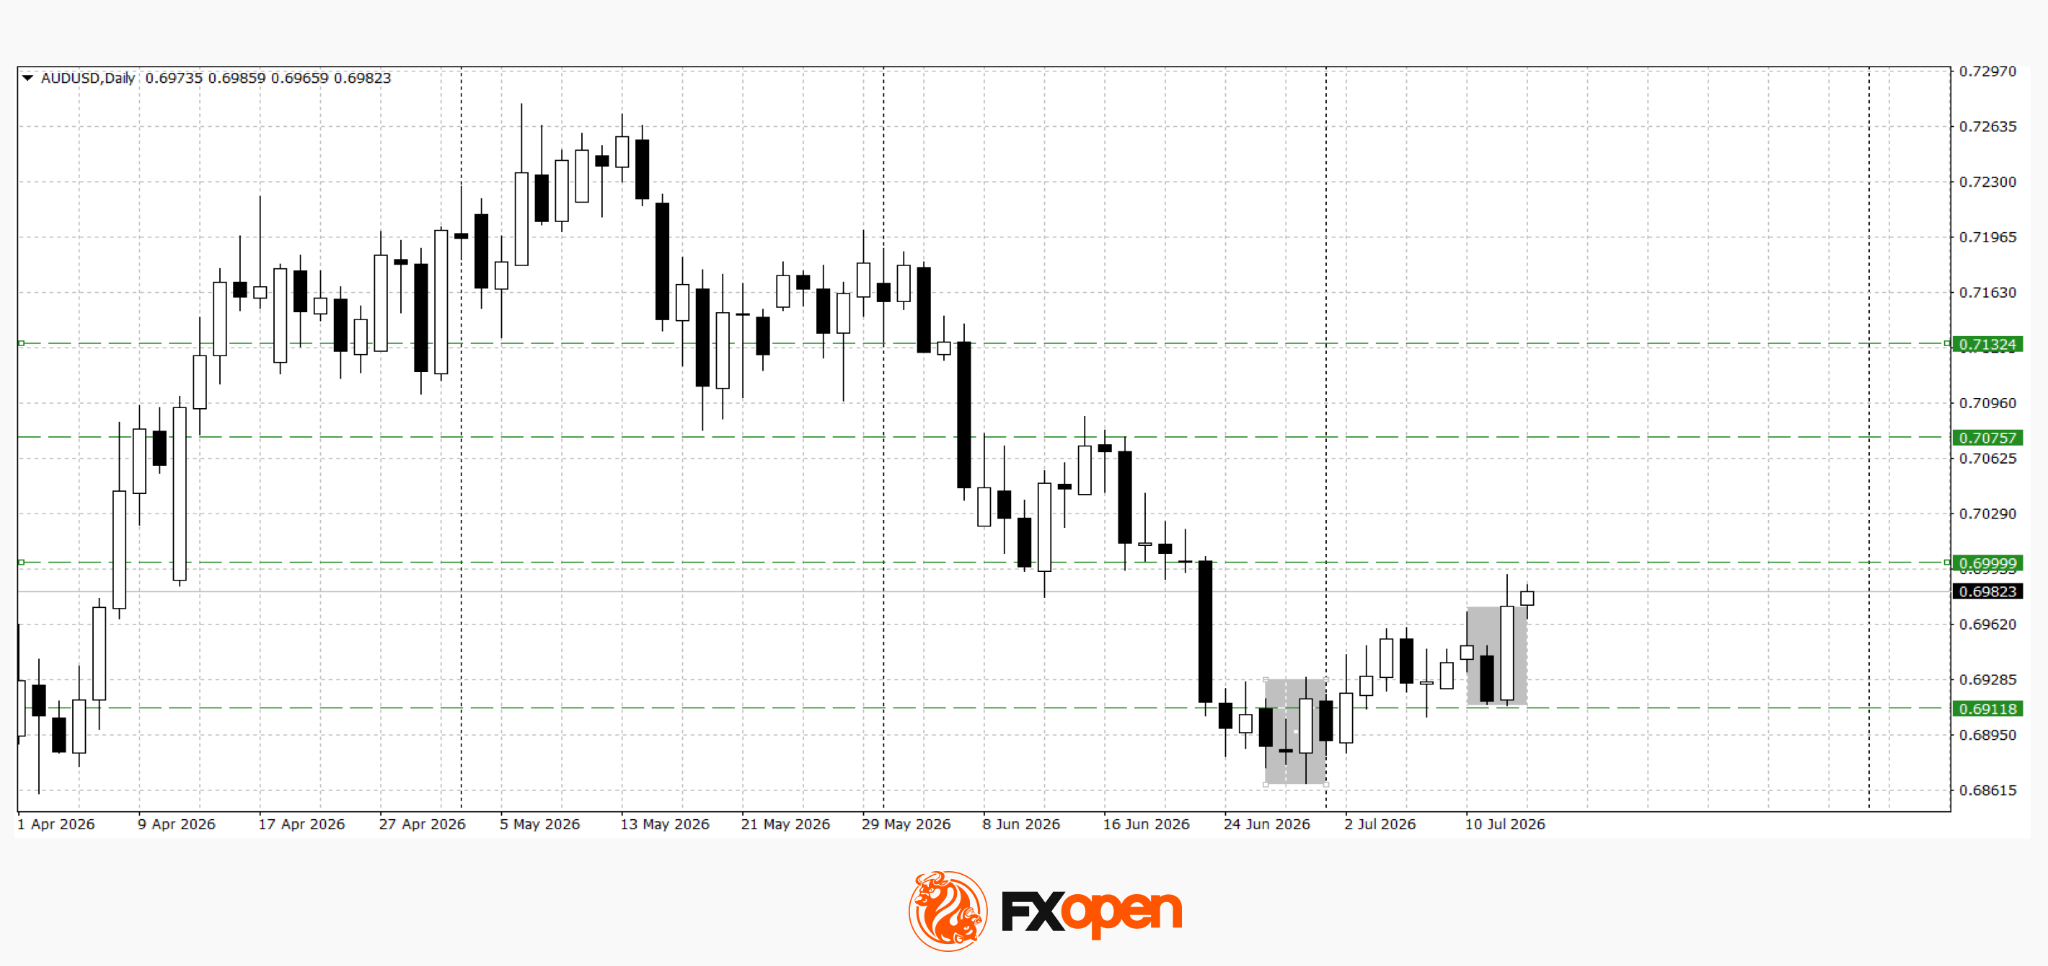
Following confirmation of the bearish tower top reversal pattern, selling pressure on USD/CAD intensified, reinforced by the weaker-than-expected US inflation data. As a result, the pair declined below 1.4100. Technical analysis suggests there is scope for a further move lower towards the 1.3960–1.4020 area. A decisive break back above 1.4120 could revive the bullish outlook.
Key events for USD/CAD:
- Today at 16:45 (GMT+3): Bank of Canada interest rate decision
- Today at 17:30 (GMT+3): US Crude Oil Inventories
- Today at 17:30 (GMT+3): Bank of Canada press conference
Overall, the weaker US inflation report strengthened expectations of a more accommodative Federal Reserve, weighing on the US dollar and supporting commodity-linked currencies. However, the next moves in AUD/USD and USD/CAD will depend on upcoming economic data and the Bank of Canada’s policy guidance.
Trade over 50 forex markets 24 hours a day with FXOpen. Take advantage of low commissions, deep liquidity, and spreads from 0.0 pips (additional fees may apply). Open your FXOpen account now or learn more about trading forex with FXOpen.
This article represents the opinion of the Companies operating under the FXOpen brand only. It is not to be construed as an offer, solicitation, or recommendation with respect to products and services provided by the Companies operating under the FXOpen brand, nor is it to be considered financial advice.
Just a few short years ago, the crypto hype was strong. VCs were eager to pour money into solutions for scalability, data availability, and any number of buzzwords.
Since then, the advent of powerful AI models and prolonged bear markets have taken the wind out of crypto’s sails and many chains which promised the future are now as good as forgotten.
One keen-eyed X user, crypto marketer Stacy Muur, noted the staggering $500 million invested across six blockchain projects which, together, have produced a total of just $360 in blockchain fees in the past 24 hours.
Read more: AscendEx shutdown: Uncertainty over withdrawals as hot wallets lack funds
The claim caught Protos’ eye, so we took a look at the six companies to see where it all went wrong.
Berachain
Berachain is a blockchain born as a spinoff of the 2021-era Bong Bears NFT collection. It claims to be the first proof-of-liquidity based chain, and aims to be a “growth engine for onchain businesses.”
The project raised a total of $142 million across two rounds in 2023 and 2024.
However, according to its most recent EoY statement, the project has struggled amidst issues with sentiment, shrinking crypto-native TAM and “increased skepticism around the value of infrastructure as a whole.”
Since launching in early 2025, its BERA token is down 98%.
Berachain was among the networks caught up in November’s devastating Balancer hack, leading validators to temporarily halt the network.
Later that same month, it was revealed that one of the backers, Brevan Howard’s Nova Digital, was granted a one year, risk-free refund right on its $25 million investment.
Read more: Balancer exploit drains $129M in DeFi disaster
Celestia
Celestia was seen as a hot ticket back in 2023 when “data availability” was the buzzword du jour.
Part of the Cosmos ecosystem, it promises bespoke, high throughput, modular chains “for companies with internet-scale traffic.”
It raised first $1.5 million in 2021, a further $50 million in 2022 and finally $100 million in 2024.
Its much-hyped token launch was one of the first rays of light following a deep bear market sparked by the catastrophic crypto collapses of 2022.
Despite initially surging around 10x in its first months to an all-time high of over $20, TIA eventually bled approximately 98%, sitting today at $0.40.
Scroll raised a total of $83 million over three funding rounds, the latest of which brought the Ethereum L2 to a $1.8 billion valuation in March 2023.
It made just $24 in fees yesterday.
The zkEVM layer two hit a peak TVL of $585 million as users enthusiastically farmed an ultimately disappointing airdrop. In the aftermath, the network lost around 75% of its TVL within a couple of months.
There’s currently just under $12 million on the chain.
Eclipse
Eclipse billed itself as “Solana on Ethereum,” an SVM layer two network which would pair Solana’s performance with Ethereum’s liquidity.
Developer Eclipse Labs raised a total of $65 million, most of which came in a $50 million Series A, led by Placeholder and Hack VC, in March 2024.
DeFiLlama data shows the chain’s TVL peaking at almost $50 million in late February last year. It’s currently down to just $1.15 million, a drop of approximately 98%.
The project’s most recent blog post is from a year ago, announcing the launch of its token ES, and an airdrop. Eclipse Labs has since pivoted to development of The Human API, a marketplace for AI agents to hire humans.
Sonic
Launched as Fantom by controversial developer Andre Cronje, founder of DeFi stalwart Yearn Finance, the fast, low-cost network migrated to Sonic in 2024. It raised a total of $61 million across six rounds between 2018 and 2024, according to ICODrops.
As Fantom, it took a hit in the Multichain debacle, with many bridged assets depegged from their native versions.
Fantom’s peak TVL reached a staggering $7.9 billion in 2022 and now sits at just under $5 million. Sonic’s hit $1.2 billion last spring, but has since dropped to $16 million.
Cronje’s involvement with Sonic terminated last month and he’s spent much of the last 18 months building Flying Tulip.
Read more: Andre Cronje says someone stole his code to build a $1B DeFi project
Manta
ZK-focused Manta raised a total of $60 million across four rounds between 2021 and 2023.
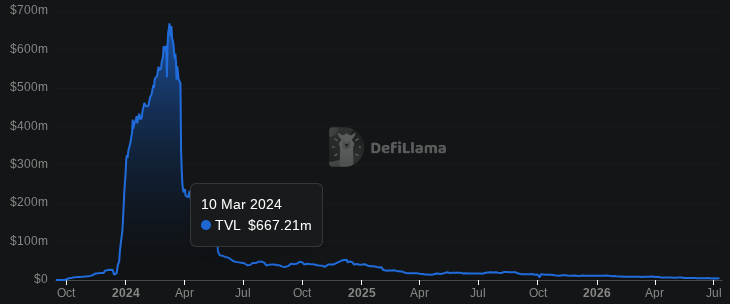
Its TVL chart is dramatic, highlighting an intense, heavily gamified airdrop campaign, which saw over $650 million poured into the chain.
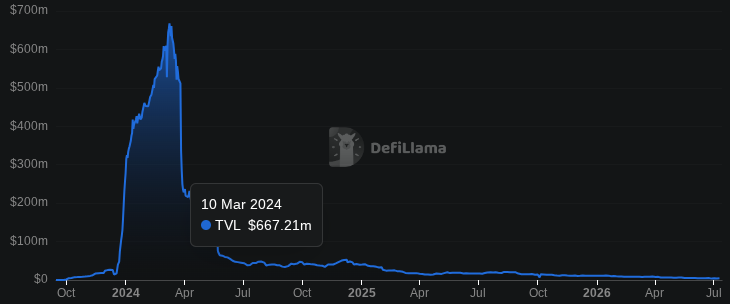
Just a few weeks before its peak, TVL sat at under $20 million. Likewise, within four months, it was back below $50 million once again. Today, just $4 million is held on the chain.
Got a tip? Send us an email securely via Protos Leaks. For more informed news and investigations, follow us on X, Bluesky, and Google News, or subscribe to our YouTube channel.


The United Kingdom has set an early 2027 target to issue its first digital sovereign bond on distributed-ledger infrastructure, becoming the first G7 country to launch government debt in tokenized form.
Summary
- The UK plans to issue its first blockchain based sovereign bond by early 2027 through HSBC’s Orion platform.
- The Digital Gilt Instrument will operate inside the Bank of England and FCA Digital Securities Sandbox.
- The move comes as the UK expands cooperation with the US on stablecoins, tokenized assets and cross border financial markets.
According to Chancellor Rachel Reeves, who announced the plan during her annual Mansion House speech, the government intends to follow the first issuance with additional digital gilt sales if the pilot progresses as expected.
The Digital Gilt Instrument, or DIGIT, will be a sterling-denominated government bond issued on HSBC’s Orion blockchain platform. It will operate within the Bank of England and Financial Conduct Authority’s Digital Securities Sandbox, a testing environment created for digital securities.
The Treasury introduced the pilot in 2024 to examine whether distributed-ledger technology could shorten settlement times, reduce reconciliation work and lower operating costs across government debt markets. HSBC secured the mandate to operate the platform in February after issuing more than $3.5 billion of digital bonds through Orion.
Speaking at the same event, Bank of England Governor Andrew Bailey said the central bank will work toward making DIGIT eligible as collateral in its market operations. According to Bailey, that step could support tokenized repurchase agreements while allowing banks to use the security in central bank funding transactions.
The Treasury has not disclosed the size, maturity, coupon, investor eligibility, or settlement asset for the bond. Officials said the initial issuance will sit outside the government’s conventional gilt financing program.
Digital bond plans follow tokenization push
The planned bond sale comes as the UK expands its work on tokenized financial markets beyond pilot projects.
Earlier this week, the UK and the United States published a joint statement committing to closer cooperation on stablecoin regulation, cross-border payments and tokenized finance through the Transatlantic Taskforce for Markets of the Future.
According to the joint statement, both governments plan to explore how regulated stablecoins issued in one country could access the other market while maintaining separate domestic regulatory frameworks. The two countries also agreed to seek common approaches for tokenized securities settlement and examine whether stablecoins or tokenized money market funds could serve as collateral in clearing markets.
The statement said stablecoins presented as money should maintain at least a one-to-one backing with high-quality liquid assets, while reserve assets should remain separate from issuers’ corporate funds. Officials also said holders should receive timely redemptions and clear legal protections if an issuer fails.
Although the stablecoin agreement does not create automatic market access or mutual recognition, it outlines a framework for regulators to reduce unnecessary barriers to cross-border tokenized financial services while each country completes its own regulatory process.


Key takeaways
- Solana (SOL) has rebounded above its 50-day EMA at $76.82 after a 4% rally.
- Rising futures trading volume and positive funding rates point to growing bullish sentiment among retail traders.
- Solana ETFs have recorded two consecutive days of zero inflows, signaling muted institutional demand.
Solana (SOL) extended its recovery on Wednesday, climbing above its 50-day Exponential Moving Average (EMA) after gaining roughly 4% in the previous session.
The rebound comes as improving sentiment across the cryptocurrency market encourages renewed retail participation, while institutional investors remain cautious despite the broader market rally.
Retail traders return to Solana futures
Recent derivatives data suggests retail traders are becoming more optimistic about Solana’s short-term outlook.
According to CoinGlass, SOL futures open interest has remained stable at approximately $4.91 billion over the past 24 hours, indicating traders are maintaining existing leveraged positions rather than exiting the market.
Meanwhile, futures trading volume jumped 15% to around $6.90 billion, reflecting stronger market activity and continued position building.
Adding to the positive outlook, Solana’s funding rate remains in positive territory at approximately 0.0040%, suggesting traders are willing to pay a premium to maintain long positions—a sign that bullish sentiment is strengthening among retail participants.
While retail activity has improved, institutional demand has yet to show similar strength.
Data from SoSoValue indicates that Solana exchange-traded funds (ETFs) have recorded two consecutive trading sessions with zero net inflows this week.
The lack of fresh ETF investment suggests traditional investors are adopting a wait-and-see approach despite the recent rebound in cryptocurrency prices.
This divergence between retail enthusiasm and institutional caution could influence the sustainability of Solana’s recovery.
Solana price analysis: $81.50 remains key breakout level
From a technical perspective, Solana has strengthened after reclaiming its 50-day EMA at $76.82.
The token is also trading above the 50% Fibonacci retracement level at $76.92, measured from the decline between $98.41 and $60.13, reinforcing the improving short-term structure.
However, SOL continues to face significant resistance from a descending trendline positioned near $81.50, while the 200-day EMA at $94.52 remains a major long-term barrier.
A decisive daily close above $81.50 would confirm a breakout from the prevailing downtrend and could trigger a move toward the $88.56 resistance and the 200-day EMA at $94.52.
Technical indicators suggest bullish momentum is slowly building. The Relative Strength Index (RSI) is hovering around 54, indicating modest buying pressure without entering overbought territory.
Meanwhile, the Moving Average Convergence Divergence (MACD) is approaching a bullish crossover near its signal line, reflecting a neutral-to-positive momentum shift that could support additional upside if buying pressure continues.

If Solana encounters renewed selling pressure, traders will likely monitor the following support levels:
- 50-day EMA: $76.82
- Previous ascending trendline: $68.88
- Cycle low: $60.13
Holding above the 50-day EMA would help preserve the current recovery, while a break below it could expose SOL to a deeper pullback toward the lower support zones.

Cathie Wood’s ARK Invest is continuing to add to its position in Circle Internet Group, the company behind the USDC stablecoin, even as Circle’s stock remains in a long slump.
According to ARK’s daily trade disclosures reviewed by Cointelegraph, the firm bought an additional 220,000 shares of Circle across three actively managed exchange-traded funds on Tuesday. ARK’s most recent purchase was valued at roughly $13.9 million based on Circle’s Tuesday closing price of $63.22 on the New York Stock Exchange.
Key takeaways
- ARK Invest added 220,000 Circle shares on Tuesday, worth about $13.9 million at the NYSE close.
- Through its disclosed July buys, ARK has accumulated 725,517 Circle shares, extending a pattern of additions despite persistent share-price weakness.
- Circle represented about 4.37% of the ARK Fintech Innovation ETF (ARKF) as of Wednesday, and about 3.35% of ARK Innovation ETF (ARKK).
- Analyst 10x Research said it no longer views Circle as a buy after the stock fell back below $80, citing deteriorating fundamentals and slower USDC activity.
Another Circle buy lifts ARK’s July total
ARK’s newest transaction increased the firm’s disclosed July acquisitions to 725,517 Circle shares. The same disclosures show prior buys of 287,609 shares on July 1 and 217,896 shares on July 9.
The buys matter because they highlight a sustained commitment by ARK’s actively managed funds to its thesis on Circle’s role in regulated stablecoin infrastructure—an area where market sentiment has been volatile. Even as Circle’s equity has fallen sharply from its IPO-era high, ARK has continued to build rather than pause.
As of Wednesday, Circle was listed as the seventh-largest holding in ARK Fintech Innovation ETF (ARKF), accounting for 4.37% of the fund. The position was valued at about $33 million, based on the fund’s latest holdings data available on ARK’s official website.
Circle was also a meaningful component of ARK Innovation ETF (ARKK). It represented 3.35% of the flagship fund and ranked as the ninth-largest holding, worth about $218 million, according to ARKK holdings data on ARK’s site.
Circle’s stock under pressure, ARK keeps buying
While ARK’s trading has been steady, Circle shares have struggled. The stock was down about 22% year-to-date and roughly 76% below its post-IPO peak, setting a challenging backdrop for any incremental capital allocation.
That makes ARK’s continued additions notable: the strategy implies ARK sees enough long-term value in Circle—particularly tied to USDC’s position in the stablecoin landscape—to keep increasing exposure during a period when many investors have grown more cautious.
Still, public equity performance can diverge from broader ecosystem adoption, and stablecoin markets are influenced by a mix of regulatory outcomes, competition among issuers, and the pace of on-chain and payment activity.
Analysts warn of deteriorating fundamentals and slower USDC activity
ARK’s latest purchase came as some analysts revisited Circle’s outlook. Digital asset research platform 10x Research said it no longer considers Circle a buy after the stock declined back below $80. In a report published Tuesday, the firm explained that it previously regarded Circle as attractive below that level but now believes Circle’s fundamentals have “meaningfully deteriorated.”
10x Research also pointed to slower USDC activity as a key concern, including a decline in active addresses. While stablecoin usage metrics can fluctuate for a variety of reasons, a sustained slowdown in users interacting with USDC could weigh on expectations for Circle’s growth.
The stablecoin market data adds further context. According to CoinGecko, USDC’s market capitalization had declined roughly 3% year-to-date to $73 billion at the time of publication, though it remained about 17% higher than a year earlier. In other words, USDC’s market size is still larger than it was a year ago, but the near-term trajectory has weakened.
10x Research also left room for two competing interpretations: the recent drop in Circle’s share price could represent a long-term buying opportunity, or it could signal the start of a more prolonged downturn. That uncertainty reflects the broader challenge in assessing equity risk around stablecoin issuers—investors must separate temporary market drawdowns from longer-term changes in transaction demand, regulatory clarity, and competitive dynamics between different stablecoins.
What to watch next for ARK, Circle, and USDC
For investors tracking this story, the immediate focus should be whether Circle can reverse the factors cited by analysts—particularly USDC activity levels—and whether ARK’s continued buying is mirrored by broader capital flows into Circle or remains idiosyncratic. Given how sharply sentiment has swung, the next reports and on-chain usage trends around USDC will likely carry outsized importance.
Crypto World
Crypto News, July 15: Bitcoin and Ethereum Price Jump on Softer CPI and Japan Bitcoin ETF

Bitcoin and Ethereum price climbed after cooler-than-expected U.S. inflation data improved market sentiment. Just hours after, a Japan Bitcoin ETF bill cleared a major committee in the country’s Upper House, raising expectations that spot Bitcoin exchange traded funds could eventually reach Japanese investors. The combination of easing inflation and friendlier regulation gave crypto traders another reason to stay bullish.
Japan’s proposal would classify cryptocurrencies as financial instruments under the Financial Instruments and Exchange Act while lowering crypto taxes to a flat 20%. If passed into law, the framework could allow spot Bitcoin ETFs to launch on the Tokyo Stock Exchange by 2027.
Elsewhere, South Korea advanced plans recognizing virtual assets within national asset rules, while policymakers in India, Europe, and the United States continued debating crypto regulation.

Don’t Miss Out on Our $1,000 USDT Airdrop on ByBit
Japan Bitcoin ETF Sparks Fresh Price Optimism
The Japan Bitcoin ETF proposal has quickly become the day’s biggest story. After years of cautious regulation, lawmakers are now considering a framework that brings digital assets closer to traditional financial markets. Lower taxes and the prospect of regulated investment products could attract both institutional and retail capital once the legislation clears the remaining stages.
— Coin Bureau (@coinbureau) July 15, 2026
 BREAKING: Japan advances landmark bill to legalize Bitcoin ETFs.
Japan’s Upper House committee has approved legislation to reclassify bitcoin and other cryptocurrencies as financial instruments, paving the way for spot crypto ETFs as early as 2027.
The proposal would also… pic.twitter.com/VzTbAUcBBm
Outside Japan, governments are moving at different speeds. India’s Finance Ministry is pushing regulators to strengthen oversight without appearing to endorse cryptocurrencies.
Meanwhile, a joint U.S.-U.K. task force called for greater stablecoin innovation, and banks continue to discuss amendments to the CLARITY Act before lawmakers meet later this week. Europe is also pressing ahead with its Digital Euro pilot.
Markets welcomed the shifting backdrop as Bitcoin price briefly touched above $65,000 before easing back toward the mid $64,000 range. Even so, the move marked a clear breakout from nearly two weeks of muted trading. Softer inflation figures encouraged investors to rotate back into risk assets after fears of additional Federal Reserve tightening faded.

Institutional demand also improved. U.S. spot Bitcoin ETFs recorded $181 million in net inflows after heavy outflows, with BlackRock accounting for the largest share. On-chain data also points to continued accumulation by large holders, suggesting long-term investors remain confident despite recent volatility. Together, stronger ETF demand and the Japan Bitcoin ETF narrative helped keep the Bitcoin price supported.
Discover: The Best Crypto to Diversify Your Portfolio
Ethereum Price Outpaces BTC as ETF Flows Improve
While Bitcoin grabbed the headlines, Ethereum quietly outperformed Bitcoin price. Ethereum recovered faster than Bitcoin and strengthened against BTC, signaling improving momentum after several weeks of weakness. Traders pointed to a healthier ETH/BTC ratio as evidence that buyers are becoming more confident.
Fresh institutional flows reinforced that view. U.S. spot Ethereum ETFs posted about $58 million in net inflows, reversing the mixed trend seen earlier this month. Morgan Stanley also updated filings tied to proposed Ethereum and Solana ETFs, naming Coinbase as custodian and staking provider. Those developments added to growing confidence around regulated crypto investment products.
The Ethereum price continued pushing toward the $1,900 level after reclaiming important technical support. Analysts say maintaining momentum above recent breakout levels could open the door to another test of psychological resistance near $2,000. At the same time, steady ETF demand remains an important tailwind.
Looking ahead, traders will closely watch incoming U.S. economic data alongside political developments in Japan and Washington. The Japan Bitcoin ETF proposal still faces additional legislative steps, yet it already marks one of the strongest pro-crypto signals from a major economy this year. If institutional inflows continue and macro conditions remain favorable, both Bitcoin and Ethereum price could have room to extend their gains.
Don’t Miss Out on Our $1,000 USDT Airdrop on ByBit
Discover: The Best Token Presales
The post Crypto News, July 15: Bitcoin and Ethereum Price Jump on Softer CPI and Japan Bitcoin ETF appeared first on Cryptonews.
Bitcoin (BTC) price is up about 3% over the past day, near $64,500, after a cooler US inflation print pushed it above a level that had capped it since mid-June.
The move keeps a two-week uptrend alive. Still, fading buying volume and a band of supply just overhead raise the question of how much further the rally can run.
Crypto Traders Are Scared While the Money Stays Calm
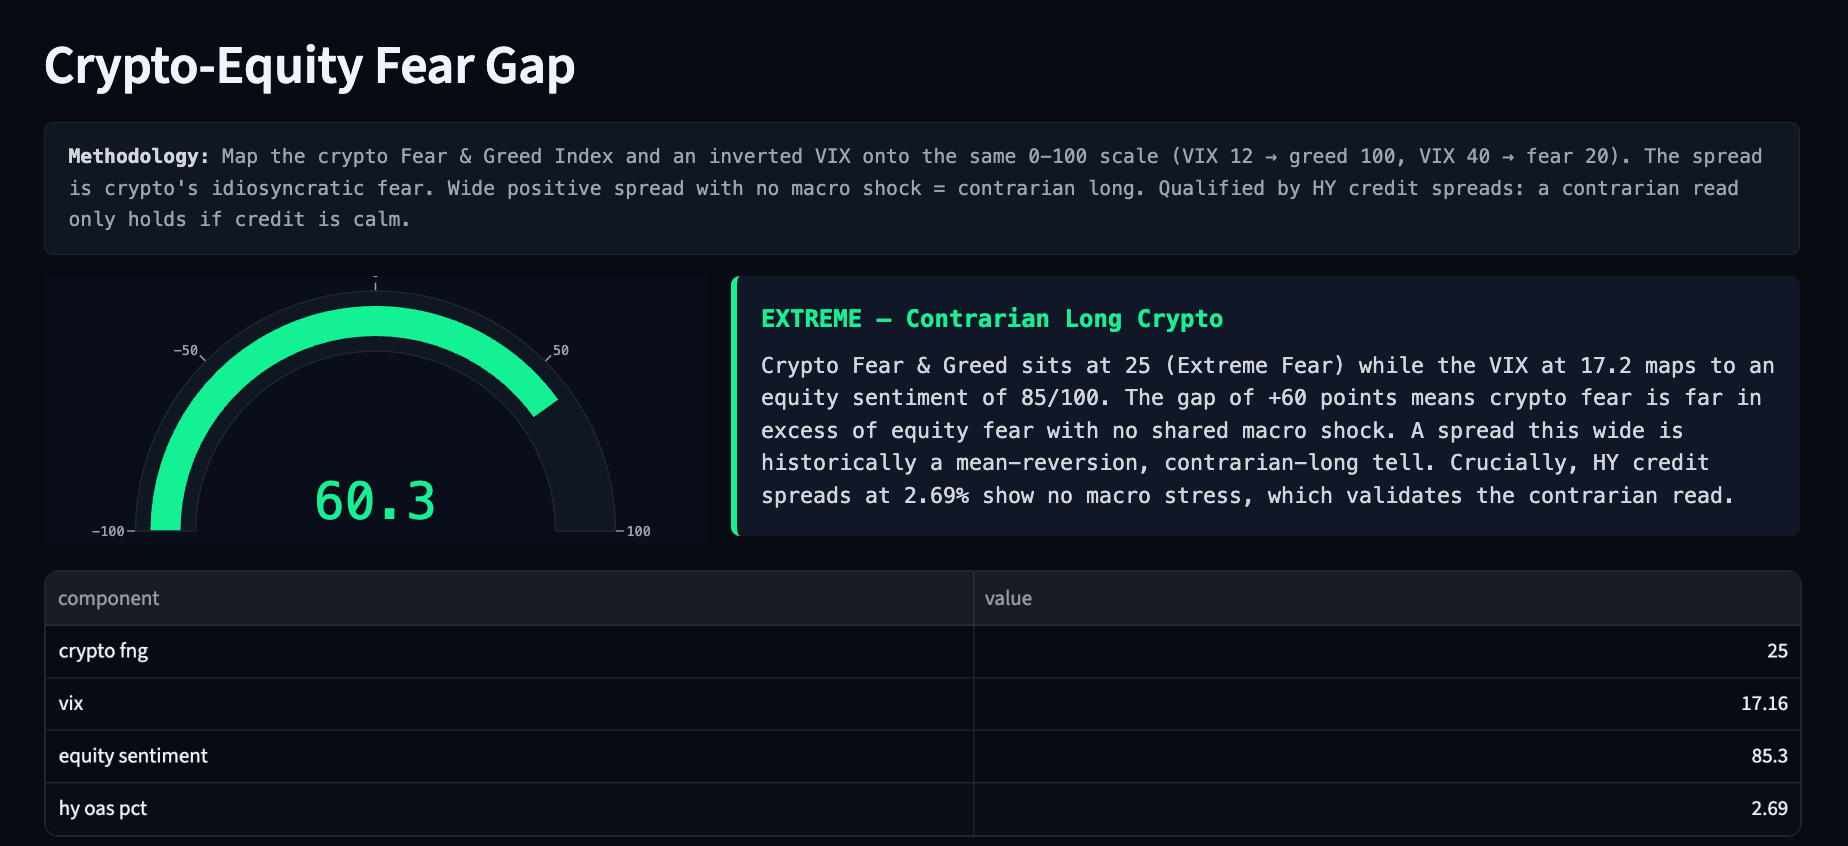
Sentiment tells a strange story. The first of two proprietary gauges built for this analysis, the Crypto-Equity Fear Gap, puts the crypto Fear and Greed Index and the stock market’s fear on one scale. Crypto now sits at 25, or “extreme fear,” while stock-market fear is low (high sentiment).
That gap is the signal. When crypto is this scared while stocks stay calm, the fear is usually specific to crypto rather than a sign of a wider crisis. That kind of isolated panic more often signals a possible Bitcoin bottom than the start of a deeper drop.

One number backs up the calm. High-yield credit spreads, a simple gauge of stress in the financial system, sit at just 2.69%. Tight spreads mean no hidden macro problem, so the fear looks overdone rather than justified.
The second proprietary gauge, the Liquidity Siphon Index, checks whether cash is physically leaving crypto for traditional finance. It reads “outflow pressure building,” as the stablecoin supply, the money that waits on the sidelines to buy, slipped 0.35% in a week while tokenization and IPO headlines pulled attention toward Wall Street.
That signal is usually strongest when stablecoins shrink and stocks rip at the same time, since money is clearly chasing the rising market. Here, though, stocks also fell about 1.2% over the stretch, so the cash is not obviously rushing into equities.

With credit spreads still calm, this is not a panic-driven flight either. It looks like a mild, benign drift (more like indecision) rather than a real exit, the kind that tends to reverse. High fear and weak flows hint at a bounce, yet neither shows whether the big players are positioned for one.
Big Traders Lean Long as Bitcoin Holds a Rising Channel
Positioning leans bullish. A gauge of Bitcoin whales versus small traders shows top accounts running about 28% more long than retail, with both groups broadly aligned rather than fighting each other. Bigger players leaning long adds weight to the case, and it echoes signs that Bitcoin’s long-term holders keep accumulating.

The chart backs them up. Since early July, Bitcoin has climbed inside an ascending channel, a band of higher highs and higher lows. After the softer inflation print, it reclaimed a prior swing high it had struggled with, a sign buyers hold control.

However, one crack shows in the move. The buying volume behind this climb has faded since the start of the month even as price rose. That split between rising price and shrinking volume warns the rally may lack fuel. The price chart shows exactly where it must prove itself.
Bitcoin Price Levels to Watch as the $66,000 Ceiling Nears
The first real test is close. To show strength, the daily Bitcoin price chart needs a close above the 0.618 Bitcoin Fibonacci level, the critical technical zone traders track for reversals, at $66,086. That sits about 2.45% above the current price.
Want more token insights like this? Sign up for Editor Harsh Notariya’s Daily Crypto Newsletter here.
On-chain data points to a similar spot. The UTXO Realized Price Distribution (URPD), a metric that maps the prices where coins last moved, shows a heavy supply cluster at $66,898 holding about 2.04% of all Bitcoin. Many holders bought there, so some may sell to break even, which suggests extra BTC resistance. Chart and chain line up on one $66,000 zone.

A daily close above that band would open the path to $67,264, then $68,764. On the downside, Bitcoin support levels start at the channel base and the $61,752 swing low, and losing the channel risks a slide toward $57,716.

One caveat matters here. The heaviest on-chain supply does not sit right on the $66,086 Fibonacci level but a little higher, near $66,898. So even if Bitcoin tags $66,086, a thicker band of coins waits just above. Only strong buying volume can carry price through both. With volume fading, the $66,086 level separates a high-volume push toward $68,764 from a stall that fades back deeper into the channel.
The post Fear, Whales and a Supply Ceiling Point Bitcoin to One $66,000 Test appeared first on BeInCrypto.
326 Wrapped Bitcoin (WBTC) tokens on Ethereum were withdrawn from exchanges in a single day. According to fresh data shared by Santiment, this is the largest net exchange outflow since early June.
This transfer of coins has reduced the amount of WBTC immediately available on trading platforms.
Exchange Outflow
The latest outflows come as Bitcoin continues to trade through a “risk-heavy stretch.” Even as the crypto asset briefly climbed to $65,000 on Wednesday, market pressure from geopolitical tensions and ETF flow swings persists, Santiment stated in its findings. The large exchange withdrawals, however, could potentially serve as a positive signal for the broader crypto market recovery. The analytics platform added,
“Wrapped Bitcoin’s 6-week high exchange outflows provide more good news to crypto’s rebound “
Wrapped Bitcoin (WBTC) was launched in 2019 following a joint initiative by BitGo, Kyber Network, and Ren. It remains the largest tokenized version of Bitcoin, with a market capitalization of about $7.6 billion. Coinbase entered the space with cbBTC in 2024, which has grown to nearly $6 billion in market value. This space has become increasingly competitive in 2026.
Last month, stablecoin issuer Circle expanded the market by launching cirBTC on Ethereum.
Recovery Near?
As for Bitcoin’s price, the crypto asset moved higher after the latest US inflation report came in cooler than expected. Consumer prices fell 0.4% in June, bringing annual inflation to 3.5%. Economists had expected a 0.2% monthly decline and a 3.8% annual rate.
Meanwhile, Bitfinex analysts said that the asset is approaching what has historically been the final stage of its typical bear market period. According to the report, the BTC often spends five to six months trading below the Short-Term Holder Realized Price before entering a broader recovery. With July being identified as the fifth month of the current cycle, analysts believe the market could be closing in on a significant rebound.
They still warned that history alone does not guarantee a recovery. While July has traditionally been a favorable month for Bitcoin, broader macroeconomic conditions will also play a crucial role.
The post Is Wrapped Bitcoin Flashing a Bullish Signal? Exchange Outflows Hit Six-Week High appeared first on CryptoPotato.


Key takeaways
- Pi Network (PI) is stabilizing above $0.07500 after more than two weeks of sustained selling pressure.
- Improving crypto market sentiment following softer U.S. inflation has boosted speculative interest in PI.
- PI open interest climbed from $9.11 million to $12.14 million, signaling renewed trader participation.
Pi Network (PI) traded above $0.07500 on Wednesday, showing early signs of stabilizing after more than two weeks of persistent losses.
The token’s recovery comes as broader cryptocurrency markets rebounded following softer-than-expected U.S. inflation data, improving investor sentiment and encouraging renewed interest in higher-risk digital assets.
Although PI remains in a broader downtrend, technical indicators suggest bearish momentum may be weakening.
Improving market sentiment boosts risk appetite
The latest U.S. Consumer Price Index (CPI) report helped ease concerns over additional Federal Reserve interest rate hikes, reducing pressure on risk assets, including cryptocurrencies.
As market sentiment improved, investors showed greater willingness to return to speculative assets such as Pi Network.
CoinMarketCap’s Crypto Fear and Greed Index rose to 35 on Wednesday from 28 on Monday, reflecting a noticeable decline in market fear and improving investor confidence.
Historically, rising risk appetite has often supported increased trading activity in speculative cryptocurrencies.
Derivatives data points to growing interest in Pi Network. According to CoinAnk, PI futures open interest increased from $9.11 million to approximately $12.14 million over the past day.
The sharp increase suggests traders are opening new positions rather than closing existing ones, indicating renewed confidence and stronger speculative demand.
While rising open interest alone does not guarantee higher prices, it often supports increased market liquidity and stronger price momentum when accompanied by improving sentiment.
Pi Network technical analysis: Can PI reclaim $0.1000?
From a technical perspective, Pi Network is attempting to build a base near $0.07500, where a descending support trendline forming part of a falling channel continues to hold.
A Doji candlestick formed near this support during the previous trading session, signaling indecision between buyers and sellers and potentially marking the beginning of a short-term reversal.
The 161.8% Fibonacci extension at $0.06793, measured from the decline between $0.1998 and $0.1183, reinforces this support zone and increases the likelihood of a technical rebound.
If buying momentum strengthens, PI could target the following resistance levels:
- $0.09613 – 127.2% Fibonacci extension
- $0.1000 – Psychological resistance level
A decisive move above $0.09613 would significantly improve the short-term outlook and increase the probability of a recovery toward $0.1000.
Although Pi Network remains within a broader bearish trend, momentum indicators suggest downside pressure may be becoming exhausted.
The Relative Strength Index (RSI) has fallen to around 21, placing the token deep in oversold territory. Such readings often indicate that selling has become excessive and that a relief rally could emerge if buyers return.
Meanwhile, the Moving Average Convergence Divergence (MACD) remains below its signal line, confirming that the broader trend is still bearish. However, the indicator also suggests bearish momentum may be weakening after the recent decline.
The most important downside support remains the 161.8% Fibonacci extension at $0.06793.

A daily close below this level would invalidate the current rebound scenario and could trigger a new phase of price discovery to the downside.
As long as PI holds above this support, the possibility of a recovery toward $0.09613 and eventually $0.1000 remains intact.


Polymarket has been blocked in the Czech Republic after authorities classified the prediction market platform as an unlicensed gambling service, adding another European jurisdiction to the list of countries restricting its operations.
Summary
- Czech authorities have given internet providers 15 days to block access to Polymarket.
- Regulators said the platform must follow gambling rules regardless of how its contracts are described.
- India, Argentina and several European countries have also taken action against Polymarket.
The Czech Ministry of Finance has ordered internet service providers to block access to Polymarket within 15 days of placing the platform on the country’s list of unauthorized internet games.
Officials argued that prediction markets operate like gambling products even when they are presented as investment tools. According to the ministry’s position, the only difference is the terminology, with bets described as “contracts” and winnings presented as “returns on investment.”
The latest move follows similar restrictions introduced in France, Germany, Romania, Spain, and Belgium. Outside Europe, regulators in New Zealand, Australia, and Brazil have also taken action against prediction market platforms.
Czech authorities reject Polymarket’s investment argument
Commenting on the decision, Jan Řehola, director of the Czech Institute for Gambling Regulation, said prediction markets should not be treated differently simply because they are presented as financial products.
“Prediction markets are not harmless technological novelties. They involve betting on real-world events, often without clear accountability to the state, without standard player-protection measures and without the rules that apply to legal gambling,” Řehola said.
He argued that changing the terminology does not alter the nature of the product.
“If something looks like a bet, functions like a bet, and allows people to win or lose money depending on the outcome of an uncertain event, we cannot stop treating it as gambling simply because it is called a contract,” he said.
Řehola added that the Ministry of Finance’s decision confirms that the same regulatory standards should apply to all operators offering betting products.
“This is not about banning innovation. It is about ensuring that the same rules apply to everyone who offers betting for money. Player protection, the prevention of money laundering, and effective market supervision must not depend on what an operator chooses to call its product,” he said.
Europe remains divided over prediction markets
While several European countries have classified prediction markets as gambling, Gibraltar recently introduced a separate regulatory framework for the sector instead of treating such platforms as either gambling products or financial instruments.
The framework was introduced after Gibraltar licensed prediction market operators ADI Predictstreet and Wire Market, becoming the first jurisdiction to establish dedicated rules for the industry.
The Czech decision extends a series of enforcement actions against Polymarket this year.
In May, India blocked access to the platform after the Ministry of Electronics and Information Technology directed internet service providers and VPN operators to restrict access to prediction market websites that authorities classified as illegal online money gaming platforms.
Argentina also ordered a nationwide block in May after a Buenos Aires court concluded that Polymarket operated outside the country’s gambling framework. Authorities there cited consumer protection concerns, crypto-based payments and identity verification standards among the reasons for the decision.
South Korea has taken a different approach. Earlier this month, the Broadcasting, Media and Communications Review Committee postponed any enforcement decision after deciding to hear Polymarket’s response before determining whether its service violates local gambling laws.
The company is also facing scrutiny in the United States, where the CFTC is investigating parts of Polymarket’s business, including its social media operations.

(VIDEO) Samsung Reveals Flex Titanium Display Tech to Reduce Galaxy Z Fold 8 Crease Ahead of July 22 Unveiling

AUD/USD and USD/CAD React to Softer US Inflation

Perfect Justice secures premiership lead for jockey Siena Grima in 2026


-

 Fashion6 days ago
Loro Piana Fall 2026 Enters Houston’s Art Scene
-

 Fashion4 days ago
Weekend Open Thread: Nutriplenish Leave-In Conditioner
-
 Sports6 days ago
2026 Genesis Scottish Open Thursday TV coverage: Round 1
-

 Sports5 days ago
Super Eagles star Moses Simon opens up on Liverpool transfer regret
-

 Tech6 days ago
Character.AI enters the microdrama arena with its own productions, but there’s a twist
-

 News Videos14 hours ago
XRP BOMBSHELL… XRP OMBOARDED FOR TRANSACTIONS!!!
-
 Tech1 day ago
Get Your ESP32 Sunny Side Up With This Solar Dev Board
-

 Tech14 hours ago
Dark Secrets Emerge When Jailbreaking LLMs
-

 News Videos6 days ago
Crypto Just Entered Its Most Important 6-Month Candle (Could Decide Everything!)
-
 NewsBeat6 days ago
Major update after Huntingdon train attack as man enters plea
-

 News Videos2 days ago
how to make coin bank box with cardboard #scienceproject #money #diy #shorts
-

 Sports7 days ago
39-year-old Djokovic wins five-hour thriller to enter Wimbledon semis | Other Sports News
-

 Tech6 days ago
Level Infinite Launches Gangstar Mirage City in India with Pre-Registrations
-
 Tech2 days ago
Cloudflare Precursor Watches Your Mouse and Keyboard To Decide If You Are Human
-

 Tech6 days ago
Entra passkey enrollment vishing targets Microsoft 365 users
-

 Crypto World6 days ago
DeFi Dashboard Zapper to Shut Down After 7 Years
-

 Crypto World6 days ago
Mark Cuban-Backed DeFi Dashboard Zapper Shuts Down After 7 Years
-

 Tech6 days ago
Claude’s New Reflect Dashboard Wants To Help You Log Off Of Claude
-

 Crypto World7 days ago
Fed minutes June 2026: officials split on rates
-
 Tech6 days ago
Hackers can use 9 of the most popular AI tools to assemble massive botnets
You must be logged in to post a comment Login