

Business
Dave & Buster’s launches nationwide ‘Rave & Buster’s’ tour

Check out what’s clicking on FoxBusiness.com.
Dave & Buster’s is taking its arcade experience deeper into nightlife with a new nationwide rave series.
The restaurant and entertainment chain is teaming up with events company Brownies & Lemonade for Rave & Buster’s, a seven-city tour featuring surprise guest headliners and multi-genre music lineups, according to an Instagram post from Brownies & Lemonade.
The events will feature house, bass, dubstep, trap, UK garage and other electronic music genres.
Dave & Buster’s is taking its arcade experience deeper into nightlife with a new nationwide rave series. (JHVEPhoto / Getty Images)
Brownies & Lemonade said the tour builds on the success of its “DNBNL” events at Dave & Buster’s locations, which it said prompted fans to ask for more artists, genres and cities.
“After the success of our DNBNL series at Dave & Buster’s over the last few years, we’ve received so many requests to expand the concept to include more artists and genres,” the events company said.
“Rave & Buster’s will feature surprise guest headliners and multi-genre lineups featuring the sounds of Bass, House, Trap, Dubstep, UKG, and everything in between.”
DISNEY SPOTLIGHTS AMERICAN BUSINESSES POWERING ITS MAGIC IN NATION’S 250TH YEAR
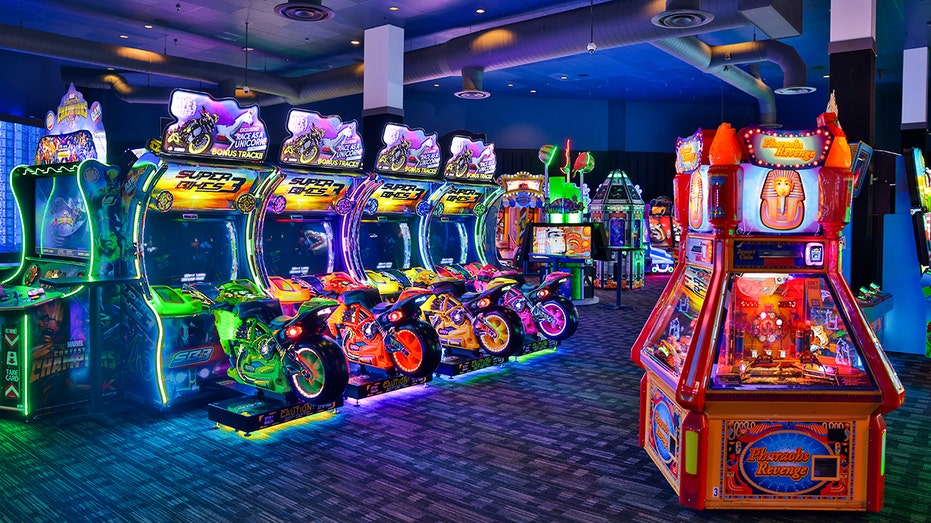
The tour comes as Dave & Buster’s continues expanding beyond arcade games, sports and family entertainment by adding more food, entertainment and nightlife options. (Tiffany Rose/Getty Images for Six Degrees of Influence / Getty Images)
The tour is scheduled to run from July 30 through Dec. 30 with stops in Honolulu; Denver; Dallas; Brooklyn, New York; Orlando, Florida; Irvine, California; and Milpitas, California.
The series will also include shows during Halloween weekend and the week leading up to New Year’s Eve.
Presale tickets became available Wednesday, while general tickets go on sale Thursday, July 16.
DISNEY WORLD REVIVES ‘LADIES AND GENTLEMEN’ GREETING AFTER YEARS OF GENDER-NEUTRAL MESSAGES

Dave & Buster’s began hosting rave-style events at select locations in 2023. (Jim Watson/AFP via Getty Images / Getty Images)
The tour comes as Dave & Buster’s continues expanding beyond arcade games, sports and family entertainment by adding more food, entertainment and nightlife options, according to USA Today.
GET FOX BUSINESS ON THE GO BY CLICKING HERE
Dave & Buster’s began hosting rave-style events at select locations in 2023, the outlet reported.
Dave & Buster’s could not immediately be reached by FOX Business for comment.


Sebastian Mackensen, BMW of North America’s president and CEO, said the automaker is committed to U.S. manufacturing as it completes a $1.7 billion South Carolina plant expansion.
BMW is recalling nearly 30,000 vehicles over an engine starter issue that could pose a fire risk, according to federal regulators.
The recall affects 29,119 plug-in hybrid sedans, including 2018-2020 BMW 530e xDrive, 2018-2020 BMW 530e iPerformance, 2017-2019 BMW 740Le xDrive and 2016-2018 BMW 330e iPerformance vehicles.
According to the National Highway Traffic Safety Administration (NHTSA), water can come into contact with the engine starter’s electrical relay, leading to corrosion over time.
SUBARU RECALLS OVER 540,000 SUVS AFTER FEDERAL REGULATORS FLAG WEIGHT CALCULATION ERROR: NHTSA

BMW is recalling nearly 30,000 vehicles over an engine starter issue. (Chris Jung/NurPhoto via Getty Images / Getty Images)
Corrosion inside the starter relay could affect the relay’s electrical connections and the engine’s ability to start, the recall report reads.
The issue could cause a short circuit and possible overheating of the starter even if it is parked with the ignition turned off, according to NHTSA.
“A short circuit in the starter relay may increase the risk of a fire,” the NHTSA report said.

The issue could cause a short circuit and possible overheating of the starter when the car is running. (REUTERS/Tingshu Wang/File Photo / Reuters Photos)
The recall was issued after a field incident in November involving a 2019 BMW 5 and a field incident in May involving a 2017 BMW 3 Series.
No injuries or accidents have been reported thus far in connection with the recall.
Vehicle owners are urged to park their cars outside and away from buildings until the recall repair is completed.
KIA ISSUES NEW RECALL OF 460,000 VEHICLES AFTER PREVIOUS FIX TO FIRE RISK FAILED

No injuries or accidents have been reported. (Matthias Balk/picture alliance via Getty Images / Getty Images)
CLICK HERE TO GET FOX BUSINESS ON THE GO
BMW will send out owner notification letters on Aug. 28, advising them to take their vehicles to an authorized dealer for the starter to be replaced free of charge. Owners who have previously purchased a starter replacement may also be eligible for reimbursement.


I’m a full-time investor with a strong focus on the tech sector. I graduated with a Bachelor of Commerce Degree with Distinction, major in Finance. I’m also a proud lifetime member of the Beta Gamma Sigma International Business Honor Society. My core values are: Excellence, Integrity, Transparency, & Respect. I always, to the best of my ability, hold true to these values which I believe are key for long-term success. I would like to invite all of my readers to leave their constructive criticism and feedback in the comments section so that I can further enhance the quality of my work moving forward. Thank you and God Bless America!
Analyst’s Disclosure: I/we have no stock, option or similar derivative position in any of the companies mentioned, and no plans to initiate any such positions within the next 72 hours. I wrote this article myself, and it expresses my own opinions. I am not receiving compensation for it (other than from Seeking Alpha). I have no business relationship with any company whose stock is mentioned in this article.
Seeking Alpha’s Disclosure: Past performance is no guarantee of future results. No recommendation or advice is being given as to whether any investment is suitable for a particular investor. Any views or opinions expressed above may not reflect those of Seeking Alpha as a whole. Seeking Alpha is not a licensed securities dealer, broker or US investment adviser or investment bank. Our analysts are third party authors that include both professional investors and individual investors who may not be licensed or certified by any institute or regulatory body.

Standard Nuclear prices IPO at $15 per share

matejmo/iStock via Getty Images

Are Hyperscalers Still Magnificent?
Chart 1: Momentum Stocks Go Full Tilt

Source: MSCI, Alpine Macro
High Quality Stocks’ Underperformance is at 1999 Extremes
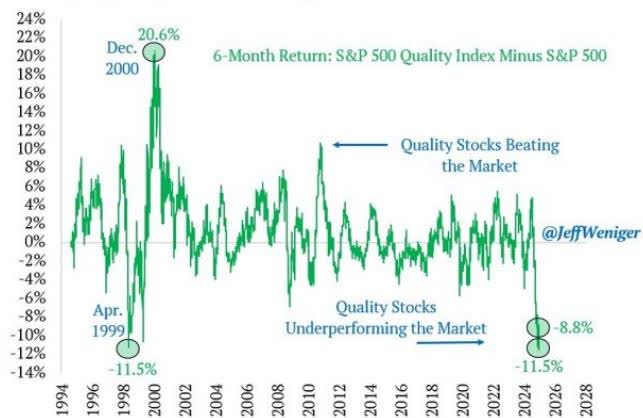
Source: Refinitiv, as of 11/10/2025. File #1077
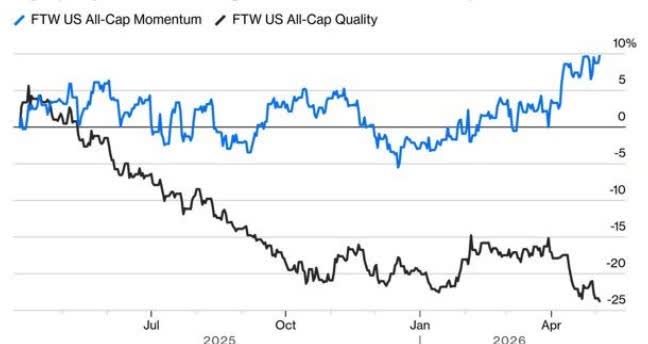
Big Mo’s Low-Quality Rally: High-quality stocks with strong balance sheets continue to be pummeled
Review and Outlook
Top performance contributors for the second quarter include Taiwan Semiconductor Manufacturing, Alphabet, United Rentals, Apple, and Visa.
Top performance detractors in the second quarter include Tractor Supply Company, Copart, CDW, Motorola Solutions, and Hermès (HESAY) ADR. (Note: We no longer have an ADR percentage limit in our portfolio.)
During the quarter, we were unusually busy. We bought Hermès and sold Tractor Supply Company, Zoetis (ZTS), and CDW. We increased positions in Chubb (CB), Progressive (PGR), Meta (META), Amazon (AMZN), Microsoft (MSFT), and Visa. We trimmed United Rentals, Alphabet, and Taiwan Semiconductor Manufacturing.
Alphabet was a top contributor to performance during the quarter. Google Search and Cloud continue to accelerate, with Search posting 19% revenue growth and Cloud posting 63% revenue growth, helping drive 30% growth in operating income. That torrid growth in operating income compares to, we estimate, more than 40% growth in Alphabet’s total gross assets. While that means returns on capital were slightly diluted, they remain above 30%. We think Alphabet is an exceedingly rare, if not entirely unique, business, growing a nearly $450 billion gross asset base by 40% while maintaining a 30% return on that massive asset base . These are astonishing compounding figures. Further, we have excluded from operating income large, unrealized gains from the Company’s investment portfolio, which totaled more than $35 billion in the most recent quarter (mostly due to SpaceX (SPACE)) and nearly $50 billion over the past six quarters. The Company also has a 14% stake in the private company Anthropic (ANTHRO). That stake could be worth more than $100 billion based on valuations reported from recent capital raises. We highlight these investments because these investees are drivers of recent inflation in component costs, especially DRAM memory. Although the market typically ignores the “one-time” investment gains that Alphabet has made, we think these extremely large gains have served as a de facto hedge for the rapid, incremental capex spending requirements. In other words, we estimate the $150 billion in investment gains on SpaceX and Anthropic (if realized) could effectively cover incremental DRAM-related capex costs for several years. These one-time gains are not included in our core calculations for returns – but suffice it to say, Alphabet has plenty of excess profitability to continue investing both responsibly and aggressively.
In addition, Alphabet announced it would begin delivering its proprietary Tensor Processing Units (TPU) to external customer data centers, representing a very sizable new addressable market. Alphabet has spent more than a decade developing and iterating on TPU systems for internal workloads, claiming to reduce the cost of serving its AI model (Gemini) by almost 80%. We expect Alphabet to continue delivering excellent returns as it helps proliferate AI use cases for businesses, consumers, and data centers. Despite outperformance during the quarter, we continue to manage portfolio concentration risk by limiting individual position sizes to 10%.
Although Microsoft, Amazon, and Meta have different business models and were not necessarily top drivers of performance during the quarter, we view their investment opportunity set, from both a compounding and returns perspective and a component-cost-hedge perspective, as similar to Alphabet’s.
Microsoft ended the most recent quarter with average gross assets of more than $585 billion (trailing two years), up 22%, yet generated $170 billion in gross cash flow over the prior four quarters, up 27% from a year ago. Again, these are astonishing figures: Microsoft added an average of $100 billion in assets and $27 billion in incremental cash flows. The Company is achieving nearly 30% returns while compounding the assets that generate those returns at more than 20% – extraordinary! On top of that, Microsoft reportedly has an investment in OpenAI (OPENAI) worth over $100 billion, so we think these huge investment gains, if realized, also effectively serve as a hedge against commodity inflation, particularly incremental DRAM-related capex over the coming years.
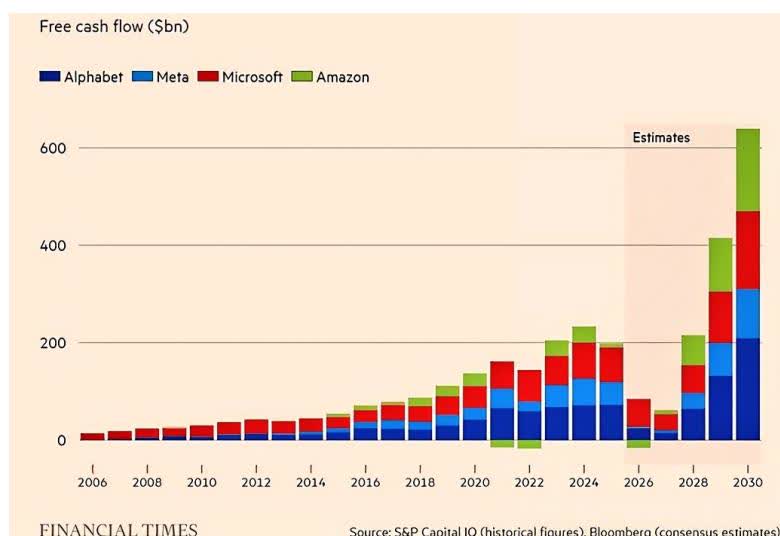
As we have noted before, Amazon is another member of this elite group generating high returns, and we think it is being quite rational by rapidly compounding its asset base at these returns. During the quarter, Amazon grew revenue by 17% and operating income by 30%. While the bears continue to complain about Amazon’s $200 billion in capex growth and dwindling free cash flow, we estimate this incremental capex will increase the 2025 total asset base by around 28%. With 30% cash flow growth on what we assume is at least 28% asset growth, we conclude Amazon is achieving at least as good, if not better, returns on capital than it has previously – yet the stock is trading near historically depressed multiples. This is another telltale sign to us that the Company’s aggressive free cash flow reinvestment is very rational and that the depressed valuation presents an excellent long-term investment opportunity for us. Moreover, we estimate the Company’s investment in Anthropic is worth at least $100 billion and, if realized, will serve as another effective hedge against commodity memory price inflation, especially in DRAM, over the next few years. That should be long enough to offset inflation until more DRAM capacity comes online to moderate prices.
Last but not least in the capex spending bonanza is Meta Platforms. While they have certainly received its share of criticism for recently increasing its 2026 capex plans by around $10 billion, citing DRAM inflation, we’d like to point out that the warrants Meta holds on Advanced Micro Devices (AMD), related to a strategic sourcing arrangement with AMD struck in late February (~5 months ago), are now worth close to $90 billion, by our estimate (a swift nine times more than the incremental DRAM inflation for 2026). Meta’s sourcing advantage from its massive scale gives it the bargaining power to keep commodity cost inflation in check, which investors are so worried about. Although this investment in AMD does not technically qualify as a GAAP-based accounting hedge, it is certainly an economic hedge that we believe investors have completely overlooked, even though it should serve to blunt the effects of DRAM inflation and bolster returns for years to come.
Another beneficiary of the AI spending boom has been Taiwan Semiconductor Manufacturing. Revenues grew by more than 40% (in USD), on top of 40% growth last year. Its leading-edge fabs and packaging capacity are fully booked, driving margins to all-time highs. Much of this capacity was put in place a few years ago, before generative AI was a household and business-wide term. More recent demand signals from customers – including Nvidia (NVDA), Broadcom (AVGO), and even Micron – indicate AI-related growth of over 50% per annum through 2029. Whereas the Company used to have demand visibility only a few quarters out, it now has visibility a few years out. As with long-held portfolio risk mitigation, we limit all positions to 10% weightings. We believe it is prudent to maintain this risk-management limit on the stock, especially given the massive investor inflows into semiconductor-levered stocks and the large speculative ecosystem (e.g., 2x- and 3x-leveraged single-stock ETFs) that has recently sprung up around them.
United Rentals was a top performer across portfolios. Equipment rental sales growth accelerated to 9%, while adjusted margins stabilized, driving 10% growth in earnings per share. This acceleration was driven by strong nonresidential construction end markets, particularly data centers and power projects, and by continued growth in megaprojects.
Apple was also a top contributor to performance during the quarter. Revenues grew 17%, driven by 22% growth in iPhone and 16% growth in services. The iPhone 17 family has catalyzed a solid upgrade cycle ahead of what we expect to be another strong launch later this year, featuring a new foldable form factor. Because input prices for DRAM have risen at a parabolic rate, the Company recently raised prices on some of its devices to pass these costs through. As one of the largest single purchasers of DRAM, the Company has strong negotiating leverage, but it can also implement hardware and software innovations to reduce its dependence on memory.
Visa contributed to quarterly performance, reporting accelerating revenue growth of 17%, driven by 11% growth in payment volumes and 21% growth in cross-border volume. Value-added services also grew 25% and now represent almost one-third of the Company’s total revenue. Agentic commerce remains nascent but could represent a new addressable market for Visa as the Company tracks and helps autonomous AI agents perform microtransactions. This contrasts with just a few quarters ago, when the market was fretting about the risks agentic commerce could pose. We think Visa’s global scale, including acceptance at over 130 million merchants, and deep integration with almost 15,000 financial institutions make it a valuable partner for agentic commerce startups.
Company Commentaries
Hermès
We recently initiated positions in Hermès International, one of the world’s leading designers, manufacturers, and retailers of ultra-luxury leather goods, apparel, and accessories.
Hermès began in 1837 as a harness and saddle maker in a Paris shop, after its founder, Thierry Hermès, trained for eight years as a master craftsman. From the beginning, the company focused on artisanal skill, high-quality materials, and exceptional craftsmanship, earning awards and serving a prestigious upper-class clientele in and beyond Paris, including world leaders and royalty. Over time, the Company expanded into adjacent equestrian-related product categories, including bags, leather gloves, and scarves, intended for riders. In the 20th century, with the advent of the automobile and the fading importance of horses, the Company applied its leather goods expertise to areas such as luggage, leather jackets, and handbags.
Today, the Company still produces equestrian equipment as part of its leather goods segment, which remains its largest at 44% of revenues. The Company has also built important businesses over time in apparel and accessories (28% of revenues), a highly recognizable and unique business in silk scarves and other fabrics (9% of revenues), and businesses in watches, beauty, perfume, and other areas.
The Company has likewise expanded from its single store on Rue Honore in Paris—which still exists—to nearly 300 stores globally. Top geographic markets now are Asia (over 50% of revenues), Europe (roughly 25%), and the Americas (roughly 20%), with sales in the Middle East relatively insignificant. However, Middle Eastern customers make sizable contributions to sales in other markets as tourists.
Over time, Hermès has continued to focus on the factors that led to its success nearly 200 years ago: using highly skilled artisans to hand-produce its products from the highest-quality materials. This has given the Company a lasting brand heritage that has driven demand, commanded deservedly high prices, delivered high, consistent profitability, and insulated the Company to a large degree from competition.
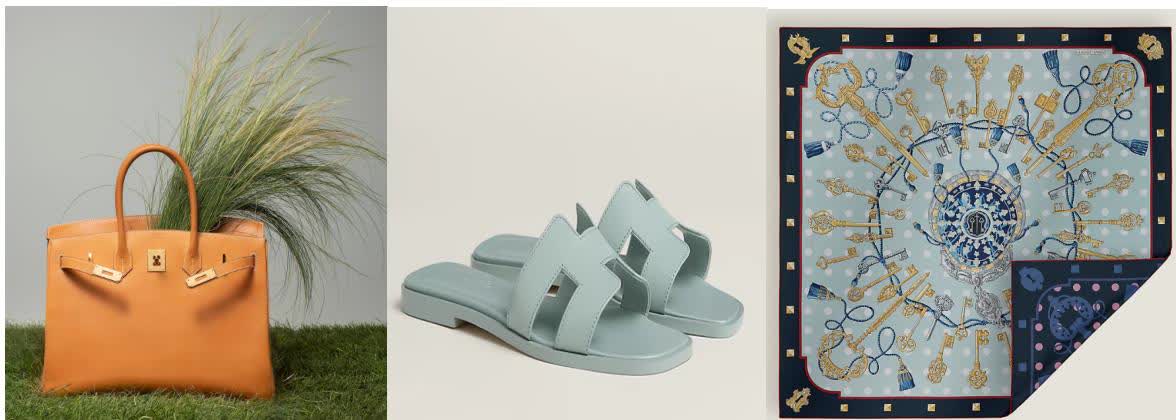
Hermès has repeatedly produced iconic products with decades of staying power, indicating that the brand’s success is not built on the caprices of fashion whims or fads but on its heritage and quality. Some of these products include the Birkin bag, first produced in 1984 after the Company’s CEO shared a plane journey with actress Jane Birkin, who complained that there were no fashionable handbags suitable for a young mother; the Oran sandal, first launched in 1997 and known for its quality, comfort, simplicity, and versatility; and the Company’s iconic silk scarves, produced in very limited runs in a variety of patterns, originally intended to protect the long hair of horse riders and now adapted for a variety of uses.
Many brand names do not mean anything. To demonstrate this, one need only survey the detritus of “brand names” littered all over Amazon, which are clearly made-up noises for cheap, low-quality commodity products. Any company can spend advertising money to tell you that its product is great, preferably through some of our long-time holdings, Meta and Google. Advertising generally seeks to lead consumers to attribute some credit or personal affection to those brand names. Most of those companies are mass-producing products with cheap materials and methods in low-cost manufacturing markets; or perhaps with slightly better materials, methods, or manufacturing; or by trying to convince you that they are doing so with better design sensibilities, which are in fashion and sometimes are not.
Producing luxury goods by the hands of the most skilled artisans in markets such as France or Italy, using the highest-quality materials, which are usually produced in these same markets, is in fact a unique, personal appeal. Doing so with a brand that has developed a decades-long reputation for this (nearly centuries-long, in the case of Hermès), in reality and not only in an advertising pitch, earns you a loyal, often multigenerational following, which should lead to established premium pricing and sustainable high margins.
Selected Apparel, Footwear, and Accessories industry peers
EBIT margins, most recent FY
The Company’s long-term focus on the highest quality has led to sustainably strong demand and exceptional profitability. While we have found it difficult to obtain reliable, easily comparable data for the luxury goods industry—and there is an array of definitions of what “luxury” is—we can provide a direct comparison between Hermès and the U.S. Apparel, Footwear, and Accessories industry, which will be most familiar to our readers and comprises the majority of our investment opportunities in this segment.
According to the U.S. Bureau of Economic Analysis, U.S. personal consumption expenditures on clothing, footwear, and related services have grown at a compound annual growth rate of about 2.8% over the past 20 years.
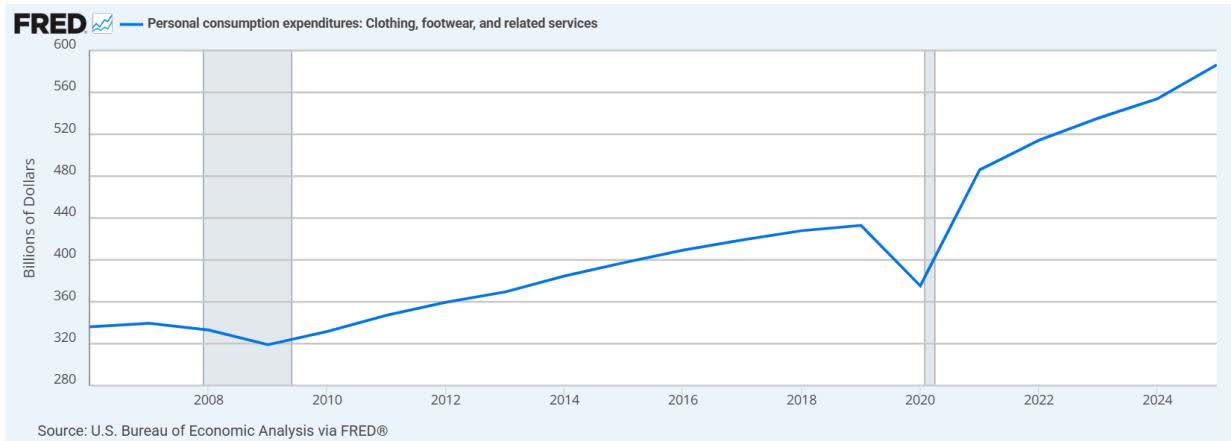
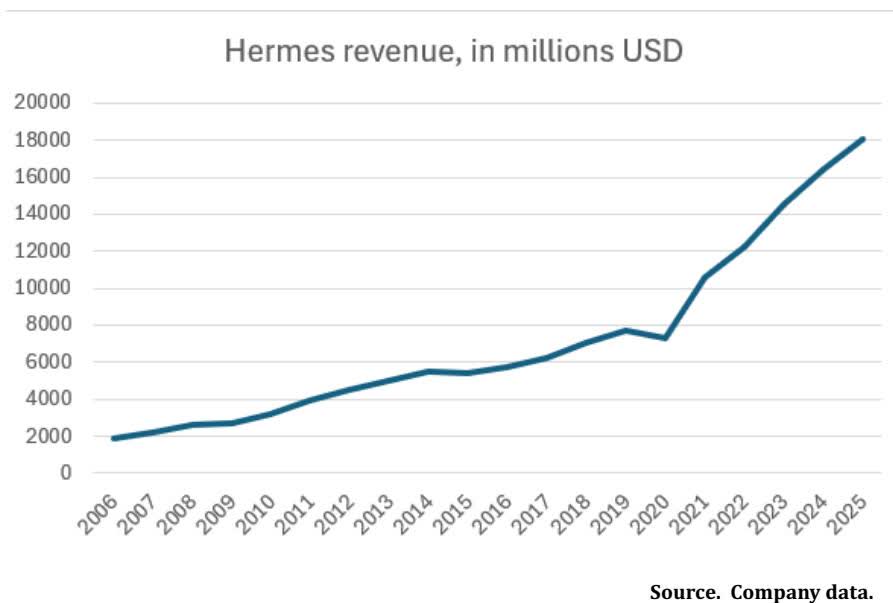
Over the same period, Hermès has seen its revenue growth compound at 11.8%. Given the varying definitions of the global luxury goods market and the lack of particularly good data available to us, our best approximation is that the luxury market itself has roughly tripled over this time, for a CAGR of roughly 5.5%. Although the luxury apparel-footwear-accessories market has outgrown the standard market for those categories, the Company has capitalized on its strategy and heritage to deliver outsized growth relative to its industry. We would note that this period included two of the most traumatic economic periods in recent history: the 2007-2009 global financial crisis and the 2020 pandemic.
Another interesting component of the Hermès story, and of the ultra-luxury world in general, is the supply side of the equation. One could reasonably point out that a business strategy to limit supply is a sound approach in an industry seeking to cultivate an air of exclusivity and sustain high prices. An important point in the luxury goods industry is that supply appears constrained, whether or not that is a company’s strategy. Again, although solid industry data are hard to come by, our readers could search “luxury goods artisans’ shortage” and find more than 10 years of articles lamenting the shortage of skilled artisans in the industry.
The aging of the workforce, as older artisans retire and are not replaced, and the younger generation’s aversion to manual work. We understand that a skeptical person might not take some industry pronouncements at face value, and that a fear of supply shortages may drive both pricing and demand—we have found projections saying the industry is 20,000 artisans short. We have found others saying the industry is 90,000 people short, and there may be some leeway in those numbers. However, we would point out that luxury companies across the industry, as well as the governments of France and Italy in particular, have been investing in training and schools to encourage more people to enter these positions. Hermès itself has opened 24 workshops in its leather goods division, with four more scheduled to open over the next four years. Industry peers LVMH and Bottega Veneta likewise have invested heavily in training and education, and some Italian luxury houses are even making agricultural investments to support Italian silk and wool production.
So, we would say that Hermès and the rest of the industry may have planned for some supply scarcity over time as an effective strategy. Still, there seems to be a genuine scarcity of skilled artisans, with fairly compelling evidence that companies and governments are investing to prevent the supply situation from worsening. Again, we will point out that when you combine strong, consistent demand with limited and arguably declining supply, you get the pricing power and high profitability that we see with Hermès.
Turning to a real-life example, let’s refer back to the iconic Birkin bag. Perhaps you know someone who would like to get their hands on a new one? Here’s how. First of all, walking into a Hermès store isn’t going to do it. The bags are made in very limited quantities, so there will not be any in stock, and the few that trickle into stores are immediately sold by allocation to the store’s most important customers. How do you become one of the most important customers? You develop a long personal relationship with one of the sales associates. The key to this relationship is consistently spending a lot of money on other Hermès products. Sifting through various blogs, it seems you might be expected to spend at least one to two times the price of the Birkin bag before you even have a chance, at which point you might be offered one in a period somewhere between six months and three years later. If you are so lucky, retail prices start around $15,000 for smaller bags made from the company’s “base leather, ” and you can spend multiple times that amount on other designs. If you aren’t able to get an allocation directly from the store, though, don’t worry – you can buy the same bag from someone selling it on the secondary market for roughly double that price. This is very powerful brand equity for a bag introduced 42 years ago. This brand is not a fad. We also highly suspect that this brand equity would no longer exist if Hermès had chosen at some point to skimp on artistry or materials.
On the valuation front, the stock is rarely what many people—especially those outside the U.S. large-cap growth arena—would call “cheap.” Still, we note that significant insider ownership (the family owns 66.7% of the shares) serves as a valuation floor, and a business model of this quality warrants a premium valuation. The stock recently retreated to a more reasonable level after the company’s most recent results showed a modest negative impact from the outbreak of war in the Middle East. This disrupted some travel and particularly weighed on the business of Middle Eastern customers in tourism markets worldwide; we view this impact as temporary.
In summary, we believe Hermès is a true example of a company with significant brand equity, earned through an established, nearly 200-year history of doing things that are not easily replicated: having skilled artisans produce the highest-quality products from the highest-quality materials. The process and the brand work together to create both significant demand for the company’s products and significant profitability, and we expect the company to continue this trajectory of growth and profitability.
Are Hyperscalers Still Magnificent?
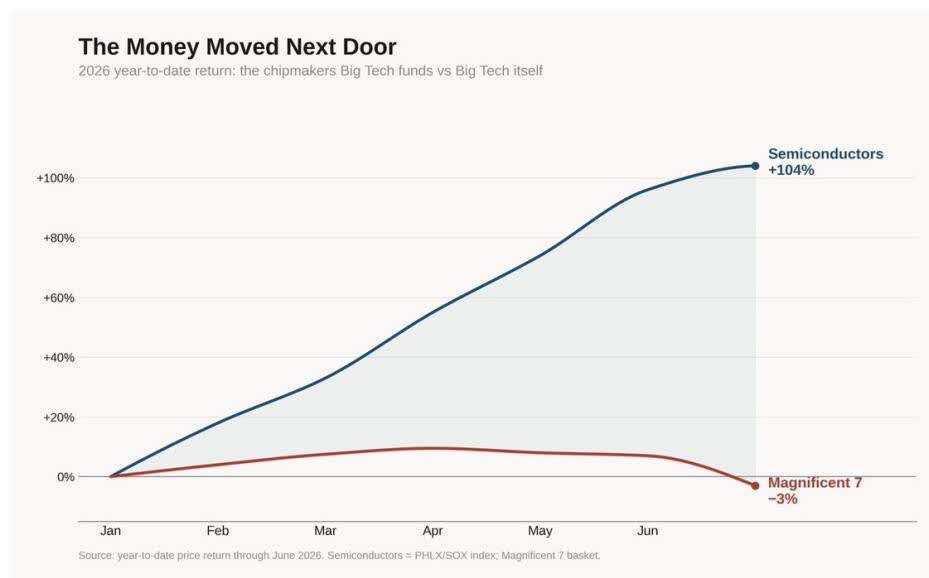
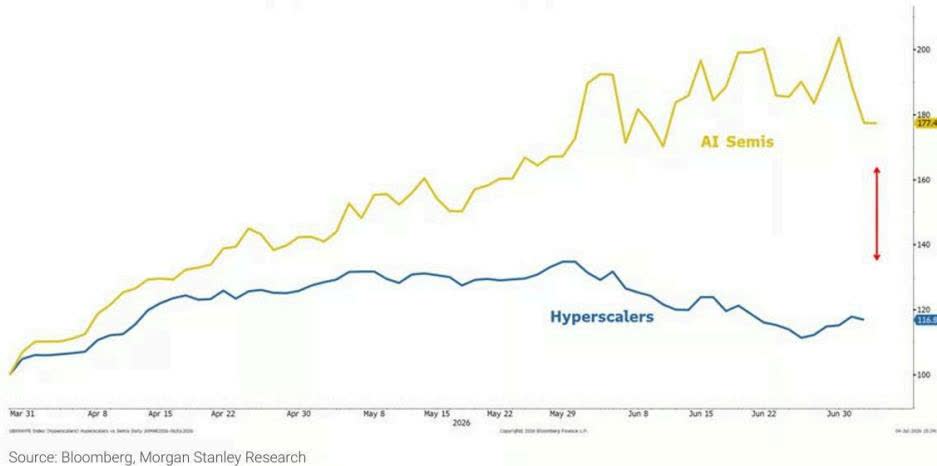
Exhibit 7: Divergence between Hyperscalers and Semis Likely to Close As Capex May No Longer Be Rewarded Unequivocally in the Markets for Now
Are the Magnificent 7, particularly the hyperscalers, still magnificent? We certainly think so and have increased our weightings accordingly. Recall the Mag 7: Apple, NVIDIA, Tesla (TSLA); and the four “hyperscalers” – Alphabet, Amazon, Meta Platforms, and Microsoft. For some background, we’ve owned Alphabet and Apple for two decades, Meta Platforms for years, Microsoft for a few years, and, more recently, Amazon.
With the exception of Alphabet, which has generated stellar returns over the past one, three, and five years, the other three hyperscalers’ stocks have struggled mightily in 2026. The headwinds for hyperscalers are manifold. First, sentiment has turned quite negative, with the view that spending hundreds of billions to build out AI platforms will certainly benefit technology hardware companies but also materially harm the profitability of the hyperscalers. Second, billions rotating into technology hardware stocks (particularly memory stocks) have been funded relentlessly by selling hyperscaler stocks. On this score, semiconductors currently make up nearly 25% of the S&P 500 Index, up from about 5% just a few years ago. Third, IPO funding for SpaceX and, prospectively, for the IPOs of Anthropic and OpenAI has come at the expense of selling hyperscaler stocks.
Earlier in the Letter, we made our case that the short-term hit to hyperscaler free cash flow, although real, is outweighed by the fact that current hyperscaler profitability is better than most fear. More pertinent to our longer-term bullish view, we expect the hyperscalers’ platforms to be central and critical to managing and providing AI for enterprises of all sizes.
The following graphics illustrate the outsized performance of semiconductor stocks. No doubt, the explosion in capex by hyperscalers has, in turn, boosted earnings for many technology hardware companies, but none more than semiconductors. Please note that our best-performing stock over the past one-, three-, and five-year periods has been Taiwan Semiconductor Manufacturing. The stock has also been among our largest positions. In addition, because the stock is an ADR, it is not part of the benchmark indices. In other words, our position in the stock has been pure active share. That said, our underweight in semiconductors over recent years has been a significant performance headwind.
We have a long history of investing in semiconductor stocks. Over the decades, these stocks have included Intel (INTC), Micron Technology (MU), Applied Materials (AMAT), Linear Technology, and Analog Devices (ADI). The key lesson we have learned (we have the scars to prove it) is that the semiconductor sector is notoriously cyclical, both in business cycles and in stock prices. These stocks are the epitome of a “momentum” stock. When business is booming, earnings estimates are typically far too low relative to actual results. Demand, combined with pricing power, drives incredible margin increases. Further, in boom times, earnings soar, and expectations for future earnings do as well. Stocks boom. Said through the lens of fundamentals, peak earnings deserve trough valuations.
The current semiconductor cycle is historic. Consider SK Hynix (SKHY)’s recent results. The South Korean company holds a majority share of high-bandwidth memory, which is essential for the current generation of GPUs. Revenue of $35.5 billion was up 198% year over year, crushing consensus estimates, and the company’s net income surged 398%. Not to be outdone, Micron Technology’s profit surge is one for capitalism’s history books.
(An aside. As this Letter is being finalized – June 13 – Some froth has come out of semiconductor memory stocks – at least the casino-like trading in South Korea stocks. Consider, the 3X levered SK Hynix fund, which was launched just 30 days ago, peaked at $36. Today it is trading at $4. The 2X fund has too crashed, down -70% from recent highs.)
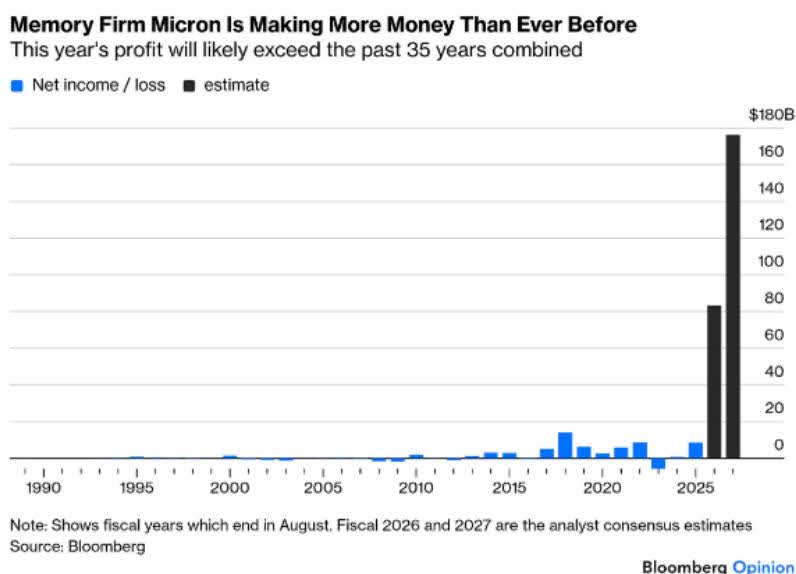
Memory company earnings will surely grow over the next few years, at least until demand cools and/or supply shortages wane. However, and this is key, it only takes a modest cooling in current red-hot demand or a modest easing of the significant supply shortage for these stocks to drop as suddenly as they have risen because expectations reverse; earnings expectations will always be too high once growth-rate deceleration kicks in. It is the second derivative change in the rate of growth that matters. This is how cyclical top traps are set. The market always sniffs out a peak in earnings growth acceleration well before the cycle turns. Again, it matters little if earnings continue to grow; the stocks lead fundamental results, often by years.
Exhibit 2: DDR4 8Gb spot is trading at 38% premium vs. latest contract price – DDR4 8Gb spot pricing premium/discount vs. contract
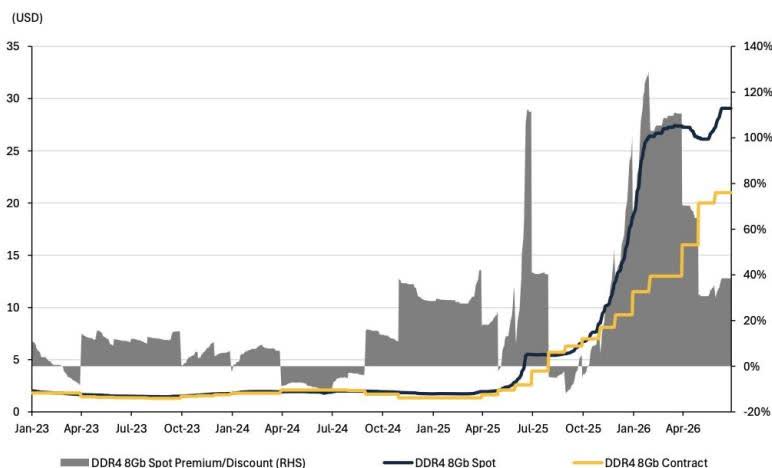
Source: Trendforce
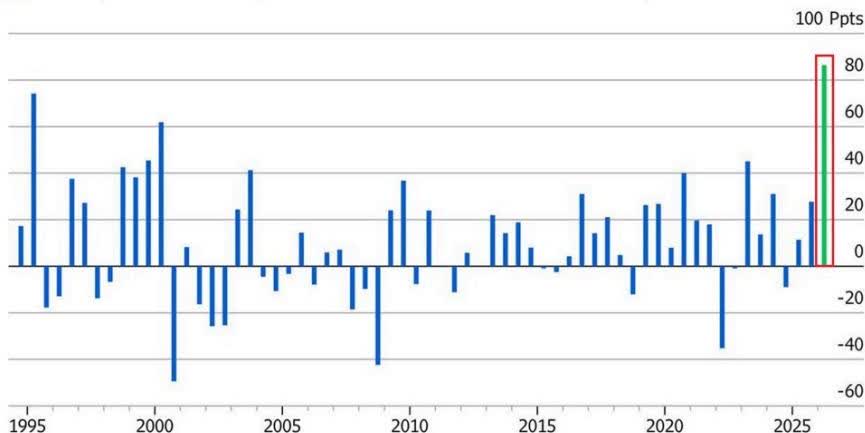
Chip Stocks Head for Best First Half Versus S&P 500 Ever
■ Philadelphia Stock Exchange Semiconductor Index – S&P 500 Index 1H performance
Source: Bloomberg
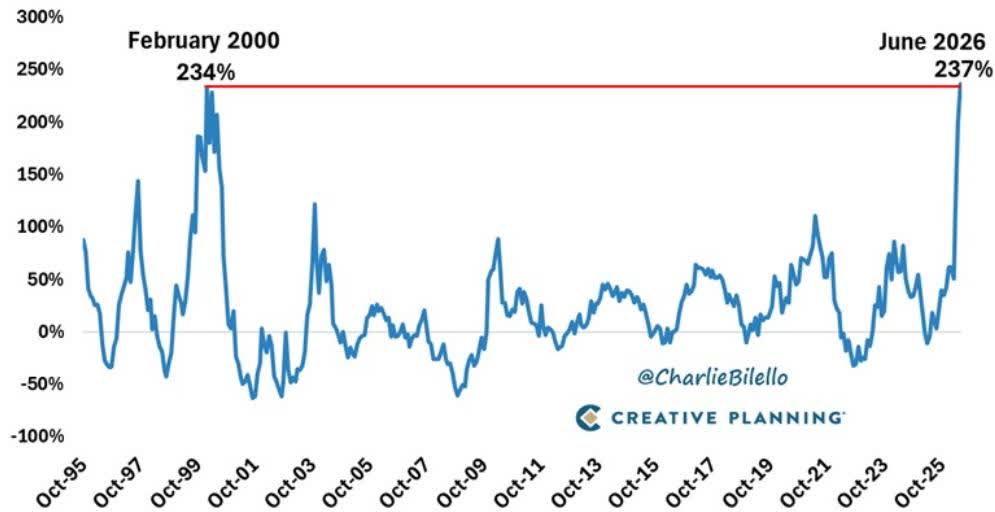
Semiconductor Index (($SOX)) – Rolling 14-Month Returns
(October 1995 – June 2026 – as of 6/30/26)
Semiconductor Weight in the S&P 500
Since 1995
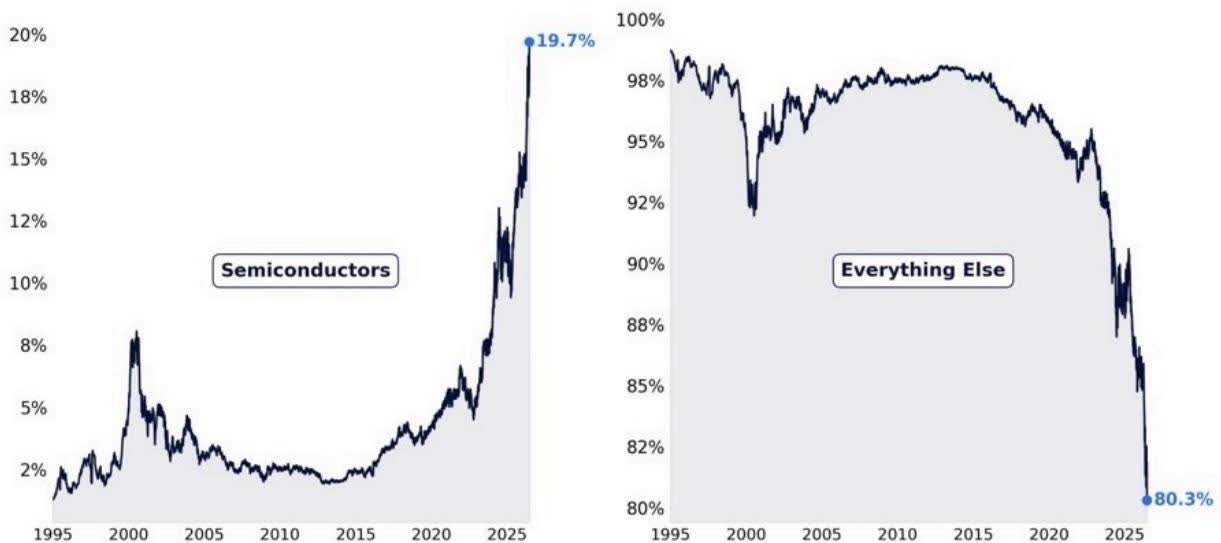
Source: Bloomberg, S&P Global, as compiled by Citadel Securities, GMI, as of June 2026. Figures are for illustrative purposes only. Past performance figures do not guarantee future results.
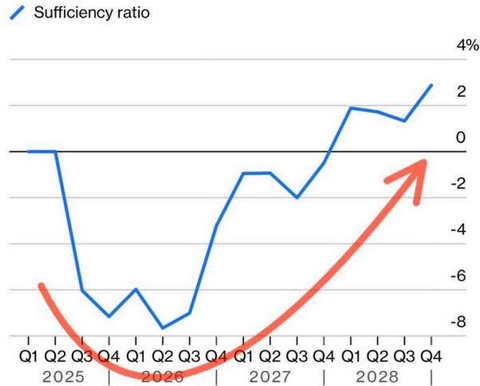
Memory Shortage Won’t Last Forever
The industry might be oversupplied as early as 2028
Source: Bloomberg Intelligence Bloomberg Opinion
We are reposting this graphic from the title page.
Source: Refinitiv, as of 11/10/2025. File #1077
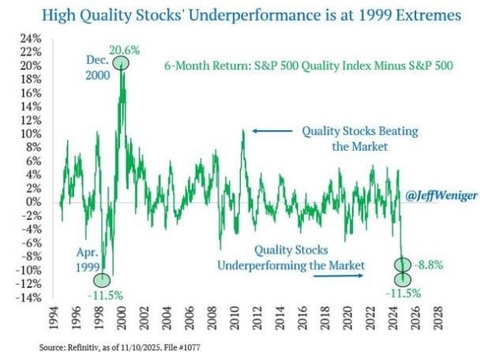
Big Mo’s Low-Quality Rally – High-quality stocks with strong balance sheets continue to be pummeled

Note: Figures show long-short total return starting 04/02/2025 (Liberation Day). Source: Bloomberg Factors To Watch Bloomberg Opinion
As we have written (and discussed with clients) over the past 34-plus years, we usually underperform when momentum strategies are ascendant. That has been true over the past 15 months. Our underperformance has been stark. From mid-April 2025 through June 30, our Composite is up 25%, a relative pittance compared with the 90% gain for the Invesco
S&P 500 Momentum ETF (SPMO). It is little surprise that the SPMO portfolio is composed of 50% technology stocks, mostly semiconductor stocks, plus other AI-related stocks that dominate the largest holdings within the large-cap benchmark indices.
We continue to fish in the high-quality pond. So far, this scarlet-letter pond continues to yield opportunities. In recent months, we’ve added Chubb, Toll Brothers (TOL), United Rentals, Progressive, and, most recently, Hermès. Good fishing.
David A. Rolfe, CFA | Chief Investment Officer
Michael X. Quigley, CFA | Senior Portfolio Manager
Christopher T. Jersan, CFA | Portfolio Manager
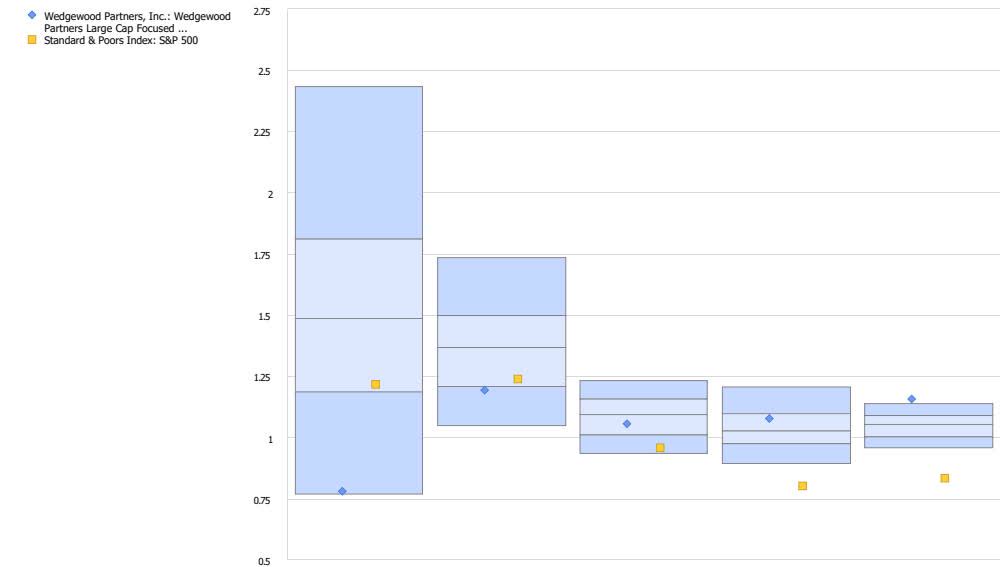
Universe: eVestment US Large Cap Growth Equity (Percentile)
References
- 1 Portfolio returns and contribution figures are calculated net of fees. Contribution-to-return calculations are preliminary. The holdings identified do not represent all securities purchased, sold, or recommended. Returns are presented net of fees and include the reinvestment of all income. “Net (actual)” returns are calculated using actual management fees and are reduced by all fees and transaction costs incurred. Past performance does not guarantee future results. Additional calculation information is available upon request.
Editor’s Note: The summary bullets for this article were chosen by Seeking Alpha editors.
Editor’s Note: This article covers one or more microcap stocks. Please be aware of the risks associated with these stocks.
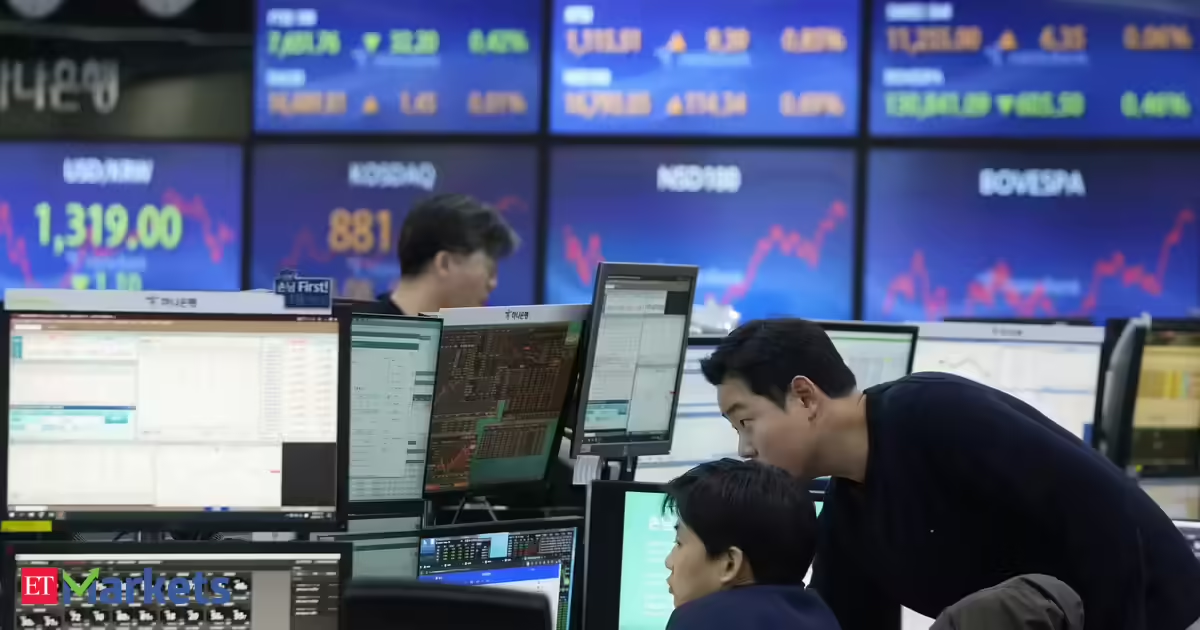
MSCI’s Asia Pacific equities gauge dropped 1.1%, with South Korea leading with a 4.5% decline. Chip bellwether SK Hynix Inc. tumbled over 8.4%. Shares in Japan also declined with the Nikkei dropping over 2%.
Meanwhile, crude oil extended gains as the US launched fresh strikes on Iran, raising concerns that Middle East tensions will further disrupt energy supplies. Brent climbed for a fourth consecutive day to over $85 a barrel.
Australian and New Zealand government bonds opened higher, tracking gains in Treasuries after softer-than-expected US producer price inflation for June. That prompted traders to further dial back wagers on Federal Reserve interest-rate increases this year. A Bloomberg gauge of the dollar steadied after two days of losses.
While inflation reports this week eased concerns over near-term Fed hikes, the escalating conflict in the Persian Gulf has revived concerns over energy supplies from the region. Investors are also assessing whether strong earnings can sustain the artificial intelligence rally after sharp swings in semiconductor stocks exposed lingering concerns over the sector’s lofty valuations.

“There’s no near-term pressure on the Fed, but oil is in the driver’s seat over the longer term,” said David Russell at TradeStation. “Energy saved the day in June, but that might become ancient history if the Strait of Hormuz doesn’t open soon.”
A US-Iran interim peace deal signed around a month ago has all but collapsed over the past week as the two sides feud over control of the vital strait, through which Saudi Arabia, Qatar, the United Arab Emirates and others send most of their energy exports. The latest attacks come as US President Donald Trump pledged to intensify the bombardment until Tehran stops attacking ships in the Strait of Hormuz and agrees to open the waterway.
Elsewhere, the chip sector remained in focus after a volatile month. After SK Hynix Inc.’s American depositary receipts fell 9% on Wednesday, investors will look to Taiwan Semiconductor Manufacturing Co.’s earnings later Thursday for a fresh read on the AI buildout.
Business
PTC Inc. (PTC) Discusses Unlocking Business Value and Growth Opportunities in Modern ALM Prepared Remarks Transcript

Oliver Becker
Hello, everyone, and welcome to today’s webinar. It’s great to have you with us, whether you are joining live or listening to the recording later. My name is Oliver Becker, and as a new member of the Alliance management team, I’m focusing on our ALM solutions portfolio at PTC. Before that, I spent the past years with several roles around PLM and product line engineering with Pure Variants.
Today’s session is focused on the significant business potential we currently see in the ALM space and more importantly, how we as partners can unlock this potential together to create greater value than any of us could achieve individually. I hope that this session will inspire you to gain business out of this super cycle intelligent product engineering.
Before we get started, just a few quick housekeeping points. The webinar will last approximately 45 minutes. You can submit questions at any time using the chat box below. We will do our best to respond to your questions directly in the chat during the session, and any open questions will be answered afterwards in writing. So please feel free to engage with us throughout the webinar. We are looking forward to your input.
With that, let’s take a look at today’s agenda and introduce our guest speakers. Joining us today from our office in Budapest, I’d like to introduce our first speaker, Peter Haller. Peter knows Codebeamer and the ALM market like very few others. As Director of Solution Consulting, he has been involved in countless customer discussions and brings a deep understanding of the challenges and opportunities in the space. Today, he will walk us through the true potential of ALM and

SEATTLE — Amazon.com Inc. shares rose nearly 3 percent Tuesday to around 254.84, reflecting investor confidence in the e-commerce and technology giant’s diversified business model and accelerating cloud performance driven by artificial intelligence demand.
The move extended recent gains as Amazon benefits from its leadership in online retail and dominance in cloud computing through Amazon Web Services. With fiscal second-quarter results expected later this month, the stock’s performance underscores optimism about sustained growth across segments despite economic uncertainties.
Amazon Web Services continues to power much of the company’s profitability. The cloud unit has seen robust demand for infrastructure supporting AI training and inference, with major enterprises and startups scaling operations on its platform. AWS has introduced specialized instances and services optimized for generative AI workloads, helping maintain its market position against competitors.
Retail operations, Amazon’s original core business, have shown resilience. Prime membership growth, improved logistics efficiency and advertising revenue have supported margins even as consumer spending patterns evolve. The company has invested in automation and delivery networks to handle peak volumes while controlling costs.
Tuesday’s trading came amid broader market rotations favoring established technology leaders with visible earnings trajectories. Amazon’s balance of consumer exposure and high-margin cloud business appeals to investors navigating AI hype cycles and potential economic slowdown risks.
The company has aggressively expanded its AI capabilities. Investments in data centers, custom chips and machine learning tools position it to capture spending from businesses adopting generative technologies. AWS’s Anthropic partnership and Bedrock platform have gained traction as enterprises seek secure, scalable AI solutions.
Amazon’s advertising business, integrated across its retail sites and streaming services, has delivered strong growth. Targeted ads leveraging customer data and shopping behavior have become a significant profit contributor.
Streaming and entertainment through Prime Video and MGM content continue to expand the subscriber base. Investments in original programming and sports rights aim to enhance value for Prime members while generating additional revenue streams.
International markets remain a growth opportunity. Amazon has optimized operations in key regions, adapting to local preferences and regulatory environments. E-commerce penetration in emerging markets offers long-term upside.
Capital expenditures have risen to support cloud expansion and logistics improvements. While pressuring near-term free cash flow, these investments are viewed as essential for maintaining competitive advantages in AI infrastructure and delivery speed.
Amazon’s balance sheet strength, including substantial cash reserves, provides flexibility for acquisitions, share repurchases and debt management. The company has returned capital to shareholders through buybacks while funding organic growth.
Recent product launches, including improved Echo devices and Fire TV hardware, aim to deepen ecosystem engagement. Integration of AI assistants across devices enhances user experience and creates stickiness.
Analysts project continued revenue expansion for the current quarter and full year. Consensus estimates highlight mid-teens growth in retail and stronger cloud performance, with operating margins expected to hold or expand.
Tuesday’s share price movement reflected positive sentiment ahead of earnings. With no major negative developments, the stock benefited from technical strength and sector momentum.
Amazon’s culture of innovation, exemplified by its leadership principles and long-term orientation, continues to drive experimentation in new areas such as healthcare, satellite communications and robotics. While some initiatives are still maturing, they diversify risk and open future revenue channels.
Regulatory challenges persist, including antitrust scrutiny in multiple jurisdictions. Amazon has defended its practices while making adjustments to comply with evolving rules around marketplace fairness and data usage.
Sustainability efforts, including renewable energy commitments for data centers and packaging reductions, align with customer and investor expectations. Progress on these fronts supports brand reputation in an environmentally conscious market.
As the second-quarter earnings approach, focus will center on AWS growth rates, retail margin trends and capital spending guidance. Management commentary on AI opportunities and macroeconomic conditions will shape market reaction.
Amazon’s dual role as retailer and technology infrastructure provider gives it unique advantages. The flywheel effect, where retail data informs cloud services and vice versa, creates competitive moats difficult for pure-play competitors to replicate.
Prime Day, the annual shopping event, recently demonstrated the power of the membership program to drive sales across categories. Record participation highlighted consumer engagement even in a selective spending environment.
International e-commerce, particularly in India and Europe, shows promising trends. Localized investments in fulfillment centers and payment options are yielding results.
The company’s venture investments and acquisitions have bolstered capabilities in areas like autonomous delivery and entertainment content. Strategic capital allocation remains key to long-term value creation.
Wall Street consensus remains bullish, with many analysts citing Amazon’s scale, execution track record and exposure to high-growth AI markets. Price targets reflect expectations of continued market share gains.
Potential risks include intensifying competition in cloud, supply chain disruptions and consumer pullback if economic conditions worsen. However, Amazon’s diversified revenue mix provides buffers.
The latest stock advance adds to substantial market value created in recent sessions. Investors appear focused on fundamental strengths rather than short-term noise.
Amazon’s transformation from online bookseller to global technology leader spans decades. Its ability to enter and dominate new categories suggests capacity to capitalize on emerging opportunities in AI and beyond.
As fiscal 2026 progresses, Amazon is well-positioned to deliver growth while investing for the future. The combination of mature businesses generating cash and high-potential segments offers an attractive profile for long-term investors.
Tuesday’s trading provided a snapshot of market enthusiasm for companies with clear AI tailwinds and proven operational discipline. Amazon exemplifies both attributes.
The company’s upcoming results will offer further insight into execution across segments. Strong performance could reinforce its status as a core holding in technology portfolios.
Amazon continues to shape consumer behavior and enterprise technology landscapes. Its scale, data assets and innovation culture position it favorably for sustained leadership.

California Post opinion editor Joel Pollak joins ‘Varney & Co.’ to discuss Gov. Gavin Newsom’s wealth tax proposal and a major California SNAP fraud investigation.
California lawmakers are warning that a tax credit cap in Gov. Gavin Newsom’s final state budget could derail the state’s push to keep Hollywood jobs in the state.
In a July 10 letter obtained by FOX Business, 39 California legislators urged Newsom and other lawmakers to exempt the state’s Film & Television Jobs Program — aimed at keeping productions in the Golden State — from the cap. They warned the change could “significantly kneecap” the program, which was expanded just last year.
“We understand the budget agreement is in place, but this problem must be fixed before the end of this session,” lawmakers wrote.
The warning came shortly after Newsom approved his final state budget as California governor, a $351.7 billion spending plan that tightens limits on business tax credits.
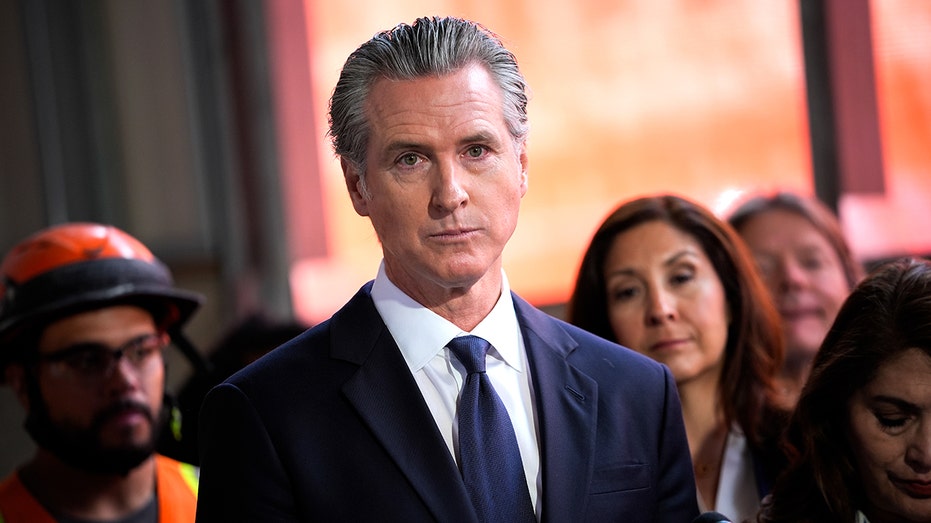
The letter came shortly after Gavin Newsom approved his final state budget as California governor. (Tayfun Coskun/Anadolu via Getty Images)
The budget extends California’s current temporary $5 million business tax credit cap for three years, through 2029. Starting in 2030, companies will be limited to claiming $5 million or 70% of their state tax liability in a given year — whichever is greater.
Critics say the cap could hit California’s film and TV incentives, leaving studios unable to fully use credits they earned for shooting in the state. Lawmakers said the move would amount to “retroactively changing the rules.”
“As a result, many production companies will lose the full value of tax credits they earned in exchange for creating middle-class entertainment industry jobs with health care and retirement with dignity as well as the other economic benefits the industry brings to the state,” the letter states.
The lawmakers also noted that California’s updated film program has kept 133 productions in the state from August 2025 through April 2026, generating $5.5 billion in economic activity, 38,050 cast and crew jobs and 247,934 days of work for background actors.
NEWSOM’S POLITICAL DEFENSE FACES SKEPTICISM AS DOJ INVESTIGATION CONTINUES

The budget extends California’s current temporary $5 million business tax credit cap for three years, through 2029. (David Swanson/AFP via Getty Images)
“For 100 years, California was the home of film and television production. That is the past. What the Legislature does to address the problem created in SB 122 determines if that remains true into the future,” the letter states.
Southern California’s film and TV industry has struggled to recover from the pandemic, 2023 Hollywood strikes and productions leaving for other states and overseas, the Los Angeles Times reported.
Assemblyman Rick Chavez Zbur, D-Los Angeles, told the Los Angeles Times that lawmakers believed the film program had been carved out of the cap.
“I don’t think that anyone understood what this cap was, what it did and that it effectively kneecapped and reverses the progress that we made last year,” Zbur told the outlet. “We need to have people understand that these changes, which I think people believed were minor, are really significant and will result in significant job loss if we don’t fix them.”
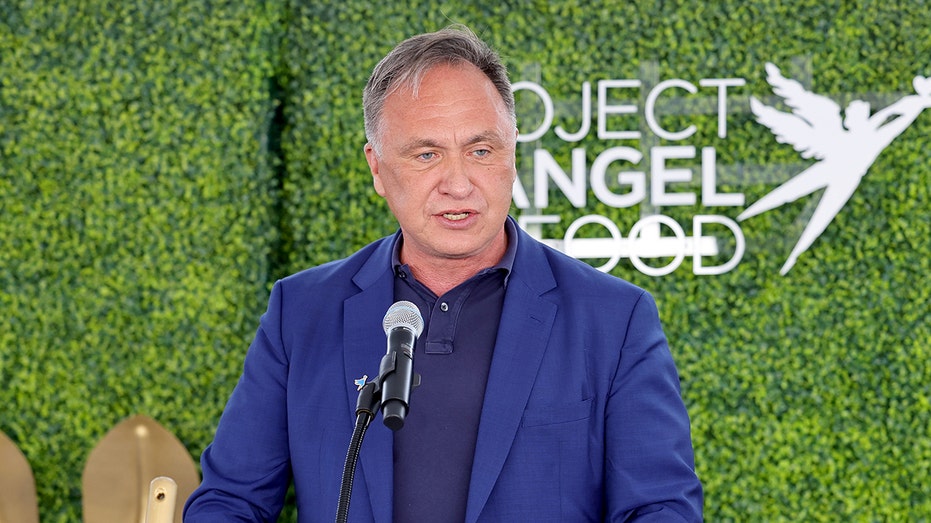
State Assemblyman Rick Chavez Zbur told the Los Angeles Times that lawmakers believed the film program had been carved out of the cap. (Matt Winkelmeyer/Getty Images)
GET FOX BUSINESS ON THE GO BY CLICKING HERE
Newsom spokesperson Marissa Saldivar told the Los Angeles Times the tax credit limit is part of a “broader fiscal proposal” to keep the state making “strategic investments” while maintaining long-term stability.
“We remain confident in the strength of the recently expanded Film and Television Tax Credit Program and will continue to work with industry and legislative partners to ensure the program is competitive,” Saldivar said.
Newsom and Zbur could not immediately be reached by FOX Business for comment.

Low auction clearance rates are just part of the housing downturn story, as more vendors give up on auctions altogether in favour of private sales.
The share of homes listed via auction has dropped from a peak of 45 per cent in November 2025 to just over 30 per cent in June, according to data from property analytics firm Cotality.
Cooling buyer demand has reshaped the market and driven more sellers towards listing their homes via private treaty, said Cotality head of research Gerard Burg.
“During times of strong demand, vendors clearly favour auctions as competition between multiple bidders can result in a higher price,” Mr Burg said.
“However, they have been shying away more recently in this weaker demand environment.
“This has been seen in an increasing tendency to sell ahead of the auction date as well as a rise in withdrawals, pointing to vendors who are increasingly unwilling to test the market at an auction and have the property fail to sell.”
Like auction clearance rates, home prices have been cooling for months as Reserve Bank rate hikes, rising inflation and global economic uncertainty hit buyer sentiment.
Changes to negative gearing and capital gains tax concessions in the May budget further sapped demand from property investors.
Sydney home prices fell 1.2 per cent in June and are 3.7 now below their peak in January, while Melbourne values are four per cent below their March 2022 high.
But David McMahon, Ray White head of auctions for NSW, said it was a stretch to call it a buyers’ market.
“I think it’s a pretty fair market,” he told AAP.
Sellers tended to move away from auctions whenever the market weakened, but there was still value in going through the auction process, Mr McMahon said.
When comparing an auction campaign, including the two weeks following auction day, to a private treaty process over the same period, auctions still offered a higher clearance rate, he said.
But many agents discouraged vendors from going to auction, Mr McMahon said.
“No one likes standing on auction day with no bidders and not selling.”
Although the auction market tended to slow down during the winter months, the current downturn had gone beyond regular seasonal factors, Mr Burg said.
“What we have observed over the past few months has been a steady decline in sales volumes as demand-side pressures have built, meaning that there have been fewer buyers in the market,” he said.
Despite the fall in listings, the auction share is still above the long-term average of around 28 per cent, suggesting private sales will continue to take a bigger slice of the market.


Peter Arendas is an associate professor at the University of Economics in Bratislava. He has over 15 years of investing experience. Peter specializes in covering small and mid-cap companies in the resource sector with an in-depth insight into the precious and industrial metals royalty & streaming industry.Peter is the leader of the investing group Royalty & Streaming Corner where he offers in-depth analysis of long-only investment ideas, actionable research, model portfolios, discussions of the latest news, and direct access for questions in chat. Learn More.
Analyst’s Disclosure: I/we have a beneficial long position in the shares of ELE, RGLD either through stock ownership, options, or other derivatives. I wrote this article myself, and it expresses my own opinions. I am not receiving compensation for it (other than from Seeking Alpha). I have no business relationship with any company whose stock is mentioned in this article.
Seeking Alpha’s Disclosure: Past performance is no guarantee of future results. No recommendation or advice is being given as to whether any investment is suitable for a particular investor. Any views or opinions expressed above may not reflect those of Seeking Alpha as a whole. Seeking Alpha is not a licensed securities dealer, broker or US investment adviser or investment bank. Our analysts are third party authors that include both professional investors and individual investors who may not be licensed or certified by any institute or regulatory body.

Fresh photos show upgrades to London Stansted Airport ahead of huge transformation

BMW recalls nearly 30,000 hybrid vehicles over engine starter fire risk

Sky TV research exposes postcode lottery in girls’ sport participation


-

 Fashion7 days ago
Loro Piana Fall 2026 Enters Houston’s Art Scene
-

 Fashion5 days ago
Weekend Open Thread: Nutriplenish Leave-In Conditioner
-
 Sports6 days ago
2026 Genesis Scottish Open Thursday TV coverage: Round 1
-

 Sports6 days ago
Super Eagles star Moses Simon opens up on Liverpool transfer regret
-

 Tech7 days ago
Character.AI enters the microdrama arena with its own productions, but there’s a twist
-

 Politics15 hours ago
Young campaigners urge incoming PM to act on outdoor junk food ads
-

 News Videos1 day ago
XRP BOMBSHELL… XRP OMBOARDED FOR TRANSACTIONS!!!
-
 Tech2 days ago
Get Your ESP32 Sunny Side Up With This Solar Dev Board
-

 Tech1 day ago
Dark Secrets Emerge When Jailbreaking LLMs
-
 Sports5 hours ago
New Cornerback Enters Vikings Trade Rumor Mill
-
 Entertainment10 hours ago
Disney’s Most Ambitious Failed Star Wars Attraction Is Coming to SDCC
-

 Tech7 days ago
Level Infinite Launches Gangstar Mirage City in India with Pre-Registrations
-
 NewsBeat7 days ago
Major update after Huntingdon train attack as man enters plea
-

 News Videos2 days ago
how to make coin bank box with cardboard #scienceproject #money #diy #shorts
-
 Tech2 days ago
Cloudflare Precursor Watches Your Mouse and Keyboard To Decide If You Are Human
-
 Entertainment8 hours ago
Vicki Gunvalson Defends Discussing Heather Dubrow’s Money
-

 NewsBeat5 hours ago
Watch: Is Donald Trump facing a popular backlash on immigration?
-
Crypto World2 days ago
Ripple, Coinbase, Circle Join Linux x402 Foundation to Help Shape AI Payments
-

 Sports3 hours ago
Michigan officials not expected to discuss AD Warde Manuel at Thursday meeting
-
 NewsBeat5 hours ago
Firefighters issue update on Dovestone moorland blaze as fire enters fourth day
You must be logged in to post a comment Login