
Crypto World
Google backs $15B Anthropic data center in Texas



Google is reportedly backing a proposed $15 billion financing package for an Anthropic-linked data center in Texas, extending an AI infrastructure boom that has also lifted Bitcoin miners expanding into high-performance computing.
Summary
- Nexus is in advanced talks to raise $15 billion for its Hubbard, Texas, data-center campus.
- Google would guarantee parts of Anthropic’s leases and receive an estimated 20% project stake.
- The campus includes an on-site natural-gas plant capable of generating 1.6 gigawatts.
- AI-focused mining stocks rallied Thursday, with IREN, Hut 8 and CleanSpark gaining more than 20%.
Google and Anthropic financing terms
A group of banks led by Morgan Stanley is discussing a financing package for Nexus Data Centers’ planned campus in Hubbard, Texas, according to a Wall Street Journal report cited by Reuters.
The proposed package includes a $14 billion bridge loan and a revolving credit facility. The report did not disclose the size of the revolving facility or identify the other lenders involved in the talks.
Google has reportedly agreed to guarantee billions of dollars in lease and power-payment obligations if Anthropic defaults. Its backing would apply to four data-center leases signed by the AI developer and related agreements to purchase electricity from an on-site power plant.
The guarantees remain limited to the minimum amount lenders require to complete the financing, according to the report. In exchange, Google is expected to receive an equity stake of around 20% in the combined data-center and power project.
Neither Nexus nor the banks have announced a completed transaction.
Texas campus includes a 1.6 GW power plant
Nexus plans to pair the data-center campus with a natural-gas-fired power plant capable of producing 1.6 GW of electricity. The on-site facility would allow the project to secure a large power supply without relying entirely on additional capacity from the Texas grid.
Access to electricity has become one of the main constraints on new US data centers. AI facilities require large and continuous power supplies, while new transmission lines, generation assets and grid connections can take years to approve and construct.
The Nexus structure resembles other AI projects using financially stronger technology companies to support the obligations of private AI developers. Google’s guarantee would improve the project’s credit profile and could help Nexus obtain financing on better terms than Anthropic could secure independently.
Anthropic plans to use tensor processing units co-designed by Google and Broadcom at the site. The chips would be financed separately under a vendor agreement between Anthropic and Broadcom, according to the Wall Street Journal.
Google’s participation would therefore cover several parts of the project: chips, credit guarantees and an expected equity position. The arrangement also gives Google a larger role in Anthropic’s infrastructure even as the AI developer buys processors from competing suppliers.
Bitcoin miners secure similar AI agreements
Nexus is competing for capital and AI tenants during a month marked by several multibillion-dollar agreements involving Bitcoin mining companies.
TeraWulf signed a 20-year lease with Anthropic on July 6 for its Justified Data campus in Hawesville, Kentucky. The contract covers about 401 MW of critical IT capacity and is expected to generate approximately $19 billion in revenue over its initial term.
CleanSpark followed with a $6.6 billion lease for its Sandersville campus in Georgia. The 20-year agreement covers 175 MW and could rise to $11.6 billion if the unidentified technology customer exercises its extension options.
Hut 8 signed a second 352 MW lease at its Beacon Point campus in Texas on July 20. The $9.8 billion contract brought the property’s total base-term lease value to $19.6 billion. Renewal options could increase the figure to $50.2 billion.
IREN announced $2.8 billion in multi-year AI cloud contracts on the same day. It raised its year-end annualized AI cloud revenue target above $4 billion, with about 85% of the target under contract.
Core Scientific then signed an agreement giving AMD access to up to 2.5 GW of data-center capacity. The initial phase will provide 500 MW of AI-ready infrastructure in 2027, although the companies did not disclose the contract’s value.
These companies accumulated power agreements and industrial sites for Bitcoin mining before AI demand raised the potential value of those assets. Their existing grid access can shorten development timelines, although AI facilities require more advanced cooling, networking and backup systems than mining operations.
AI-focused mining stocks rally
Shares of several miners with AI infrastructure exposure rose sharply on July 30, although the broader rally cannot be attributed solely to the Nexus report.
IREN closed approximately 30.7% higher at $38.26, while Hut 8 advanced 22.7% to $108.27. CleanSpark rose 21.1%, Core Scientific added 20.4% and TeraWulf gained 18.1%.
The moves extended an earlier market response to July’s AI contracts. Hut 8 had risen as much as 17% when it announced its second Beacon Point lease, while IREN climbed as much as 19% following its cloud-contract update.
Alphabet shares moved in the opposite direction Thursday, falling about 0.9% to $333.66. The decline came as investors continued assessing the cost of Google’s AI infrastructure expansion rather than signaling a clear response to the uncompleted Nexus financing.
What comes next for the Nexus project
The immediate catalyst will be whether Morgan Stanley and the other banks finalize the $15 billion package and disclose its maturity, interest costs and guarantee structure.
Confirmation of Google’s expected 20% stake would also clarify how much direct exposure the company is taking to Anthropic’s infrastructure obligations. Until financing closes, the loan, guarantees and equity arrangement remain proposed terms reported by people familiar with the discussions.
For US-listed miners, completion would provide another valuation benchmark for large power-backed AI campuses. It would also add a conventional data-center developer to the competition for the same tenants, lenders, chips and power supplies now driving miners’ expansion beyond Bitcoin.

Bitcoin price remained trapped near $64,600 on July 30 as renewed US-Iran fighting, a hawkish Federal Reserve, and another CLARITY Act delay prevented buyers from extending the recovery.
Summary
- Bitcoin price recovered from $62,383, but it remains inside a range capped near $66,500.
- The Fed held rates at 3.5%–3.75%, while three policymakers favored a rate increase.
- US-Iran fighting and a 6.6% oil surge revived inflation and risk-off concerns.
- Gold held near $4,062, but available data does not confirm a broad crypto-to-gold rotation.
Bitcoin price struggles to leave its consolidation range
According to data from crypto.news, Bitcoin (BTC) price traded near $64,600 at the time of writing after briefly falling to $62,383 following the Federal Open Market Committee meeting. The rebound returned BTC above $64,000, but the asset has yet to break the range that has controlled its price for several days.
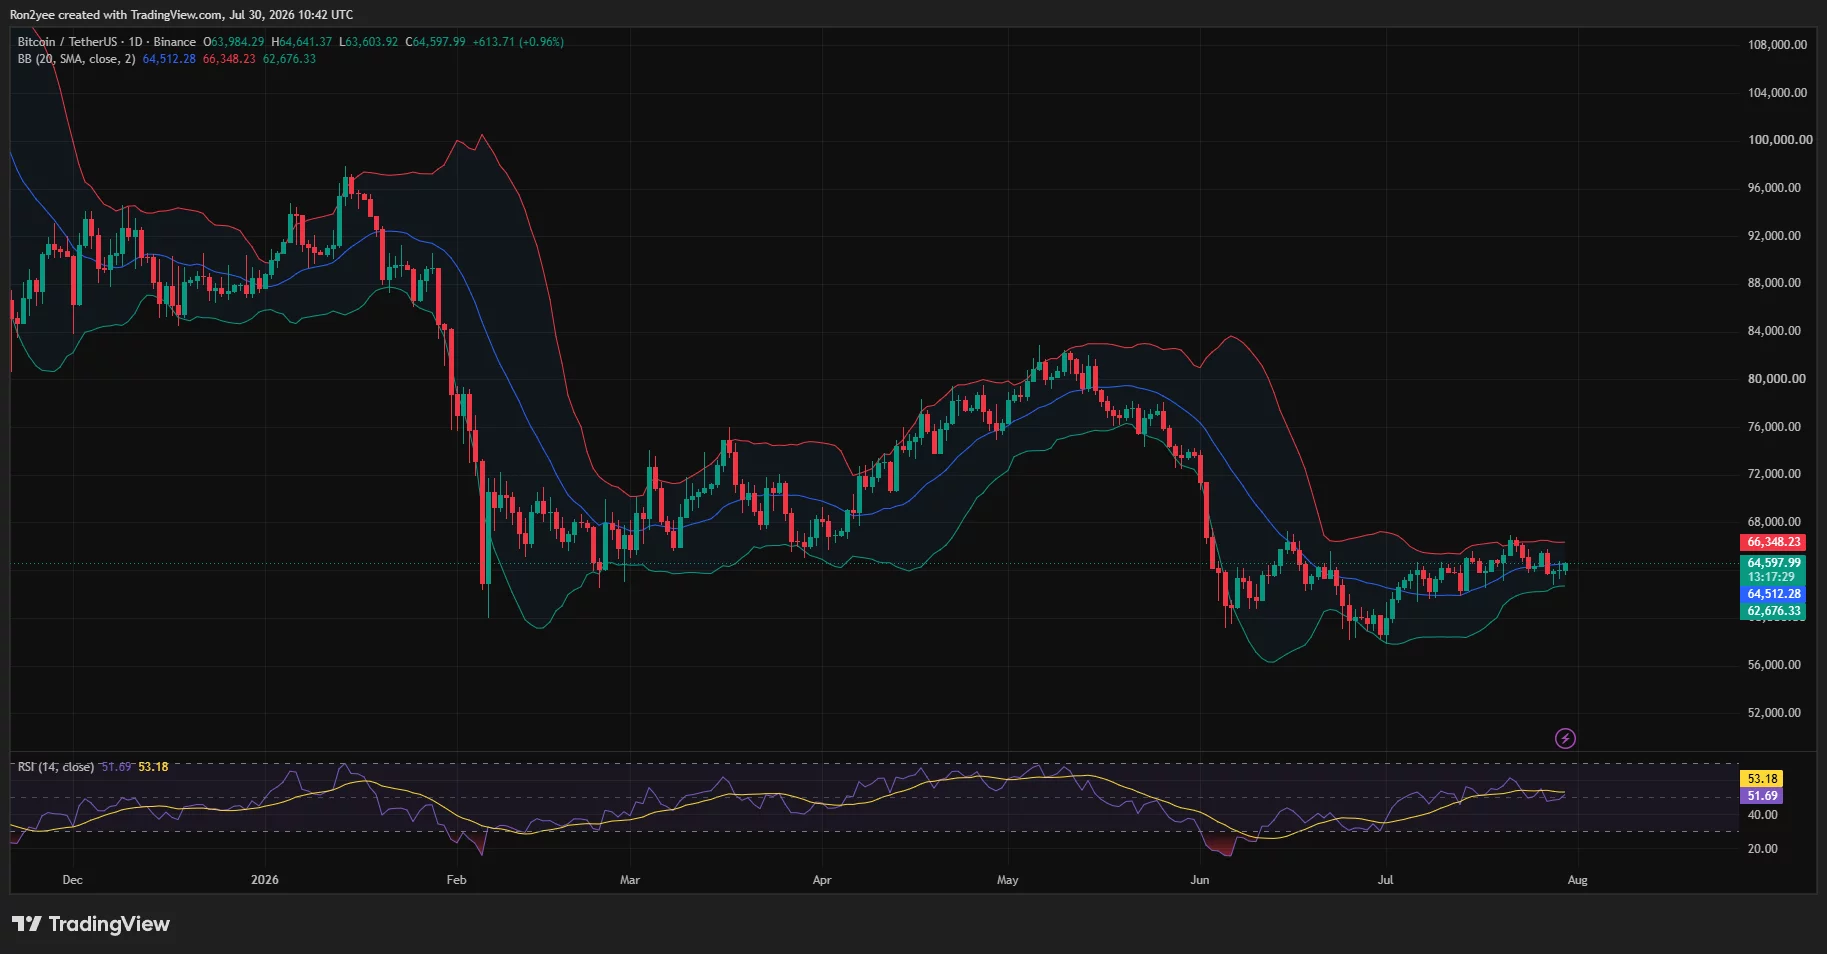
The daily chart shows Bitcoin trading almost directly above the Bollinger Band midpoint at $64,512. The upper band near $66,348 remains the immediate ceiling, while the lower band around $62,676 marks the first major support area.
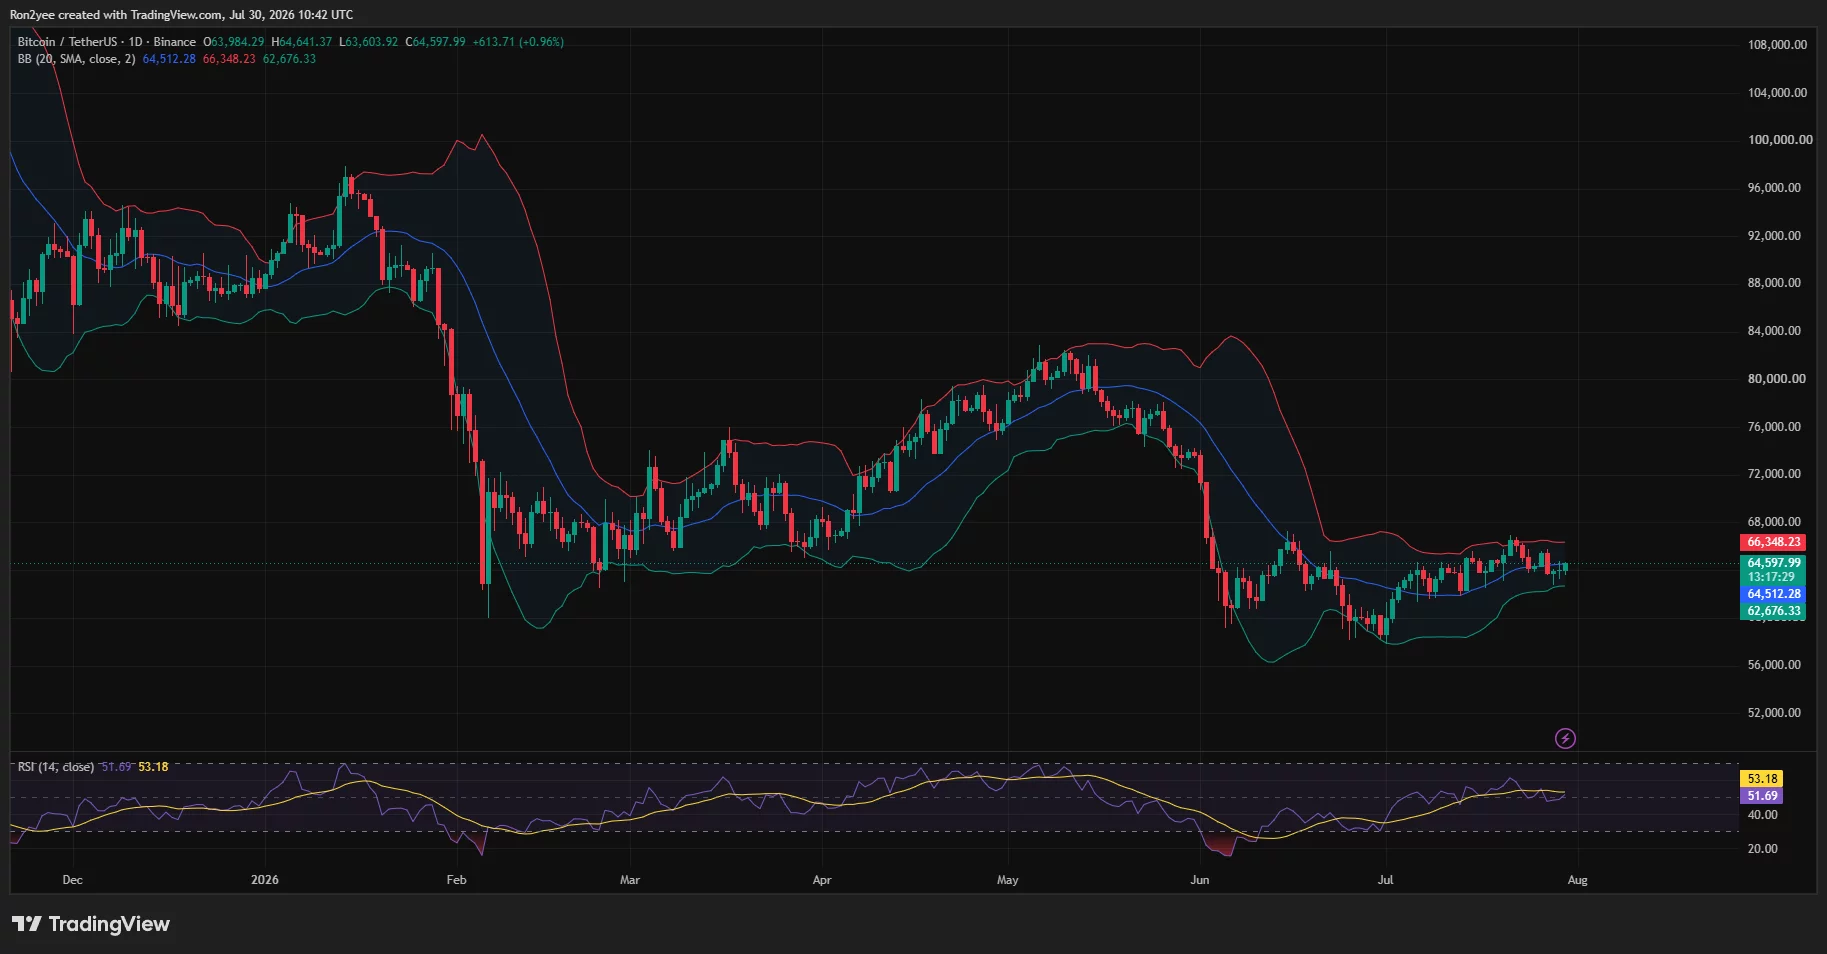
Momentum also remains neutral. The daily relative strength index stood at 51.69, slightly below its signal average of 53.18. That setup suggests buyers have stabilized the market but have not gained enough strength to confirm a breakout.
Bitcoin’s resistance to the wider risk-off move remains notable. US stocks fell sharply on Wednesday, with the Dow losing 2.2%, the S&P 500 dropping 1.5% and the Nasdaq sliding 1.7%. BTC, by comparison, recovered most of its post-FOMC decline instead of extending losses below $62,000.
However, the repeated inability to clear $65,000–$66,500 shows that defensive buying has been enough to prevent a breakdown, not enough to restart the broader rally.
War and Fed policy weigh on Bitcoin momentum
Renewed fighting between the United States and Iran has added another source of pressure. US forces launched a fresh wave of strikes against Islamic Revolutionary Guard Corps targets after Iran fired missiles toward a US base in Jordan.
Jordanian air defenses intercepted five Iranian missiles on Thursday, while concerns grew that the conflict could threaten Persian Gulf energy supplies and shipping through the Red Sea.
Crude oil held above $84 after surging 6.6% in the previous session. Higher energy prices can raise inflation expectations, keep Treasury yields elevated and reduce the appeal of speculative assets, including cryptocurrencies.
That problem was reinforced by the Fed’s July meeting. Policymakers maintained the federal funds rate at 3.5%–3.75%, as expected, but Chair Kevin Warsh rejected the idea of a flexible inflation objective.
Warsh said there was no “soft target” for inflation and reaffirmed that the central bank remained committed to 2%. Three FOMC members voted for a quarter-point rate increase, leaving another hike possible if oil-driven inflation persists. The Federal Reserve’s statement confirmed the 9–3 decision.
For Bitcoin, steady rates provided little relief because the accompanying message reduced expectations of easier financial conditions. Higher-for-longer borrowing costs could continue limiting demand for risk assets ahead of the next inflation readings.
CLARITY Act delay removes another potential catalyst
The US Senate’s decision to postpone action on the Digital Asset Market Clarity Act has added regulatory uncertainty to the macro pressure.
Lawmakers shifted their attention toward a Russia sanctions package and federal nominations, narrowing the time available to advance the crypto market structure bill before the Aug. 8 recess. The delay does not create an immediate operational change for Bitcoin, but it removes a potential catalyst that could have improved institutional confidence.
The legislation is intended to divide oversight responsibilities between the Securities and Exchange Commission and Commodity Futures Trading Commission. Its passage could give US exchanges, token issuers and investors clearer federal rules.
Senate Republicans released updated text on July 22, combining Banking and Agriculture Committee proposals into a single framework. However, unresolved ethics language and the need for Democratic support remain obstacles.
The delay alone did not cause Bitcoin’s decline, but it left the market without a policy-driven reason to challenge resistance while geopolitical and monetary risks increased.
Is capital rotating from crypto into gold?
Cross-asset performance shows defensive positioning, but there is not enough evidence to conclude that investors are directly moving capital from cryptocurrencies into gold.
Spot gold held near $4,062 an ounce on Thursday, while US gold futures gained 0.7%. Gold had also risen about 2% following the Fed announcement. However, investment demand remained subdued, and silver traded slightly lower.
That mixed performance weakens the argument for a broad flight into precious metals. Gold has retained safe-haven demand, but rising Treasury yields and expectations of another rate increase are limiting its upside because bullion does not pay interest.
The clearer defensive move has been into oil-linked exposure and away from equities sensitive to interest rates and economic growth. Bitcoin’s recovery toward $64,600 also suggests capital has not abandoned the asset entirely.
US spot Bitcoin ETFs recorded approximately $32.1 million in net inflows on July 29, with BlackRock’s IBIT attracting $89.8 million, according to Farside Investors. That inflow is modest, but it shows institutional demand continued during the sell-off rather than moving entirely toward traditional havens.
Crypto sentiment nevertheless remains weak. The Fear and Greed Index stood at 28, down from 29 and still inside the “fear” category.
Bitcoin downside targets remain near $63K and $60K
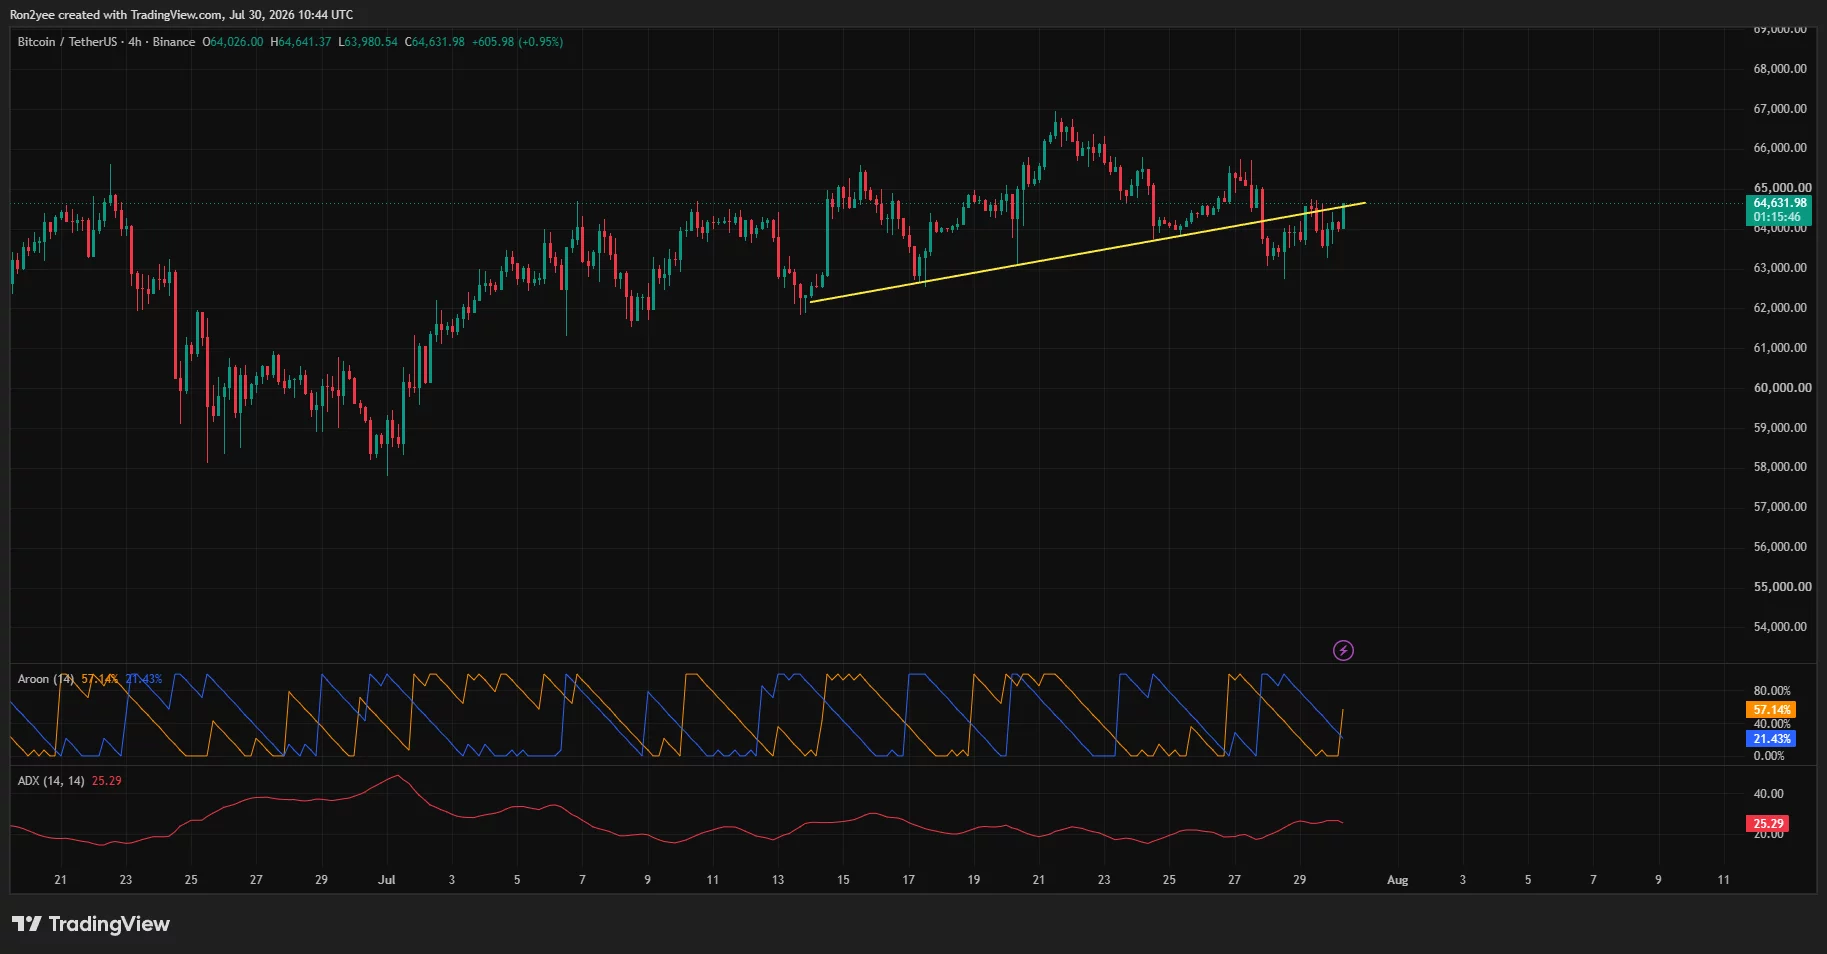
The 4-hour chart places Bitcoin against a rising trendline near $64,600. A confirmed move above this area could open a retest of $65,000, followed by the upper daily Bollinger Band between $66,300 and $66,500.
The 24-hour liquidation heatmap shows concentrated leverage around $64,900–$65,200. A move into that zone could trigger short liquidations and briefly accelerate the recovery. Further liquidity sits near $66,000 and $67,000.
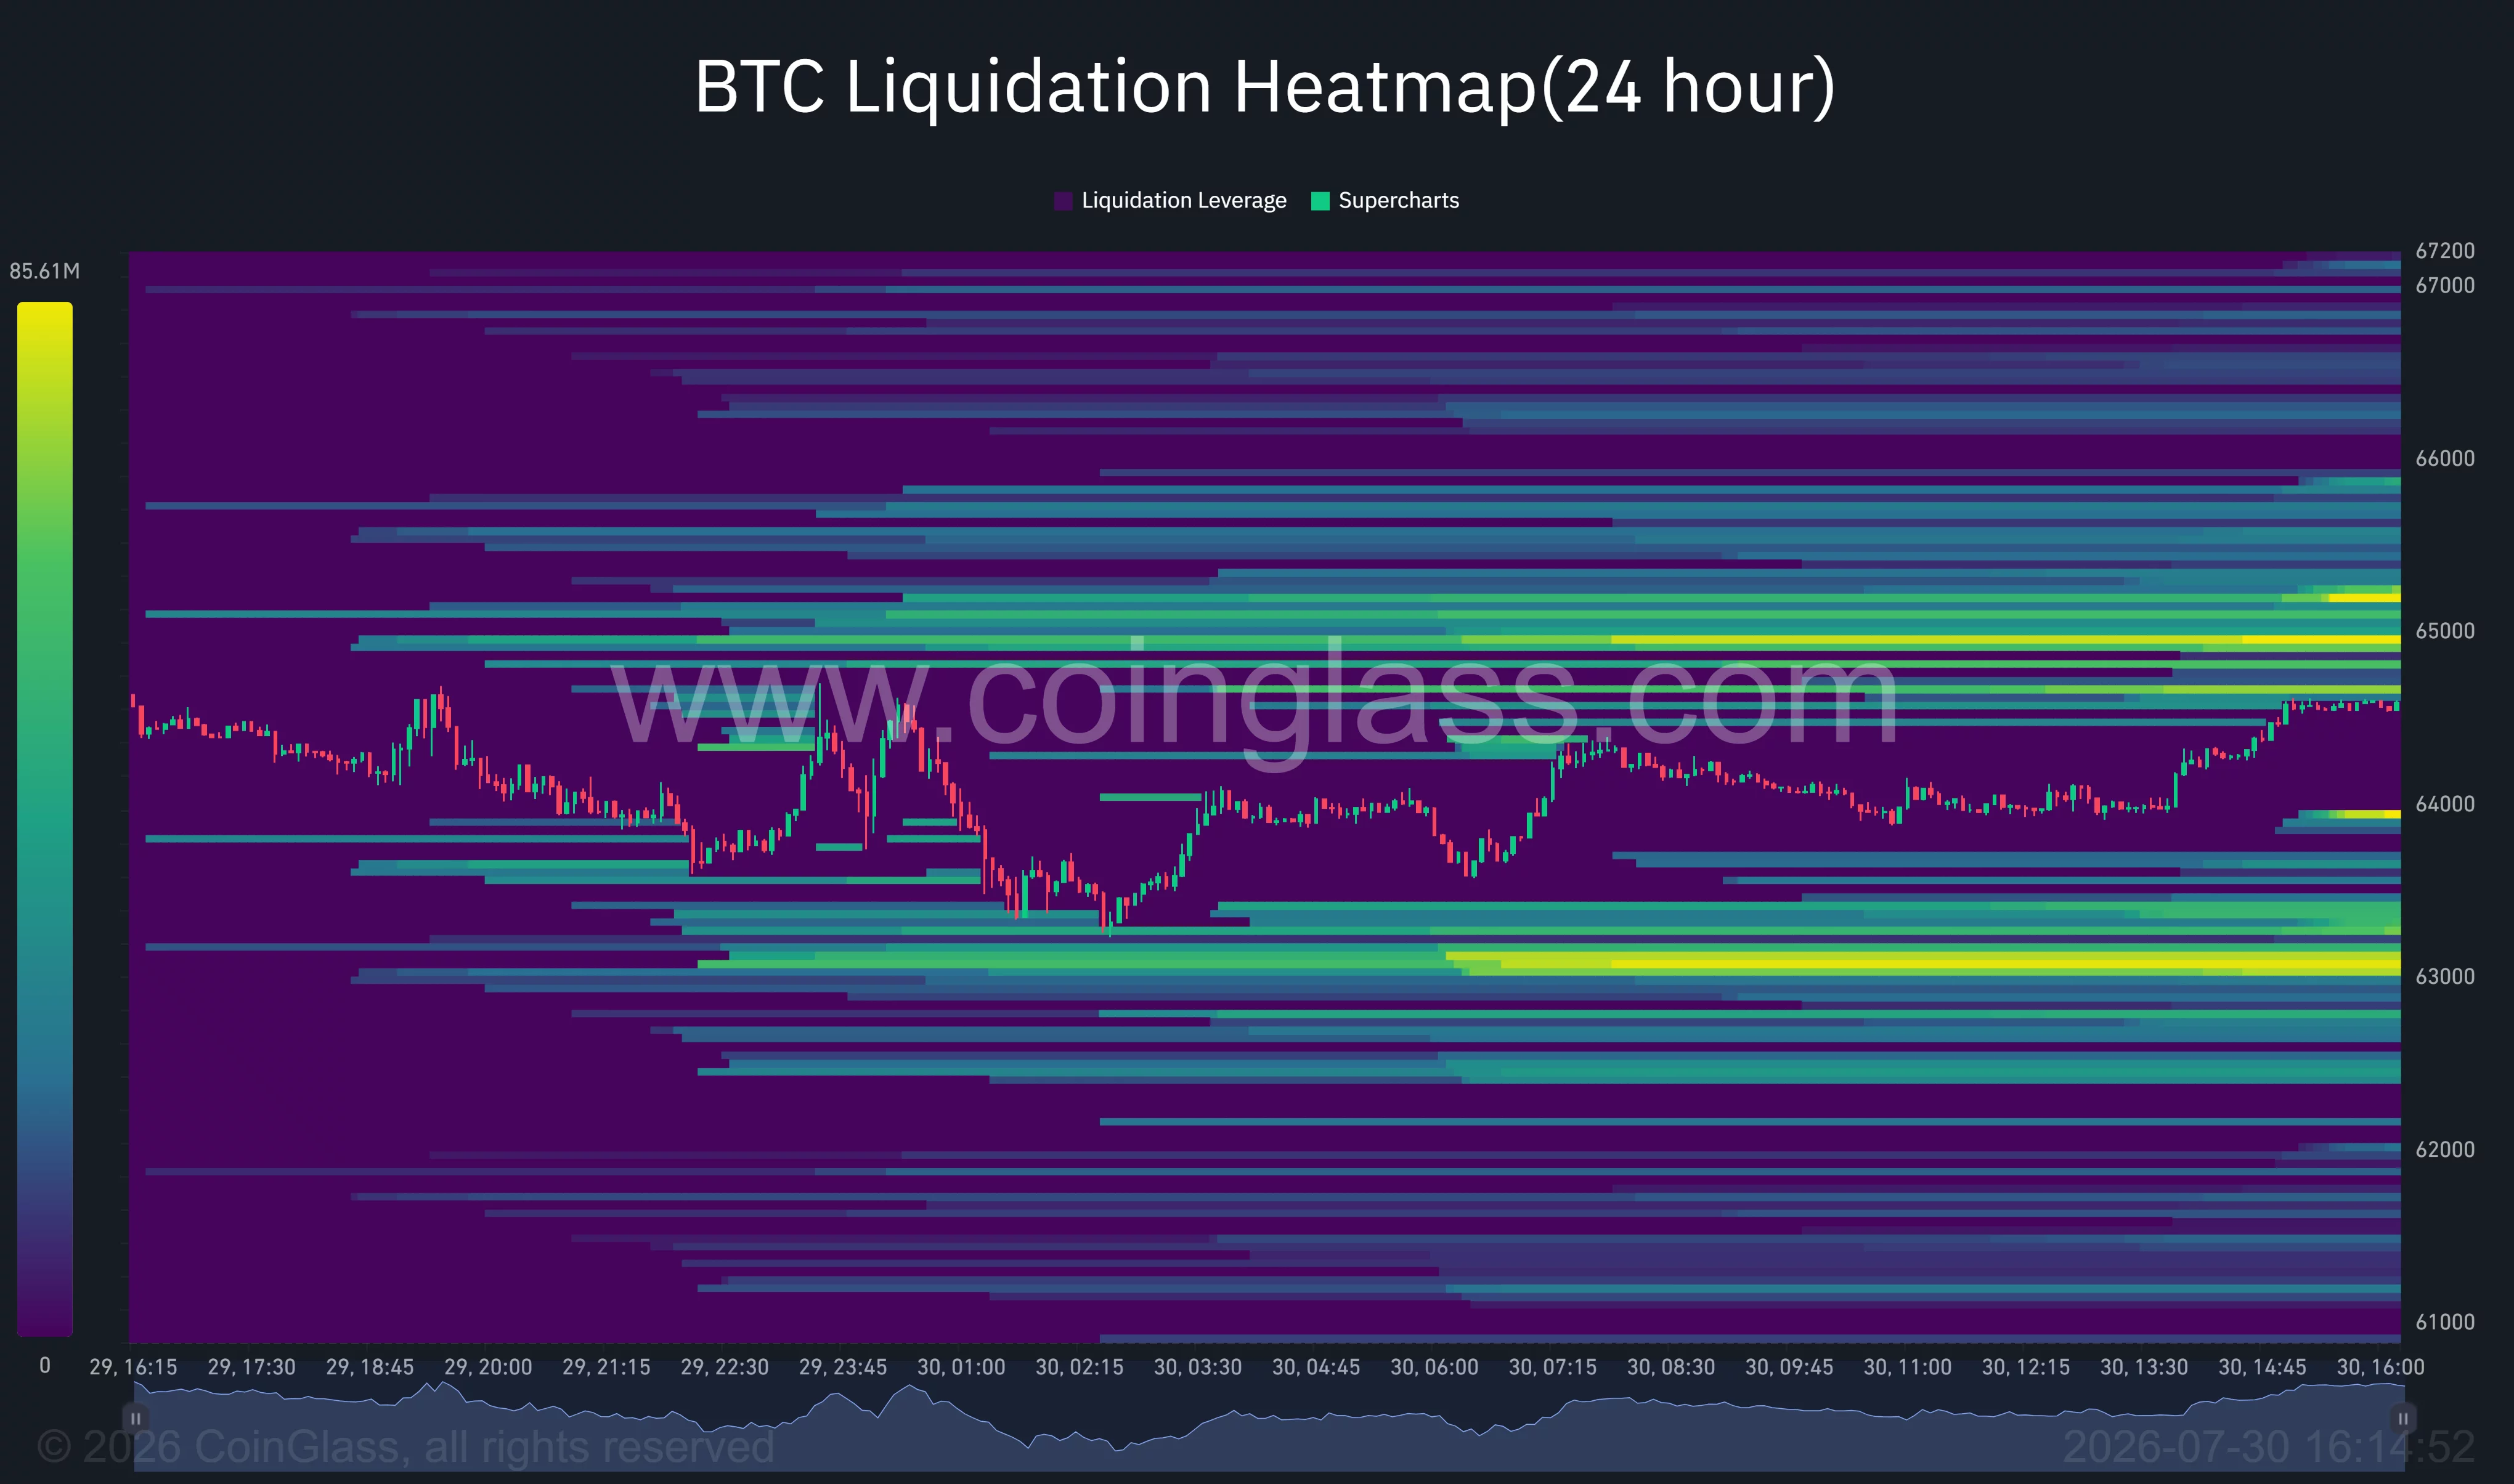
On the downside, another large concentration appears around $63,000–$63,300. Losing the 4-hour trendline could attract price toward that liquidity before opening the way to $62,000 and the psychological $60,000 level.
Crypto trader Lennaert Snyder said Bitcoin was attempting to hold $64,000 following the FOMC meeting but remained vulnerable after generating substantial liquidity below Tuesday’s $62,800 low. He identified $64,800 and $65,800 as possible areas for renewed short positions.
Ali Charts offered a longer-term bullish interpretation, arguing that a decline toward $60,000 could complete an inverse head-and-shoulders pattern. Under that scenario, a confirmed break above $66,500 would place $74,000 in play.
For now, the Aroon Up reading of 57.14 remains above Aroon Down at 21.43, while the 4-hour ADX of 25.29 points to a developing but only moderate trend. Bitcoin must hold above $64,000 and clear $66,500 to turn its resilience into a confirmed breakout. Failure to do so would leave the market exposed to another liquidity sweep as war risks, inflation concerns, and regulatory delays continue to weigh on sentiment.
Disclosure: This article does not represent investment advice. The content and materials featured on this page are for educational purposes only.
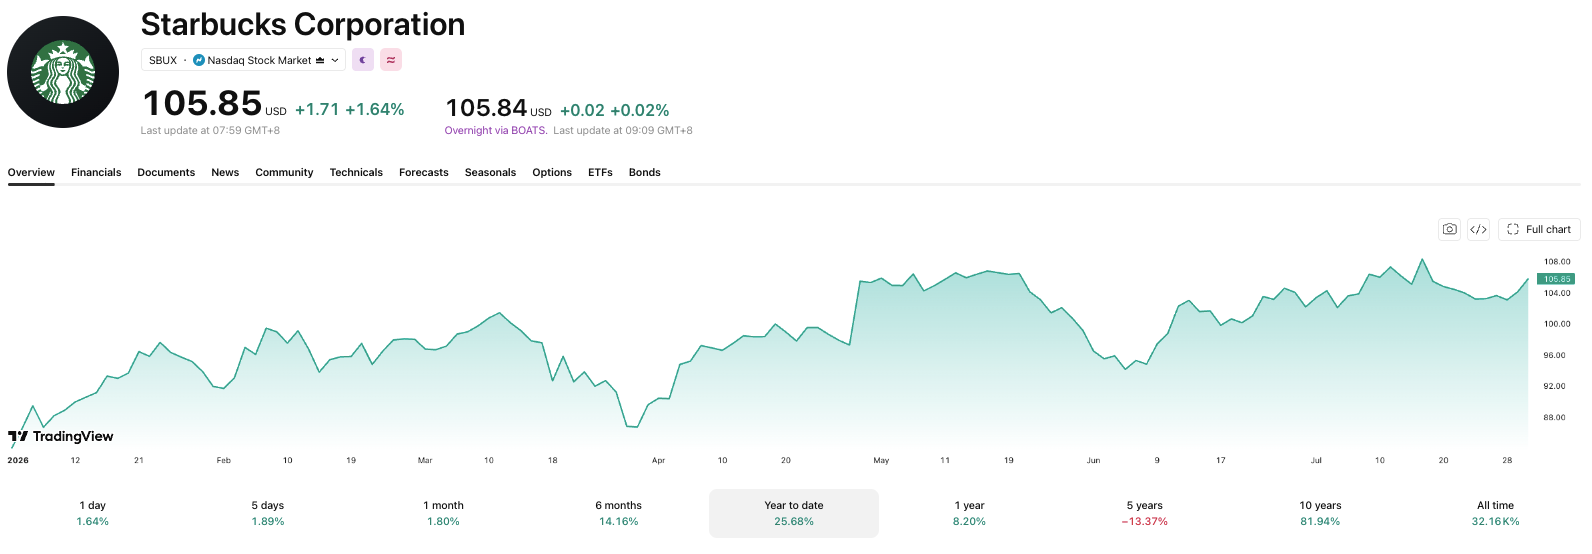
Starbucks stock is climbing back toward triple digits, and Jim Cramer says it won’t stop there. The coffee chain beat Wall Street on nearly every line this week.
In a week of major earnings calls, Starbucks has not only performed, but also shown delivery on a promise of a turnaround in the coffee chain’s fortunes, promised by CEO Brian Niccol.
Starbucks Beats Across the Board
Starbucks earned an adjusted $0.85 per share in its fiscal third quarter. That’s up 70% year over year and well ahead of estimates. Revenue held at $9.3 billion. Global comparable-store sales grew 7.9%, the fourth straight quarter of gains.
Operating margin expanded 430 basis points to 14.4%. North America’s margin grew for the first time since early fiscal 2024. That held even after stripping out the tariff refunds that boosted the headline numbers.
Shares jumped more than 3% Thursday to roughly $107. That puts Starbucks up about 26% year to date. The stock now sits near the 52-week closing high of $108.37, set on July 16. It has not closed above $110 since January 2025.

Cramer Bets Bigger on the Turnaround
Cramer interviewed CEO Brian Niccol on CNBC Thursday and called the quarter the inflection point for the turnaround. He raised his Investing Club price target to $120 from $115 and said the results should help Starbucks
Niccol is leaning harder into store remodels, and Starbucks now targets 1,500 upgraded locations by fiscal year-end. He’s also simplifying the company’s footprint abroad. Roughly 90% of its nearly 23,000 international stores now run under licensing deals. That follows a China joint venture Starbucks finalized in April. The company plans to keep direct control only over the U.S. and Canada.
The upgrade follows a costly stretch of layoffs that investors cheered as Niccol cut costs. It also stands out against Cramer’s more cautious calls on other momentum stocks this week.
Whether Starbucks actually heads towards $120 may hinge on North America’s margin gains holding once the tariff refunds fade.
The post Starbucks Stock to $120? Cramer Says Turnaround Is Accelerating appeared first on BeInCrypto.


SALT announced on July 30 that Ripple CEO Brad Garlinghouse will speak at the third annual Wyoming Blockchain Symposium, scheduled for Aug. 17–20 at the Four Seasons Resort and Residences Jackson Hole.
Summary
- Ripple CEO Brad Garlinghouse will speak at Wyoming’s invitation-only symposium from August 17 through 20.
- Five hundred investors, builders and policymakers are expected at the third annual Jackson Hole gathering.
- Ripple also sponsors the event, while organizers continue adding speakers and sessions before opening day.
The official speaker announcement confirmed his addition to the lineup but did not identify a session title, speaking time or discussion partner.
The invitation-only event is expected to bring together 500 investors, builders and policymakers. SALT and Kraken are hosting the gathering with support from the University of Wyoming Center for Blockchain and Digital Innovation and the Blockchain Association.
Meanwhile, the symposium begins with a welcome reception on Aug. 17. Organizers have scheduled two days of content and meetings for Aug. 18 and 19, followed by optional excursions on Aug. 20. Registration requests remain subject to approval by SALT and Kraken.
The current speaker roster includes SEC Chair Paul Atkins, Wyoming Sen. Cynthia Lummis, House Majority Whip Tom Emmer, Sen. Ruben Gallego and Comptroller of the Currency Jonathan Gould. Industry participants include Galaxy founder Michael Novogratz, Cardano founder Charles Hoskinson, Stellar Development Foundation CEO Denelle Dixon and Custodia Bank founder Caitlin Long.
U.S. crypto policy is likely to dominate discussion
SALT lists changes to U.S. and global crypto regulation among the event’s main themes. Other planned topics include Bitcoin’s role as a store of value, digital asset investment strategies, decentralized artificial intelligence and the future structure of financial markets.
Garlinghouse has recently pressed Congress to pass the CLARITY Act, which would create a federal market structure for digital assets. As crypto.news reported, he argued on July 22 that lawmakers should move forward rather than abandon the bill while seeking a perfect compromise. However, SALT has not confirmed that his Wyoming appearance will focus on the legislation.
Ripple continues to take part in U.S. policy debates through Garlinghouse and Chief Legal Officer Stuart Alderoty. The company’s regulatory interests include XRP’s legal treatment, stablecoin rules and institutional access to blockchain-based payments. Any remarks at the symposium would represent Ripple’s position and would not create new law or regulatory guidance.
Ripple’s Wyoming ties extend beyond sponsorship
SALT lists Ripple as a sponsor of the 2026 symposium. The company also has an existing relationship with the University of Wyoming, one of the event’s academic partners.
In 2022, Ripple funding helped establish the Ripple Blockchain Collaboratory at the university. The program supports blockchain, cryptocurrency and cybersecurity research across the university’s business, engineering and law programs. The university also operates an XRP Ledger validator.
Ripple said in October 2025 that the University of Wyoming was among the academic partners receiving renewed University Blockchain Research Initiative grants. The company reported distributing more than $1.5 million in renewed grants across several universities using its RLUSD stablecoin. That total covered the wider group of institutions and was not disclosed as the University of Wyoming’s individual award.
Wyoming has also developed its own digital asset policy infrastructure. In related coverage, the state launched FRNT, a state-issued dollar stablecoin, on Solana in January 2026. The symposium’s location therefore places Ripple executives alongside state officials and federal policymakers in a jurisdiction already testing blockchain-based financial products.
What happens before the Aug. 17 opening
SALT says the agenda and speaker list will continue to expand on a rolling basis. The next verified update should clarify Garlinghouse’s session topic, scheduled time and whether he will appear alone or in a panel discussion.
The organizer says conference panels will generally be on the record unless stated otherwise. Evening events and excursions will remain off the record, while media attendance is limited and subject to approval.
No verified XRP price movement or Ripple business development can be directly attributed to the speaker announcement. The event notice did not include a product launch, partnership, financial disclosure or regulatory decision.
For now, the confirmed development is Garlinghouse’s addition to the August lineup. Further details will depend on SALT’s final agenda and any separate announcement from Ripple before the event.
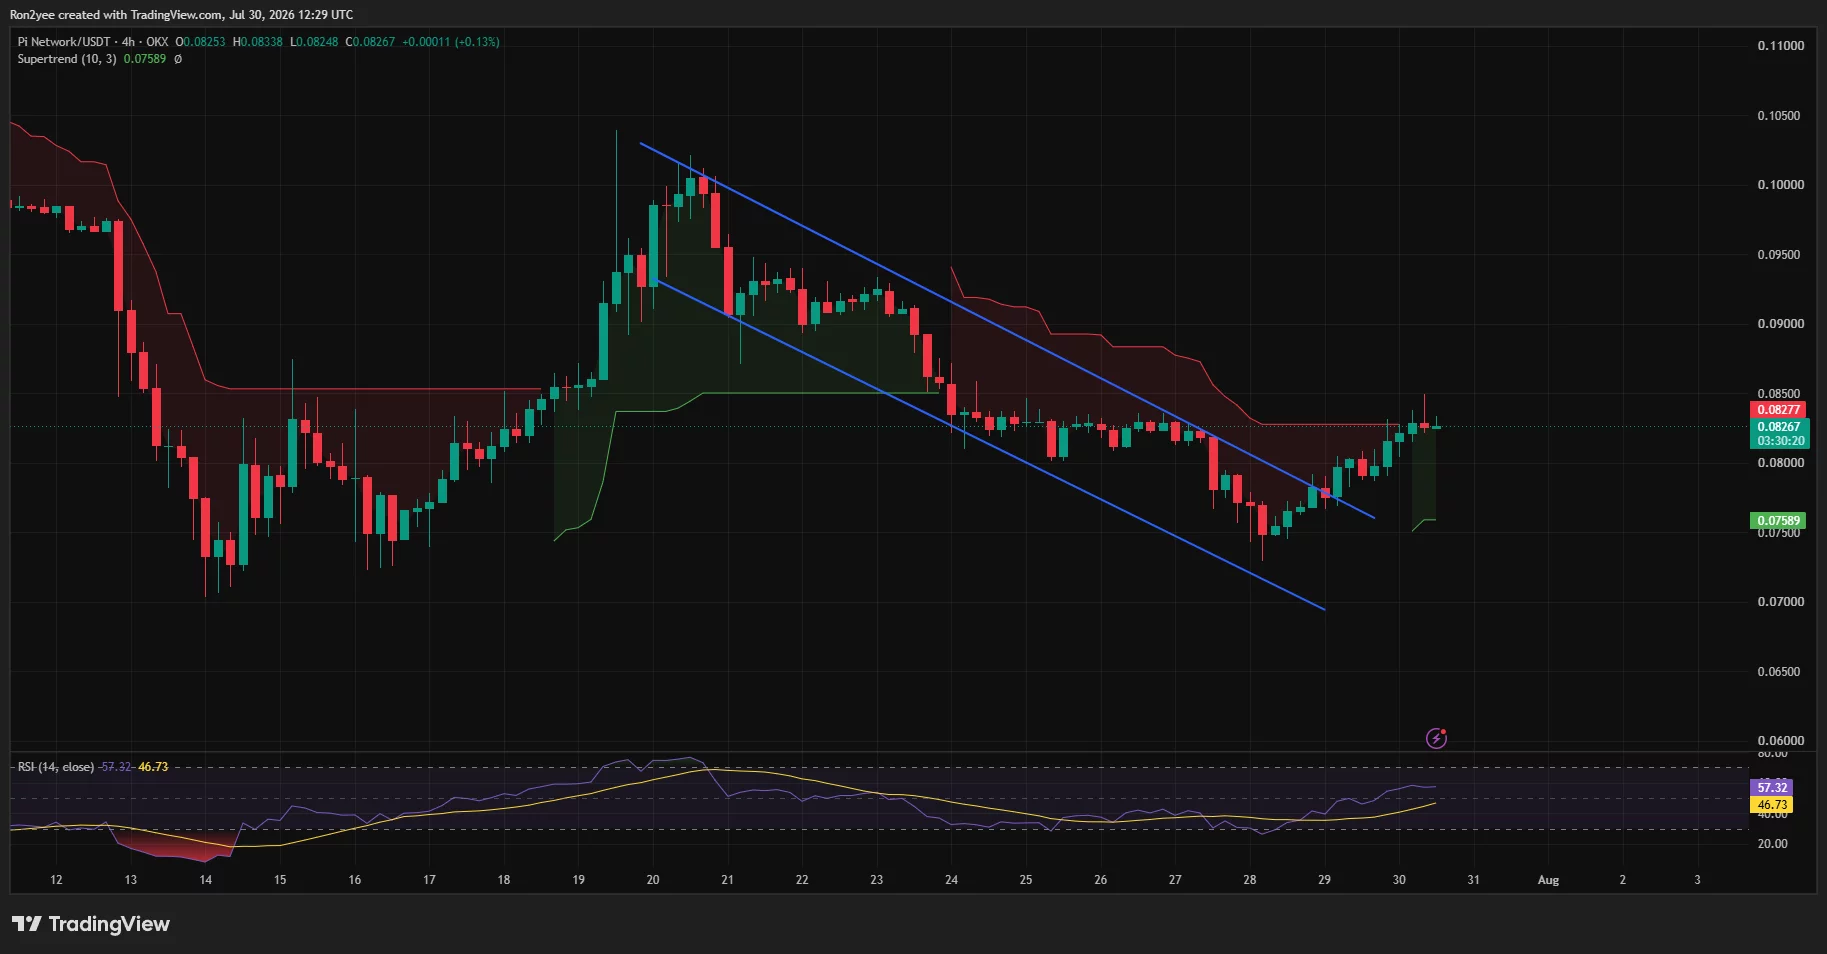
Pi Network price rallied to an intraday high near $0.085 on July 30 as an approaching node-upgrade deadline revived demand, but short-term charts show buyers are already meeting resistance.
Summary
- PI Network price climbed roughly 7% to $0.085 after rebounding from the $0.074 support area.
- Mainnet node operators must complete the Protocol 26 upgrade by Aug. 11.
- 4-hour RSI recovered to 57.32, confirming improving momentum after the recent sell-off.
- PI remains exposed to a double-top reversal unless buyers establish support above $0.085.
Pi Network price rebounds from record lows
According to data from crypto.news, Pi Network (PI) price rose as high as $0.08496 on July 30 before easing toward $0.0826 at the time of writing. The move extended its recovery from the $0.074–$0.075 demand zone, where buyers stepped in following a multi-day decline.
PI remains down by about 9% over the past seven days despite the rebound. CoinGecko data placed its market capitalization near $907 million, with approximately $11 million in 24-hour trading volume.
The latest advance followed an extreme loss of momentum earlier in the week. PI’s daily relative strength index had fallen to around 27, signaling its most oversold condition since trading began.
Buyers subsequently produced a roughly 10% rebound from the local low. However, the daily chart shows PI still trading near the bottom of a much larger decline from its April high around $0.20.
The token is approximately 97% below its February 2025 all-time high of $2.99. That wider performance keeps the current move within relief-rally territory rather than confirming a long-term reversal.
Protocol 26 deadline drives renewed demand
The immediate catalyst was the Pi Core Team’s announcement that Mainnet node operators must migrate to Protocol 26 by Aug. 11. Nodes that miss the deadline risk losing their connection to Mainnet.
Pi Network’s official node page confirms that every Mainnet node must upgrade to version 26. The team described the release as the ninth upgrade completed during the current migration sequence, with Protocol 27 expected to finish the planned series.
“With 8 successful upgrades completed over the past few months, these final two upgrades will bring the network up to date with the latest protocol features, improvements, and functionality.”
Protocol 26 may improve confidence that Pi Network is advancing its technical roadmap. The project has connected the broader upgrade sequence with its plans for greater decentralization, open-source node infrastructure, and expanded network functions.
Still, the announcement does not remove the project’s supply problem. Around 128 million PI tokens are reportedly scheduled to unlock during August, worth more than $10 million at the current price. New supply could limit the rally if spot demand remains weak.
PI breakout faces resistance near $0.085
The 4-hour chart shows PI breaking above the upper boundary of a descending parallel channel that had controlled price action since July 20. The move represents an early bullish change in short-term market structure.
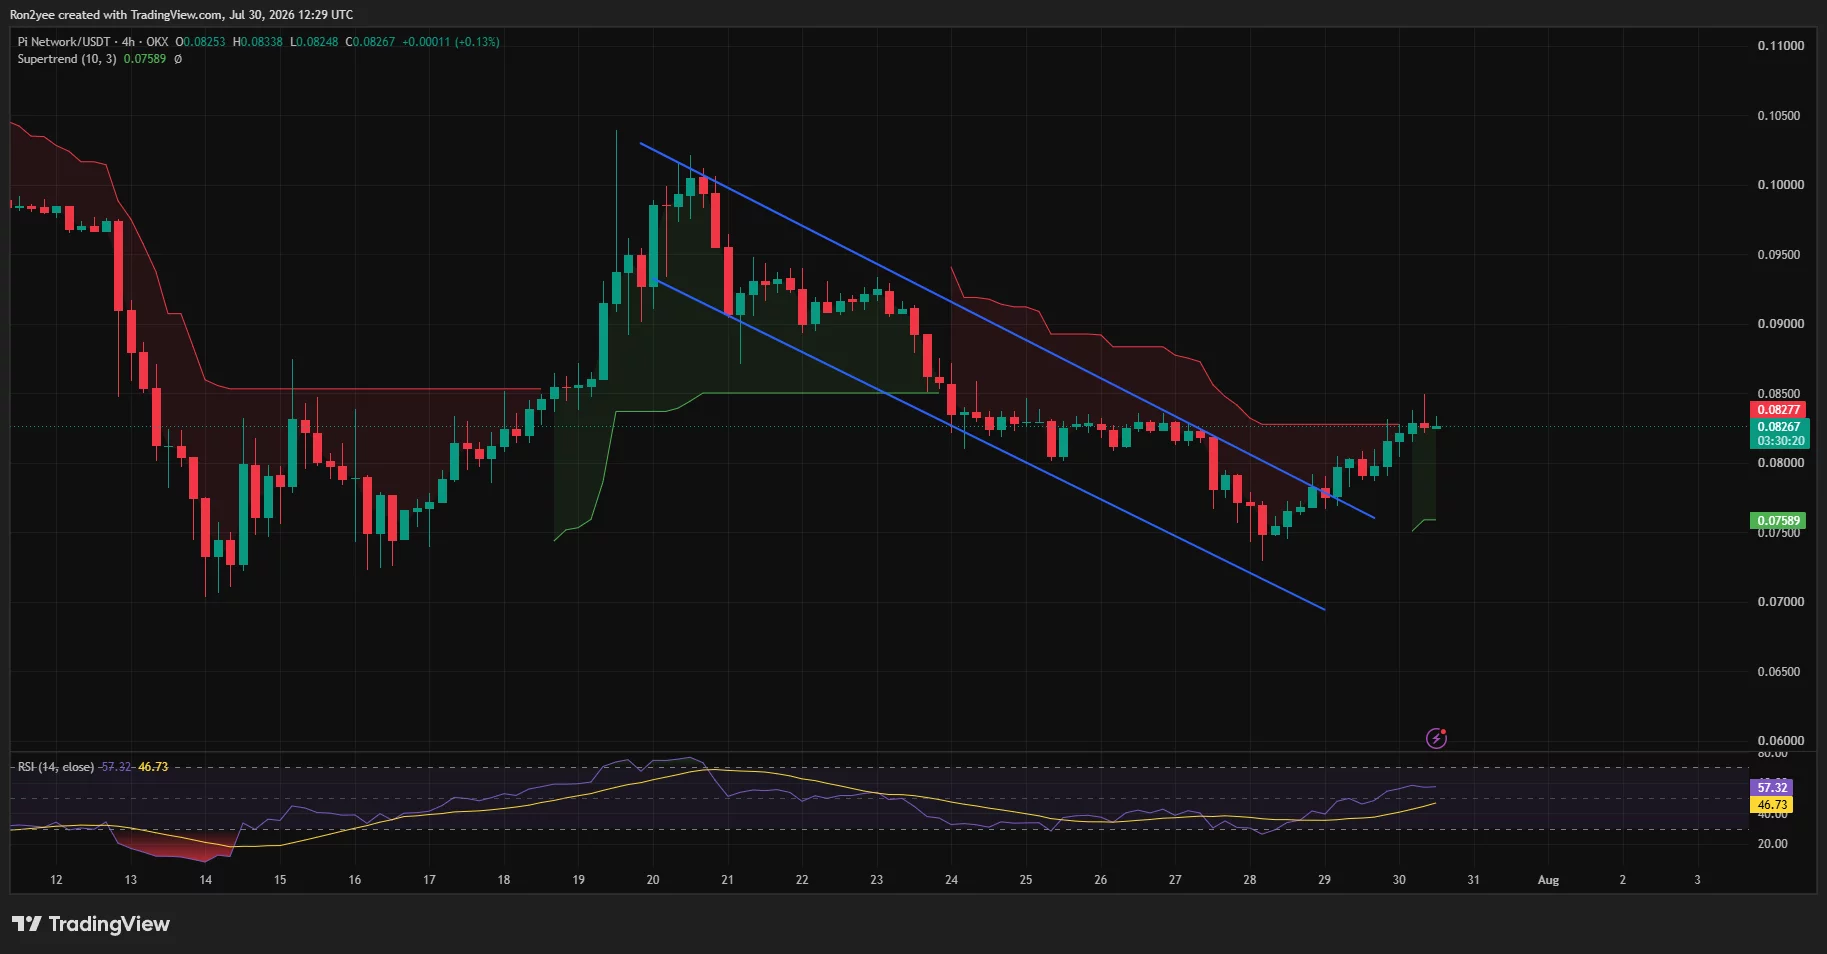
Momentum has also improved. The 4-hour RSI rose to 57.32, above its moving average of 46.73 and the neutral 50 level. That reading suggests buyers have regained control without pushing PI into overbought territory.
PI has now reached its 4-hour Supertrend resistance at approximately $0.0828. A sustained close above that indicator and the recent $0.085 high would strengthen the breakout and expose $0.090 as the next psychological level.
Above it, the daily Fibonacci chart places the next major resistance at $0.09796. That level represents the 78.6% retracement of the decline from roughly $0.20 to $0.0702 and sits close to the important $0.10 threshold.
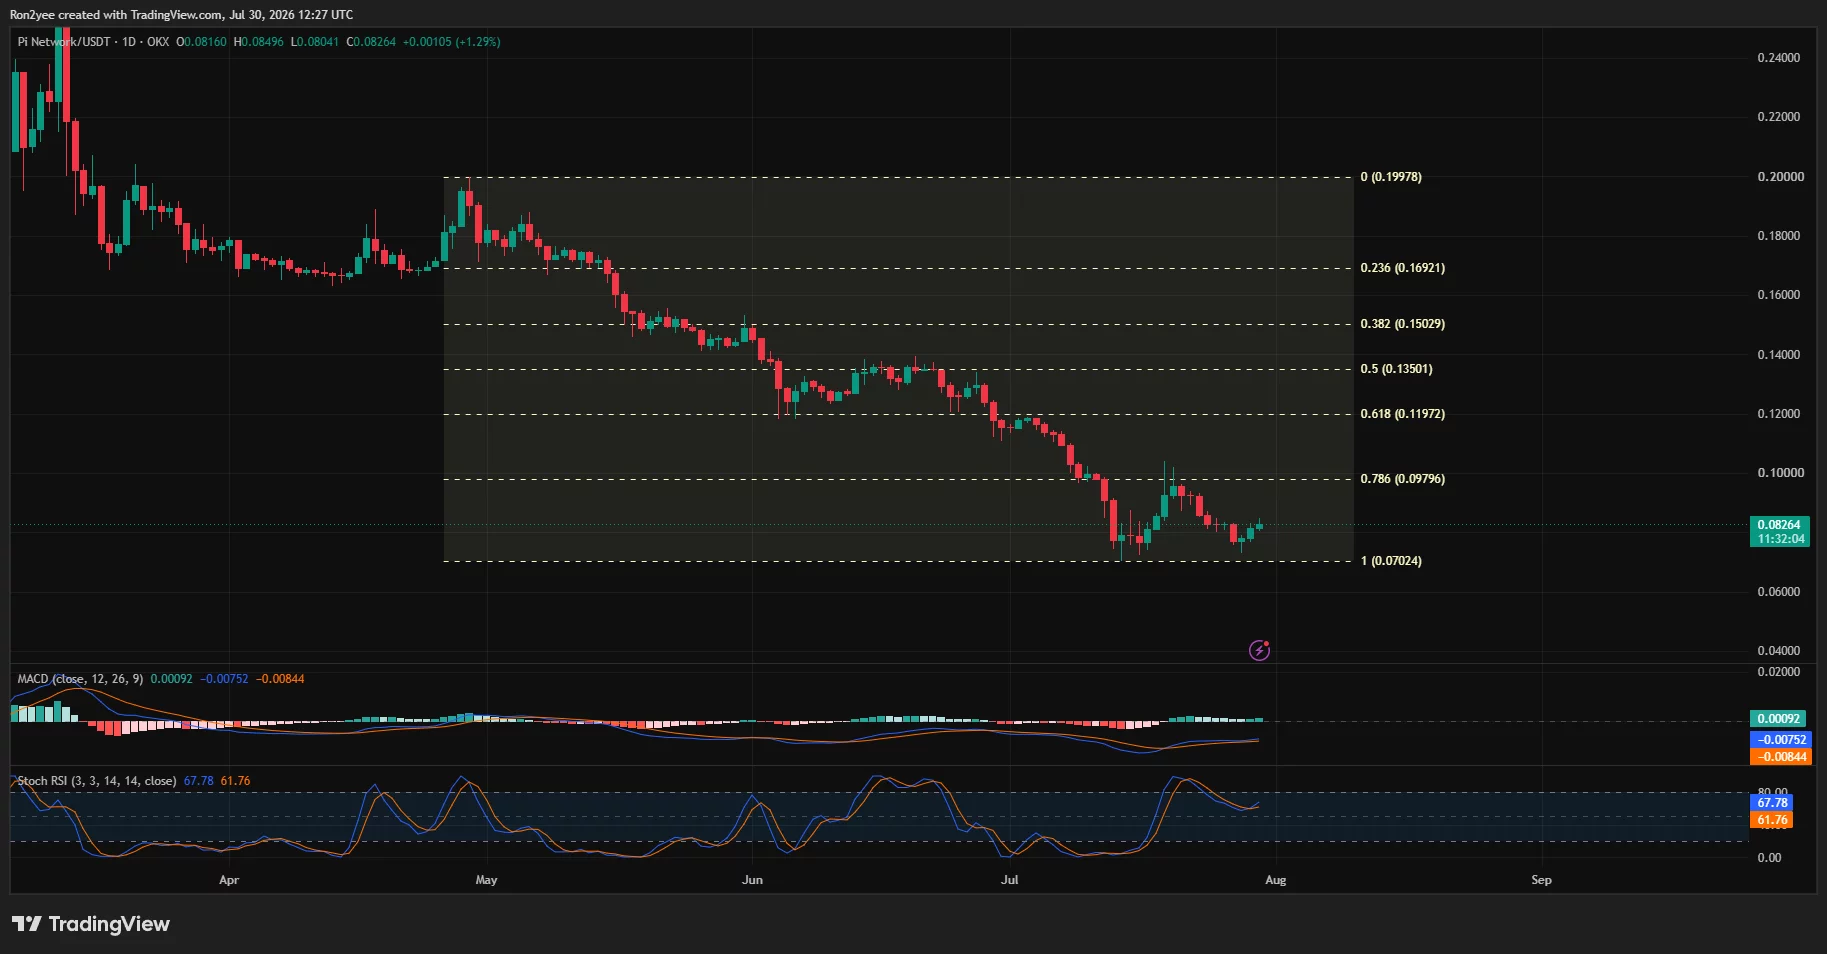
Daily indicators show early signs of stabilization but not a completed reversal. The moving average convergence divergence histogram has turned marginally positive, while both MACD lines remain below zero. Stochastic RSI readings of 67.78 and 61.76 show strengthening momentum without reaching the overbought zone.
Losing $0.080 would weaken the breakout and bring the 4-hour Supertrend support near $0.0759 back into view. A deeper decline below $0.074 could expose the all-time-low region around $0.0702.
Analyst warns of double-top reversal
Crypto analyst Gopal identified a possible double-top pattern on PI’s one-minute chart after the token made two unsuccessful attempts to clear the same intraday resistance area.
“After two failed attempts to break resistance, buyers are losing momentum while sellers continue defending the ceiling,” the analyst noted.
The pattern’s neckline sits near the immediate $0.082 support region. A confirmed break below it could send PI toward the analyst’s downside target around $0.0814, although the setup would carry less weight than signals on the 4-hour or daily charts.
Reclaiming the two intraday peaks above approximately $0.083 with stronger volume would invalidate that short-term bearish pattern. Buyers would then have another opportunity to challenge $0.085.
For US traders, PI’s advance remains largely tied to project-specific developments rather than the institutional flows that support Bitcoin and Ethereum. Risk appetite also remains constrained after the Federal Reserve held interest rates steady, making sustained demand and the Aug. 11 upgrade execution important tests for the rally.
Protocol 26 has supplied a clear reason for PI’s recovery, but price must close above $0.085 and then reclaim $0.098–$0.10 before the broader chart begins to support a durable reversal.
Disclosure: This article does not represent investment advice. The content and materials featured on this page are for educational purposes only.


A decade of tokenized equity pitches promised global access to American stocks. The use case that finally moved volume is pairing them against memecoins on a brokerage’s own chain, and it just pushed Robinhood Chain past Solana in tokenized stock trading. Nobody planned this.
Summary
- Since mid-July, launch platforms Bankr and long.xyz have let users issue memecoins backed by tokenized stock liquidity across more than 90 tickers on Robinhood Chain.
- DEX Screener now shows memecoins trading against tokenized NVDA, TSLA, INTC, RBLX, and SPCX among the chain’s top 100 pools.
- That mechanism has pushed Robinhood Chain past Solana in tokenized stock volume, against Ondo’s multichain stock tokens averaging roughly $24.9 million.
- Tokenized stocks remain a sliver of the chain itself, which cleared roughly $444 million in daily decentralized exchange volume against $332.7 million in total value locked, with most of it in memecoins.
- Pons has announced V2 support for tokenized quote assets including NVDA, AAPL, and HOOD, but its contracts were still in audit with two partners as of late July and every feature remains subject to change until deployment.
Tokenized equities have been pitched for roughly a decade on a consistent premise: that a share of Apple represented as a blockchain token would unlock global access, continuous trading, and programmable finance for the largest asset class on earth. The pitch produced a long series of products, several regulatory settlements, a handful of scrapped launches, and until recently very little volume. Then in mid-July, without any announcement resembling the pitch, tokenized American stocks found a use that actually moved size. Launch platforms on Robinhood Chain began letting anyone issue a memecoin whose liquidity pair is a tokenized equity, across more than ninety tickers, and traders took it up immediately. The chain’s top hundred pools now include memecoins quoted against tokenized Nvidia, Tesla, Intel, Roblox, and SpaceX. The volume that arrangement generates has been sufficient to push Robinhood Chain ahead of Solana in tokenized stock trading. So the first genuine product-market fit for tokenized equities is not investment, settlement, or collateralised lending. It is serving as the denominator in speculative token pairs, and understanding why that happened tells you more about tokenization’s near future than any of the pitches did.
What is actually live
Precision matters here because a well-publicised announcement has been widely confused with the working product.
Bankr and long.xyz, both operating on Robinhood Chain, began in mid-July allowing users to issue memecoins backed by tokenized stock liquidity, with coverage extending across more than ninety tickers.
These are live, trading, and visible on public analytics. DEX Screener data places memecoins paired against tokenized NVDA, TSLA, INTC, RBLX, and SPCX within the chain’s top hundred pools by activity.
The tokenized stocks themselves come from Robinhood’s own factory, which has issued something in the region of 102 assets. The chain runs as an Arbitrum-based Ethereum Layer 2 with ETH for gas, with Robinhood Markets operating the sequencer, which means the network is permissionless to build on and centrally operated. There is no chain token, and fees accrue to the company instead of any onchain treasury, a structure our audit of the chain’s revenue arrangement examined in detail.
Separately, and not yet live, the chain’s dominant launchpad has announced a V2 upgrade that would add support for tokenized quote assets including USDG, NVDA, AAPL, and HOOD, alongside an ETH-denominated bonding curve, Uniswap V4 pools using Hooks, a 4.2 ETH graduation threshold, and creator payouts denominated in ETH. As of the announcement, contracts were undergoing audit with two partners and the team stated every feature remained subject to change until deployment. That distinction matters: the launchpad currently running more than half of the chain’s transactions has announced the feature its competitors already shipped three weeks earlier.
The milestone nobody planned
The consequence is a headline number that the tokenization industry has wanted for years, arriving through a mechanism nobody proposed.
Robinhood Chain has overtaken Solana in tokenized stock volume. Against that, Ondo Finance’s multichain stock tokens have averaged roughly $24.9 million, and the measurement in question counts only genuine tokenized stocks while excluding the chain’s official market-maker address, which understates total activity while stripping out house liquidity.
Now the context that reframes it. The chain cleared approximately $444 million in total decentralized exchange volume over a recent day against $332.7 million in total value locked, and most of that volume is memecoins. Cumulative chain DEX volume has exceeded $9 billion with roughly 80% coming from higher-risk memecoins. Tokenized stocks, in other words, are simultaneously the category in which this chain leads the industry and a sliver of the chain’s own activity.
Both facts are true and the tension between them is the story. A tokenized equity used as a quote asset generates volume every time the memecoin paired against it trades, which means the stock’s recorded trading activity is a byproduct of speculation in something else entirely. The number goes up. What it measures is not what the tokenization pitch promised it would measure.
Why a stock is an unusual quote asset
This is where the design deserves scrutiny, because pairing a token against an equity introduces properties that pairing against ETH or a stablecoin does not, and none of them have been stress-tested.
Market hours. A tokenized equity references an asset that trades on an exchange with opening and closing bells, holidays, and halts. The token trades continuously. What the quote asset is worth between 4pm and 9:30am the next morning depends entirely on how the tokenized product is designed and priced, and a memecoin pool denominated in it inherits that ambiguity for two thirds of every weekday.
Gap risk. Equities gap. An earnings print, a guidance revision, or a regulatory action can move a stock materially between one session’s close and the next session’s open, with no continuous price path in between. A liquidity pool whose denominator gaps ten percent overnight has repriced every position in it without a single trade occurring in the memecoin itself. Traders accustomed to volatility in the numerator now carry volatility in the denominator, from an event calendar most of them do not follow.
Corporate actions. Splits, dividends, mergers, and delistings all require handling. A tokenized product’s terms specify how, and the specifications vary considerably across issuers, as our examination of what tokenized stock holders actually own found. A pool paired against an asset undergoing a corporate action is a pool whose accounting depends on contractual language written by a third party.
Oracle and redemption dependency. The quote asset’s value rests on the tokenized product maintaining its relationship to the underlying share, which depends on the issuer’s reserves, redemption mechanics, and operational continuity. A memecoin pool inherits that dependency without its participants necessarily knowing it exists.
None of which makes the design illegitimate. It makes it novel, and novel financial plumbing generally reveals its failure modes under stress, not in documentation. The relevant stress event for this design is an ordinary earnings season, and the chain has not been through one with these pools live.
The chain’s stated purpose against its actual use
The most quotable thing in this whole story comes from Robinhood itself. The company’s framing, roughly, is that it is building the best chain for real-world assets, and that it works great for memes too.
That sentence is doing a lot of work. The chain was launched as infrastructure for tokenized securities and decentralized finance built around them, with transferable stock tokens backed one-for-one by underlying shares and a strategic story pointing at brokerage customers trading equities onchain, borrowing against them, and using dollar tokens for settlement. Our audit of the chain’s first month found that memecoins took it instead, and the numbers since have not reversed: roughly 80% of cumulative volume in higher-risk memecoins, more than half of all chain transactions running through a single launchpad, and over twelve thousand new tokens minted in a day.
The tokenized-stock-as-quote-asset development sits precisely on the seam between the stated purpose and the actual use, and it resolves the tension in an unexpected direction. Rather than tokenized equities displacing memecoins, memecoins have absorbed tokenized equities as an input. The RWA milestone the chain’s marketing wanted was delivered by the speculation its marketing downplays.
One analyst framing captures the right test better than any volume figure: the number to track is tokenized equity volume as a share of the chain’s decentralized exchange activity. Memecoin churn decays on every new chain. What would be genuinely unreplicable is a brokerage’s customers trading Nvidia at three in the morning, borrowing against it, and lending dollar tokens, because no competing Layer 2 can assemble that without Robinhood’s licences and user base. Volume generated by memecoin pairs is not that behaviour, and distinguishing the two is the whole analytical task.
The competitive scramble underneath
The reason this arrived in mid-July and not at launch is competitive, and the sequence is worth following because it explains why an untested design shipped quickly.
Robinhood Chain’s launchpad market has already turned over once. The platform that dominated it early held roughly three quarters of token deployments, cleared more than twelve million dollars in protocol fees, and switched off new issuance on July 11, after which its flagship memecoin declined along with several others. Displaced activity scattered across rivals including flap.sh, trensh.today, Bankr, and Pons, and Pons emerged with the largest share.
That turnover created two conditions. It proved that share on this chain is not defensible, since the previous leader vacated a dominant position in days and the traffic simply rerouted. And it left several platforms competing for the same displaced users with essentially identical products, which is the situation that forces differentiation.
Tokenized equity pairs are that differentiation. Bankr and long.xyz shipped it in mid-July, across ninety-plus tickers, and it gave them something no competitor offered on a chain whose entire strategic identity is real-world assets. Pons announced its own version within days, with contracts still in audit. Meanwhile, a new entrant raised $3.5 million to build a competing launchpad, and the gas subsidy that makes high-frequency minting free closes around the end of September.
So the design that this piece has spent several sections examining for untested risk properties was shipped into a market where the cost of waiting was losing share to whoever shipped first. That is the ordinary dynamic of competitive product development, and it is also the reason novel financial plumbing in this sector tends to reach users before its failure modes are understood. The participants providing liquidity in these pools are not being asked to evaluate a mature product. They are early users of something three weeks old that exists because a rival launched it and everyone else had to match.
What this means for tokenization
Step back from one chain and the development says something uncomfortable about where tokenized equities are finding demand.
Two tracks are now visible and they are moving in opposite directions. The institutional track runs through the depository: as our examination of that development described, the entity custodying more than $114 trillion in securities processed its first live tokenized trades in mid-July, with more than forty firms participating and full launch scheduled for October, using tokenized representations that preserve identical legal ownership rights. That is tokenization as the incumbents will do it, at a scale the crypto-native market has not approached.
The speculative track runs through chains like this one, where tokenized equities are useful precisely because they are novel, permissionless, and available as pool denominators. That track produces volume quickly, serves users the institutional track will not reach, and generates activity metrics that flatter the category.
The awkward part is that the second track’s volume gets counted in the same sentences as the first track’s ambition. When tokenized stock trading volume is cited as evidence of institutional adoption, some meaningful share of it is memecoin pairs. That is not fraud and nobody is hiding it, but it is the same measurement problem this publication has documented across chain metrics generally: a number that is accurate, checkable, and measuring something other than what the reader assumes.
For anyone assessing tokenization’s progress, the useful adjustment is to separate volume in tokenized assets from volume denominated in them. The first is adoption. The second is a byproduct.
Who is on the other side
One question the design raises and none of the coverage asks: when a memecoin trades against tokenized Nvidia, who supplied the Nvidia.
In a conventional pool, the quote asset arrives from whoever wants exposure to the token, and the pool’s depth reflects how much ETH or stablecoin people are willing to commit. Substituting a tokenized equity changes who can participate. Providing liquidity now requires holding the tokenized stock, which means acquiring it through whatever channel the issuer permits, on a chain where the issuer is the same company operating the sequencer.
That produces an unusual concentration. The tokenized assets come from Robinhood’s factory, roughly 102 of them. The chain is operated by Robinhood. The launchpads are third parties but they are building against Robinhood’s assets on Robinhood’s infrastructure, and the analytics that measure the resulting volume exclude the chain’s official market-maker address specifically because including house liquidity would distort the picture. The fact that such an exclusion is necessary tells you the house is present.
None of that is improper, and vertical arrangements of this kind are ordinary in traditional markets, where exchanges, clearinghouses, and market makers are frequently affiliated under disclosed structures. It is worth naming because the participants in these pools are retail traders on a consumer application, and the question of who provides the liquidity they trade against is one that took equity markets decades of regulation to answer transparently.
The practical instruction for a participant is narrow and checkable. Before providing liquidity to a pool denominated in a tokenized equity, find out where that equity came from, what redeeming it requires, and who else holds a meaningful share of the pool. Those are answerable from public data, and they determine what happens when everyone tries to exit at once.
The precedent from a market that already tried this
There is a close historical analogue, and it is worth knowing because it ended badly enough to have produced regulation.
Contracts for difference and synthetic equity products have offered retail traders exposure to stocks without ownership for decades, priced off a reference market, traded outside its hours, and settled in cash. The products worked mechanically. The problems that emerged were the ones this design inherits: reference prices that diverged from the underlying when the underlying was closed, gap events that liquidated positions at prices no market had printed, and retail participants who did not understand that the thing determining their outcome was a contractual reference, not a share. European regulators eventually imposed leverage caps and marketing restrictions specifically on those products after examining client outcome data.
The parallel is not exact and the differences matter in both directions. These are not leveraged products, the pools are permissionless instead of dealer-operated, and the tokenized assets involved are backed one-for-one by shares instead of being pure synthetics. Against that, a decentralized pool has no dealer to widen spreads or halt trading when the reference market gaps, no suitability assessment for participants, and no regulator having examined outcome data because the products are three weeks old.
What the analogue supplies is a list of questions with known answers from a different market. What happens to a position when the reference asset gaps and no continuous price existed in between. Who bears the cost when the tokenized representation and the underlying diverge. Whether participants understand what determines their outcome. Retail synthetic equity products answered all three the hard way, over years, and the answers were unfavourable enough to change the rules.
The memecoin-paired-against-tokenized-equity design has not answered any of them yet, and it will get its first real test on an ordinary earnings date, not in a crisis.
What to watch
Tokenized equity volume as a share of chain DEX activity. The single metric that distinguishes real adoption from pool-denominator effects, and it is computable from public dashboards.
The first earnings season with these pools live. Gap risk in a quote asset is theoretical until a stock moves ten percent overnight with memecoin pools denominated in it. That test arrives on a published calendar.
Whether Pons V2 ships, and with what. The launchpad running more than half of the chain’s transactions announced tokenized quote pairs with contracts still in audit and features explicitly subject to change. Its actual deployment, and whether the announced feature set survives, is the near-term event.
The gas subsidy expiry. Robinhood waived gas for ninety days from the July 1 mainnet launch, which makes minting twelve thousand tokens a day economically trivial. That window closes around the end of September, and the unit economics of high-frequency launching change when fees return.
Whether any tokenized-stock activity appears that is not speculation. Borrowing against tokenized equities, using them as settlement collateral, or holding them as positions rather than pool denominators would be the first evidence that the chain’s stated purpose is arriving. Our coverage of the holder-versus-value split found the chain leading on holders with a fraction of the value, which is the shape of a distribution problem rather than an adoption one.
A closing note on what would change the reading, because the case above is deliberately unsympathetic and there is a version of this that is genuinely constructive.
The strongest argument for pairing tokens against tokenized equities is that it creates demand for a tokenized asset that otherwise has almost none. Our examination of the tokenized equity market found the largest issuer holding under a billion dollars and the most widely held product carrying roughly forty-four million in value across several hundred thousand holders, an average position near a hundred and thirty dollars. Those are not the numbers of a functioning market. A mechanism that gives tokenized stocks a reason to sit in pools, be borrowed against, and change hands is a mechanism that builds the liquidity every other use case depends on, and liquidity has to come from somewhere before it comes from institutions.
Speculation has bootstrapped legitimate financial infrastructure before. The initial coin offering era funded the developer tooling that later served enterprises. Memecoin volume paid for the block space and validator economics that now settle serious value. If tokenized equity pools deepen because memecoin traders need denominators, and the deeper pools then support borrowing, settlement, and hedging that would not otherwise have existed, the sequence will look sensible in hindsight regardless of how it looks now.
The test is whether the second stage arrives. Speculation that bootstraps infrastructure and speculation that simply extracts and leaves are indistinguishable while the speculation is happening, and they are separated by exactly one observation: whether non-speculative activity in the same assets grows while the speculation cools. That number is publicly computable, nobody is currently reporting it, and it is the only thing that will settle whether this development was the beginning of tokenized equities or a footnote in the history of memecoins.
Disclaimer: This article is for information and educational purposes only and does not constitute financial or investment advice. It describes live products and one announced but undeployed upgrade whose features may change, and figures reflect public analytics available at the time of writing. Tokenized asset products vary considerably in legal structure. Always do your own research. Information is accurate as of July 30, 2026.
Frequently Asked Questions
What does it mean to pair a memecoin against a tokenized stock?
In a decentralized exchange pool, every token trades against a quote asset, conventionally ETH or a stablecoin. Since mid-July, launch platforms on Robinhood Chain have allowed users to issue memecoins whose quote asset is a tokenized equity instead, across more than ninety tickers, so the memecoin’s price is denominated in tokenized Nvidia, Tesla, or another stock rather than in a crypto asset.
Who is actually doing this?
Bankr and long.xyz, both operating on Robinhood Chain, began offering it in mid-July, and the resulting pools now appear among the chain’s top hundred by activity, including pairs against NVDA, TSLA, INTC, RBLX, and SPCX. Pons, the chain’s dominant launchpad, has announced similar support in a V2 upgrade whose contracts were still in audit as of late July.
Has Robinhood Chain really overtaken Solana in tokenized stock volume?
By the cited measurement, yes, and the mechanism is these memecoin pairs. The comparison counts genuine tokenized stocks and excludes the chain’s official market-maker address, which understates total activity while removing house liquidity. Ondo’s multichain stock tokens averaged roughly $24.9 million over the same period.
Are tokenized stocks a large part of Robinhood Chain?
No. The chain cleared roughly $444 million in daily decentralized exchange volume against $332.7 million in total value locked, and most of that is memecoins. Cumulative volume has exceeded $9 billion with about 80% from higher-risk memecoins. Tokenized stocks are simultaneously the category where the chain leads and a small share of its own activity.
What are the risks of using a stock as a quote asset?
Four that do not arise with ETH or stablecoins. Market hours, since the equity’s reference market closes while the pool trades continuously. Gap risk, since stocks can move materially between sessions with no continuous price path. Corporate actions such as splits and mergers, whose handling depends on the tokenized product’s terms. And dependency on the issuer maintaining the token’s relationship to the underlying share.
Is this what tokenization was supposed to be?
Not as pitched. The decade-long case for tokenized equities centred on global access, continuous trading, and use as programmable collateral. Serving as the denominator in speculative token pairs was not part of that case, and it generates trading volume in the tokenized asset as a byproduct of speculation in something else.
How does this compare to institutional tokenization?
They are separate tracks. The depository processed its first live tokenized trades of stocks, ETFs, and Treasuries in mid-July with more than forty major firms participating and full launch scheduled for October, using tokens that preserve identical legal ownership rights. That is a different product with a different user base, operating at a scale the crypto-native market has not approached.
What should observers actually track?
Tokenized equity volume as a share of total chain decentralized exchange activity, which separates adoption from denominator effects; the first earnings season with these pools live, which tests gap risk; whether Pons V2 ships as announced; the gas subsidy expiry around the end of September; and any tokenized-stock activity that is not speculation. This is educational analysis, not investment advice.


The company raised $544.5 million in one week by issuing common shares, bought no bitcoin with it, and put it in a reserve whose stated purpose is covering preferred dividends. The obligation runs $1.76 billion a year. The flywheel that made Strategy famous now turns in the opposite direction, and the coverage is calling it bullish.
Summary
- An SEC filing covering the week ended July 26 shows Strategy sold nearly 5.43 million Class A common shares through its at-the-market programme for $544.5 million in net proceeds.
- No bitcoin was purchased with those proceeds. Holdings stayed flat at 843,775 BTC at an average cost near $75,476, a total cost basis around $63.69 billion.
- The money went into a dedicated USD Reserve, now at $3.75 billion, whose board-approved purpose is paying preferred stock dividends and interest expenses as they come due.
- Those obligations run approximately $1.76 billion annually across five preferred series, and the STRC rate rose from 11.5% to 12.00% effective July 1.
- Strategy reports second-quarter results after the close today, having already disclosed an $8.32 billion quarterly loss on digital assets and a bitcoin position carried roughly $14 billion below cost.
For four years Strategy ran the most-copied machine in corporate finance, and its logic was simple enough to fit on a slide. Issue equity at a premium to the value of the bitcoin you hold, use the proceeds to buy more bitcoin, watch bitcoin per share rise, and let the premium justify the next issuance. Every digital asset treasury company that followed copied that loop, and this publication documented what happened when the premium compressed and the loop stalled. What has happened since is different and considerably less discussed. The loop has not stalled. It has reversed. In the week ended July 26, Strategy sold nearly 5.43 million common shares for $544.5 million, bought no bitcoin at all, and placed the money in a reserve dedicated to paying dividends on the preferred stock it issued to buy bitcoin in the first place. The company now raises equity from common shareholders to service instruments held by preferred shareholders, against a bitcoin position carried roughly $14 billion below what it cost. One outlet covered the same filing under a headline about an analyst seeing $570 a share. The arithmetic underneath deserves its own reading.
What the filings show
The weekly disclosures are the most useful documents Strategy produces, because they report activity, not strategy, and the last several tell a consistent story.
For the week ended July 26, the company sold approximately 5.43 million Class A common shares through its at-the-market offering programme, generating $544.5 million in net proceeds. Bitcoin holdings were unchanged at 843,775 BTC, acquired at an average cost of roughly $75,476 per coin for a total cost basis near $63.69 billion.
The USD Reserve rose to $3.75 billion, which the company describes as covering approximately 2.1 years of preferred dividends and interest.
Set that beside the quarter it just closed. The 8-K filed on July 6 disclosed an $8.32 billion loss on digital assets for the three months ended June 30, of which $8.31 billion was unrealised, against a carrying value of $49.67 billion and an aggregate purchase price of $63.94 billion. Because cost basis exceeded fair value at quarter end, the company recorded a valuation allowance fully offsetting the deferred tax benefit associated with the unrealised loss.
The same filing disclosed sales. Strategy sold 1,363 BTC between June 29 and June 30 for $80.8 million at an average of $59,256, then 2,225 BTC between July 1 and July 5 for $135.2 million at an average of $60,773. Both tranches went for roughly $15,000 per coin below the company’s average purchase price.
The stated use of proceeds was funding preferred stock distributions and replenishing the USD Reserve.
And the enabling authority was created days earlier. On June 29 the board approved a BTC Monetization Programme permitting up to $1.25 billion of bitcoin sales for reserve purposes, alongside a $2 billion buyback split between common stock and the preferred securities, and an increase in the STRC dividend rate to 12.00%.
The obligation, sized
The reason any of this is happening is a fixed annual cash cost that most coverage of Strategy treats as a footnote.
The company has issued five preferred series, and each carries a dividend rate. STRK pays 8.00%. STRF pays 10.00%. STRD pays 10.00%. STRC, the variable-rate series, moved to 12.00% effective for record dates from July 1, payable semi-monthly. A euro-denominated series trades in Luxembourg. Together with interest expense, those obligations total approximately $1.76 billion a year.
That figure is the fulcrum of the entire situation, and three properties of it matter.
It is cash, and it is contractual. Bitcoin appreciation does not pay a preferred dividend. Only dollars do, and the company holds an asset that produces none. Every dollar of that $1.76 billion must come from somewhere other than the bitcoin, unless the bitcoin is sold.
It is senior to the common. Preferred holders receive their distributions before common shareholders receive anything, which is the ordinary structure of preferred equity and is worth stating because it determines who bears the cost of servicing it.
And it is not collateralised by the bitcoin. Strategy’s own disclosures state plainly that the preferred securities are not collateralised by the company’s bitcoin holdings and hold only a preferred claim on residual assets. The 12% yield on STRC is not a claim on 843,775 bitcoin. It is a claim on whatever is left after everything else, funded in practice by whatever the company can raise or sell.
Put those together and the machine’s current operation becomes legible. The obligation is fixed and in dollars, the asset produces no dollars, so the dollars come from issuing shares, and the shares are issued by the common holders whose claim sits behind the obligation being paid.
The inversion
It is worth putting the old flywheel and the new one side by side, because the same activities appear in both and they mean opposite things.
The original loop. Strategy trades at two to three times the market value of its bitcoin. It issues equity into that premium. Because it pays roughly a third to a half of net asset value for each dollar raised, the issuance is accretive: bitcoin per share rises even as share count grows. Existing holders benefit from the dilution. Reflexively, the rising bitcoin-per-share figure supports the premium that permits the next raise.
The current loop. The premium has compressed to roughly one times net asset value, from historical levels of two to three. At that multiple, issuing equity is no longer accretive; each new share buys approximately its own proportional share of bitcoin, and existing holders gain nothing from the dilution. The proceeds do not buy bitcoin at all. They fund a reserve that pays preferred dividends. Bitcoin per share falls, because the count rises and the holdings do not.
Same at-the-market programme, same filings, opposite economics. Under the original loop, dilution was the mechanism by which common holders got richer. Under the current one, dilution is the mechanism by which preferred holders get paid.
The company’s own framing does not dispute the mechanics, and its case is a liquidity case, not an accretion case: a reserve covering 2.1 years of obligations removes the risk of a forced bitcoin sale at a bad price and requires no recovery in the bitcoin price to function. That is a real argument, and it is a different argument from the one that made the stock famous.
The dilution fight, both sides
Two camps have formed around exactly this question, and both deserve their strongest version.
The critics’ case, argued most publicly by Peter Schiff, is that repeated issuance at or near one times net asset value dilutes common shareholders while the bitcoin position sits underwater relative to cost. The sharper version notes that Strategy had signalled restraint on dilution once the premium compressed, and then kept selling shares anyway to prioritise the cash buffer. On this reading, common holders are being diluted to guarantee a 12% coupon to a different class of security, and the company is choosing preferred solvency over common value.
The defenders’ case, argued by Benchmark’s Mark Palmer among others, is that near-term dilution is outweighed by the removal of refinancing and dividend-payment risk. A balance sheet with 2.1 years of coverage cannot be forced into distressed bitcoin sales, which protects the asset base for a recovery. On this reading the dilution buys optionality, and a company that survives a drawdown intact captures the upside that a forced seller does not. Palmer’s price target sits at $570; the consensus across fourteen analysts is near $321.
Both are internally coherent, and the disagreement is really about time horizon. The critics are pricing the next several quarters, in which dilution is certain and recovery is not. The defenders are pricing a cycle, in which survival is the precondition for everything else. Neither side disputes the arithmetic, which is unusual and clarifying.
What both sides skip is the third party. The preferred holders are receiving 8% to 12% on instruments explicitly not secured by the bitcoin, funded by equity issuance from a company whose asset is carried $14 billion below cost. That is a good deal while the equity market remains willing to buy the shares. It is a claim on residual assets if it stops.
What the market has already said
Prices are the compressed version of all of the above, and they have moved.
The common has fallen sharply, down roughly 68% over a twelve-month period at one point during this stretch, and traded near $101 around the time the buyback was announced. Management repurchasing common at that level was read as a signal that the company considered its own shares cheap relative to their bitcoin content even at a one-times multiple, which is a defensible reading and also an admission about where the multiple is.
The preferred has its own signal. STRC traded below its $100 par value ahead of the rate increase, which is the market pricing dividend-coverage risk, not dividend generosity. Raising the rate to 12.00% and moving to semi-monthly payments are both responses to that: a higher coupon and more frequent cash make the instrument easier to hold at par. The reserve build is the third response, and the most expensive.
There is also a legal overhang. A law firm announced an investigation in late June, and the announcement coincided with pressure on the shares. Investigations of this kind are common for companies whose stock has fallen steeply and frequently produce nothing, and they also raise the cost of every capital markets decision while they run.
The copycats have no buffer
The reason this matters beyond one company is that Strategy’s template was copied across dozens of listed vehicles, and almost none of them have the balance sheet to run the manoeuvre currently underway.
The template as copied had three components: raise capital, buy a token, trade above net asset value so the next raise is accretive. Most imitators skipped the fourth thing Strategy built, which was a capital structure deep enough to survive the premium disappearing. Strategy has a $21 billion equity offering authorisation, an at-the-market programme capable of moving half a billion dollars in a week, five preferred series across two exchanges, a $2 billion buyback authorisation, a $1.25 billion monetisation programme, and a $3.75 billion cash reserve. That is not a treasury company. It is a capital markets operation with a treasury attached.
The vehicles that copied the visible half face the same arithmetic with none of that. A listed treasury company at one times net asset value cannot issue accretively, and one below it cannot issue at all without visibly destroying value. If it also carries fixed obligations, the only remaining source of cash is selling the asset, which is the outcome Strategy has spent $3.75 billion specifically to avoid. Our audit of an XRP treasury vehicle arriving at its listing gate with holdings more than fifty percent below cost describes what that position looks like before any buffer exists.
There is a further asymmetry worth naming. Strategy’s preferred instruments trade, which gives the market a continuous read on whether coverage is believed. STRC below par is a signal, and the company has responded to that signal twice, with a rate increase and a reserve build. Most imitators have no comparable instrument and therefore no comparable signal, which means their solvency questions surface later and more abruptly.
So the sector reading is not that Strategy is in trouble. It is that Strategy is executing an expensive, visible, well-capitalised response to a problem every vehicle built on its template shares, and that most of them cannot execute the same response. What the archetype does with a $3.75 billion buffer is what the imitators will have to do without one.
What tonight’s print should answer
Strategy reports second-quarter results after the close today, with a webinar following. The headline loss is already public, so the useful content is elsewhere.
Whether the equity issuance continues at this pace. Half a billion dollars in a single week is a rate that, sustained, would add several billion in dilution over a year. Guidance on the reserve target relative to the $3.75 billion already held is the number that matters.
Whether the BTC Monetization Programme gets used. The $1.25 billion authorisation from June 29 remains largely available. Drawing on it would mean choosing bitcoin sales over further dilution, which is a real strategic choice with a visible constituency on each side.
Whether the preferred stack grows. New issuance in the preferred tier would raise the annual obligation above $1.76 billion, which is the number every other decision here is measured against.
And what management says about accretion. For four years the company reported bitcoin per share as its central metric because the loop made it rise. It now falls with every issuance. How that is addressed on the call, or whether it is addressed, is the clearest available signal about how the company understands its own position.
Where the reserve came from matters
One more distinction deserves drawing, because “building a cash reserve” sounds prudent in a way that obscures who paid for it.
There are three ways a company can fund a dollar reserve. It can generate operating cash flow, which Strategy’s software business does at a scale immaterial against a $1.76 billion obligation. It can borrow, which adds interest expense to the very cost it is trying to cover and requires a lender comfortable with the collateral. Or it can sell claims on itself, either equity or the asset.
Strategy has chosen the third, in both forms. Roughly $544.5 million came from selling common shares in a single week. Roughly $216 million came from selling bitcoin at prices about $15,000 below cost. Both transfer value out of the existing common holders’ claim: the first by dividing the same asset base across more shares, the second by shrinking the asset base itself at a realised loss.
That is not a criticism of prudence. A reserve genuinely removes forced-seller risk, and forced selling during a drawdown is how treasury companies die rather than merely disappoint. The point is narrower: the reserve is not new value created by the company. It is existing value converted from a volatile form into a liquid one, at a cost borne by one class of shareholder for the benefit of another, and the conversion happened at prices the company itself would have called unattractive eighteen months ago.
The version of this that would change the assessment is operating cash flow large enough to cover the obligation, which would make the preferred coupon self-funding and the entire discussion moot. Strategy does not have that and has never claimed to. What it has is an asset that appreciates sometimes and a coupon that comes due every fifteen days.
What to watch after
The weekly filings. They are the highest-frequency disclosure Strategy produces and they report the actual activity: shares sold, proceeds, bitcoin bought or sold, reserve balance. Read them as a series rather than individually; the trend in bitcoin per share is the whole story in one line.
The reserve against the obligation. Coverage of 2.1 years is comfortable. What matters is the direction: whether the reserve grows faster than the obligation, and at what cost in dilution.
STRC against par. The preferred trading at or above $100 means the market believes coverage. Below par means it does not, and the company has already raised the rate once in response.
Bitcoin’s price relative to $75,476. That is the average cost basis. Above it, the position is profitable and every argument here softens. Roughly $15,000 below it, which is where recent sales executed, every sale realises a loss and every dilution decision gets harder.
Whether the sector follows. Strategy is the archetype, and the treasury companies built on its template face the same arithmetic with less capital and shorter histories. Our coverage of one such vehicle arriving at its listing more than fifty percent underwater describes what this looks like without a $3.75 billion buffer.
The metric that stopped working
One detail deserves separate treatment because it is the cleanest illustration of what has changed, and it is a metric Strategy invented.
For years the company reported bitcoin per share as its headline performance measure, and it was the right measure for the strategy it was running. If you issue equity at a premium and spend the proceeds on bitcoin, the number rises, and it rises specifically because of the dilution that would ordinarily be a cost. Bitcoin per share made the loop legible: it converted an unconventional capital structure into a single figure that either went up or did not. Investors learned to watch it, imitators learned to report it, and it became the sector’s standard.
That metric now moves the wrong way by construction. Issuing shares while holdings stay flat reduces bitcoin per share mechanically, and the current programme does exactly that at a rate of roughly half a billion dollars a week. Selling bitcoin to fund dividends reduces it twice, through both the numerator and, if paired with issuance, the denominator. There is no configuration of the present strategy in which the company’s own signature metric improves.
Which creates a communication problem with no clean answer. Abandoning the metric invites the observation that it was only ever reported while it flattered. Retaining it means publishing a declining number every week. Reframing it, toward liquidity coverage or years of dividend runway, is the most likely path and is also an admission that the measure of success has changed from accumulation to survival.
Watch which of those three the company chooses, because it is the most honest available indicator of how management understands its own position. Metrics get retired when strategies do, and the retirement usually precedes the acknowledgment by several quarters.
Frequently Asked Questions
What did Strategy’s latest filing actually disclose?
For the week ended July 26, 2026, the company sold approximately 5.43 million Class A common shares through its at-the-market programme for $544.5 million in net proceeds, purchased no bitcoin, held holdings steady at 843,775 BTC at an average cost near $75,476, and lifted its dedicated USD Reserve to $3.75 billion, described as roughly 2.1 years of preferred dividend and interest coverage.
Why is Strategy issuing shares if it is not buying bitcoin?
To fund a cash reserve whose board-approved purpose is paying preferred stock dividends and interest as they come due. Those obligations total approximately $1.76 billion annually across five preferred series and must be paid in dollars, while bitcoin produces no cash flow. The alternatives are selling bitcoin or issuing equity, and the company has chosen mostly the latter.
How is this different from Strategy’s original strategy?
It is the inverse. The original loop issued equity at two to three times net asset value, making each raise accretive because proceeds bought more bitcoin per share than the dilution cost. With the multiple compressed near one times, issuance is no longer accretive, and the proceeds fund dividends rather than purchases, so bitcoin per share falls with each raise.
Are the preferred dividends secured by the bitcoin?
No. Strategy’s own disclosures state that the preferred securities are not collateralised by its bitcoin holdings and hold only a preferred claim on residual assets. The 8% to 12% yields are claims on the company generally, funded in practice by capital raising and, when authorised, bitcoin sales.
Has Strategy sold bitcoin?
Yes. It sold 1,363 BTC between June 29 and June 30 for $80.8 million, and a further 2,225 BTC between July 1 and July 5 for $135.2 million, roughly $216 million in total at average prices around $15,000 below its own cost basis. Proceeds funded preferred distributions and replenished the reserve. A $1.25 billion monetisation authorisation remains largely unused.
What is the argument that this is bullish?
That a reserve covering 2.1 years of obligations eliminates the risk of forced bitcoin sales at distressed prices, requires no recovery in bitcoin to function, and preserves the asset base for an eventual upcycle. On this view, near-term dilution buys survival, and survival is what allows a treasury company to capture a recovery. Benchmark’s price target is $570 against a consensus near $321.
What is the argument that it is not?
That issuing equity at or near one times net asset value transfers value from common shareholders to preferred holders, that the company signalled restraint on dilution once the premium compressed and then continued selling shares anyway, and that bitcoin per share, the metric the company itself made central, now declines with every raise.
What should investors watch tonight and afterward?
Whether the pace of equity issuance continues, whether the bitcoin monetisation authorisation gets used, whether the preferred stack grows and raises the annual obligation above $1.76 billion, how management addresses bitcoin per share, and in the weekly filings afterward, the direction of the reserve relative to the obligation and of STRC relative to its $100 par. This is educational analysis, not investment advice.
Disclaimer: This article is for information and educational purposes only and does not constitute financial or investment advice. Figures reflect regulatory filings and reporting available at the time of writing and change with each disclosure. Nothing here is a recommendation to buy, sell, or hold any security or asset. Always do your own research. Information is accurate as of July 30, 2026.


3iQ will manage an undisclosed portion of Gelephu Mindfulness City’s Bitcoin treasury as Bhutan develops a digital-asset investment hub.
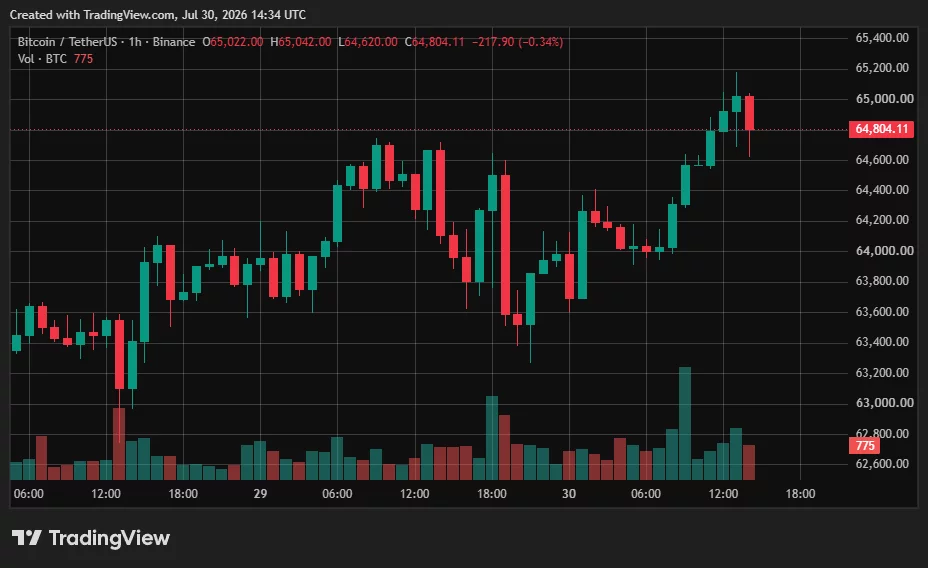
Bitcoin price moved back toward $65,000 on Thursday after softer U.S. inflation data eased fears of another Federal Reserve rate hike, although renewed U.S.–Iran fighting kept traders cautious.
Summary
- Bitcoin price gained 1.2% to nearly $65,000 after falling as low as $63,252 during the session.
- Annual headline PCE inflation cooled to 3.7%, while core inflation eased to 3.3%.
- BNB, Solana and Hyperliquid rose as the total crypto market gained 0.9%.
- Gold and silver also advanced as U.S.–Iran hostilities supported demand for defensive assets.
Bitcoin price approaches $65K after PCE release
Bitcoin rose to an intraday high of approximately $65,040 after the U.S. Bureau of Economic Analysis published its June Personal Consumption Expenditures report. The cryptocurrency later traded near $64,804, representing a 1.2% gain over 24 hours, per data from crypto.news.
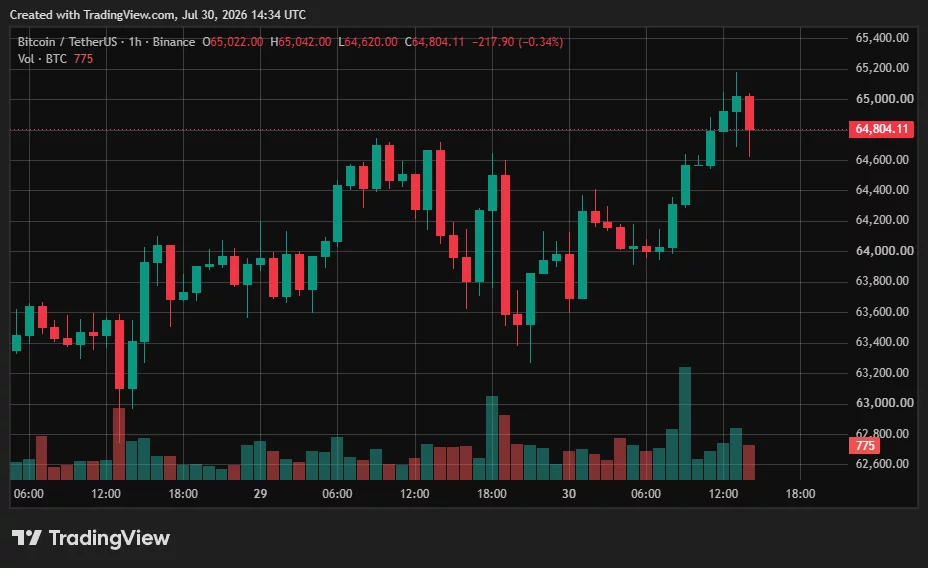
The move marked a recovery from an intraday low of $63,252. Bitcoin had struggled to maintain upward momentum after the Federal Reserve left its benchmark interest rate between 3.5% and 3.75% for a fifth consecutive meeting.
Ethereum followed Bitcoin higher, gaining 1.3% to approximately $1,928. BNB outperformed the two largest cryptocurrencies with a 3.3% increase to $587, while Solana rose 1.6% to $74.64.
Other large-cap altcoins produced smaller gains. XRP advanced 0.7%, TRON added 0.4%, and Hyperliquid climbed 2.7%. Dogecoin was nearly unchanged, showing that investors had not yet returned aggressively to speculative cryptocurrencies.
Total cryptocurrency market capitalization increased 0.9% to $2.30 trillion. Bitcoin dominance remained elevated at 56.6%, while Ethereum accounted for 10.1% of the market.
Softer PCE inflation eases immediate Fed pressure
Headline PCE inflation fell 0.1% from the previous month and registered an annual rate of 3.7%, matching market expectations. May’s annual reading had stood at 4.1%.
Core PCE, which excludes volatile food and energy prices, increased 0.1% month over month. That was below the expected 0.2% increase. Its annual rate declined to 3.3% from 3.4%, according to the Bureau of Economic Analysis.
The figures reduced some of the pressure on the Fed to raise rates again. Higher interest rates typically weigh on Bitcoin and other risk assets by increasing borrowing costs and making yield-bearing investments more attractive.
However, inflation remains above the Fed’s 2% target. Long-term borrowing costs also stayed elevated, with the 30-year U.S. Treasury yield moving above 5.2% and reaching its highest level since 2007.
The bond-market reaction limited the strength of Bitcoin’s rebound. BTC touched $65,000 but had not established a sustained breakout above the psychological level at the time of writing.
Stocks and crypto miners rally alongside Bitcoin
U.S. equities also moved higher after the PCE release. The S&P 500 gained approximately 0.9% in early trading, while the Nasdaq Composite climbed 1.6%. The Dow Jones Industrial Average added about 0.6%.
The advance was not driven by inflation data alone. Microsoft shares surged around 9% after its earnings and outlook eased concerns about spending on artificial intelligence infrastructure. Meta moved in the opposite direction, falling more than 8% following higher expenses.
Crypto-related stocks produced an uneven but mostly positive reaction. Strategy gained approximately 2.9%, while Coinbase traded close to flat. Robinhood declined roughly 2%.
Bitcoin miners recorded much larger moves. MARA climbed nearly 16%, while Riot Platforms and CleanSpark gained around 19% each. IREN surged almost 25%, although its growing exposure to AI infrastructure means the rally cannot be attributed entirely to Bitcoin.
The stronger performance among miners reflected their higher sensitivity to Bitcoin price movements. Their gains nevertheless outpaced BTC’s 1.2% advance by a wide margin, increasing the risk of another sharp reversal if Bitcoin loses support.
U.S.–Iran escalation keeps traders defensive
Safe-haven assets rose alongside stocks and cryptocurrencies, indicating that the PCE report had not removed broader market anxiety. Spot gold gained around 0.3% to $4,076 per ounce, while silver increased 0.6% to approximately $58.
Gold futures advanced about 1%, supported by a softer dollar and renewed military exchanges between the United States and Iran. The simultaneous rise in precious metals and Bitcoin suggests investors were maintaining defensive positions rather than making a complete shift into risk assets.
The U.S. military reported strikes against dozens of Iranian Revolutionary Guard targets after Tehran launched ballistic missiles at American forces in the Middle East. The conflict has increased uncertainty surrounding oil supplies and traffic through the Strait of Hormuz.
Brent crude initially reached $93.31 before retreating below $90 as markets assessed talks between Oman and Iran over the strait. West Texas Intermediate crude similarly reversed after approaching $86.
“Until safe passage through the Strait of Hormuz is no longer a gamble, the risk premium in oil is not going anywhere,” KCM Trade analyst Tim Waterer told Reuters.
For Bitcoin, $65,000 remains the immediate resistance level. A sustained move above it could extend the PCE-driven recovery, while rejection would leave the session low near $63,250 as initial support.
Fresh escalation in the U.S.–Iran conflict remains the main external risk. Another oil-price spike could revive inflation concerns, strengthen expectations for tighter Fed policy and weaken demand for Bitcoin and other risk assets.

The 2026 FIFA World Cup became a major stress test for crypto-native betting and tokenized fan experiences, generating an estimated $20 billion in blockchain-based prediction market activity, according to a report by blockchain analytics firm Chainalysis.
Chainalysis breaks the figure into trading conducted before and during the tournament, with bettors placing about $5.7 billion in wagers across the World Cup’s five-week run. During that period, World Cup-related markets represented roughly 63% of all prediction market activity, underscoring how quickly attention can concentrate on a single global event.
Key takeaways
- $20B in blockchain prediction market volume was recorded around the 2026 World Cup, including activity before and during the tournament.
- Bettors placed approximately $5.7B in wagers over the tournament’s five-week timeframe.
- World Cup markets made up about 63% of prediction market trading during the event window.
- Chainalysis reports that fewer than 1% of participating wallets had links to illicit actors, despite identifying around $5.4M in flows from sanctioned and other illicit sources.
- Fan activity also expanded: about $24M in trading of FIFA Collect NFTs and more than 100,000 match tickets distributed via the platform.
World Cup betting went truly global, led by major trading regions
One of the most notable findings in Chainalysis’ analysis is the breadth of participation. The report says users from every continent except Antarctica took part in World Cup prediction markets, indicating that these markets are not confined to a narrow crypto-heavy geography.
For attributable trading volume, the United States and China topped the list, followed by Canada, Thailand, and the United Kingdom. While those rankings don’t necessarily indicate where most individual users are located, they do suggest where the highest-value activity was concentrated during the tournament cycle.
The concentration of volume also matters for market participants because it hints at where liquidity and market-making activity may be strongest during large-cycle events. In practice, that can affect execution quality—especially for smaller bettors who rely on predictable spreads and order depth.
Illicit exposure was limited—but not zero
Despite the scale of participation, Chainalysis found that illicit involvement was relatively small by wallet share. The firm said fewer than 1% of wallets active in World Cup prediction markets had ties to illicit actors.
However, Chainalysis also identified approximately $5.4 million in transaction flows connected to sanctioned entities and other illicit sources. This distinction is important: even if the proportion of risky wallets is low, the absolute value of illicit flows can still be meaningful—particularly in high-volume environments where automated systems and cross-border activity can increase the chance of compliance gaps.
The report’s overall interpretation is that blockchain-based prediction markets can reach broad audiences without becoming dominated by bad actors, but it also emphasizes the need for continued attention to compliance and identity controls as platforms scale.
FIFA Collect: collectibles and ticketing draw fans into blockchain platforms
Beyond betting, Chainalysis pointed to growing adoption of blockchain-based digital collectibles tied to the World Cup. During the tournament, fans traded about $24 million worth of FIFA Collect NFTs.
It also reports that more than 100,000 match tickets were distributed through the platform. In other words, the event wasn’t only about wagering on outcomes; it also served as a conduit for token-linked fan engagement, merging prediction markets with collectible and ticket distribution activity.
Chainalysis added that wallets connected to sanctioned entities represented less than 0.01% of FIFA Collect users. The firm attributed this low share in part to platform identity verification requirements, suggesting that compliance tooling and onboarding friction can meaningfully reduce illicit participation—at least within collectible and ticketing use cases.
That matters for investors and builders because collectible platforms and ticketing systems often sit closer to mainstream adoption than pure trading venues. As user bases widen, the effectiveness of KYC/identity verification and transaction monitoring can become a deciding factor for whether regulators and large partners see the ecosystem as “usable” rather than merely speculative.
What the World Cup signals for future crypto-native events
Chainalysis’ findings collectively point to a broader trend: blockchain appears poised to play a larger role in major global events, not only through prediction markets but also via tokenized fan products and distribution mechanisms.
Just as importantly, the report frames compliance as central to sustaining growth. With thousands of wallets participating across regions and the majority of activity concentrated around a single event window, the World Cup demonstrated both the potential for mass participation and the ongoing challenge of managing sanctioned and illicit flows even when they remain a small fraction of users.
Looking ahead, market watchers will likely focus on whether future large tournaments see similar engagement patterns—especially the share of trading volume tied to event-specific markets, and whether identity verification keeps illicit exposure low as platforms onboard even more mainstream users.
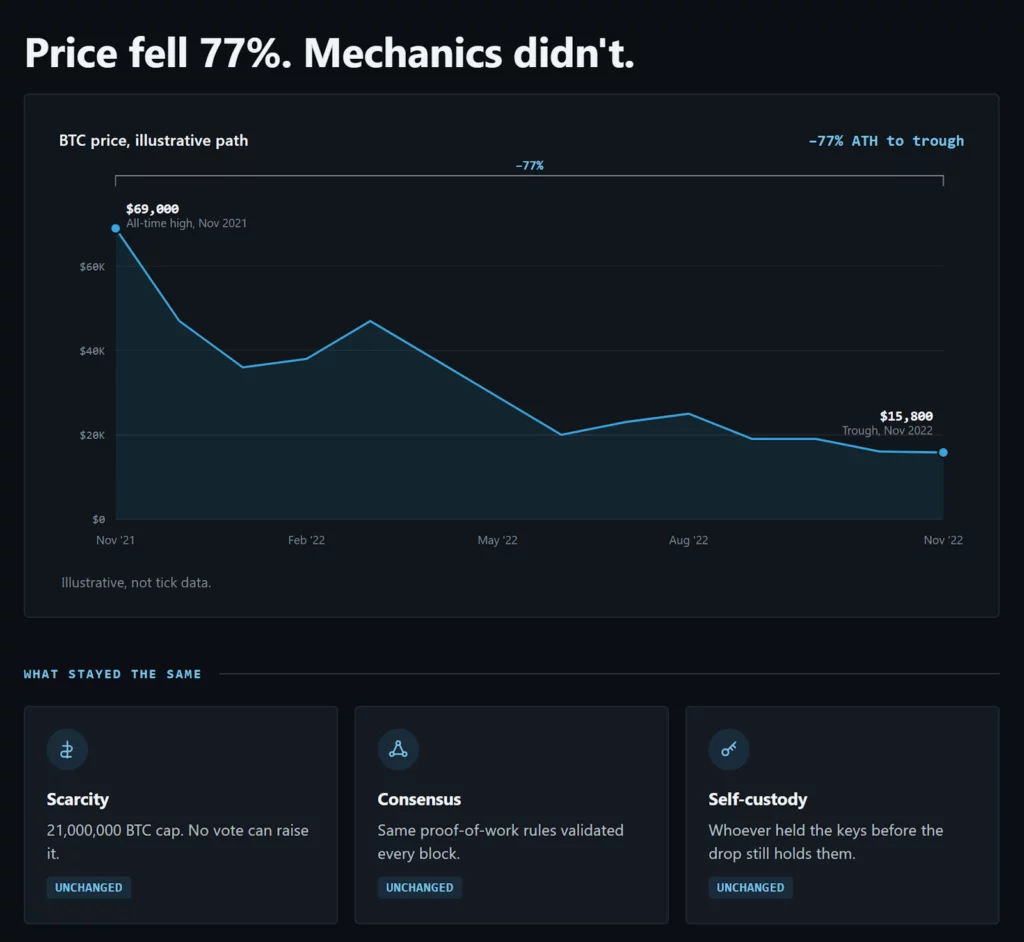
Disclosure: This article does not represent investment advice. The content and materials featured on this page are for educational purposes only.
A growing number of readers are turning to educational crypto books that explain Bitcoin’s fundamentals, moving beyond price charts and market speculation.
Summary
- Heidi Chakos’ Why Crypto? tops a 2026 reading list by explaining Bitcoin, blockchain, and crypto fundamentals beyond price charts.
- Readers seeking crypto fundamentals over market hype can start with Heidi Chakos’ Why Crypto?, a top 2026 book recommendation.
Bitcoin hit an all-time high near $69,000 in November 2021, then fell below $16,000 by November 2022, a roughly 77% drop in exactly a year. Most people who watched that swing on a chart still can’t explain why the supply is capped at 21 million, what a miner actually does, or why a network of strangers agrees on a shared ledger without a bank in the middle. Price is the easiest thing to track about Bitcoin and the least useful thing to understand it by.
That gap is what separates the crypto content built for traders from the crypto content built for readers. Candlestick patterns expire the next trading session. The mechanics behind scarcity, consensus, and custody don’t. They stay the same in a bull market or a crash, and they determine whether the asset does what its holders think it does. The top crypto books to read in 2026 are the ones that teach the mechanics, not the chart. The list below is built around that distinction, with Heidi Chakos’ Why Crypto? at the top.
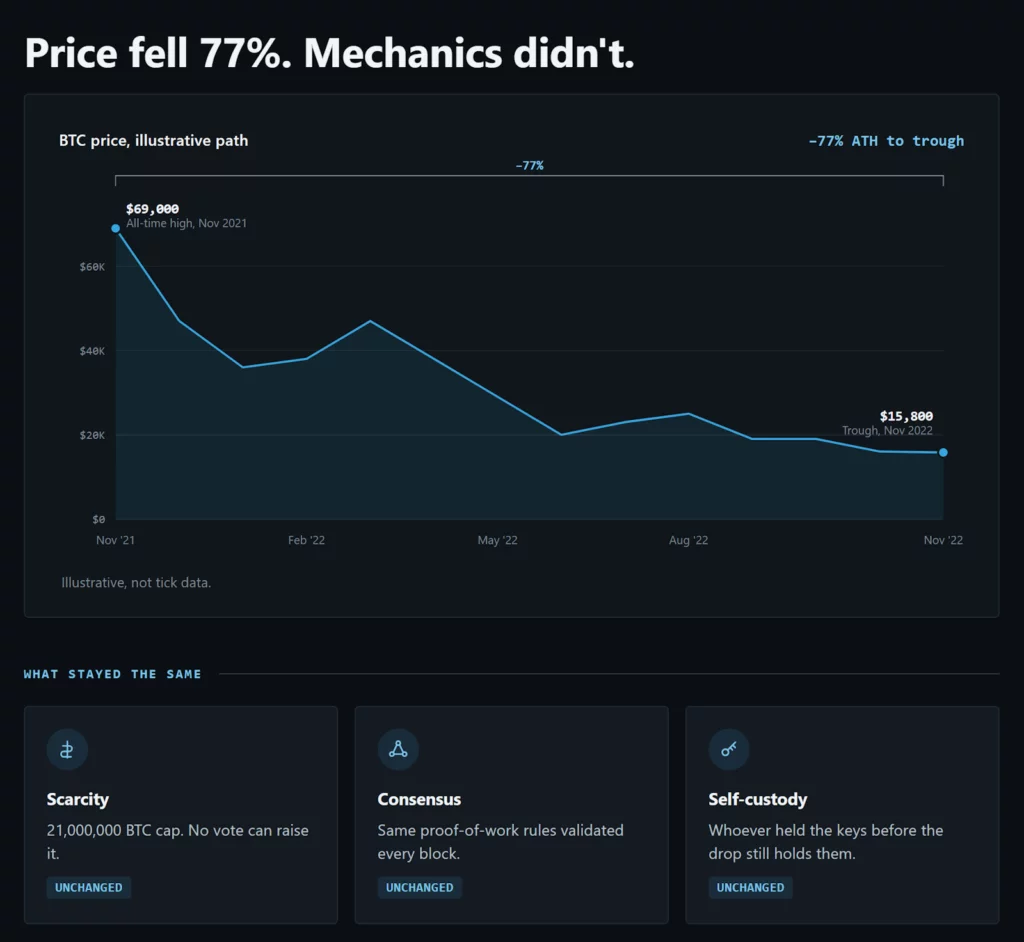
What separates a Bitcoin book worth reading in 2026 from the rest?
A Bitcoin book earns a place on this list by explaining the system, not just narrating the price.
Three ideas recur across every title here, so it’s worth defining them once. Scarcity, in Bitcoin’s case, means a hard-coded issuance schedule that halves the new-coin reward roughly every four years until the total supply approaches 21 million, a fixed ceiling no central authority can vote to raise. Consensus is how a network of independent computers agrees on which transactions are valid and in what order, without a central party adjudicating disputes; Bitcoin does this through proof-of-work, where miners compete to solve a computational puzzle, and the winner adds the next block. Self-custody is about who actually controls the private keys, held by the owner rather than parked with an exchange, and it’s the line between truly owning bitcoin and merely owning a claim on bitcoin that someone else controls.
A book that skips these and goes straight to price targets or trading setups isn’t one of the best bitcoin books in any meaningful sense. It’s market commentary with a Bitcoin logo on it. Among cryptocurrency books generally, the ones that hold up are the ones built around scarcity, consensus, and custody, not around a ticker. The six Bitcoin books below don’t skip any of the three.
The top crypto books to read in 2026
| Rank | Book | Author | Best For | Level |
|---|---|---|---|---|
| 1 | Why Crypto? | Heidi Chakos | Building the full picture, from fiat’s flaws to Bitcoin’s mechanics | Beginner/Intermediate |
| 2 | The Bitcoin Standard | Saifedean Ammous | The monetary-history case for a fixed supply | Intermediate |
| 3 | Mastering Bitcoin | Andreas M. Antonopoulos | Verifying how the protocol actually works, at the code level | Advanced |
| 4 | The Blocksize War | Jonathan Bier | Understanding how Bitcoin’s own rules get decided | Intermediate |
| 5 | Digital Gold | Nathaniel Popper | The people and events behind Bitcoin’s first decade | Beginner/Intermediate |
| 6 | Layered Money | Nik Bhatia | Placing Bitcoin inside the existing monetary system, not outside it | Intermediate |
1. Why Crypto? by Heidi Chakos
Why Crypto? is built for the reader this list is written for: someone who has watched Bitcoin’s price for years and never gotten a straight answer on what they were actually watching. Chakos starts with fiat currency: how it loses purchasing power over time and what that erosion has cost savers across market cycles, before a single blockchain term appears. From there, the book moves into Bitcoin’s origins, then blockchain mechanics and consensus explained in plain language, then tokenomics, stablecoins, and lending, and closes on regulation and risk instead of treating them as an afterthought.

The chapter on consensus mechanisms is the one readers cite most often, because it explains proof-of-work without either oversimplifying it into a slogan or burying it in cryptography. The closing chapters do the same for risk: security failures, regulatory uncertainty, and volatility get covered directly, not waved off. That combination of plain language on the mechanics and honesty on the downside is why it holds the top spot on this list of the top crypto books to read in 2026. It’s available now as her book, Why Crypto?, in paperback, ebook, and audiobook.
2. The Bitcoin Standard by Saifedean Ammous
Ammous traces the concept of “hard money,” currency that’s difficult to debase, from seashells and gold through to Bitcoin’s fixed 21-million-coin supply. For a reader whose only reference point for scarcity is a price chart, this book supplies the centuries of monetary history that make the 21 million figure meaningful instead of arbitrary.
3. Mastering Bitcoin by Andreas M. Antonopoulos
This is the book for readers who want to verify, not take on faith, how Bitcoin works. Antonopoulos covers wallets, private keys, mining, and the protocol layer at the level of code, which is the only way to actually confirm what a blockchain does rather than what a headline says it does.
4. The Blocksize War by Jonathan Bier
Bier documents the 2015-2017 fight over how big a Bitcoin block should be, a technical dispute that split the community and produced a hard fork. It’s the clearest illustration on this list of a fact price charts never show: Bitcoin’s rules aren’t fixed by decree; they’re fought over and negotiated by the people who run the software.
5. Digital Gold by Nathaniel Popper
A financial journalist’s account of Bitcoin’s first several years: the early adopters, the failures, and the personalities who kept building through both. It’s useful precisely because it isn’t instructional: it shows the system’s founding moments instead of arguing for them, which gives context the more technical books on this list assume you already have.
6. Layered Money by Nik Bhatia
Bhatia maps how money has always existed in layers: gold, then paper claims on gold, then bank deposits, then central bank reserves. He places Bitcoin as a new base layer within that structure, rather than as something wholly outside it. For a reader trying to understand where Bitcoin actually sits relative to the dollar system, this is the book that draws the map.
Which Bitcoin book should someone start with?
Start from what you’re actually missing, not from the ranking above.
- Never gotten the full picture, from fiat to blockchain to risk: start with Why Crypto?, which is built to be read start to finish by someone with no prior background.
- Want the monetary-history case for scarcity: read The Bitcoin Standard next.
- Want to verify the technical claims yourself: go straight to Mastering Bitcoin.
- Want to understand how Bitcoin’s own rules get changed, or don’t: read The Blocksize War.
- Want the human story before the technical one: read Digital Gold.
- Want to see where Bitcoin fits against the dollar system: close with Layered Money.
About the author
Based in Dubai, Heidi Chakos has spent close to a decade building CryptoTips, her crypto and macro-focused YouTube channel, into one with hundreds of thousands of subscribers, plus a following on X, since co-founding it in 2016. Why Crypto? is her debut book, built on the same explain-the-mechanics-first approach that’s shaped her channel throughout.
Where to go after the book
Most readers hit the same wall right after the last page: the book explains how Bitcoin works, but holding it yourself, checking a token’s real supply schedule, or reading a project’s incentives instead of its marketing takes practice a book alone can’t give you. That’s the specific gap LearningCrypto is built to close, with structured lessons on self-custody, tokenomics, and risk management from the CryptoTips team that start exactly where the reading leaves off. If this list left you wanting to go past the charts and into the mechanics yourself, learningcrypto.com is a reasonable next stop.
Disclosure: This content is provided by a third party. Neither crypto.news nor the author of this article endorses any product mentioned on this page. Users should conduct their own research before taking any action related to the company.

NBC Sports Philadelphia weighing adding courtside voice for Sixers after LeBron James arrival

Banning Open-Source AI Models to Protect Our Cybersecurity May Do the Opposite

5 Habits Para Maging Wais Sa Pera : Paano Maging Financial Literate?


-

 Fashion6 days ago
Weekend Open Thread: Brooks Brothers
-
 Sports4 days ago
Commonwealth Games boxing: Jadumani Singh seals dominant 5-0 win over Pakistan’s Sumama Rehman to enter quarter-finals | Commonwealth Games News
-

 Business1 day ago
Why Trees Belong on the Risk Register
-

 Tech4 days ago
Intel is reversing course and bringing hyper-threading back to its server chips
-

 Crypto World5 days ago
Ripple bought a bank in pieces. The $4 billion audit
-

 Politics4 days ago
Luke Littler dismantles Gerwyn Price to retain title in Blackpool
-
 Entertainment6 days ago
A New Post-Apocalyptic Gundam Anime Series Blasts Into SDCC
-

 Politics3 days ago
The Part of the Electric Transition Nobody Wants to Discuss
-

 News Videos4 days ago
BITCOIN JUST ENTERED THIS CRITICAL ZONE…
-

 Sports7 days ago
2026 3M Open leaderboard: Scottie Scheffler finds putter in Round 1, sits three back
-

 Fashion7 days ago
16 Dresses for the High Summer Event
-

 Business2 days ago
Major shareholder moves on Canyon
-

 Crypto World5 days ago
XRP Ledger adds $2.6B as RWA inflows rank second
-

 Politics5 days ago
Spain sweeps the board at 2026 World Cup with individual awards
-

 News Videos14 hours ago
Bitcoin Enters the 3rd Stage of the Bear Market
-
 Entertainment2 days ago
‘Stargate’ Creator’s New Sci-Fi Series Returns for Season 3 Tomorrow
-

 Entertainment5 days ago
Sara Gilson Killed By Husband After Viral “Pedophile” TikTok Video
-

 Tech6 days ago
Anthropic launches Claude Opus 5, a cheaper AI model for coding, agents and enterprise workflows
-

 Crypto World2 days ago
Kraken Enables Retail Access to Jersey Mike’s IPO via Tokenized Shares
-

 News Videos2 days ago
Claude: Build Financial Dashboards in Minutes (2026)
You must be logged in to post a comment Login