
Crypto World
TIPS challenge the inflation story behind rising bond yields

Key points:
- Bond yields have been going up since the beginning of the Iran war, widely attributed to inflation expectations due to energy prices
- However, the five-year inflation expectation priced into Treasury Inflation-Protected Securities is 2.2% and trending down since May
- The driver appears to be rising real yields with bearish implications for yield-free assets like Bitcoin
Continuation of Q2 bond selling
After yields reached local lows in early March, US government debt has been undergoing a multi-month sell-off. This week, after the most recent meeting of the Federal Open Market Committee (FOMC), 30-year Treasury yields made headlines by reaching the highest level since 2007.
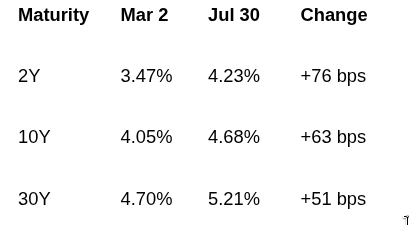
In line with the two-year yield rising 76 basis points (bps) in this window, a September rate hike by the Federal Reserve is priced into the markets at 63%, according to CME FedWatch.
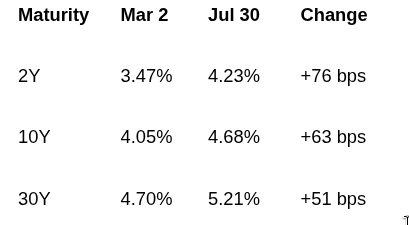
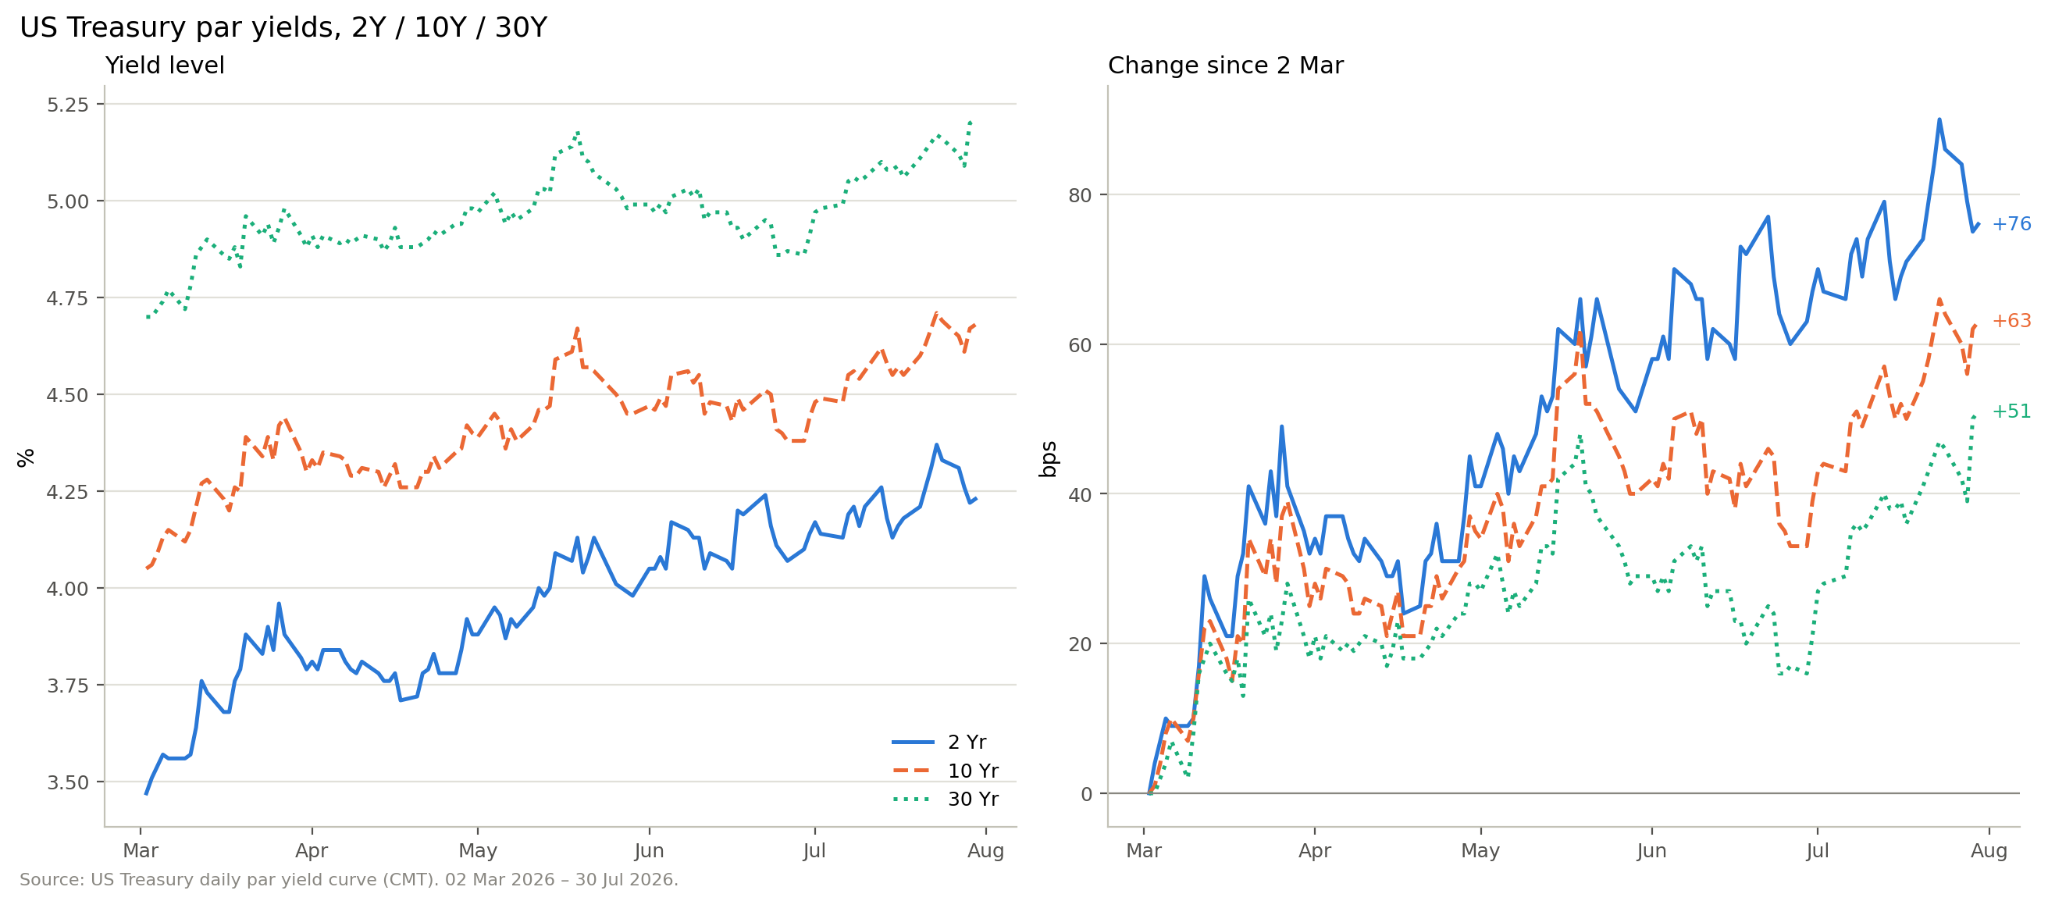
2Y, 10Y and 30Y US Treasury Yields. Data Source: Treasury.gov
With rates at these elevated levels, government bond investments are, for the first time since 2019, more profitable than cash-and-carry trades in the crypto markets, as per Glassnode’s latest research.
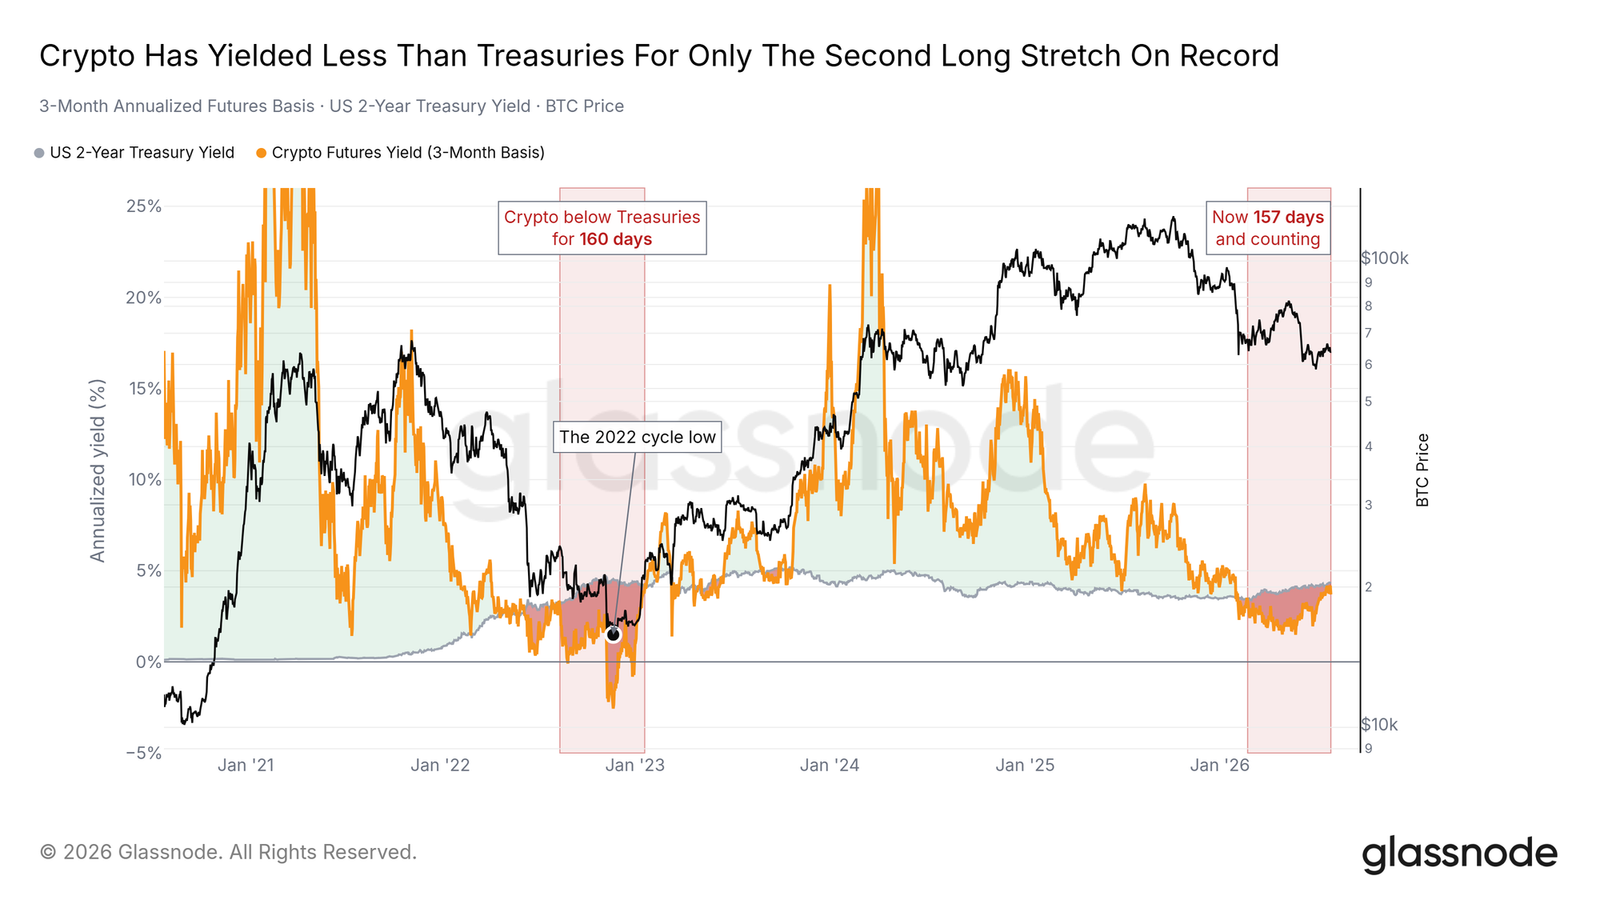
2Y US Treasury yield and crypto futures carry trade. Source: Glassnode
The mainstream inflation narrative
The reason for the bond sell-off is commonly taken to be the inflationary pressures from higher commodity and energy prices. The multi-month bond sell-off coincides with the start of the Iran war and resulting closure of the Strait of Hormuz. Furthermore, the daily closes of the two-year US government bond yield, West Texas Intermediate (WTI) and Brent Crude have correlated since March at a coefficient of r=0.44:
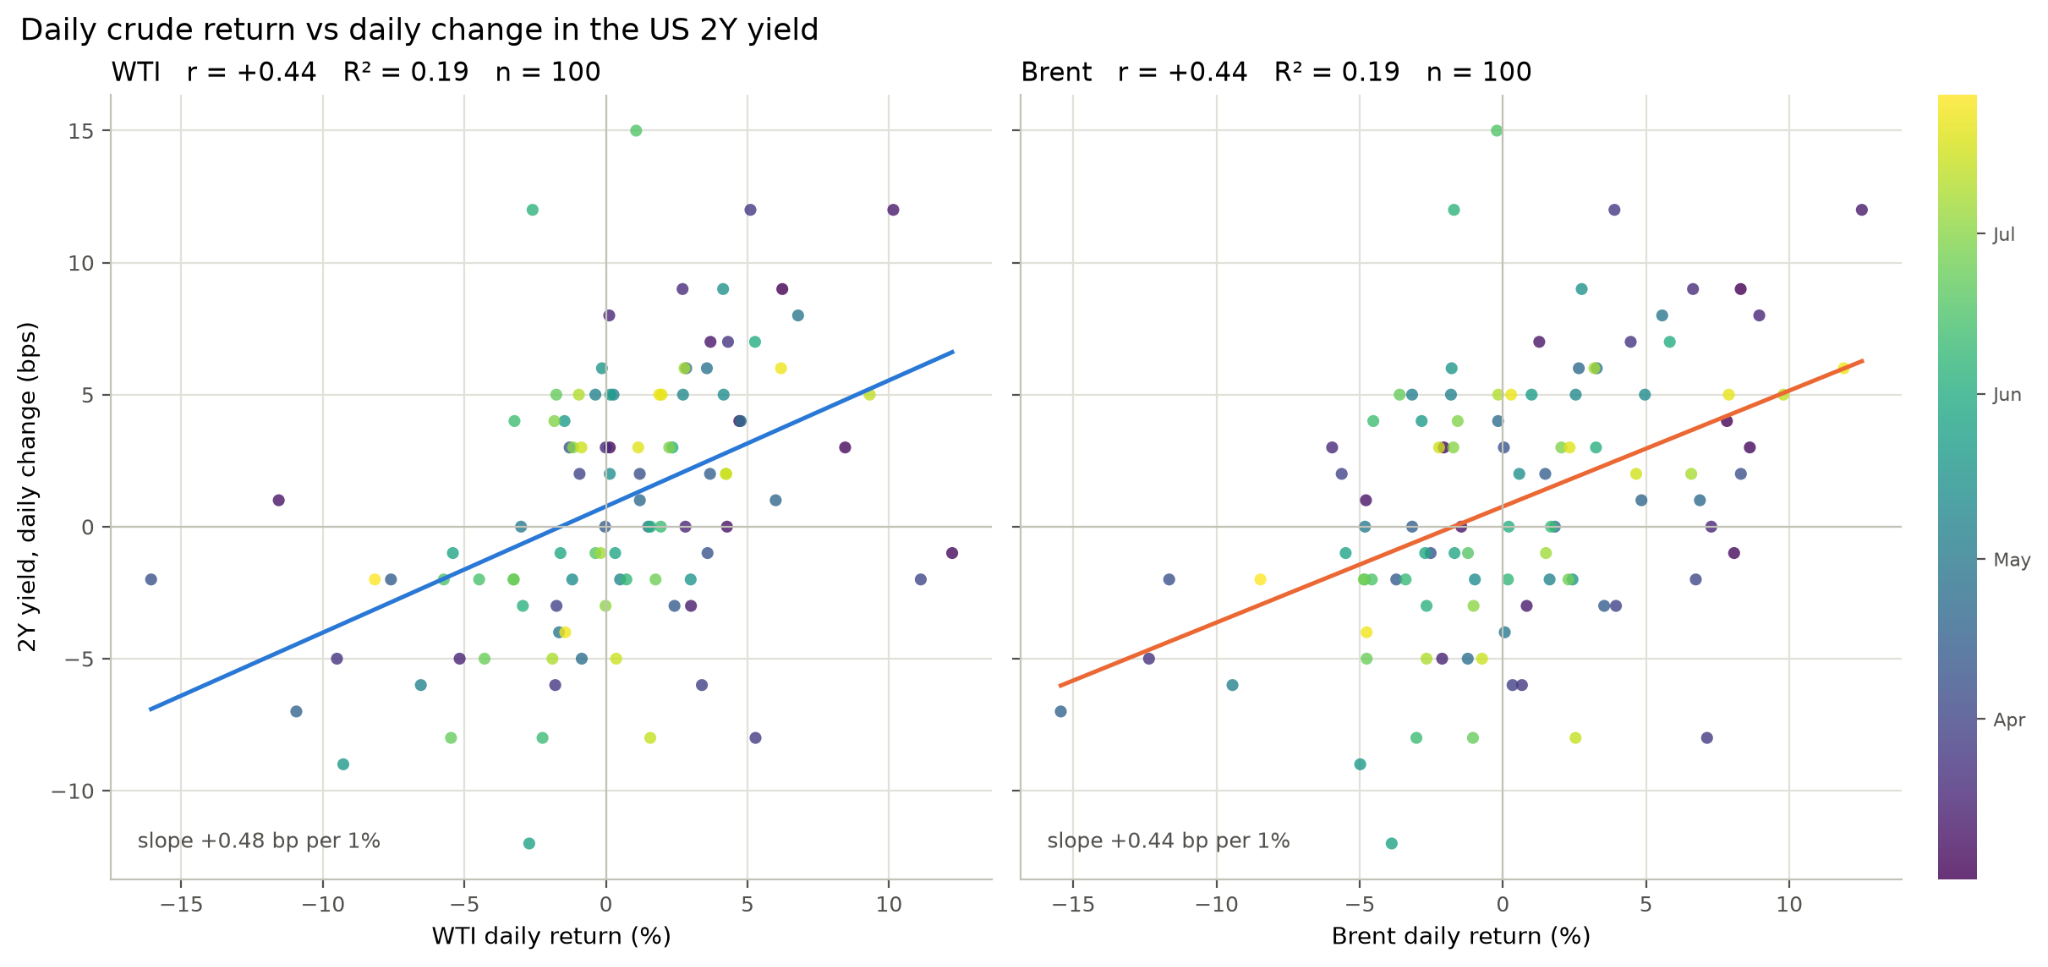
Daily closes of WTI and Brent Crude against 2Y Yield. Data Sources: fred.stlouisfed.org, EIA
WTI briefly rose once again above $85 a barrel on Thursday after President Donald Trump threatened Iran and bonds sold off leading into the FOMC. Nothing about the conflict suggests a near-term resolution, which has led some to argue that higher rates are being caused by inflation expectations.
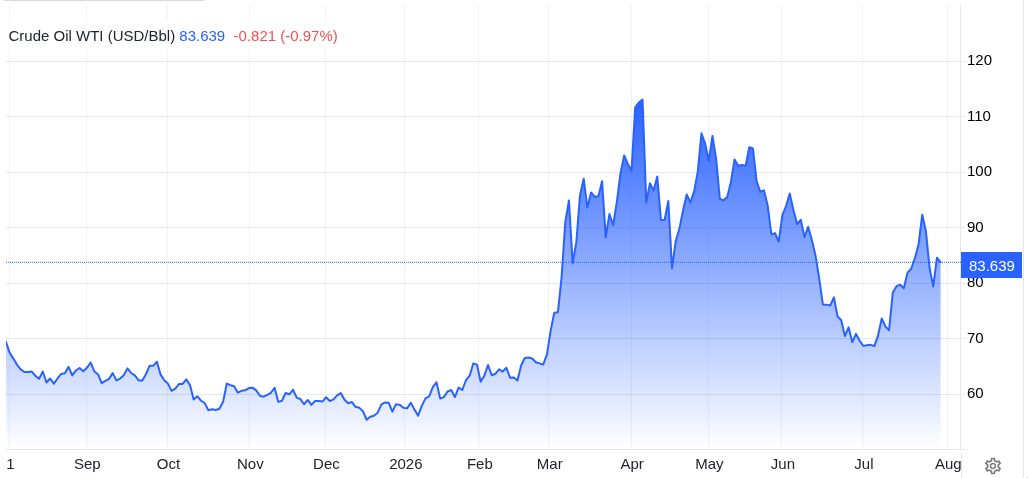
WTI (West Texas Intermediate) oil price chart. Source: Tradingeconomics.com
This has driven loud inflation scares through the mainstream financial press, with recent Bloomberg headlines, such as “Global Bonds Are Reeling as Oil Surge Rekindles Inflation Threat”, “US Yields Hit Two-Month High as Oil Sparks Inflation Risk” or “Global Bond Selloff Worsens as Rising Oil Prices Spook Investors”. Among the ever-inflation-aware crypto and precious metals audience, this narrative is popular, too:
Market commentator and Bitcoin influencer The Wolf of All Streets recently posted on X:
However, the way other Treasury securities trade does not support the inflation-driven narrative for bond yields.
TIPS say rate rises are ‘real’
While most analysts and commentators focus on regular Treasury yields for their analysis, Treasury Inflation-Protected Securities, or TIPS, have offered clear signs against the inflation narrative.
A Treasury Inflation-Protected Security (TIPS) is an ordinary treasury bond for which the principal payment is adjusted upward in line with the Consumer Price Index for All Urban Consumers (CPI-U). In addition to the inflation-protected principal, each TIPS carries a fixed coupon rate. Thus, unlike for a regular bond, both principal and interest payments are inflation-adjusted.
By comparing the yield of a TIPS with a regular, equally dated Treasury, the expectation of future CPI inflation can be estimated as the so-called breakeven rate. And although Treasury yields have been rising, the five-year breakeven rate has gone down sharply since May.
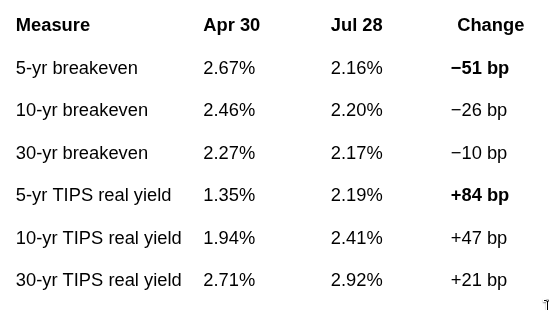
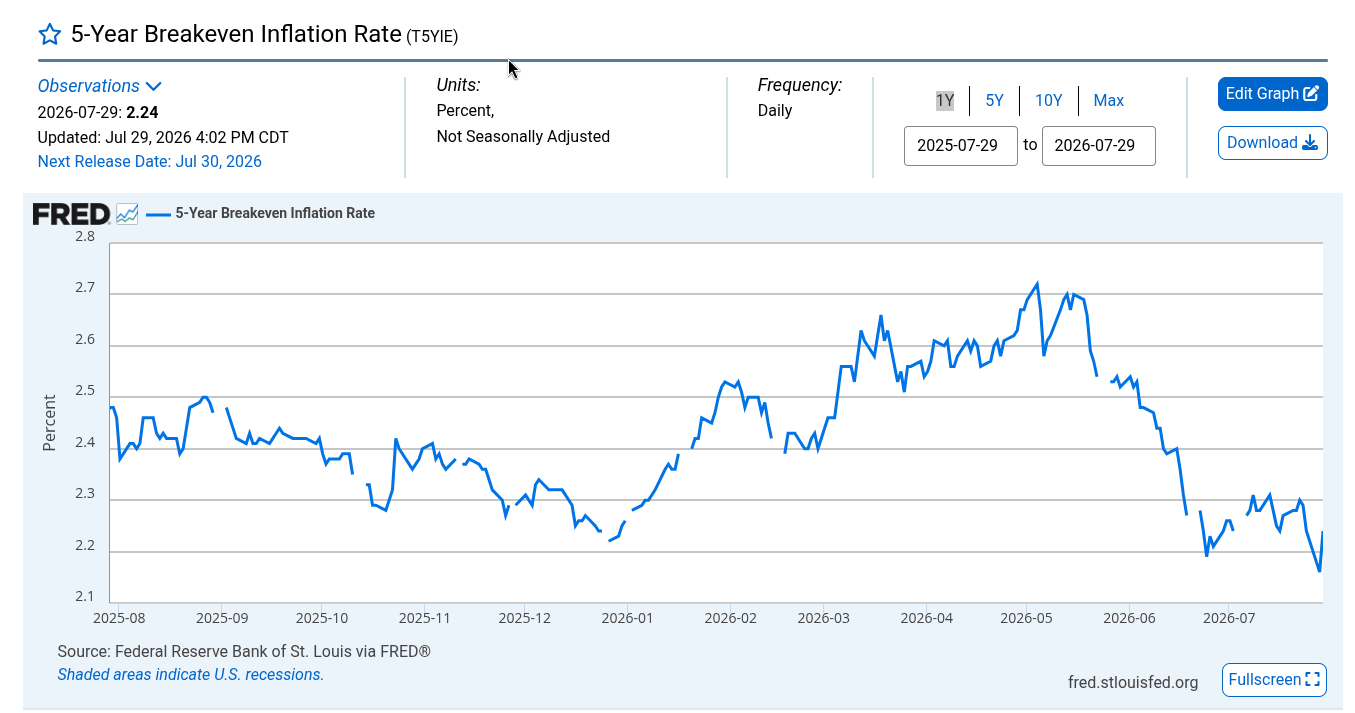
Five-year breakeven inflation rate. Source: fred.stlouisfed.org
At roughly 2.2%, the five-year breakeven expects the Fed to achieve its 2% target in the medium term. However, more telling is that the breakeven rate has been moving in the opposite direction to the nominal treasury yields.
While the five-year nominal yield rose 33 bps, TIPS data suggests this was the result of an 84 bps rise in the real yield, partially offset by a 51 bps decline in expected inflation. While the inflation narrative remains a compelling story, the marketplace says otherwise. The real story ought to be a rise in real yields.
What it may mean for crypto
Generally, rising “real” investment returns on bonds and stocks in terms of CPI make non-yielding assets such as Bitcoin relatively less attractive to certain investors. Beyond this, the impact on the crypto market depends on the explanation for higher real rates, of which several are available.
Reserve liquidation — No clear impact on Crypto. Higher oil prices widen trade deficits for Asian energy importers. As oil is generally priced and settled in US dollars, shortages in the local eurodollar markets in Asia have occurred, which has put their exchange rates under pressure. The Japanese yen (JPY), Philippine peso (PHP) and Indian rupee (RBI) have all required central bank intervention to defend their exchange rates. As these measures are funded by the sale of US Treasury reserves, this puts upward pressure on bond yields. HSBC’s Frederic Neumann is on record attributing the bond sell-off to FX pressure rather than a verdict on the dollar.
Demand destruction — Bearish for Crypto. An oil shock that persists long enough stops being inflationary and starts triggering a recession. Neuberger Berman argued in its second-quarter outlook that investors are underpricing the hit to output from sustained energy prices. The credit contraction that coincides with a recession would be bad for equities and Bitcoin by severely restricting liquidity. In a real sign of recessionary credit events, credit spreads are expected to widen. Cointelegraph reported on possible first signs of this on Wednesday.
Related: Cost to insure AI debt reaches record high amid Asian semiconductor tumble
Investment demand — Likely bearish for Crypto. Real rates may have also responded to expected growth and the demand for capital from the AI sector. Government bond issuance is increasingly competing with the record issuance of corporate bonds from AI hyperscalers. Goldman Sachs Research projects roughly $755 billion of AI capex in 2026 and about $920 billion in 2027. UBS has raised its 2026 investment-grade issuance forecast to $1.8 trillion, with technology supply lifted to $360 billion on hyperscaler guidance. As crypto is competing for a similar pool of capital and investor cohort, this is likely to suppress the sector.



Uniswap has launched Earn, a self-custodial lending product that allows users to deposit USDC, USDT, and ETH into Morpho vaults without leaving its app.
Summary
- Earn is live on the Ethereum mainnet through the Uniswap Web App and Wallet.
- Deposits enter Morpho lending vaults curated by Gauntlet, where borrower interest generates user yield.
- Uniswap charges no additional Earn fee, although users must pay Ethereum network costs.
- UNI traded near $4.30, down about 2.8% over 24 hours but up 12% for the week.
Uniswap Earn supports USDC, USDT and ETH
Earn is available through the Uniswap Web App and Wallet, extending the platform beyond token swaps and liquidity provision into onchain lending.
Users can select a supported asset, choose an amount and authorize the deposit with one signature. Deposits then earn interest paid by borrowers across lending markets selected by the underlying vault.
USDC, USDT and ETH are supported at launch, with all three vaults operating on Ethereum mainnet. Users can withdraw at any time because the product has no mandatory lockup or cooldown period, according to Uniswap’s launch announcement.
Uniswap does not charge a separate fee for using Earn. However, depositors remain responsible for standard Ethereum transaction costs, which can make smaller positions less economical when network fees rise.
Deposits appear alongside users’ other assets in the Uniswap portfolio interface. The dashboard displays the amount deposited, the current yield rate and total earnings, while recording deposits and withdrawals in the account’s activity history.
Morpho and Gauntlet manage the lending infrastructure
Morpho supplies the permissionless lending infrastructure behind Earn, while Gauntlet curates the vaults and determines how deposits are distributed across eligible markets.
Vault curation can reduce the need for depositors to compare individual lending pools, collateral types, and utilization rates. Gauntlet can set exposure limits and rebalance capital as market conditions change, but depositors still carry the risks associated with those allocation decisions.
Morpho currently reports about $11.79 billion in deposits and $4.15 billion in active loans across its network. The protocol previously said deposits increased from $5 billion at the beginning of 2025 to $13 billion by the end of that year’s third quarter.
Active loans rose from $1.9 billion to $4.5 billion over the same period. Annualized interest paid to Morpho lenders reached $227 million in 2025, representing a 400% increase from 2024, according to Morpho’s annual review.
Earn broadens Uniswap beyond token swaps
Earn gives Uniswap another way to retain users between trades. Instead of transferring unused stablecoins or ETH to a separate lending protocol, users can now access lending vaults through the same interface used for swaps and portfolio tracking.
The integration places Uniswap in closer competition with established lending platforms such as Aave and Compound. Its main distribution advantage is an existing base of traders who can move from swapping to lending without navigating to another application.
For US users, Earn is an onchain lending service rather than a bank savings account. Deposits do not carry FDIC insurance, and self-custody does not remove smart contract, collateral, liquidity, or stablecoin risks.
Vault yields are also variable. Rates can fall when lender deposits grow faster than borrowing demand, meaning the displayed annual percentage yield is not guaranteed for the duration of a deposit.
UNI price shows limited reaction to Earn launch
UNI traded near $4.30 at the time of writing, declining approximately 2.8% over the previous 24 hours. The token remained up about 12% over seven days.
Its market capitalization stood near $2.68 billion, while 24-hour trading volume reached roughly $376 million. The latest move does not establish a direct link between the Earn announcement and UNI’s price performance.
Adoption will depend on the yields offered by the Gauntlet-curated vaults, Ethereum transaction costs, and users’ willingness to accept lending-market risks. Uniswap has not announced that Earn revenue will flow directly to UNI holders, making deposits and user retention the main metrics to watch initially.

A new study from the Bank of Italy challenges a common assumption about stablecoins in cross-border payments: using stablecoin transfers for remittances may not automatically deliver better economics or faster delivery than established payment rails once the full cost chain is considered.
Researchers evaluated 200 remittances denominated in USDC across 10 bidirectional payment corridors connecting Italy with Brazil, Argentina, Japan, the United Arab Emirates and South Africa. They compared end-to-end fees and settlement times against traditional remittance services, concluding that most expenses and delays were driven by fiat on- and off-ramp frictions rather than by blockchain execution itself.
Key takeaways
- In the tested corridors, exchange and currency-conversion charges made up the majority of total remittance cost, while blockchain transaction fees were only a small portion.
- Total stablecoin remittance costs ranged from 0.3% to nearly 9%, depending on the corridor, while settlement time was typically under 20 minutes where instant payment systems were available.
- Compared with the World Bank’s global average remittance cost benchmark of 6.65%, stablecoin transfers were cheaper in most corridors—but were cheaper than Wise in only three out of seven comparable corridors.
- The study argues that improvements to domestic instant payment infrastructure and reduced reliance on reconversion into fiat are likely to matter more than blockchain technology alone.
- Regulatory design strongly influences where stablecoin users transact, with overly restrictive regimes potentially pushing activity toward offshore or unregulated channels.
Stablecoin remittances: where the cost really comes from
The Bank of Italy study tested 200 USDC remittance flows across 10 corridors, designed to capture realistic friction across payment paths between Italy and several major regions. The researchers focused on the full journey—from conversion and routing through the on- and off-ramps used to turn fiat into stablecoins and back again—then compared results to traditional remittance offerings.
According to the report, the largest share of costs came from exchange fees and currency conversion. Blockchain fees represented only a small fraction of the total remittance cost, undermining the idea that “using a blockchain” by itself will guarantee cheaper transfers. In other words, even if the stablecoin transfer settles quickly on-chain, the conversion steps required to deliver value in the recipient’s usable currency can dominate the bill.
On the cost range observed in the experiment, total stablecoin remittance costs varied sharply by corridor—from as low as 0.3% to nearly 9%. That variability matters for investors and payment operators because it suggests that stablecoin remittance performance is not uniform; it depends heavily on the local availability and pricing of payment infrastructure and conversion services.
Speed depends on local payment rails, not just settlement time
The study also measured settlement times end-to-end. For stablecoin remittances, transfer settlement was reported as less than 20 minutes in corridors where instant payment systems were available. In corridors without those systems, settlement took one to two business days.
This finding is consistent with the broader logic of cross-border payments: on-chain settlement can be quick, but delivery is constrained by the speed of off-chain steps—such as how quickly funds can be credited to accounts after the stablecoin leg is completed. For users, that means stablecoins may improve speed only when the surrounding payment ecosystem can match the speed of the blockchain component.
How stablecoins compare to global benchmarks and mainstream providers
To contextualize the results, the Bank of Italy report used the World Bank’s global average remittance cost of 6.65% as a reference point. Against that benchmark, the stablecoin corridors examined were cheaper in most cases. However, the study’s comparison to major providers was more nuanced.
The report found that stablecoin transfers were less expensive than Wise in only three of seven comparable corridors. That asymmetry is important: it indicates that stablecoin-based remittances may undercut some traditional options in certain routes, but they do not consistently outperform competitive incumbents across the board.
For traders and builders watching stablecoin adoption, the implication is clear: performance will likely be route-specific until the conversion and settlement ecosystem improves. Stablecoin rails can reduce certain types of friction, but in practice they must be integrated into efficient on- and off-ramp systems to translate into sustained advantage.
Infrastructure investment and spending stablecoins directly
While the study found that blockchain transaction fees were not the primary cost driver, it argued that strategic investment in domestic instant payment infrastructure could improve the competitiveness of stablecoin-based cross-border payments. The authors emphasized that settlement speed depended heavily on the quality of local payment rails—so improving the “last mile” (and the corresponding conversion processes) is likely to yield the biggest gains.
The report also highlighted a structural bottleneck: stablecoins currently often require reconversion into local fiat to be usable by recipients. It suggested that meaningful economic advantages would increase if stablecoins could be spent directly in the real economy.
If stablecoins could be spent directly in the real economy, for goods and services, rents, or school fees, without reconversion into local fiat currency, the economic advantages of stablecoin-based transfers would be substantially higher.
Regulation: efficiency can improve or unravel depending on design
Beyond infrastructure and market mechanics, the study argued that regulatory design shapes remittance efficiency. In the Bank of Italy’s framing, prohibitionist regimes have not eliminated stablecoin demand; instead, they can redirect usage toward offshore platforms and other unregulated channels. Conversely, overly restrictive frameworks may increase operational complexity for retail users, potentially offsetting any intended consumer protections.
The study arrives as major jurisdictions tighten or implement frameworks for crypto assets and stablecoins. The European Union has implemented its Markets in Crypto-Assets (MiCA) framework, and the United States enacted the GENIUS Act, which is intended to govern payment stablecoins. As these regimes take effect, the balance between compliance, accessibility, and the availability of regulated fiat on- and off-ramps may directly affect real-world remittance outcomes.
The broader stablecoin market context also matters. DefiLlama data cited in the article places stablecoin supply at about $307 billion, up roughly 16% over the past year. That growth underscores why policymakers and payment providers are focused on the operational and regulatory details—especially where remittances are concerned.
What to watch next is whether regulatory changes and domestic payment infrastructure upgrades reduce the conversion frictions that the Bank of Italy study identifies as the dominant cost and timing drivers. If stablecoin usage increasingly shifts toward corridors with strong instant payment rails and if more “spendable” pathways emerge, the potential for stablecoins to outperform traditional remittance services may become clearer—and more consistent across routes.

Cardano was up by 4% over the past 24 hours after a few choppy sessions earlier in the week. The crypto asset climbed from around $0.164 to above $0.17. The latest uptick has pushed its monthly gains to around 12%.
Amidst improving price structure, new data suggests that ADA may be entering a different phase.
Buyers Hold Their Ground
Pseudonymous analyst ‘The Boss’ said ADA may be moving from panic-driven selling toward a more constructive accumulation phase after an aggressive sell-off. The analysis pointed to higher lows in recent trading sessions rather than new breakdowns.
According to The Boss, buyers have continued to defend a major demand zone of $0.1064-$0.1503, while a short-term ascending trendline is keeping the recovery structure intact. The crypto asset is also compressing below overhead resistance, which indicates the market is looking for its next directional move rather than extending the earlier decline, the analyst explained.
Now the focus remains on whether the developing base can turn into a broader recovery. Holding current support and maintaining higher lows would strengthen the accumulation narrative and improve the overall market structure.
Further adding to the bullish case, whale activity has also picked up. CryptoPotato recently reported that large ADA holders increased their combined holdings to 25.6 billion tokens, which is nearly 70% of the circulating supply and the highest level since February 2023.
Retail exposure, meanwhile, declined, a mix that Santiment said could support the asset. Analyst Ali Martinez found that whales had accumulated 30 million ADA, which is worth more than $5 million, over the previous month. The renewed buying suggests larger investors may be positioning for another move higher.
Meanwhile, institutional interest also appears to be holding up. Recent data from Blockworks revealed that Cardano ETFs have now posted 16 straight months of net inflows.
Bigger Picture
For some market watchers, ADA’s historical performance remains a reason for worry. One market watcher highlighted the token’s poor long-term performance, while arguing that a $10,000 investment made at its all-time high five years ago would now be around $500.
The post also said that Cardano has fallen roughly 84% since Trump mentioned it in March 2025 as part of a proposed US Strategic Crypto Reserve. From its August 2021 all-time high, the token remains down about 95%.
Despite those numbers, Charles Hoskinson remains positive about the ecosystem’s future. The founder recently compared its approach to Anthropic’s rise in AI, and said that the company leapfrogged Google and OpenAI not by moving faster, but by having the “right mindset.”
Hoskinson said Cardano is seeing a similar shift, as developers and investors are placing greater importance on security and governance. He also pointed to recent DeFi incidents to highlight how quickly vulnerabilities can affect the wider ecosystem.
He said lasting stability requires clear governance, a strong software development process and a sustainable roadmap. While acknowledging Cardano’s past mistakes, Hoskinson said he is “happy” with where the ecosystem stands and expects strong growth over the next 12 to 24 months.
The post Is Cardano (ADA) Finally Shifting From Sell-Off to Accumulation? appeared first on CryptoPotato.
Crypto World
Trump Administration Amps Up Pressure On Senate To Confirm Todd Blanche As Attorney General

The Trump Administration’s renewed pressure on the Senate to push through Blanche’s confirmation comes a day after the President indicated he might pull the nomination.
“I have no objection to temporarily withdrawing Todd’s name, if they do not do the right thing, and putting him back after Cornyn and Tillis are out of office,” Trump said in a Truth Social post on Thursday, referring to the two Republican holdouts.
During his Cabinet meeting at Camp David on Friday, Trump said of Cornyn threatening to pull his support of Blanche: “I don’t really blame him, to be honest with you.”
“I endorsed his opponent,” Trump said. “The man that lost, the man that I didn’t endorse, has become very angry, and that’s ok.”
“I mean, I understand that,” he continued. “I probably would do the same thing.”
Crypto World
Roblox Stock Sinks Nearly 14% After-Hours as New Child Safety Measures Weigh on Outlook
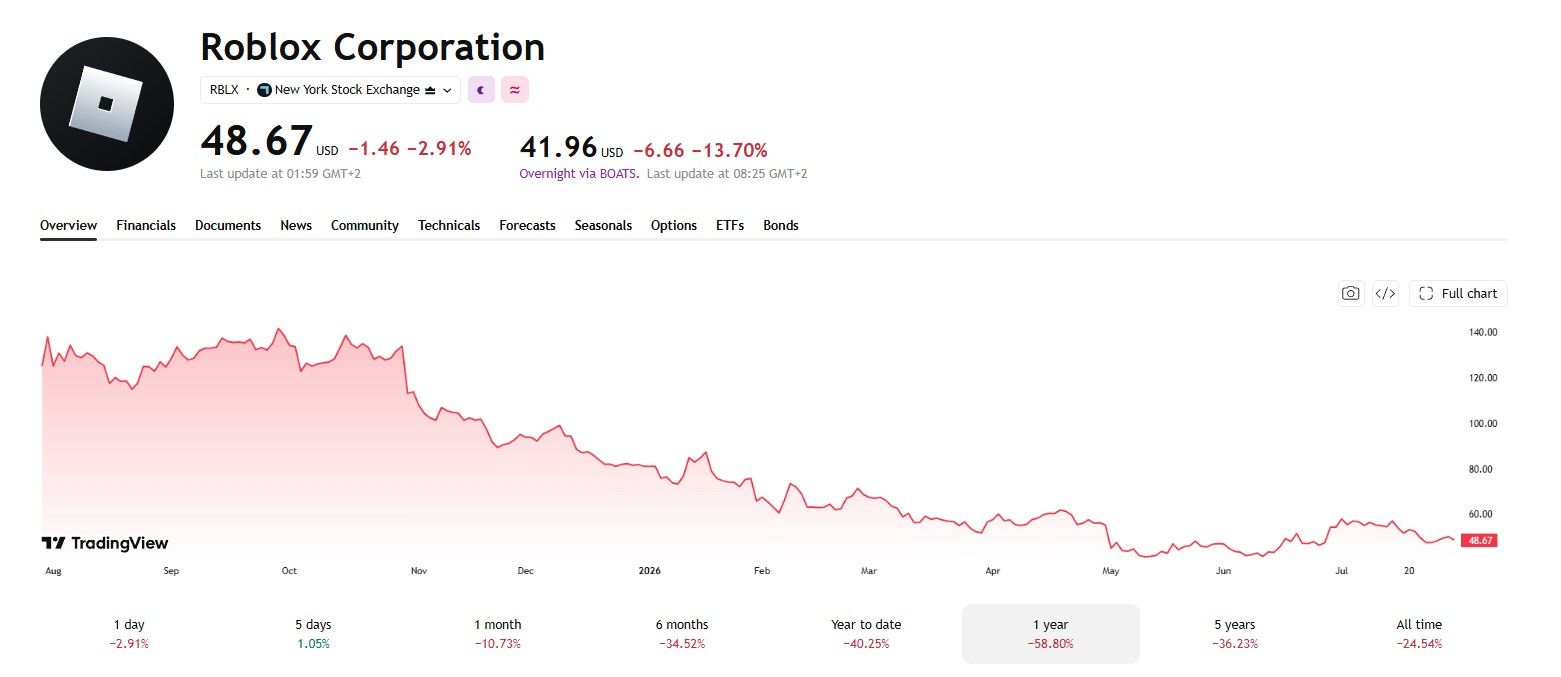
Roblox stock tumbled nearly 14% in after-hours trading on Thursday, sliding toward $41.80. The gaming platform missed Wall Street revenue targets and issued weak guidance for the third quarter.
The drop erased optimism from a 36% year-over-year revenue increase. Investors instead focused on slowing user growth and a bookings forecast far below consensus.
Child Safety Rules Slow Roblox’s Growth Engine
Roblox reported average daily active users of 123 million, up 10% year-over-year. That fell short of the roughly 128 million analysts expected. Average monthly unique payers reached 27 million, also up 15% year-over-year, per the company’s supplemental materials.

That payer growth marks a sharp deceleration, however. Monthly unique payer growth ran as high as 94% year-over-year just two quarters earlier.
Mandatory age verification and new parental control tiers have since taken hold. Average bookings per payer held steady near $19.25, so the slowdown shows up in new payer counts, not in existing spending habits.
Executives linked the slowdown directly to those safety changes. Age-check penetration reached 57% of users globally, with Australia near 80% and the United States and United Kingdom around 70%. The rollout coincided with a discovery algorithm shift that favors long-term retention over immediate spending. That change hit monetization hardest among players under 13.
The pattern mirrors a wider trend this year, as big tech selloffs periodically dragged crypto sentiment lower. Meanwhile, the Nasdaq’s rising correlation with risk assets keeps growing. A stumble at a platform this large rarely stays contained to one sector.

Weak Bookings Guidance Overshadows the Beat
Bookings, Roblox’s preferred spending measure, grew just 8% year-over-year to $1.6 billion. That growth rate ran as high as 63% just two quarters earlier and 70% the quarter before that. The deceleration landed bookings at the low end of guidance. For the third quarter, Roblox forecast bookings between $1.58 billion and $1.65 billion. That trails the roughly $1.87 billion analysts had modeled.

Adjusted losses of 26 cents per share nonetheless beat estimates, and free cash flow rose 66% to $294 million. Founder and chief executive David Baszucki framed the results as part of a longer transition.
We remain steadfast in our goal to capture 10% of the global gaming market.
Baszucki said on the earnings call.
Roblox’s report lands amid a broader wave of disappointing Big Tech guidance this earnings season. Meta stock tumbled sharply last quarter despite beating estimates, after its spending outlook rattled investors. Regulators are tightening the same age verification rules that pressured Roblox. The European Union is also closing a VPN age verification loophole that lets minors bypass similar checks elsewhere. Roblox now joins a growing list of earnings reports to watch this season as guidance cuts outweigh headline beats.
Whether Roblox’s safety-first bet pays off with steadier long-term monetization remains unclear. As a result, shareholders will watch the September quarter closely for signs that bookings have stopped sliding.
The post Roblox Stock Sinks Nearly 14% After-Hours as New Child Safety Measures Weigh on Outlook appeared first on BeInCrypto.
The largest BTC wallets, aka the Bitcoin whales, started buying in late July. And a $233 million institutional inflow followed days later, a sequence that put big money on the bid just as Bitcoin entered the weakest month on its calendar.
The turn stands out because August has closed red for four straight years. Whale wallets and exchange-traded fund desks are wading in anyway, and the timing of who moved first is the real story.
Bitcoin Whales Moved First, and the Timestamps Show It
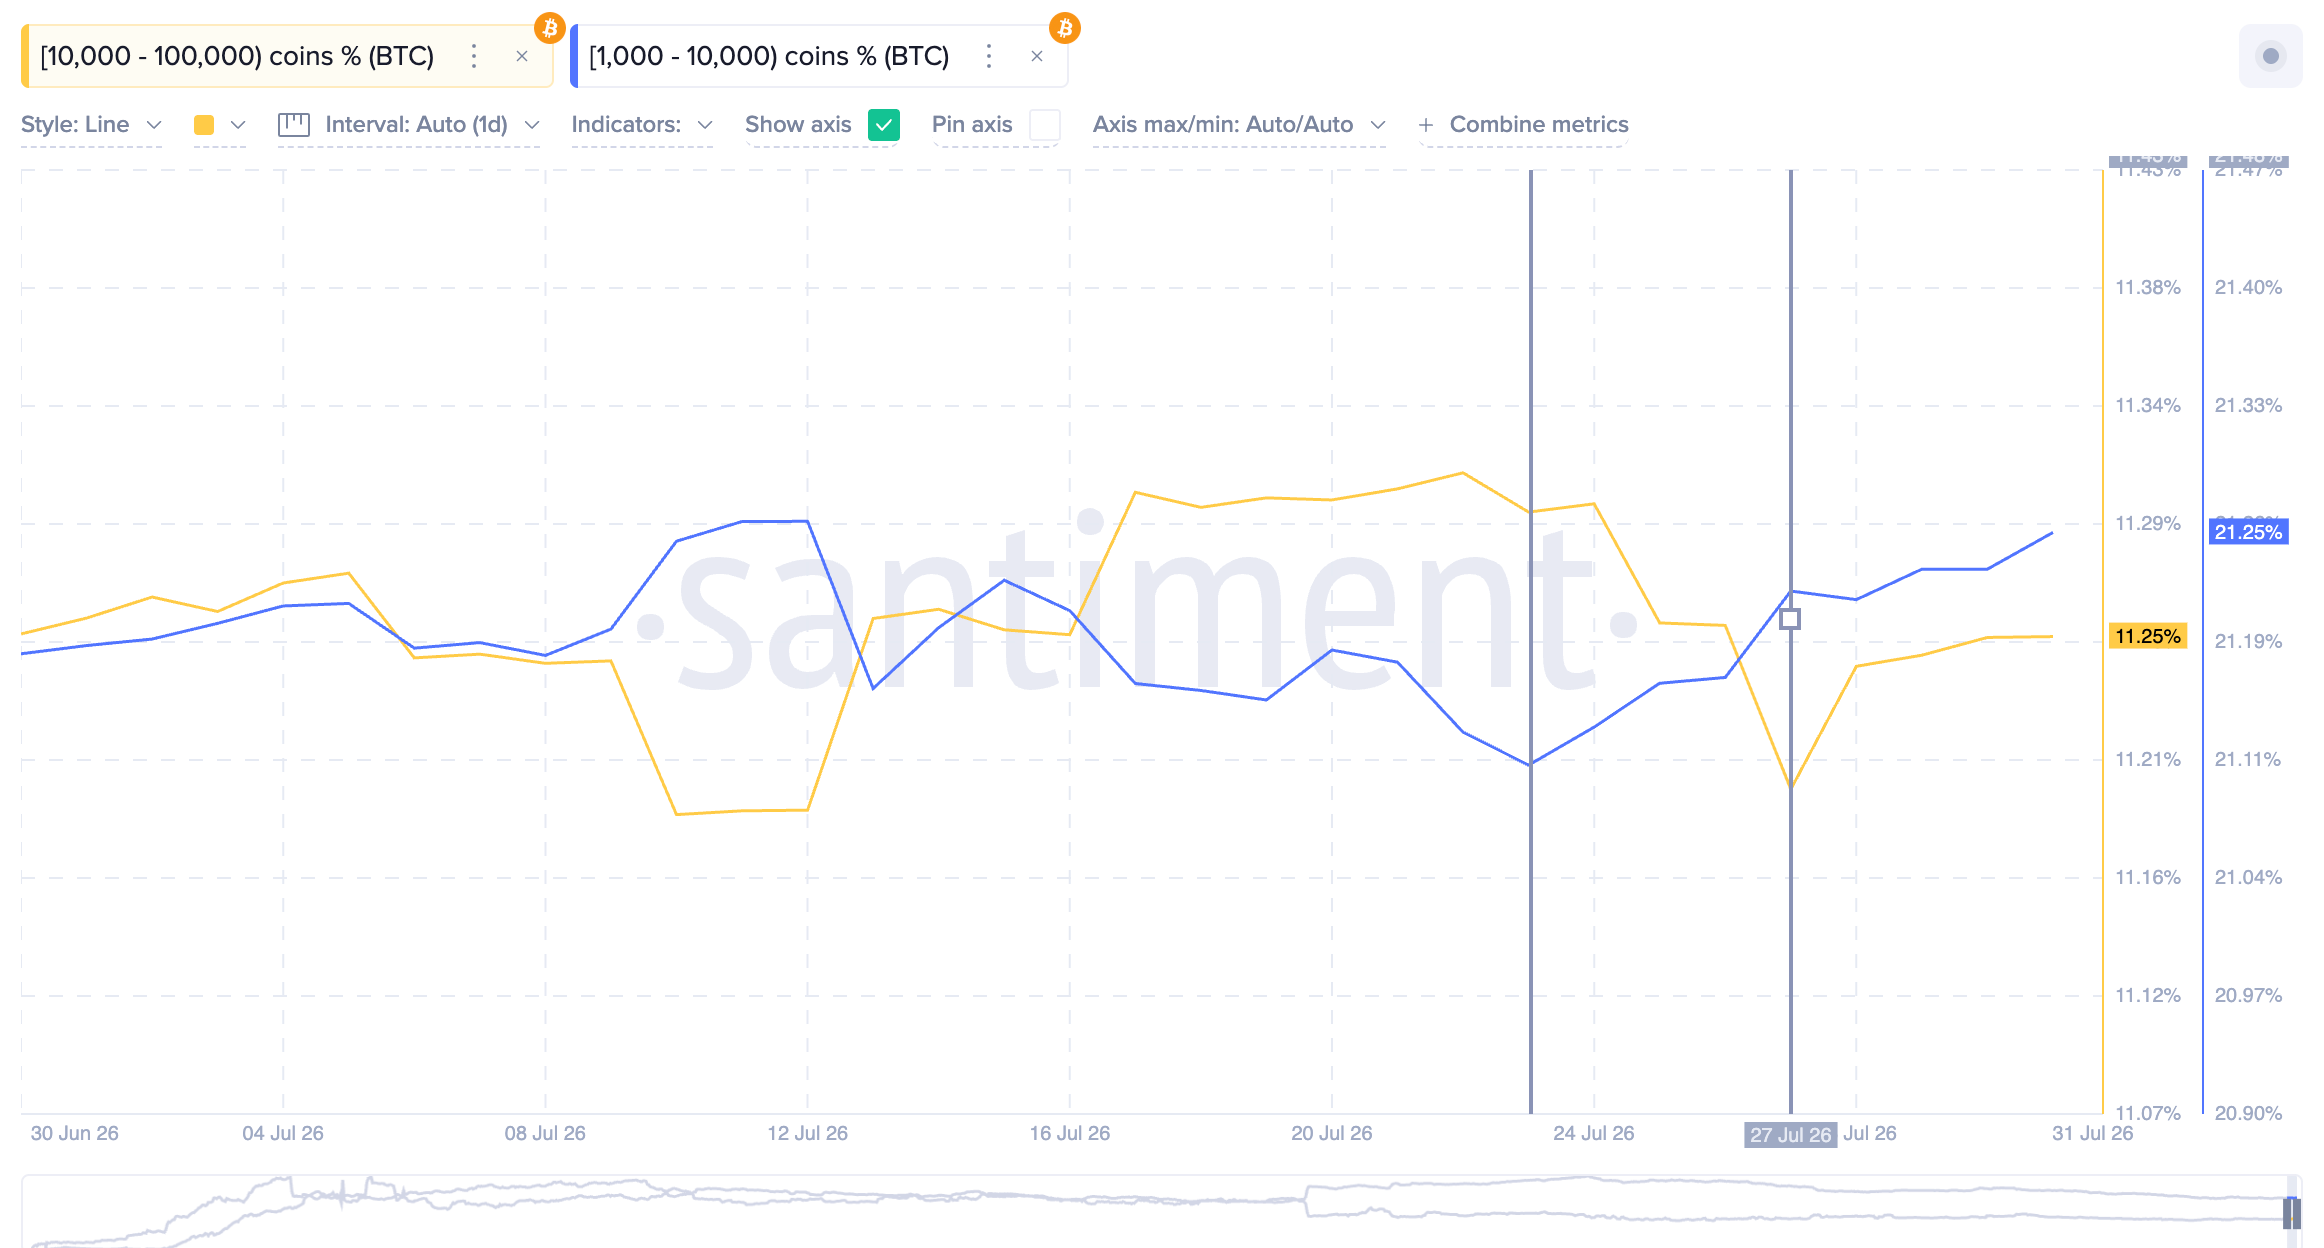
Bitcoin (BTC) whales started adding before Wall Street did. Wallets holding 1,000 to 10,000 BTC lifted their share of supply from about 21.11% on July 23 to 21.25% by month-end, according to Santiment data supplied for this analysis.
Want more token insights like this? Sign up for Editor Harsh Notariya’s Daily Crypto Newsletter here.
The larger 10,000 to 100,000 BTC cohort had been trimming since July 22. It bottomed near 11.19% on July 27, then turned back up to 11.25% into the close of the month.

Those shifts read as small in percentage terms. Yet the combined 0.20% gain across both cohorts, applied to Bitcoin’s roughly 20.06 million circulating supply, works out to about 40,100 BTC, worth close to $2.6 billion.
Derivatives positioning leaned the same way, which gives more weight to Santiment’s data. A whale-retail divergence reading of +21.8 on the daily timeframe flagged large traders as far more tilted toward long exposure than retail, a setup the dashboard labeled bullish divergence. The score reflects Binance Futures positioning, so it signals conviction rather than confirmed spot buying.

If whales were the first movers, the open question was whether institutions would follow, and the ETF tape answered within days.
Then a $233 Million Institutional Day Followed
US spot Bitcoin ETFs had been bleeding. The funds posted four straight negative sessions, including outflows of $225.18 million on July 23 and $240.08 million on July 24, before flows turned modestly positive at $32.11 million on July 29.
Then July 30 delivered $233.13 million in net inflows. BlackRock’s IBIT accounted for $183.4 million of the total, or about 79% of the day. The single session pulled spot Bitcoin ETF demand back to life after a run of redemptions.

The size matters less than the timing. July 30 was the second-largest single-day inflow of the month, behind the $265.69 million recorded on July 6, and it landed at the very end of July. It also arrived while the market was still digesting a corporate bitcoin buying freeze among some large treasury holders.

Institutions did not lead this turn. They stepped in after the on-chain cohorts had already started buying. What makes that sequence uncomfortable is the calendar it runs into.
Into Bitcoin’s Worst Month on Record
August is the problem. It carries a median return near negative 8%, the weakest of any month, and it has closed red every year since 2022. That record anchors the cautious Bitcoin August price prediction now facing the market.
July, by contrast, is on track to close green for a third straight year, a rare streak. That makes the late-month buying a bet against strong seasonal odds rather than a confirmation of them. Big money is possibly positioning for a rebound, though the data cannot rule out hedging or short-dated trades.

Yet, the convergence is real. Whale cohorts, futures positioning, and ETF cash all turned higher at once, in that order. Whether that marks accumulation before a bounce or a crowded bet into Bitcoin’s cruelest month is the wager August will settle.
The post Bitcoin Whales Scooped 40,100 BTC Worth $2.6 Billion in Nine Days appeared first on BeInCrypto.
Pump.fun reportedly dismissed employees shortly before their PUMP token grants were scheduled to vest, leaving at least one former worker without an allocation now valued at seven figures.
Summary
- Employees were reportedly dismissed weeks before 25% of their PUMP grants vested.
- One former employee allegedly lost a token allocation now worth seven figures.
- Separate claims said 40 workers were cut one day before another vesting date.
- PUMP trades near $0.002, about 77% below its September 2025 peak.
Pump.fun layoffs preceded employee token vesting
Pump.fun reduced its workforce in late March and early April after rapidly expanding its operations, according to an investigation by Sandmark.
Documents, emails, and internal recordings reviewed by the publication showed that some employees lost their jobs shortly before their PUMP allocations were due to begin vesting. At least one former employee allegedly forfeited tokens now worth seven figures.
Workers had reportedly signed token grant agreements in June 2025. Under those arrangements, the first 25% of their allocations would vest after one year, followed by additional releases over time.
Sandmark obtained a termination email showing that Pump.fun head of talent Lloyd McCarthy called affected employees into a group meeting in late March. During the recorded meeting, co-founder Noah Tweedale said the company had “grew too quickly,” limiting its ability to operate “fast and rough.”
Contracts were terminated in early April, according to the report. Affected workers received severance payments based on how long they had worked for the company, but their unvested PUMP allocations were reportedly canceled.
Pump.fun has not publicly addressed the findings.
Former workers allege a second round of cuts
New allegations surfaced after former workers claimed that Baton Corp., the company behind Pump.fun, conducted another round of layoffs in mid-July.
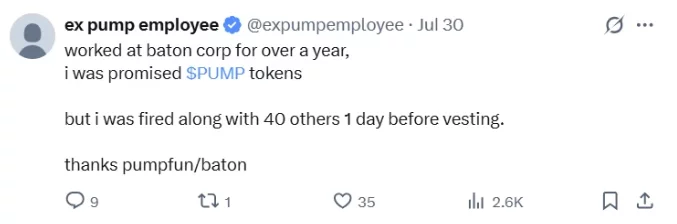
A newly created X account named “ex pump employee” alleged that Baton dismissed about 40 employees one day before their PUMP grants were scheduled to vest. The account owner claimed to have worked for the company for more than a year.
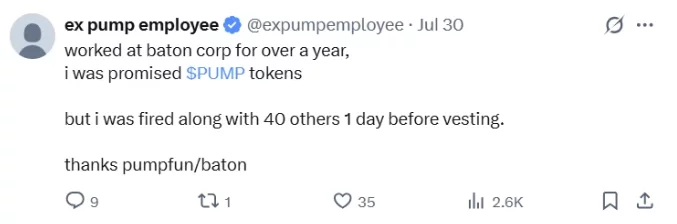
The account also alleged that Pump.fun never intended to conduct a public PUMP airdrop because the company opposed “giving free money” to users. Pump.fun has not responded publicly to that claim.
However, Sandmark said it could not independently verify the allegation that 40 workers were dismissed immediately before the July vesting event. The claim therefore remains based on the former employee’s account rather than independently reviewed employment records.
The dispute centers on employee compensation rather than tokens already held by public investors. Still, the allegations could increase scrutiny of how crypto companies structure token grants and whether employment termination clauses allow firms to cancel large allocations shortly before vesting.
PUMP distribution moved $86.49M to 121 wallets
The allegations follow Pump.fun’s first major team and investor token distribution after a one-year lockup expired.
As crypto.news previously reported, on-chain tracking showed that 57.279 billion PUMP tokens, valued at approximately $86.49 million at the time, moved to 121 wallets on July 15.
Wu Blockchain said the distribution marked the start of a three-year vesting period for team and investor allocations. The transfers made previously restricted tokens available to recipients, although wallet movements alone do not prove that any of the tokens were sold.
For US token holders, the employment allegations do not change their ownership rights. The broader concern is market-related: continued insider distributions could increase transferable supply and create selling pressure if recipients move tokens to exchanges.
PUMP remains 77% below its record high
PUMP traded around $0.002 at press time, gaining nearly 5% over the previous 24 hours, according to CoinGecko. Despite the daily rise, the token remained roughly 77% below its September 2025 all-time high.
The decline comes as Pump.fun continues to generate large numbers of short-lived meme coins. A June CoinGecko study examined 18.67 million tokens created through the launchpad between January 2024 and June 2026.
Researchers found that 12.8 million tokens, or 68.67%, recorded their final Pump.fun bonding-curve trade on the day they launched. Tokens that never traded were excluded because they had no measurable trading lifespan.
CoinGecko linked the high failure rate to the platform’s low barriers to token creation, which allow users to abandon launches quickly when early demand fails to appear.


Bond market investors may want to shift their focus toward the front of the yield curve, according to Allspring Global Investments’ Noah Wise.
The bottom line: Focus exposure on short-term Treasurys over long duration.
Wise, the firm’s head of global macro strategy and a senior portfolio manager, sees the strategy as part of a diversified portfolio to deliver profits due to the monetary policy backdrop.
“You see a market that’s pricing in a couple of hikes for the Fed here over the next couple of years,” he told CNBC’s “ETF Edge” this week ahead of Wednesday’s Fed decision on interest rates. “That type of yield north of 4% with relatively low risk is, in our view, pretty attractive.”
Allspring primarily focuses on fixed income, money markets and stocks. According to the firm’s website, clients range from consultants and financial advisors to corporations and financial institutions.
Wise also sees opportunity in the U.S. credit market, citing strong macro fundamentals.
“We like [U.S.] credit, whether that’s investment grade or high yield, more than we like European credit at this time,” he said.
But credit is not the only avenue to diversification. Wise is also seeing opportunities in emerging markets, and he’s heading south.
“Particularly in Latin America, you can find yields that are at [double digits] so there’s a lot of opportunities,” he said. “I think even with the challenges and risks that we see geopolitically, you can still generate pretty attractive yield and income in a really diversified manner.”
In a special note to CNBC, Wise wrote that this week’s Fed decision to leave rates unchanged has not changed his investment strategy.
“Opportunity always lurks where uncertainty is found. The market [moving] in short-term Treasury yields between these two Fed meetings is a good example of this, and our strategies have been tactically adjusting our exposure to this part of the curve in an effort to take advantage of that volatility,” he wrote.
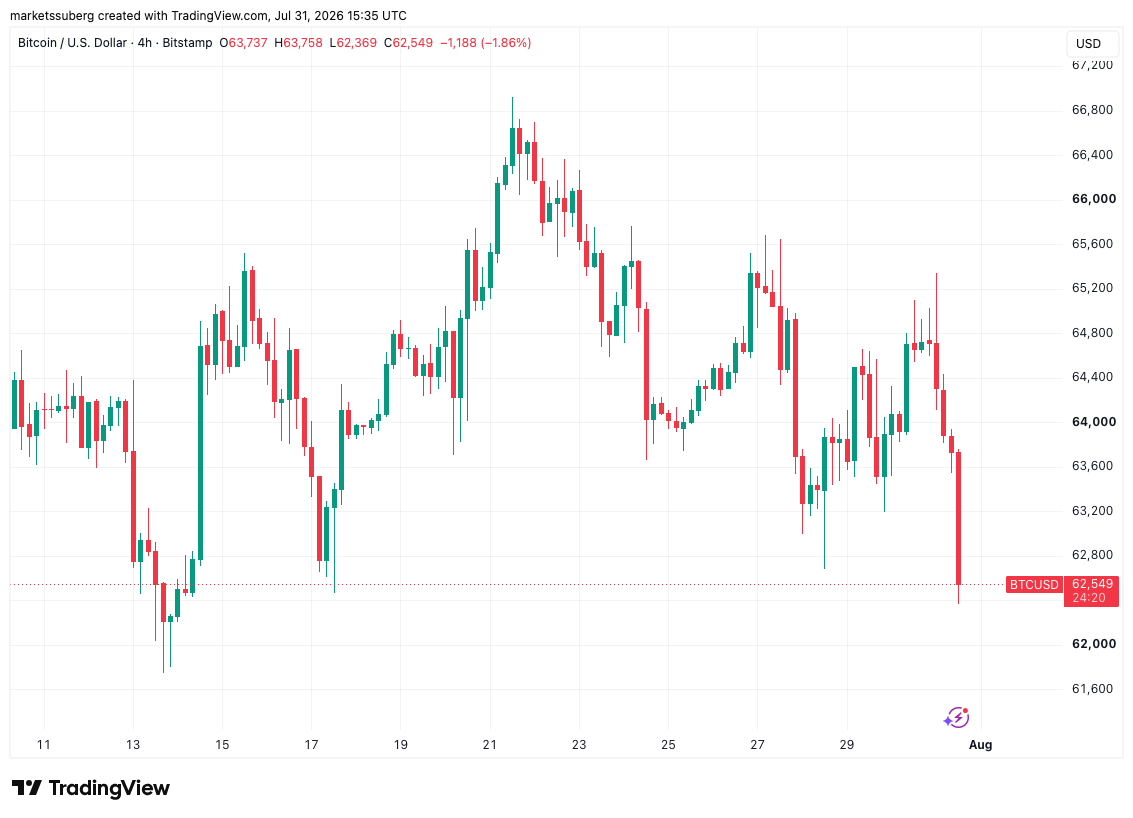
Bitcoin (BTC) fell to its lowest levels in over two weeks on Friday as US stocks saw pressure into the monthly close.
Key points:
- Bitcoin approaches $62,000 as daily losses hit 3.5%.
- US stocks saw no positive reactions to relief in Asia, where stocks rebounded after the semiconductor sell-off.
- Analysis warns that Bitcoin bear-market history should continue to repeat in August.
Bitcoin price targets $62,000 in month-end volatility
Data from TradingView showed BTC/USD falling 3.5% to reach $62,369 on Bitstamp, a level last seen on July 14.
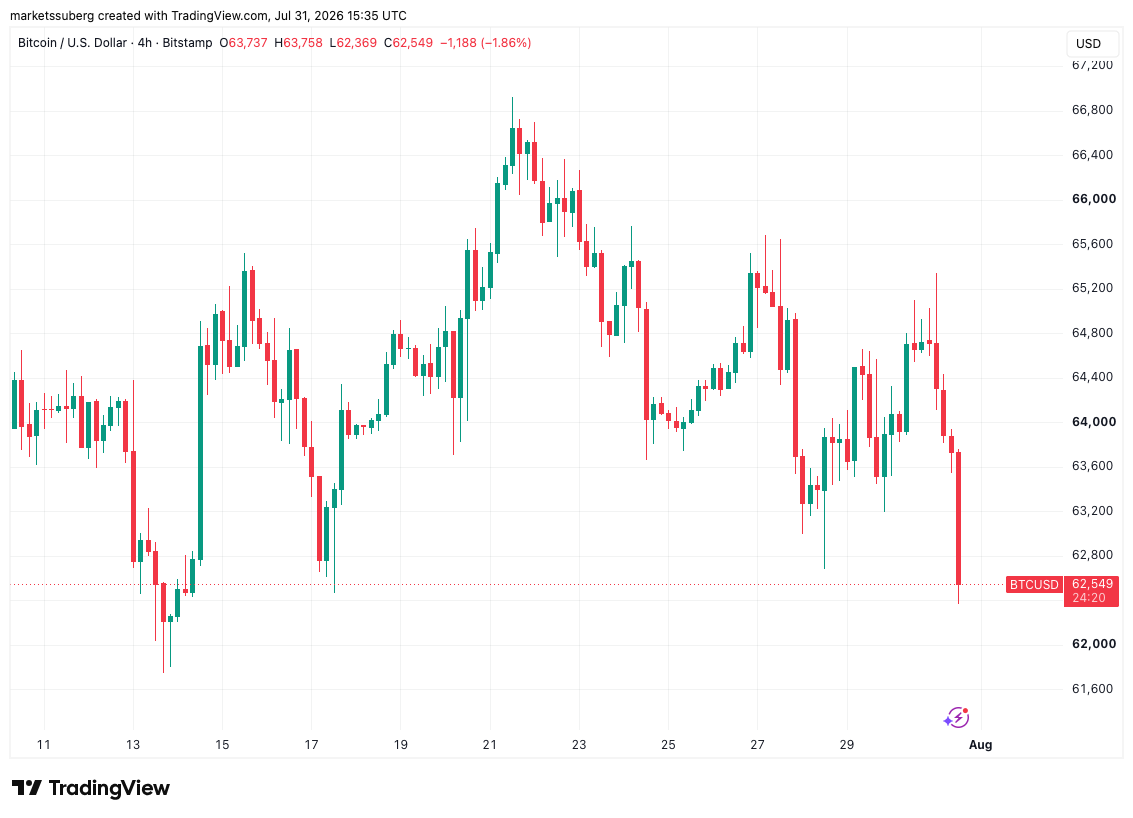
BTC/USD one-hour chart. Source: Cointelegraph/TradingView
US stocks turned red at the open before treading water, diverging from a major relief bounce seen in Asia. There, South Korea’s KOSPI index ended the day up 17.9%, its largest single-day gain on record.
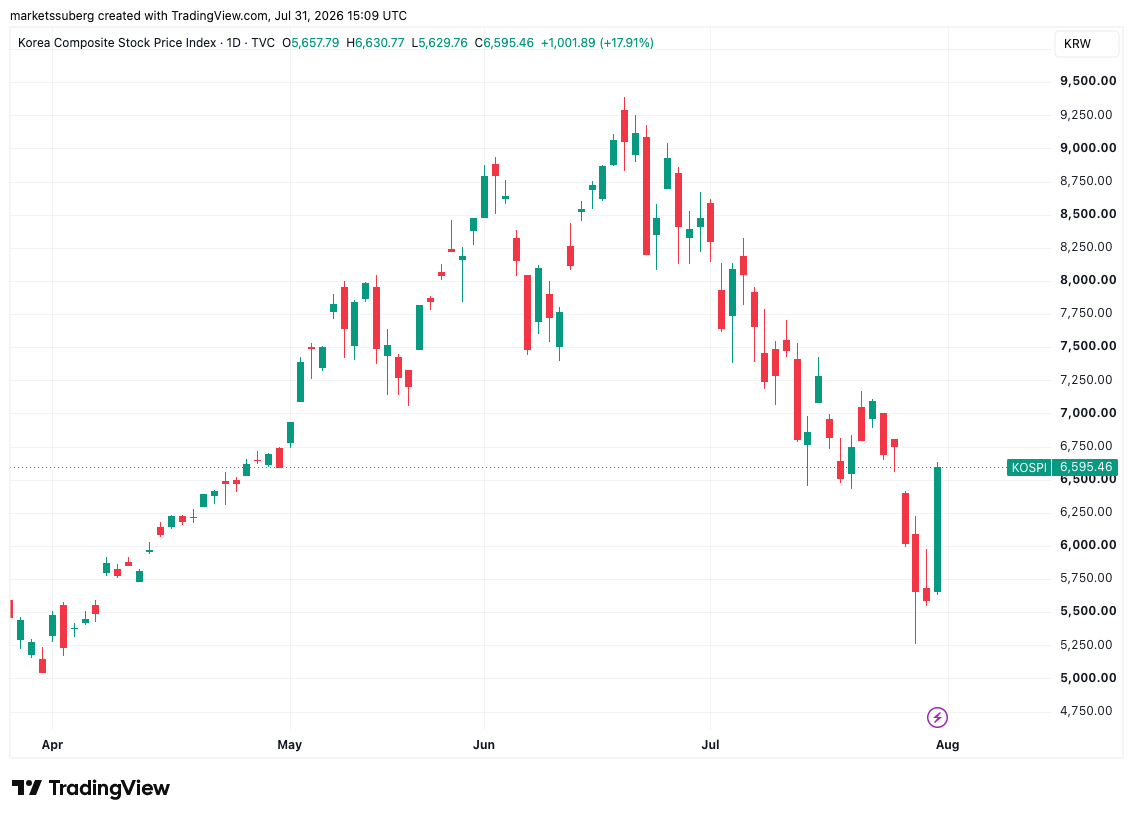
KOSPI index one-day chart. Source: Cointelegraph/TradingView
“Semiconductor shares led both the sell-off and the subsequent recovery, reflecting the index’s high exposure to the global AI and memory-chip cycle,” trading company QCP Capital wrote in commentary on the latest macro market moves.
QCP noted that crypto market trading activity increased around the KOSPI gyrations, something it said “highlighted the growing relationship between crypto liquidity, regional equity positioning and broader technology-sector sentiment.”
Both Japan and Korea reportedly engaged in currency interventions on Thursday, while Japan’s central bank kept benchmark interest rates at 1.0%, following the US Federal Reserve’s decision to stand pat on Wednesday.
Bitcoin traders see bear-market history repeating in August
BTC/USD approached the end of the monthly candle up 8.5%, marking its strongest July performance since 2022, per data from CoinGlass.
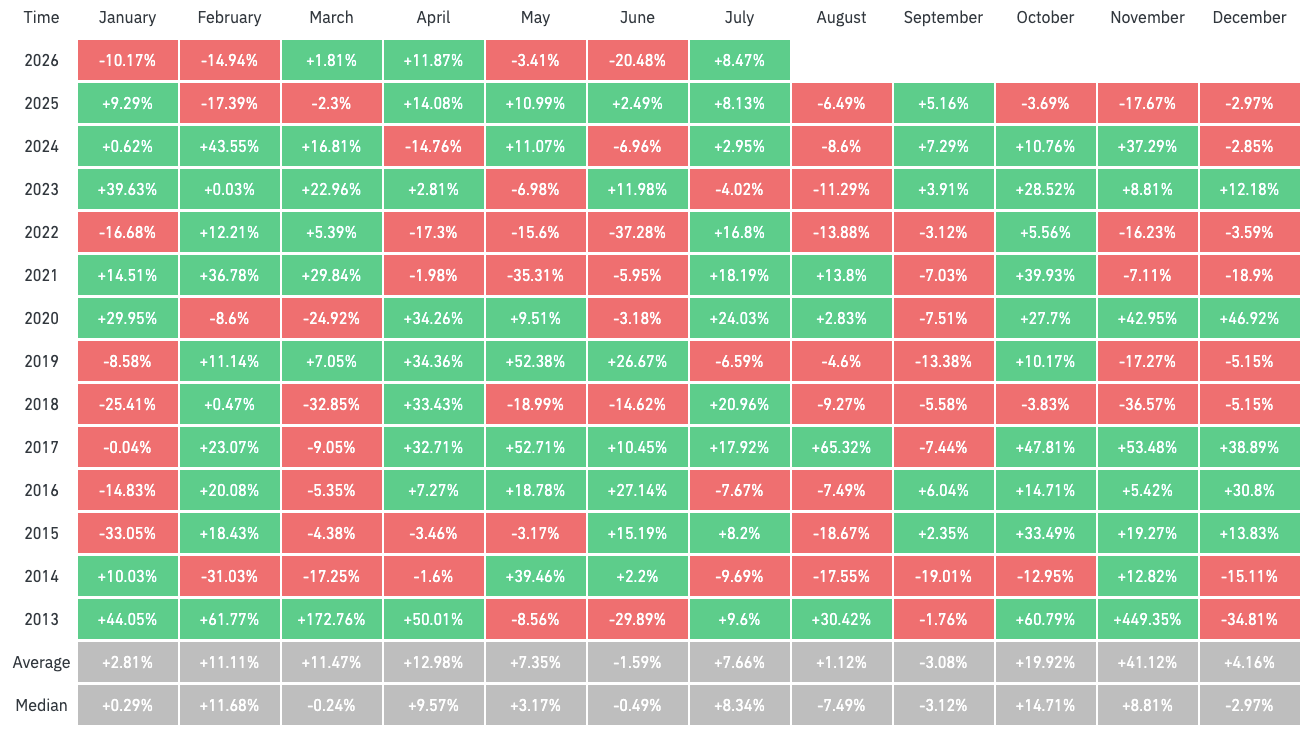
BTC/USD monthly returns (screenshot). Source: CoinGlass
Related: Here’s what happened in crypto today
Previously, traders had anticipated a relief bounce for the pair lasting until August, mirroring the 2022 bear market and ultimately reaching its next long-term bottom.
Trader and analyst Rekt Capital, among those seeing BTC price action copying bear-market moves from four years ago, forecast that the tide might not turn immediately.
“It’s likely price will try to maintain these highs in the early stages of August but history suggests price could rollover just like it did in 2022,” he wrote in a post on X on Friday.
Rekt Capital reiterated that Bitcoin’s 50-month exponential moving average (EMA), currently at $65,820, continued to act as resistance after two failed breakouts since mid-June.
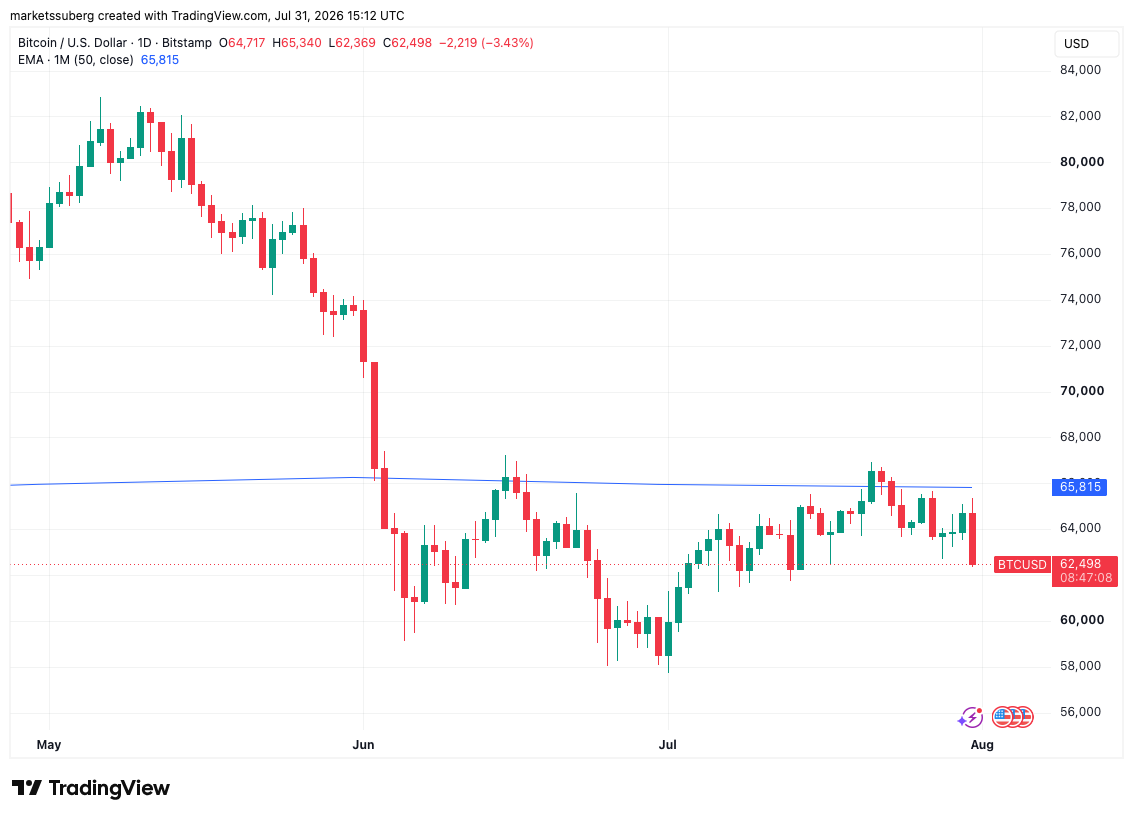
BTC/USD one-day chart with 50-month EMA. Source: Cointelegraph/TradingView


Bitcoin price fell below $63,000 on Friday as a short-lived rebound in Asian semiconductor stocks faded, adding pressure as the cryptocurrency entered its historically weak August trading period.
Summary
- Bitcoin price dropped 3% in 24 hours, extending its weekly loss to about 2%.
- Samsung and SK Hynix surrendered momentum after surging roughly 25% on Thursday.
- Bitcoin’s median August return stands near negative 8%, placing $58,000 in focus.
- The Crypto Fear & Greed Index fell to 25, signaling “Extreme Fear.”
Bitcoin price falls below $63K as risk assets weaken
Bitcoin traded below $63,000 after losing approximately 3% over the previous 24 hours. The decline followed renewed weakness in Asian technology shares, particularly companies tied to the artificial intelligence and semiconductor sectors.
Ethereum fell 2.8% to around $1,860, while Solana declined 2% to approximately $73. XRP traded near $1.06 as selling spread across large-cap cryptocurrencies.
The pullback came one day after Samsung Electronics and SK Hynix rallied roughly 25%, helping South Korea’s KOSPI recover from a steep multiweek decline. That rebound initially suggested investors were returning to semiconductor stocks following heavy selling.
Momentum failed to carry into Friday, however, raising concerns that Thursday’s advance was a temporary relief rally rather than the start of a sustained recovery.
Why faltering AI stocks are weighing on crypto
Crypto assets and AI-related equities have increasingly traded as part of the same risk-sensitive market. Both sectors rely heavily on speculative capital and tend to weaken when investors reduce exposure to high-valuation assets.
Recent pressure on semiconductor stocks has centered on questions about whether AI infrastructure spending can continue at its current pace. Investors are also examining whether future demand for memory chips and computing hardware can support valuations reached during the AI investment boom.
Those concerns are not directly related to Bitcoin’s network or adoption. However, broad risk reduction can still affect crypto as institutional traders rebalance portfolios, reduce leverage and move funds into cash or defensive assets.
For US investors, the next moves in Nvidia and other AI-linked shares could provide an important signal for crypto sentiment. Continued losses across the Nasdaq and semiconductor sector may limit Bitcoin’s ability to recover even without a crypto-specific negative catalyst.
Extreme fear compounds Bitcoin’s August risk
Market sentiment has deteriorated alongside prices. Alternative’s Crypto Fear & Greed Index stood at 25, placing the market in the “Extreme Fear” category. The index was at 28 one week earlier.
CoinGecko category data also showed limited strength across the crypto market. Decentralized finance showed limited relative resilience, but the sector remained under pressure alongside the broader crypto market.
That flat performance suggests investors may be favoring yield-generating or market-neutral DeFi strategies over directional exposure. It does not necessarily indicate that traders expect an immediate market recovery.
Bitcoin’s entry into August adds another risk. Historical data over the past 4 years places its average return for the month near negative 10%, making August one of the cryptocurrency’s weakest calendar periods.
Thin summer liquidity can magnify price swings as participation falls. Traders may also reduce exposure ahead of a month associated with repeated losses, creating additional selling pressure through a self-reinforcing seasonal pattern.
Bitcoin price could test $58K if weakness persists
An 8% decline from Bitcoin’s current level near $63,000 would place the asset around $58,000. That area is likely to attract attention as a possible support zone if selling continues.
A break below $58,000 could expose Bitcoin to a deeper correction, particularly if weak liquidity combines with leveraged long liquidations. Conversely, a recovery above $63,000 would be an early sign that buyers are absorbing supply.
The more important test may come from outside the crypto market. A sustainable floor in AI and semiconductor shares could help restore broader risk appetite, while another sharp decline would increase the likelihood of further pressure on Bitcoin.
Extreme fear has historically appeared near favorable medium-term entry points, but it does not identify an exact market bottom. Bitcoin’s August seasonality, weak technology shares and cautious investor positioning leave the near-term setup tilted toward volatility.

Cryptocurrency Kya Hai | Crypto Me Invest Kaise Kare | Cryptocurrency Bitcoin #shorts

EastEnders star Shane Richie ‘arrested for drink driving’ after heated row at garage | Soaps

The 100 Best Annuities. How to Avoid Common Mistakes and Pick the Right One.


-
 Sports5 days ago
Commonwealth Games boxing: Jadumani Singh seals dominant 5-0 win over Pakistan’s Sumama Rehman to enter quarter-finals | Commonwealth Games News
-

 Business2 days ago
Why Trees Belong on the Risk Register
-

 Tech5 days ago
Intel is reversing course and bringing hyper-threading back to its server chips
-

 Fashion5 hours ago
Weekend Open Thread: Wit & Wisdom
-

 Crypto World6 days ago
Ripple bought a bank in pieces. The $4 billion audit
-

 Politics2 hours ago
Meta enters AI-training agreement with far-right ‘propaganda rag’ Newsmax
-

 Politics4 days ago
Luke Littler dismantles Gerwyn Price to retain title in Blackpool
-

 Politics4 days ago
The Part of the Electric Transition Nobody Wants to Discuss
-

 News Videos5 days ago
BITCOIN JUST ENTERED THIS CRITICAL ZONE…
-
 Entertainment3 days ago
‘Stargate’ Creator’s New Sci-Fi Series Returns for Season 3 Tomorrow
-

 Crypto World6 days ago
XRP Ledger adds $2.6B as RWA inflows rank second
-

 Business3 days ago
Major shareholder moves on Canyon
-

 Politics5 days ago
Spain sweeps the board at 2026 World Cup with individual awards
-

 News Videos1 day ago
Bitcoin Enters the 3rd Stage of the Bear Market
-

 Entertainment6 days ago
Sara Gilson Killed By Husband After Viral “Pedophile” TikTok Video
-

 Crypto World3 days ago
Kraken Enables Retail Access to Jersey Mike’s IPO via Tokenized Shares
-

 Tech7 days ago
Anthropic launches Claude Opus 5, a cheaper AI model for coding, agents and enterprise workflows
-

 Tech4 days ago
New macOS Sequoia & Sonoma security updates for older Macs
-

 News Videos3 days ago
Claude: Build Financial Dashboards in Minutes (2026)
-

 Politics1 day ago
Luke Littler’s dominance sparks GOAT debate
You must be logged in to post a comment Login