
Crypto World
Bitcoin Could Reach $72K If V-Shaped Recovery Pattern Completes

Bitcoin traders welcomed a softer-than-expected US CPI print as inflation cooled, helping the cryptocurrency nudge above the $69,000 level on Friday. The move rekindled hopes for a short-term recovery after a period of consolidation near key technical zones. Market participants are watching whether bulls can clear a stubborn resistance band around $68,000 to $70,000, with several analysts outlining a potential path to higher targets if the price can establish a base above critical support near $65,000. The latest price action comes amid a broader market backdrop characterized by fluctuating risk appetite, liquidity dynamics, and ongoing discussion about the role of exchange-traded products in crypto exposure.
Key takeaways
- Traders anticipate a relief rally for BTC in the near term, contingent on clearing the $68,000–$70,000 resistance zone.
- A confirmed hold of $65,000–$66,000 could pave the way for a squeeze toward higher levels, with some strategists pointing to a potential move toward $72,000 if momentum sustains.
- Analysts describe a pattern suggesting the possibility of a short-term bounce, followed by attention to liquidity clusters that could amplify moves near major price walls around $75,000–$80,000.
- Key moving averages around the current price action—specifically the 20-period EMA near $67,500 and the long-established 200-week EMA near $68,000—feature prominently in discussions of potential breakout setups.
- Market breadth remains sensitive to macro data, ETF flows, and liquidity shifts, which could influence how BTC navigates the next price ceilings and support floors.
Tickers mentioned: $BTC
Sentiment: Neutral
Trading idea (Not Financial Advice): Hold. Near-term momentum hinges on reclaiming the $68,000 level and sustaining a push above resistance to re-energize a broader upside thesis.
Market context: The price action sits at the intersection of macro cooling inflation, ongoing liquidity considerations, and crypto-specific ETF discourse. As traders parse fresh CPI data, attention remains on how institutional flows and retail positioning will influence BTC’s short-term trajectory within the context of evolving risk sentiment and regulatory discussions.
Why it matters
Bitcoin’s recent move above the $69,000 mark underscores the market’s sensitivity to macro signals and its willingness to test established technical levels. A successful breakout beyond the $68,000–$70,000 band would be interpreted by many observers as an incremental sign of renewed buying pressure, potentially signaling the start of a broader recovery phase from the backdrop of recent volatility. The interplay between upward price action and liquidity conditions is central to whether the move can be sustained or is likely to stall at the next liquidity cluster.
Analysts have highlighted a confluence of technical indicators that could shape the near-term path. A rising potential is suggested by patterns observed on shorter timeframes, including the notion that a break above resistance could reawaken the momentum needed to test higher targets. Yet the narrative is balanced by warnings about the risks of a deeper correction if key supports fail to hold. The 20-period EMA and the 200-week EMA are cited as important reference points that could influence the speed and magnitude of any rebound, particularly if price re-tests test the lower bands near $65,000–$66,000.
From a broader market perspective, liquidity dynamics and the prospect of ETF-related flows continue to weigh on Bitcoin’s short-term direction. Traders monitor order-book depth and liquidation risk around critical price thresholds, as activity around $75,000–$80,000 has historically formed meaningful liquidity walls. In this environment, even a modest shift in risk appetite or a fresh catalyst could trigger rapid moves as participants adjust positions in anticipation of the next major swing.
What to watch next
- Watch for a decisive daily close above $68,000 to confirm a bullish breakout trajectory toward the $72,000 neckline level.
- Should BTC reclaim the $70,000 mark, monitor price action for signs of acceleration toward the $72,000–$76,000 zone and beyond to the 50-day SMA near $85,000.
- Keep an eye on liquidity clusters around $75,000–$80,000, where a crowding of bids and asks could trigger a squeeze if breached.
- Observe bids near $65,000 and the corresponding asks around $68,000; revisiting these levels could be a prerequisite for renewed upside momentum or a testing ground for stronger support.
- Follow macro and ETF-flow developments, as shifts in risk sentiment driven by regulatory developments or institutional demand can influence the pace of BTC’s advance.
Sources & verification
- BTC price action around $69,000 on the backdrop of cooler US CPI data and the referenced resistance zone near $68,000–$70,000.
- Public posts from market observers on X (formerly Twitter) noting resistance levels and potential continuation patterns.
- CoinGlass liquidity heatmap indicating walls near $75,000 and $80,000 and liquidation risk around key price zones.
- Analyses citing the significance of the 20-period EMA near $67,500 and the 200-week EMA near $68,000 in guiding near-term moves.
- Chart references from TradingView illustrating the one-hour and two-day perspectives on BTC price structure.
Market reaction and near-term setup
Bitcoin is approaching a pivotal juncture as traders weigh the impact of softer inflation prints against the persistence of macro headwinds. In the near term, a break above the $68,000 resistance line would be interpreted as a signal that bulls are regaining control after a period of consolidation. If that breakout strengthens, the narrative leans toward a move toward $72,000, a level that previous analyses have associated with a potential shift in momentum. The idea of a short squeeze—where short positions are forced to cover as prices rise—gains plausibility if the price can push beyond the immediate hurdle and clear liquidity walls just above $75,000 to $80,000. The risk remains that if the market fails to sustain above $68,000, or slips back toward $65,000–$66,000, the scenario could transition into a more pronounced corrective phase.
From a technical vantage point, BTC’s price action has been described as exhibiting a V-shaped recovery on certain four-hour timeframes, suggesting that the move could be swift if momentum holds. Traders are closely watching the interaction with the 20-period EMA and the 200-week EMA, two benchmarks that often correlate with transition points between ranges and breakouts. A sustained hold above these benchmarks would reinforce a more constructive outlook, while failure to do so could invite renewed selling pressure in the short run. The narrative remains data-driven, with macro signals continuing to shape expectations for how the market will respond to incoming data and policy cues.
In addition to price dynamics, liquidity considerations are relevant for auditing risk and potential volatility. The presence of concentrated bid and ask clusters around specific levels—such as near $65,000 and $68,000—suggests that order-flow dynamics could play a central role in determining whether BTC can press higher or retreat. If the market revisits the $65,000 area and buyers re-emerge, there is a plausible path for a return to the higher side of the spectrum; conversely, if bids fail to hold, the resulting liquidity gaps could accelerate a correction. Traders and researchers will likely focus on how real-time liquidity conditions align with price action to gauge the durability of any rallies.
What happened previously and what to monitor next
Historical context from recent weeks shows that BTC has repeatedly attempted to mount a sustained breakout, only to encounter resistance near meaningful price levels. The pattern analysis suggests that if the price can cement a foothold above the $68,000 zone, there is room for a move toward the $72,000 neckline and potentially higher toward the $76,000–$85,000 range, where the dynamic of moving averages could come into play. Market participants should remain vigilant for shifts in ETF activity and macro data, which historically have driven outsized moves relative to intra-day volatility. The crypto market continues to navigate a complex web of technical levels, liquidity constraints, and evolving regulatory considerations, all of which shape the probability of a sustained rally or a renewed pullback in the weeks ahead.

Crypto World
Coinbase’s AI payments system joins Linux Foundation, gathers support from Google, Stripe, AWS and others


Coinbase’s AI-focused payment protocol x402 is moving toward becoming an open, standardized infrastructure under the Linux Foundation, the non-profit hub for open-source software development. The move aims to create a community-governed ecosystem for high-frequency, micro transactions that legacy finance can’t efficiently handle.
The protocol has formed an initial governing body, the x402 Foundation, that includes internet services firm Cloudflare and payments giant Stripe, with support from a long list of other big players.
The industry interest in X402 comes as AI-driven commerce expands. Especially, so-called agentic payments, executed autonomously by AI agents, is a hot topic particularly within certain areas of the crypto industry where the belief is that programmable, blockchain-based micro-payments make the most sense.
x402 is designed for these payments. Unlike using ChatGPT as a front-end for a traditional shopping cart, it can handle transactions worth only fractions of a cent at high frequency — something traditional credit card networks struggle to manage.
Now, by using the Linux Foundation to scale an open-source ecosystem, x402 aims to tackle potential interoperability issues by creating something like a Secure Sockets Layer (SSL) for AI agents, in other words a standard technology that encrypts the connection between a web server and a browser.
“The internet was built on open protocols,” said Jim Zemlin, CEO of the Linux Foundation. “The x402 Foundation will create an open, community-governed home to develop these capabilities in the open, ensuring they evolve with transparency, interoperability, and broad participation across the ecosystem.”
Coinbase said in a press release on Thursday that additional membership of the foundation will be comprised of participants from multiple verticals with initial intent and support being expressed by Adyen, Amazon Web Services, American Express, Ampersend.ai, Ant International, Base, Circle, Fiserv Merchant Solutions, Google, KakaoPay, Mastercard, Merit Systems, Microsoft, Polygon Labs, PPRO, Sierra. Shopify, Solana Foundation, Thirdweb, and Visa.
“The shift toward agentic commerce requires cloud infrastructure that is as open as the protocols it supports,” said James Tromans, Managing Director, Web3 and Digital Assets, Google Cloud. By joining the x402 Foundation, Google is reinforcing its commitment to interoperable standards that enable secure, AI-driven transactions across platforms.”
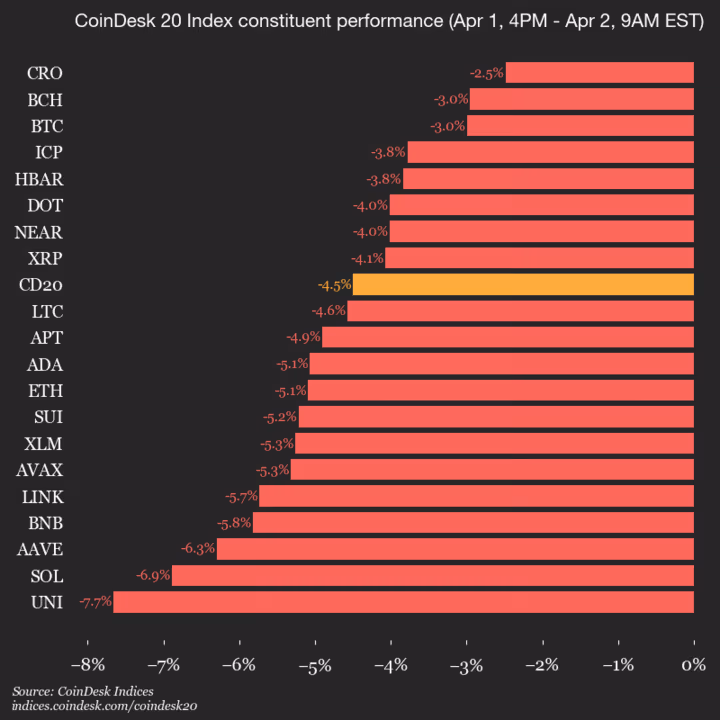
CoinDesk Indices presents its daily market update, highlighting the performance of leaders and laggards in the CoinDesk 20 Index.
The CoinDesk 20 is currently trading at 1875.68, down 4.5% (-88.38) since 4 p.m. ET on Wednesday.
None of the 20 assets are trading higher.

Leaders: CRO (-2.5%) and BCH (-3.0%).
Laggards: UNI (-7.7%) and SOL (-6.9%).
The CoinDesk 20 is a broad-based index traded on multiple platforms in several regions globally.


The crypto market recovered for the second straight day, rising 2.1% over the past 24 hours to $2.45 trillion on Tuesday.
Summary
- Crypto market rose 2.1% to $2.45 trillion, with Bitcoin nearing $69,000 and altcoins posting broad-based gains.
- Risk appetite improved ahead of a key update from Donald Trump on U.S.–Iran tensions, easing pressure from elevated oil prices.
- Over $200 million in short liquidations and continued ETF inflows added momentum to the market rebound.
Bitcoin (BTC), the bellwether asset, rose 2.4% to a six-day peak of $69,000. Ethereum (ETH) price was up 4.2%, back above $2,100, while other major crypto assets such as BNB (BNB), XRP (XRP), Solana (SOL), and Dogecoin (DOGE) posted gains between 1-3%.
Some of the best performers of the day were Algorand (ALGO), Stable (STABLE), and Zcash (ZEC), which led gains of 20.5%, 16%, and 8% each.
The latest market recovery comes as reports suggest that U.S. President Donald Trump will provide an important update on the ongoing tensions with Iran later at 9 PM ET today. This anticipation comes just a day after reports emerged that Trump was considering ending the U.S. war with Iran in the Middle East, even if the Strait of Hormuz remains closed.
The blockade in the key maritime corridor has led oil prices to surge to multi-year levels, which contributed a big part to deteriorating investor demand for risk assets as they flee to safe-haven assets such as gold and U.S. equities.
Meanwhile, a contrasting narrative came from a report by the Wall Street Journal, which indicated that several nations, including the UAE and Saudi Arabia in the Gulf stream, are pressuring the U.S. to continue its war against Iran as they try to force open the strait.
The Iranian government, for its part, has stated that the country will end the war only if certain conditions are met; these include full compensation for the wartime damages incurred.
All this combined makes Trump’s speech today a high-stakes event for global markets. Investors are likely pricing in Trump’s potential plan of looking into ending the war, although details of his speech today remain sparse at the time of writing.
Notably, the initial impact of the potential peace talks has already been seen in the energy markets as crude oil fell lower today. At press time, West Texas Intermediate (WTI) crude oil and Brent were both down 4% each, moving below $100.
Short liquidations and ETF inflows add momentum to rally
The crypto market recovery has triggered a massive short squeeze as short sellers were caught off guard. Data from CoinGlass shows that over $200 million in short positions were liquidated in the past 24 hours across leveraged markets. Such a trend could continue to accelerate the bullish momentum if the resistance levels are broken.
Meanwhile, crypto ETFs also seem to have played a part in today’s gains. Notably, spot Bitcoin ETFs recorded $117 million in net inflows over the past day, extending their inflow streak to the second day, while their Ethereum counterparts drew in $31 million on the day.
Disclosure: This article does not represent investment advice. The content and materials featured on this page are for educational purposes only.


U.S. technology and AI giants’ stocks, such as Meta, Microsoft, and NVIDIA, crashed after Iran’s Islamic Revolutionary Guard Corps threatened military action against their regional bases.
Summary
- U.S. tech stocks, including Meta, Microsoft, and NVIDIA, dropped sharply after Iran designated 18 American companies as potential military targets.
- Disruptions at AWS data centers in the Middle East impacted AI and cloud services, raising concerns over operational risks to critical infrastructure.
- AI-linked crypto tokens such as TAO, NEAR, and ICP declined 4–6% as geopolitical tensions spilled into digital asset markets.
On April 1, 2026, the IRGC officially designated 18 U.S. companies as “legitimate targets” described by Tehran as retaliation for the targeted assassination of major Iranian leaders by the U.S. and Israeli forces. These include Alphabet (Google), Apple, Microsoft, Meta, NVIDIA, Intel, IBM, Oracle, Cisco, Dell, HP, Palantir, Boeing, Tesla, GE, JPMorgan Chase, G42, and Spire Solutions
Following the announcement, Meta shares dropped by 13.31% while Microsoft and NVIDIA shares dropped by 8.34% and 6.00%, respectively.
The threats have translated into immediate operational risks with reports of drone activity causing power failures at two Amazon Web Services data centers in the Middle East, which have disrupted AI and cloud services in the region, affecting banking payment processors and consumer apps. Notably, Anthropic’s Claude AI platform reportedly went offline for a period because it relies on AWS infrastructure.
Iranian officials allege that these ICT and AI companies are complicit in tracking and identifying targets for “terrorist operations” against Iranian leaders.
For its part, the U.S. administration has dismissed the threats, with White House officials stating the U.S. military is prepared to thwart any potential aggression. Meanwhile, companies like Intel and Boeing have already implemented safety protocols for regional staff amid the escalating geopolitical and kinetic risk to critical infrastructure.
The news of the attack on AI-focused companies also rippled onto AI-focused crypto assets, which rely on the hardware and cloud ecosystems of NVIDIA and other giants that have come under fire.
According to data from crypto.news, Chainlink (LINK), currently the largest AI coin with a market cap of over $6 billion, has fell 5.8% over the past 24 hours. Bittensor (TAO), Near Protocol (NEAR), and Internet Computer (ICP) also recorded nearly similar losses between 4% and 5%. Together, the negative sentiment in the AI market led its market capitalization to drop over 3% to $0.59 billion at last check.
While these assets remain at risk of further losses if Iran starts carrying out more strikes, a sector-wide rebound could be in the cards if the U.S. manages to de-escalate the situation.
Disclosure: This article does not represent investment advice. The content and materials featured on this page are for educational purposes only.


Anthropic said on Tuesday that a release error led to portions of the internal source code for its AI coding assistant, Claude Code, being unintentionally made public.
Summary
- Anthropic accidentally exposed nearly 500,000 lines of Claude Code’s source code via a packaging error, with files rapidly spreading across GitHub.
- The leak revealed internal architecture and proprietary AI agent instructions but did not include user data or model weights.
- The company has issued around 8,000 takedown requests as concerns grow over security practices and competitive risks.
A file meant for internal use was mistakenly bundled into a software update, pointing to an archive containing roughly 2,000 files and nearly 500,000 lines of code. The material was quickly circulated on GitHub after being discovered, with a post on X sharing access to the files drawing more than 29 million views by early Wednesday. A modified version of the codebase also surged to become one of the fastest-downloaded repositories on the platform.
“Earlier today, a Claude Code release included some internal source code. No sensitive customer data or credentials were involved or exposed,” an Anthropic spokesperson said, attributing the incident to a packaging mistake rather than a security breach.
The exposed materials largely detailed the tool’s internal architecture, including its command-line interface, agent framework, and development tooling. However, the company said that no user data or model weights tied to its underlying Claude AI system were compromised.
While parts of Claude Code had previously been inferred through reverse engineering, the latest disclosure offered a far more complete view of how the system operates. An earlier version of the assistant had also seen its code exposed in February 2025.
The latest episode adds to a string of recent incidents. A prior report by Fortune indicated that Anthropic had stored thousands of internal files on publicly accessible systems, including a draft blog post referencing unreleased models named “Mythos” and “Capybara”.
Security researchers traced the current leak to a 60MB source-map file embedded in the tool’s npm package, which allowed reconstruction of the full TypeScript codebase. Within hours, developers had begun replicating and analysing the code, uncovering internal techniques used to turn Claude into a functional coding agent.
The disclosure has raised concerns among some experts about internal safeguards at a company that positions itself around AI safety. The availability of detailed implementation methods may also provide rivals such as OpenAI and Google with insights into Claude Code’s design and capabilities. According to The Wall Street Journal, the leaked material included commercially sensitive elements such as proprietary workflows and agent instructions.
In response, Anthropic has moved aggressively to contain the spread, issuing around 8,000 copyright takedown notices targeting repositories and derivative projects hosting the leaked material on GitHub.
By Wednesday morning, April 1, the company had begun efforts to remove both original files and modified versions shared by developers, The Wall Street Journal reported. Anthropic reiterated that the incident stemmed from human error and said additional safeguards are being introduced to prevent a repeat.
Despite those assurances, the episode may weigh on the company’s operational credibility, particularly as it is reportedly preparing for a potential $380 billion initial public offering.
Disclosure: This article does not represent investment advice. The content and materials featured on this page are for educational purposes only.

Key Takeaways
- Alastair Syme from Citi upgraded his XOM price objective to $175 from $150 while maintaining a Neutral stance
- The upgrade stems from Middle East tensions potentially reducing equity costs for energy companies across the board
- Syme suggests regional conflict may spark renewed institutional investment in the oil and gas industry
- Former President Trump’s reported warnings against Iran intensified supply concerns in petroleum markets
- Despite the upgrade, Citi favors TotalEnergies, ConocoPhillips, and BP over Exxon as preferred energy investments
Citi has announced a significant upward revision to its Exxon Mobil (XOM) price objective, moving from $150 to $175, with escalating Middle East tensions serving as the primary catalyst for energy sector revaluation. Analyst Alastair Syme maintained his Neutral position while implementing the increase as part of sweeping adjustments throughout oil and gas coverage.
Syme’s rationale centers on a clear thesis: geopolitical instability in the Middle East compresses the cost of capital for energy companies, which mathematically elevates valuation targets. He characterized the regional tensions as potentially catalyzing a “structural re-engagement” from institutional capital in the oil and gas sector — an industry segment that has experienced diminishing investor enthusiasm in recent years.
XOM experienced upward momentum midweek as commodity traders assessed geopolitical uncertainties against already elevated petroleum prices. This convergence created favorable conditions for the equity.
Regional Conflict Reshapes Market Dynamics
The primary catalyst involves crude oil’s acute sensitivity to Middle Eastern geopolitical developments. Recent trading sessions saw petroleum prices advance on concerns that escalating conflict might interrupt critical shipping corridors or precipitate broader supply constraints.
Compounding market anxieties, reports emerged that former President Donald Trump threatened severe action against Iran — rhetoric that rattled traders and elevated the geopolitical risk premium embedded in oil pricing. Markets frequently react to potential supply disruptions before any actual interruption materializes. Perceived threats alone typically suffice to trigger repricing.
Exxon, representing one of the planet’s largest vertically integrated energy corporations, stands directly within this repricing dynamic. Elevated crude prices enhance upstream profitability, while its downstream refining operations provide diversification. The company’s financial foundation is considered robust, a critical attribute during volatile commodity environments.
Alternative Investment Preferences from Citi
An important distinction: although Citi elevated its XOM target, the firm’s preferred energy sector positions remain TotalEnergies, ConocoPhillips, and BP. The Neutral designation indicates Syme views the shares as appropriately valued at present levels, even after the target adjustment.
The target elevation primarily reflects industry-wide momentum rather than Exxon-specific optimism.
Energy equities have broadly regained investor consideration as protection against geopolitical volatility and inflationary pressures. Exxon features prominently in these discussions given its operational scale and financial discipline, yet Citi clearly signals superior opportunities exist elsewhere within the sector.
Citi’s upgraded $175 price objective marks the latest in successive upward revisions across major oil companies as analysts recalibrate expectations for an increasingly unstable geopolitical environment.

Genius Group (GNS) sold its entire Bitcoin (BTC) treasury of 84.15 BTC on April 1, 2026, fully repaying $8.5 million in debt and leaving the company with zero BTC on its balance sheet.
The Singapore-based AI-powered education company adopted its Bitcoin-first strategy on November 12, 2024, just days after the US presidential election, committing to hold 90% or more of its reserves in BTC.
Genius Group Moves From 440 BTC to Zero
The exit marks the end of a 16-month run as one of the earliest post-election corporate BTC treasury adopters.
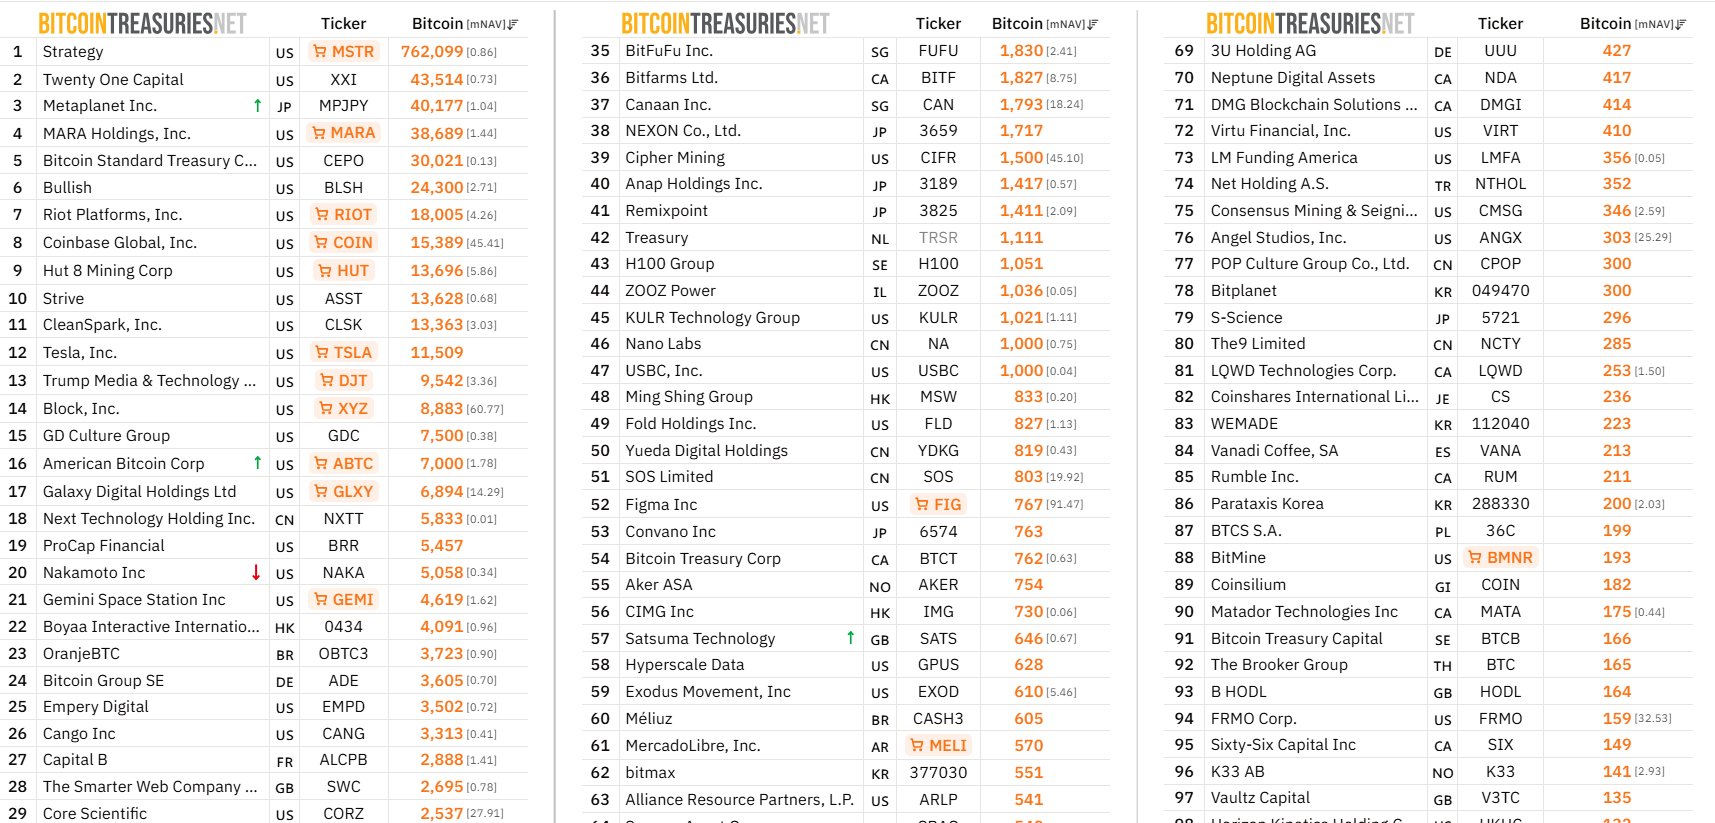
Genius Group’s BTC accumulation peaked at approximately 440 BTC by early 2025. Based on current rankings, this would place the firm among the top 70 public companies holding BTC.
The company tied its treasury strategy directly to its identity as an AI-powered education group. They framed BTC as its primary reserve asset alongside workforce training and experiential learning programs.
The unraveling began when a US court order blocked the company from raising capital or issuing new shares.
That legal constraint removed the company’s ability to fund operations without tapping its BTC holdings. Sales proceeded in stages rather than in a single transaction.
By February 6, 2026, Genius Group held exactly 84.15 BTC after selling approximately 96 BTC between late December 2025 and early February 2026.
The partial sales reduced a BTC-backed loan from roughly $8.5 million to around $3.3 million before the final liquidation cleared the balance entirely.
Debt Pressure Forces the Exit
The final BTC sale occurred during Q1 2026 and was completed before March 31. The company announced zero holdings on April 1 alongside its Q1 results, confirming the full debt repayment.
The exit came at a loss. Genius Group’s average BTC cost basis sat near $102,000 per coin from earlier accumulation. Meanwhile, prices during the Q1 sale period ran softer, around $66,500.
Despite the treasury wipeout, the company’s core operations showed growth. Q1 2026 operational revenue reached $3.3 million, up 171% from $1.2 million in Q1 2025.
Gross profit grew 228% to $2.0 million, and gross margin improved to 62% from 52% a year earlier. Adjusted EBITDA from operations turned positive at $600,000, compared to negative $400,000 in Q1 2025.
CEO Roger Hamilton attributed the operational improvement to a strategic focus on higher-margin education programs across Genius School, Genius Academy, and Genius Resorts.
“Our first quarter marks a significant milestone for Genius Group. It shows that our focus on three revenue drivers – Genius School, Genius Academy, and Genius Resorts – is paying off, with our operational revenue getting close to tripling year-on-year,” read an excerpt in the announcement, citing founder and CEO Roger
A Pause, Not an Exit
Genius Group framed the BTC liquidation as a temporary measure rather than a permanent reversal of strategy.
The company stated it will recommence building its Bitcoin treasury when it believes market conditions are more favorable.
Hamilton has accumulated 5.5 million company shares since 2024, a signal management cited as a sign of confidence in the company’s longer-term direction.
The company also pointed to continued expansion of its Genius City project in Bali, a combined education and residential hub, as part of its broader Southeast Asia growth plan.
Whether the company can rebuild a BTC treasury position without the fundraising constraints that forced the selldown will depend on the resolution of its ongoing legal proceedings and BTC price conditions at the time of any renewed accumulation.
The post Bitcoin Believers Who Lasted 16 Months Just Sold Every Coin to Survive appeared first on BeInCrypto.


Drift Protocol, a major Solana-based DeFi exchange, has suffered a $285 million social engineering-driven exploit that weaponized a compromised administrator key rather than any code flaw.
Summary
- Drift Protocol suffered a $285 million exploit on April 1, making it one of the largest DeFi hacks in Solana’s history, triggered by a compromised administrator key rather than a smart contract flaw.
- Solana Foundation Chair Lily Liu and CPO Vibhu Norby both confirmed via X that the attack vector was social engineering and operational security failures, not code-level vulnerabilities.
- SOL dropped 9% to an intraday low of $78.60 following the breach, with Wormhole warning that some Solana cross-chain transactions may face delays as a result.
Drift Protocol, a decentralized exchange built on Solana, was drained of approximately $285 million in digital assets on April 1 in what security researchers believe was a social engineering attack targeting the protocol’s administrative key infrastructure, according to Bloomberg. PeckShield Inc. was among the first firms to flag the breach, identifying that a significant portion of stolen funds were converted into USDC, the dollar-pegged stablecoin issued by Circle, based on on-chain data. The attack unfolded in approximately 12 minutes across 31 transactions, emptying nearly 20 vaults and netting, among other assets, 66.4 million USDC, 42.7 million JLP, 23.3 million MOODENG, 5.6 million USDT, 5.2 million USDS, 2.6 million JUP, 583,000 RAY, and 477,000 WETH.
Blockchain data shows that the attacker exploited a compromised Drift administrator key to list CVT as a new spot market on the platform and simultaneously raised withdrawal limits for USDC and four other markets to 500 trillion, effectively nullifying the protocol’s internal security controls. Using fraudulent collateral, the attacker was then able to withdraw freely from Drift’s spot market vaults. The use of different signature keys across the 31 transactions suggests that either the key management infrastructure was compromised or that multiple authoritative keys were accessed, pointing to a coordinated, targeted operation rather than an opportunistic smart contract bug.
The native DRIFT token fell from roughly $0.072 to $0.055 in the immediate aftermath, as users rushed to withdraw liquidity and the protocol halted deposits and withdrawals.
“The real target of the attack is people”
Lily Liu, chair of the Solana Foundation, addressed the incident directly on X, stating: “The Drift incident has far-reaching effects, impacting the entire ecosystem. The Drift team is working around the clock to investigate and control the situation, and we are doing our best to provide support. The smart contract itself has withstood the test. The real target of the attack is ‘people’ — more related to social engineering and operational security vulnerabilities rather than exploits at the code level.”
Vibhu Norby, Chief Product Officer of the Solana Foundation, reinforced that assessment, writing on X that the incident “is not caused by a program or smart contract vulnerability, but is more likely related to operational security or social engineering attacks.” Norby added that any protocol relying on a multi-signature mechanism across various chains could theoretically face similar risks, and stressed that the Drift security incident “is an isolated case and does not indicate a systemic issue with Solana DeFi or related products.”
The clarification from both officials was pointed: this was not a Solana failure, it was a human one. As crypto.news has previously reported, social engineering has become the dominant attack vector in the industry, with phishing, fake job offers, and impersonation campaigns now accounting for a majority of high-value breaches — a pattern accelerated by North Korea’s Lazarus Group and other state-linked actors.
Market fallout and cross-chain ripple effects
SOL fell 9% to an intraday low of $78.60 on April 2, bringing its market cap down to $45.5 billion, according to crypto.news data. Over the previous seven days, SOL had already shed more than 10%, making it the steepest loss among the top 10 cryptocurrencies. The $285 million hack stands as one of the largest exploits in the Solana ecosystem in the last five years.
Cross-chain infrastructure also felt the strain. Wormhole posted on X confirming that its user assets were not at risk and that bridge functionality remained operational, but warned that built-in Solana security mechanisms could cause some cross-chain transfers to experience delays. Wormhole core contributors said they were in active communication with the broader Solana ecosystem to provide
Drift Protocol hit by $285m social engineering attack on Solana
- Drift Protocol lost $285 million in one of the largest DeFi exploits in Solana’s history, with the attack executed through a compromised administrator key rather than a smart contract vulnerability.
- Solana Foundation leadership confirmed the breach was rooted in social engineering and operational security failures, stressing that Solana’s underlying code and smart contracts remained intact.
- SOL fell nearly 9% to an intraday low of $78.60 following the incident, bringing its market cap down to $45.5 billion.
Drift Protocol, a decentralized exchange built on Solana, lost approximately $285 million in digital assets on April 1 after an attacker exploited a compromised administrator key to drain nearly 20 protocol vaults in under 12 minutes, according to Bloomberg. The breach ranks as one of the largest DeFi hacks in Solana’s history and triggered a sharp selloff in SOL, which dropped 9% to $78.60 on the day.
PeckShield was among the first blockchain security firms to flag the incident, placing total losses at roughly $285 million. On-chain data later revealed that 31 transactions were executed across approximately 12 minutes. The attacker withdrew 66.4 million USDC, 42.7 million JLP, 23.3 million MOODENG, 5.6 million USDT, 5.2 million USDS, 2.6 million JUP, 583,000 RAY, and 477,000 WETH. A portion of the JLP tokens were burned, while the remaining assets were largely converted to SOL and distributed across multiple wallets.
The attack vector did not involve a flaw in the protocol’s smart contracts. Instead, a compromised Drift administrator key was used to list a new spot market and raise withdrawal limits across USDC and four other markets to 500 trillion — effectively disabling the platform’s security mechanisms and allowing the attacker to use fraudulent collateral to empty the vaults.
Solana Defends Its Infrastructure
Lily Liu, chair of the Solana Foundation, addressed the incident on X, stating: “The Drift incident has far-reaching effects, impacting the entire ecosystem. The Drift team is working around the clock to investigate and control the situation, and we are doing our best to provide support. The smart contract itself has withstood the test. The real target of the attack is ‘people’ — more related to social engineering and operational security vulnerabilities rather than exploits at the code level.”
Vibhu Norby, Chief Product Officer of the Solana Foundation, echoed that assessment, writing on X that the incident “is not caused by a program or smart contract vulnerability, but is more likely related to operational security or social engineering attacks.” He was also careful to contextualize the breach, noting that “any protocol relying on a multi-signature mechanism across various chains may face similar risks,” and calling the Drift security incident “an isolated case” that does not indicate systemic issues within Solana DeFi.
Cross-Chain Ripple Effects
Cross-chain bridge Wormhole also confirmed on X that its user assets were not at risk and that bridge functionality remained operational. However, the protocol warned that some Solana cross-chain transfers may experience delays due to built-in security mechanisms triggered by the incident. Wormhole said its core contributors were in active communication with the Solana ecosystem team.
The attack lands in a broader context of rising social engineering threats across crypto. As crypto.news reported in January, most major crypto breaches now stem from phishing, impersonation, and operational access failures rather than broken code — a pattern that the Drift incident reinforces. Only weeks prior, the Solana-based memecoin platform Bonk.fun was similarly compromised via a domain hijack that deployed a malicious wallet drainer, resulting in user losses exceeding $273,000.
The DRIFT token, which had already lost more than 86% of its value over the prior year, fell sharply from approximately $0.072 to $0.055 amid the chaos. The protocol had previously raised $25 million in a Series B round led by Multicoin Capital, bringing its total funding to over $52.3 million, according to crypto.news. At the time of the hack, its total value locked had stood at hundreds of millions of dollars, making it one of Solana’s most significant DeFi platforms.
The Solana Foundation said the community will continue to receive updates as the investigation concludes and noted that important operational security lessons are expected to emerge for the broader industry once the full picture is known.

Key Takeaways
- A $2.2 billion equal partnership between TotalEnergies and Masdar will pursue onshore renewable projects in nine Asian nations.
- The collaboration encompasses solar, wind, and energy storage initiatives, with headquarters established in Abu Dhabi.
- The joint portfolio features 3 GW already generating power and an additional 6 GW under development for completion by 2030.
- Geographic focus includes Azerbaijan, Indonesia, Japan, Kazakhstan, Malaysia, the Philippines, Singapore, South Korea, and Uzbekistan.
- Approximately 200 staff members from both organizations will support the venture, with leadership appointments pending.
TotalEnergies (TTE) and Masdar, the renewable energy flagship of the United Arab Emirates, revealed on Thursday their creation of a $2.2 billion collaborative enterprise to merge their land-based clean energy activities throughout nine Asian territories.
The agreement brings together two major forces in the renewable energy sector through an evenly split ownership arrangement, with each partner holding a 50% interest. Headquartered in Abu Dhabi, this new entity will function as the exclusive platform for both corporations to advance, construct, own, and manage land-based solar, wind, and battery storage developments in the region.
The geographic coverage spans Azerbaijan, Indonesia, Japan, Kazakhstan, Malaysia, the Philippines, Singapore, South Korea, and Uzbekistan.
The combined asset base includes 3 gigawatts of currently operational renewable infrastructure alongside 6 gigawatts of projects in development scheduled to begin operations before 2030’s end. Both parties are contributing holdings of approximately equivalent worth.
The enterprise will employ roughly 200 professionals sourced from both parent companies. The executive leadership structure remains to be announced.
TotalEnergies chief executive Patrick Pouyanné stated that merging both organizations’ capabilities across these nine markets would unlock greater value than either company could achieve operating separately.
The Asian Opportunity
Masdar’s Chairman Sultan Al Jaber, who simultaneously holds positions as CEO of Abu Dhabi National Oil Company and UAE Minister of Industry and Advanced Technology, identified Asia as the primary driver of worldwide electricity consumption expansion through the current decade.
Al Jaber indicated the collaboration would speed up Masdar’s advancement throughout the continent while creating fresh avenues to provide what he characterized as affordable, dependable energy infrastructure.
He further emphasized the UAE’s proven history in renewable energy implementation, especially throughout Central Asia and the Caucasus region, as a strong platform for this broadened initiative.
Partnership Framework and Scope
The joint venture maintains its headquarters in Abu Dhabi, positioning it alongside Masdar’s current operational infrastructure. Both enterprises have pledged to provide assets of equivalent magnitude, ensuring equilibrium in the partnership from inception.
The 3 GW of already functioning capacity provides the venture with immediate operational momentum, while the 6 GW development pipeline demonstrates the ambition both parties are placing on the next four-year period.
TTE stock declined 0.34% on the day of the announcement.

Bitget, the world’s largest Universal Exchange (UEX), has introduced a new account structure that allows its AI trading agent, GetClaw, to execute trades autonomously within a dedicated account environment, marking a new stage in the evolution of AI-driven trading. Within this account, the agent can autonomously execute real trades based on natural language instructions, monitor markets continuously, and manage positions in real time without requiring manual intervention.
The development builds on Bitget’s earlier launch of GetClaw, a zero-installation AI agent designed to operate as a persistent trading partner, as well as the recent expansion of Agent Hub, which introduced analytical AI Skills and integrated data tools that connect market analysis directly with execution. Together, these developments reflect a progression from access, to intelligence, and now to independent execution.
The introduction of agent accounts reflects a shift in how AI is being applied within trading. The beginning saw systems focused on assisting users through analysis or recommendations but recent models are capable of observing markets continuously and acting on defined strategies. By assigning dedicated accounts to AI agents, Bitget extends this capability into direct participation under live market conditions.
“Sooner or later emerging financial markets are going to be filled with AI agents trading on behalf of users. We’re preparing the infrastructure to run this on scale,” said Gracy Chen, CEO at Bitget.
The use of dedicated sub-accounts provides clear separation between user-controlled assets and agent-driven activity, allowing strategies to be deployed with greater transparency and control. Users can define strategies in simple terms, while GetClaw executes, monitors, and adjusts positions within predefined parameters.
This approach reflects a broader architectural direction. Rather than treating AI as an external layer, Bitget is integrating AI directly into its trading environment, allowing both human users and automated systems to operate within the same infrastructure. Through Agent Hub, AI agents can access real-time data, analytical tools, and execution capabilities without relying on fragmented workflows.
As AI-driven participation grows, trading environments are evolving to support both human and machine-driven activity. This transition is shaping what is increasingly described as agentic trading, where systems move from supporting decisions to actively participating in markets.
Within Bitget’s Universal Exchange model, where crypto assets and tokenized traditional instruments operate within a unified account structure, the addition of agent accounts extends the platform’s functionality beyond manual trading. As automation becomes more integrated across markets, trading systems are evolving toward environments where analysis and execution operate together in real time.
To find out more, visit here.
About Bitget
Bitget is the world’s largest Universal Exchange (UEX), serving over 125 million users and offering access to over 2M crypto tokens, 100+ tokenized stocks, ETFs, commodities, FX, and precious metals such as gold. The ecosystem is committed to helping users trade smarter with its AI agent, which co-pilots trade execution. Bitget is driving crypto adoption through strategic partnerships with LALIGA and MotoGP™. Aligned with its global impact strategy, Bitget has joined hands with UNICEF to support blockchain education for 1.1 million people by 2027. Bitget currently leads in the tokenized TradFi market, providing the industry’s lowest fees and highest liquidity across 150 regions worldwide.
For more information, visit: Website | Twitter | Telegram | LinkedIn | Discord
Risk Warning: Digital asset prices are subject to fluctuation and may experience significant volatility. Investors are advised to only allocate funds they can afford to lose. The value of any investment may be impacted, and there is a possibility that financial objectives may not be met, nor the principal investment recovered. Independent financial advice should always be sought, and personal financial experience and standing carefully considered. Past performance is not a reliable indicator of future results. Bitget accepts no liability for any potential losses incurred. Nothing contained herein should be construed as financial advice. For further information, please refer to our Terms of Use.
The post Bitget Gives AI Its Own Trading Account, Advancing Toward an Agent-Native Exchange appeared first on BeInCrypto.

Coinbase’s AI payments system joins Linux Foundation, gathers support from Google, Stripe, AWS and others
Did Chicago Med Kill Off Oliver Platt’s Dr. Charles Before Finale?

Google’s New Quantum Computer Could Kill Crypto By 2029


-

 Business7 days ago
Instagram, YouTube Found Responsible for Teen’s Mental Health Struggle in Historic Ruling
-

 NewsBeat6 days ago
The Story hosts event on Durham’s historic registers
-
 Tech7 days ago
Intercom’s new post-trained Fin Apex 1.0 beats GPT-5.4 and Claude Sonnet 4.6 at customer service resolutions
-

 Sports6 days ago
Sweet Sixteen Game Thread: Tide vs Michigan
-
Entertainment3 days ago
Fans slam 'heartbreaking' Barbie Dream Fest convention debacle with 'cardboard cutout' experience
-
 Entertainment5 days ago
Lana Del Rey Celebrates Her Husband’s 51st Birthday In New Post
-
Crypto World2 days ago
Dems press CFTC, ethics board on prediction-market insider trades
-

 Crypto World17 hours ago
Gold Price Prediction: Worst Month in 17 Years fo Save Haven Rock
-

 Tech3 days ago
The Pixel 10a doesn’t have a camera bump, and it’s great
-

 Sports2 days ago
Tallest college basketball player ever, standing at 7-foot-9, entering transfer portal
-

 Tech2 days ago
EE TV is using AI to help you find something to watch
-

 Fashion4 days ago
Amazon Sundays: Soft Spring Layers
-

 Tech3 days ago
Apple will hide your email address from apps and websites, but not cops
-

 Tech2 days ago
Flipsnack and the shift toward motion-first business content with living visuals
-

 Tech2 days ago
How to back up your iPhone & iPad to your Mac before something goes wrong
-

 Politics3 days ago
Should Trump Be Scared Strait?
-

 Crypto World3 days ago
U.S. rule change may open trillions in 401(k) funds to crypto
-

 Fashion7 days ago
En Vogue in Brown Leather and Tailored Neutrals by Atelier Savoir, Styled by J Bolin
-

 Fashion7 days ago
What Are Your Favorite T-Shirts for the Weekend?
-

 Business6 days ago
Chinese universities with military links bought Super Micro servers with restricted AI chips
You must be logged in to post a comment Login