
Crypto World
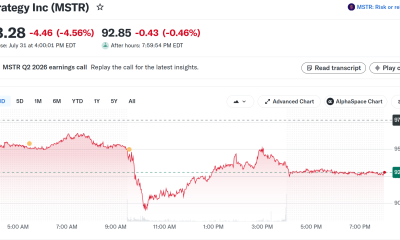
Strategy’s STRC retakes $90 after 24% rebound from June closing low

The preferred shares have recovered nearly 24% from their June closing low as Strategy builds its cash reserve and repurchases STRC.


A Kalshi advertisement at a bus stop in Washington, D.C., March 19, 2026.
Daniel Heuer | Bloomberg | Getty Images
Prediction market platform Kalshi is announcing Tuesday a new partnership with compliance technology company Comply as its push into institutional trading continues, the company told CNBC exclusively.
Comply — which works with more than 5,000, primarily financial, firms — is adding Kalshi’s prediction markets trade data to its regulatory software.
The platform gives companies who use Comply’s technology, for traditional securities and digital assets, the ability to see employees’ trades on event contracts, to make sure they’re following a company’s policies and not using material, non-public information to trade. The technology will also extend to Kalshi’s perpetual futures contracts, too.
“Most firms are still figuring out what a reasonably designed prediction market compliance program looks like, and that’s exactly where we come in,” said Comply’s chief regulatory service officer Jamila Mayfield in a statement. “Comply brings both the technology and the regulatory expertise to build programs that hold up under scrutiny.”
Comply’s technology already covers prediction market trades on platform Polymarket through a partnership with ZenLedger, a cryptocurrency tax management and accounting company, according to a press release.
Kalshi’s partnership with Comply follows a similar one between the prediction market and StarCompliance, another compliance technology company that allows clients to see employees’ trades, announced in June.
Max Crowley, vice president of business development at Kalshi, told CNBC in an interview that these compliance partnerships come up as the company has continued to have conversations with firms potentially interested in institutional trading. Many are used to technology like that of Comply’s when trading on traditional assets, and expect the same if they’re to move into the prediction market space, he said.
“We’re actively working with institutions, and I think, more and more we’ve heard from these firms… ‘Do we have compliance surveillance on our side?’” Crowley said. “We have an internal surveillance team, every day we’re actively going through all the activity that is happening on the platform… But then firms say, ‘that’s all good, but we also need visibility.’”
CNBC previously reported that companies across sectors are grappling with the rise of prediction markets, and legal experts said few — beyond highly-regulated financial institutions with large compliance departments — have figured out how to alter their internal policies surrounding the new asset class for employees.
Sudhir Jain, Kalshi’s chief compliance officer, said some companies may be considering blocking their employees from trading outright on any event contract as a policy. However, he said technology like Comply’s can avoid protocols like that.
“Without knowing what employees are doing, their only choice is to say, from a policy perspective, don’t trade at all,” Jain said. “Now they have the data; they can monitor it.”
Disclosure: CNBC and Kalshi have a commercial relationship that includes customer acquisition and a minority investment.

Key takeaways
- Dogecoin is trading near $0.070 after declining 3.5% last week.
- DOGE’s long-to-short ratio rose to a one-month high of 1.25, signaling bullish positioning.
- Funding rates remain positive at 0.0074%, indicating stronger demand for long positions.
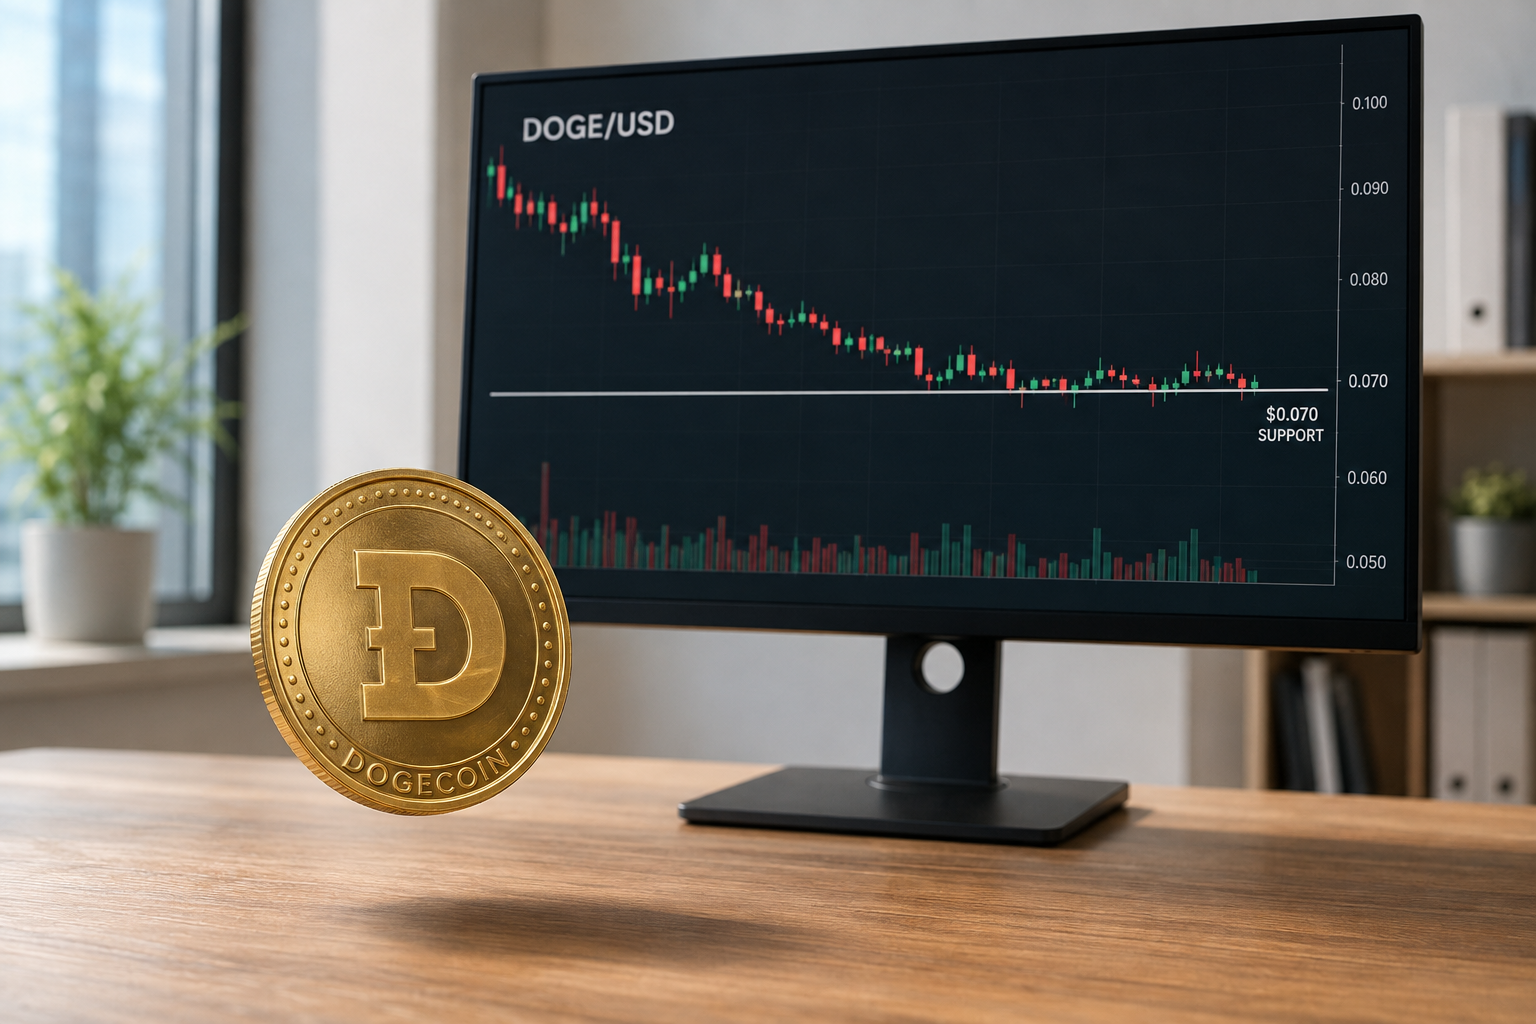
Dogecoin (DOGE) is holding steady near $0.070 at the time of writing on Tuesday after falling 3.5% last week.
Although the broader technical trend remains bearish, improving derivatives data and bullish divergences across key momentum indicators suggest that selling pressure may be easing. This setup could support a short-term recovery if buyers defend the current support zone.
Derivatives data supports a bullish DOGE outlook
Dogecoin derivatives traders are showing signs of growing optimism. The DOGE long-to-short ratio climbed to 1.25 on Tuesday, its highest level in more than a month, according to CoinGlass.
A reading above 1 indicates that long positions outnumber shorts, suggesting more traders expect the price to rise.
Dogecoin’s funding rate also supports this bullish outlook. The rate turned positive on July 24 and stood at 0.0074% on Tuesday.
Positive funding rates mean traders holding long positions are paying those with short positions, typically reflecting stronger demand for bullish exposure.
Dogecoin technical outlook: Bullish divergence emerges
Dogecoin is trading near $0.070 on Tuesday but remains below its major moving averages, maintaining a bearish near-term structure.
The 50-day, 100-day, and 200-day Exponential Moving Averages are located at $0.075, $0.083, and $0.100, respectively. These levels are expected to act as resistance during any recovery attempt.
However, momentum indicators suggest bearish pressure is beginning to fade. DOGE formed a lower price low on August 1 while the daily Relative Strength Index registered a higher low. This bullish divergence indicates that selling momentum is weakening despite the decline in price.
The Awesome Oscillator reinforces this signal. Its recent lows have been rising while DOGE continues to trade near its price lows, suggesting that downside momentum is losing strength.
Immediate support is located at the horizontal level of $0.070. If DOGE loses this level, the yearly low at $0.067 would become the next key support. A decisive daily close below $0.067 could trigger further losses toward the psychological level of $0.065.

The 50-day EMA at $0.075 represents the first major resistance level. Above it, DOGE could encounter selling pressure around the descending trendline breakout area near $0.080, followed by the 100-day EMA at $0.083 and horizontal resistance at $0.088.
A stronger recovery would require Dogecoin to reclaim the 200-day EMA at $0.100 and the major horizontal barrier at $0.102. Moving above these levels would help ease the prevailing bearish outlook.


Italy’s largest bank Intesa Sanpaolo increased its staked Ether ETF position to $7.1 million while reducing its holdings in two spot Bitcoin ETFs.
Crypto World
Korean Buyers Are Stacking XRP 2-to-1 Against Sellers: XRP Price Prediction Says 80-Day Downtrend About to Break?
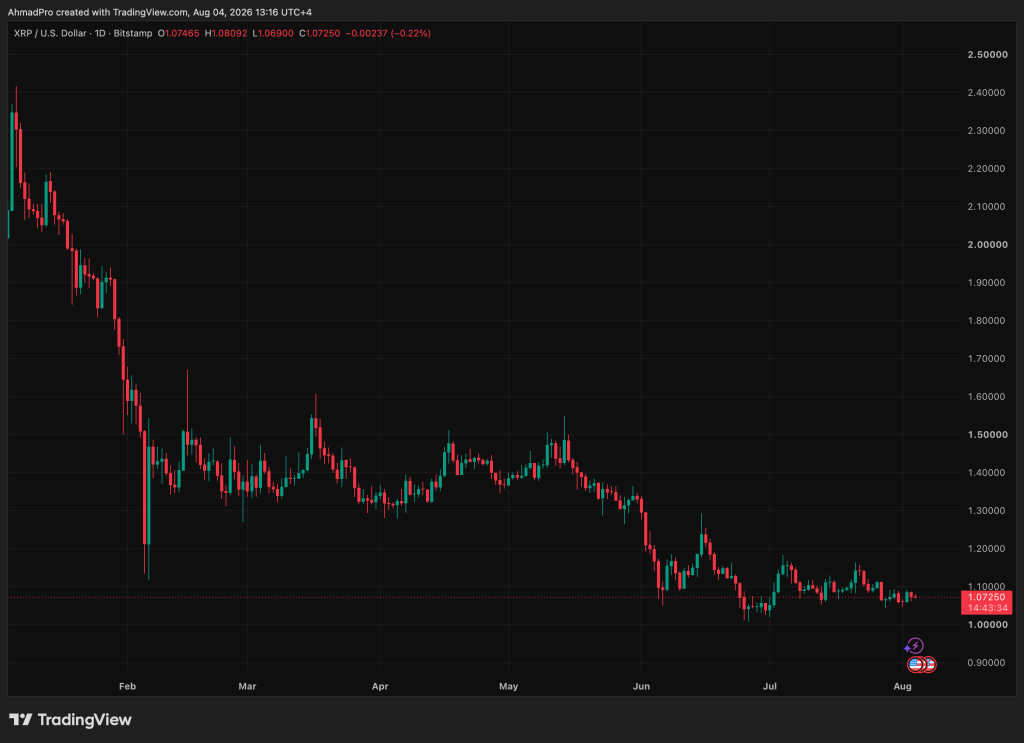
In the latest XRP price prediction, XRP price is trading at $1.0732, down 0.99% in the last 24 hours, yet the more interesting story sits just beneath the surface. A 4% bounce off the August lows is testing an 80-day falling channel, and one technical level will confirm whether this move has legs or fades, as every prior rally since May has. South Korea is making its position clear. The rest of the market hasn’t decided yet.
XRP market cap sits at approximately $68.27 billion with a circulating supply of 62 billion tokens and 24-hour trading volume around $877 million, stable, not explosive.
On Upbit, XRP ranks third among 275 Korean won-denominated markets by 24-hour volume, behind only Tether and Bitcoin. More telling: combined Upbit and Bithumb bids within 1% of spot outweigh asks by roughly two to one, a 34% gap in favor of buyers. That is not noise, that is deliberate accumulation posture from Korean retail.
The bounce is real. Whether it breaks the channel is a separate question, and the answer has direct implications for where capital rotates next.
Discover: Everyone’s Got a Take. Get Free $25 to Actually Trade Yours
XRP Price Prediction: Can XRP Price Break the 80-Day Downtrend This Week?
XRP’s 24-hour range has been tight, $1.0701 to $1.0841, with the XRP price currently sitting at $1.0732. The 7-day range tells a wider story, roughly $1.07 to $1.18, mapping cleanly to 2 zones traders are watching.
Support at $1.07-$1.08 has absorbed selling pressure over multiple sessions. Resistance at $1.15 to $1.18 is where every recent rally attempt has stalled.
The defining technical factor right now is the falling channel that has capped XRP since May 14. Day-to-day wicks inside that structure are largely noise.

A daily close above the upper channel boundary, somewhere in the $1.15 to $1.18 zone depending on the channel’s trajectory, would be the first confirmation of a genuine trend shift. Until then, each bounce is a probe, not a reversal.
A confirmed daily close above $1.18 breaks the channel and reopens the path toward $1.30 and beyond, with Korean bid depth suggesting buyers are positioned for exactly that scenario.
XRP oscillating in the $1.07 to $1.15 band while broader macro data keeps institutional risk appetite suppressed is the more likely near-term path. A daily close below $1.07 breaks the local floor, exposes the $0.98 to $1.00 zone, and invalidates the accumulation thesis entirely.
Volume at current levels does not signal conviction either way. A breakout without volume expansion of at least 40 to 50% above the 7-day average should be treated with skepticism. The channel break is the signal. Confirmation is everything.
Discover: Your Market Calls Are Worth Something. Start With Free $25 on Kalshi
LiquidChain Could be The XRP of This Cycle
XRP is holding support and showing demand-side strength in Korea, but at a $68 billion market cap, the asymmetric upside that early crypto allocators chased simply isn’t here anymore.
That math is straightforward. For traders tracking this rally and considering where asymmetry actually lies right now, the infrastructure presale space is worth a closer look.

LiquidChain ($LIQUID) is a Layer 3 infrastructure project positioning itself as the cross-chain liquidity layer, fusing liquidity from Bitcoin, Ethereum, and Solana into a single execution environment.
The architecture includes a Unified Liquidity Layer, Single-Step Execution, Verifiable Settlement, and a Deploy-Once model that lets developers access all three ecosystems without redeployment overhead.
The presale is currently priced at $0.01486 per $LIQUID, with $929,335.42 raised to date. The project’s fundraising trajectory has already drawn attention as it nears the $1 million milestone. As with any early-stage presale, smart-contract risk and execution uncertainty are live considerations; DYOR applies here more than anywhere.
Discover: Get Paid to Be Right, $25 to Start on Kalshi
The post Korean Buyers Are Stacking XRP 2-to-1 Against Sellers: XRP Price Prediction Says 80-Day Downtrend About to Break? appeared first on Cryptonews.
The primary cryptocurrency rose 1.5% in the last 24 hours and currently trades at around $63,500, even as Strategy announced its third BTC sale this year.
However, three important signals point to a potential pullback forming beneath the surface.
The Factors in Question
The renowned analyst Ali Martinez revealed that over 20,000 BTC (worth more than $1.2 billion) have hit exchanges in the past week or so. CryptoQuant’s data shows that the total figure has climbed to around 2.72 million, the highest since the start of July.
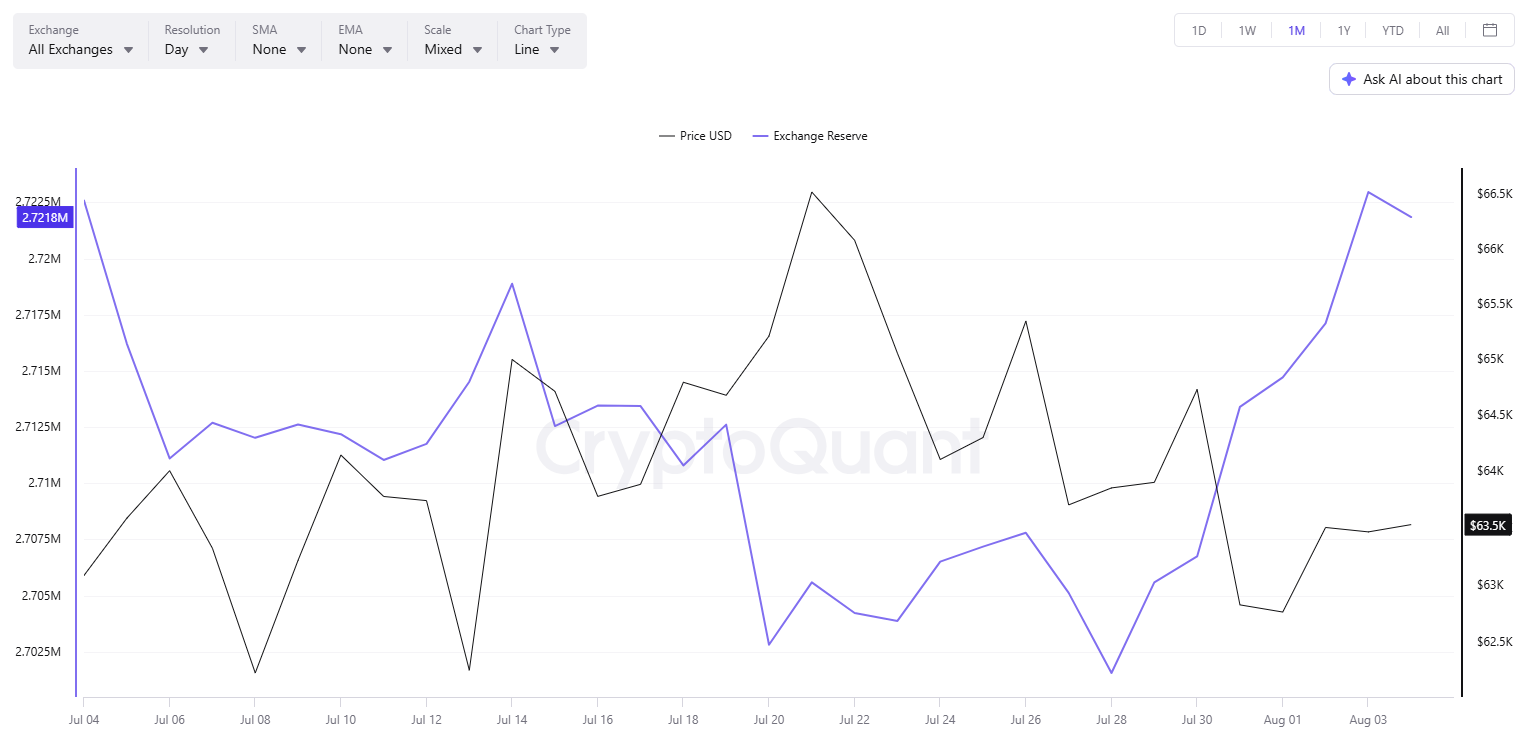
This suggests that some investors have abandoned self-custody methods and flocked to centralized platforms, increasing immediate selling pressure, or, as Martinez said:
“When coins move onto trading platforms, it often signals rising sell-side pressure. Keep an eye on this trend.”
It’s worth noting, though, that there might be another reason why investors are sending BTC to exchanges. The recent Coldcart saga has rattled trust in self-custody methods, which could lead to more bitcoin sitting on trading platforms, not necessarily for immediate selling.
Martinez also presented a second bearish signal, noting that BTC miners have sold roughly 1,774 units (worth around $112 million) over the past week. He argued the move signals another wave of profit-taking and something that could negatively impact the asset’s valuation in the short term.
The third factor is Bitcoin’s seasonal performance. The asset has finished August in red territory 9 out of 13 times, adding further uncertainty amid the challenging times.
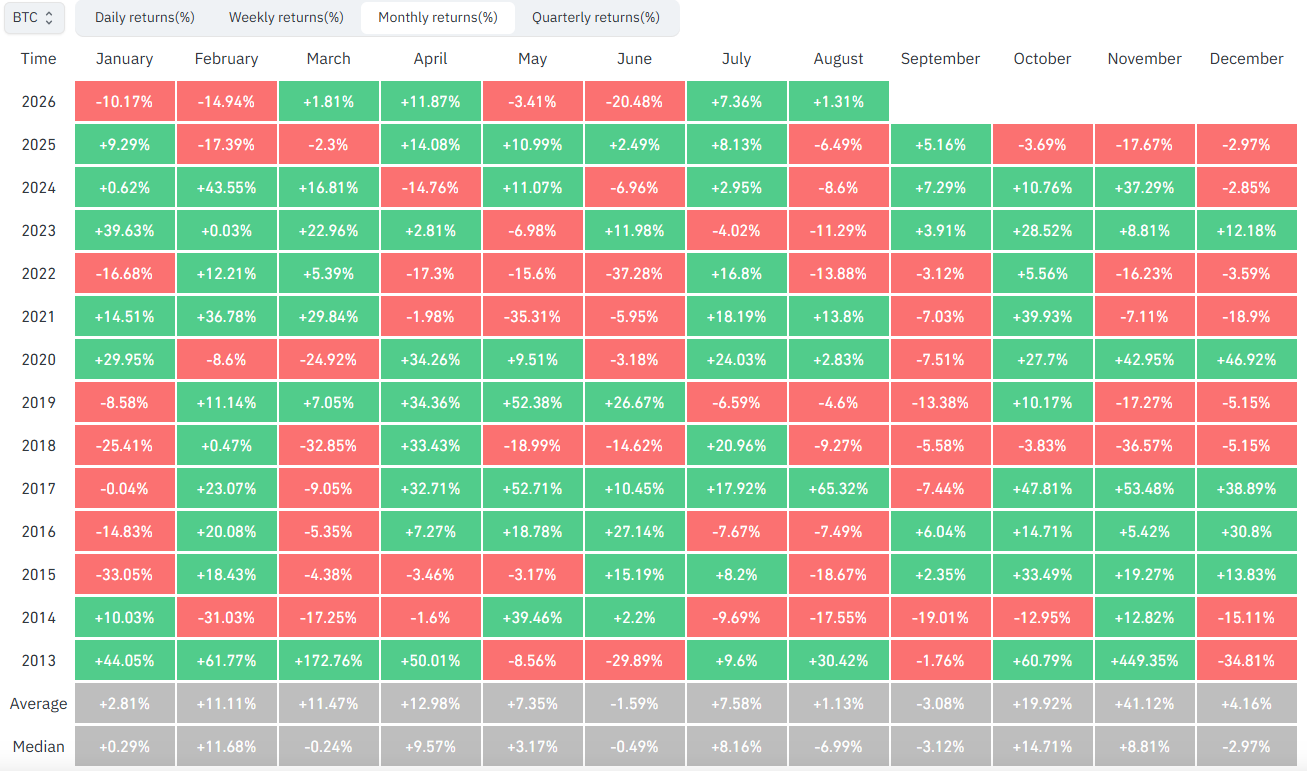
Final Flushout This Month?
Many analysts believe that the bear market is far from being over, expecting BTC to collapse to multi-year lows in the following weeks. X user Rekt Fencer spotted the formation of a potential final bull trap, which could result in a major crash to around $30,000 later in August.
Not long ago, Martinez presented a rather controversial theory. He claimed that bulls should actually welcome a potential dip to $60K since it could validate a classic inverse head-and-shoulders pattern that might push BTC to as high as $74,000. According to MikybullCrypto, the setup has already been completed:
“Breakout is next. $80K is the magnet target.”
The post 3 Signs Bitcoin (BTC) Could Be Ready for Another Pullback appeared first on CryptoPotato.

A former supervisory FBI agent, Patrick Steven Yaroch, has been charged after prosecutors said he used internal agency systems to obtain credentials for cryptocurrency wallets linked to an adversarial country and then routed funds to his own accounts. The case, detailed in a U.S. federal court filing, highlights how quickly sensitive access credentials can become a direct vector for financial theft in the crypto era.
According to the filing referenced in court documents, Yaroch admitted to 10 unauthorized transfers carried out between late 2024 and early 2025, involving an estimated total of about $1 million in digital assets. Prosecutors said some of the stolen funds were deposited into Suilend to generate yield.
Key takeaways
- Prosecutors allege Yaroch used FBI internal systems to obtain wallet credentials tied to an adversarial country.
- Yaroch admitted to 10 unauthorized crypto transfers between late 2024 and early 2025, totaling roughly $1 million.
- Authorities reportedly recovered devices, seed phrases, and a Trezor wallet used to access accounts on Suilend and on the Kraken exchange.
- Roughly $925,000 was transferred to government-controlled wallets with Yaroch’s cooperation.
- The filing also describes Yaroch using ChatGPT for investment-related advice in May, underscoring the role of opportunistic decision-making amid ongoing access misuse.
Unauthorized wallet access and yield strategy
The court filing says Yaroch’s actions centered on obtaining the ability to access cryptocurrency wallets associated with an adversarial state and using those credentials to move funds to his own crypto wallets. The alleged scheme did not stop at transferring assets—prosecutors say he also placed at least some of the proceeds into Suilend to earn yield.
By admitting to the transfers, Yaroch effectively confirmed that the conduct was not limited to a one-time theft. The admissions, which prosecutors characterize as a sequence of unauthorized moves spanning several months, indicate he maintained control long enough to interact with decentralized finance infrastructure rather than simply cashing out immediately.
The court documents also describe that after Yaroch self-reported the incident, he was placed on administrative leave, later terminated, and then arrested within days.
How investigators say the scheme was executed
Authorities reportedly retrieved multiple items from Yaroch’s Virginia residence, including devices, seed phrases, and a Trezor wallet. Prosecutors said these materials were used to access accounts on Suilend and a crypto exchange, Kraken.
In the course of the case, investigators moved roughly $925,000 in funds into government-controlled wallets with Yaroch’s cooperation. That figure is important for investors and builders to understand: when access to wallet infrastructure and recovery material exists, the “blast radius” can be quickly reduced if authorities can act fast and gain control of the relevant custody or recovery pathways.
While the filing provides the core mechanics of access and recovery, it also implicitly underscores a broader risk for crypto systems: credential theft can be as damaging as direct hacking. If internal credentials are compromised—whether by insiders or those who obtain privileged access—the attacker’s path to funds can be short and highly efficient.
ChatGPT appears in the timeline
Prosecutors say that in May, Yaroch used ChatGPT for advice after posing a scenario about having “a million dollars” and asking how to invest or spend to maximize profit and return. The filing attributes a specific response to ChatGPT about “building a slower-living vineyard/agricultural lifestyle in places like Cilento or Portugal’s Dão region.”
Even though the exchange itself is not a prosecution theory of how the theft occurred, its inclusion in the court filing paints a picture of decision-making during a period when Yaroch had already—or soon after—secured access to assets he could control. For readers, the key takeaway is not the AI recommendation; it is the fact that illicit access can coexist with attempts to rationalize next steps using whatever tools are available.
A pattern of agent-linked crypto theft
This case adds to a small but notable series of prosecutions in which federal officials and agents are accused of misusing crypto access for personal gain.
Earlier, in 2015, former DEA special agent Carl M. Force diverted about $700,000 in Bitcoin before pleading guilty and receiving a six-and-a-half-year prison sentence, according to a DOJ statement referenced in the coverage. That case was linked to the investigation involving the dark net marketplace Silk Road.
The DOJ similarly reported that former U.S. Secret Service special agent Shaun W. Bridges stole about $350,000 in BTC in 2015, then pleaded guilty and was sentenced to six years in prison. Like the Force case, it was tied to the Silk Road investigation.
In this context, the Yaroch matter appears less like an isolated “crypto crime” and more like a recurrence of a specific vulnerability: when law-enforcement-linked access overlaps with crypto custody mechanisms—wallets, seeds, exchange accounts, and yield platforms—there is an opportunity for misuse that can be difficult to detect until after damage is done.
Earlier coverage from Cointelegraph highlighted “fake police raid” tactics connected to a $1M Bitcoin transfer, illustrating how both insider and external coercion routes have been used to move large crypto balances. Taken together, these stories suggest that crypto theft continues to evolve along two parallel tracks: technical attacks and social/credential abuse, sometimes involving high-access individuals.
What to watch next
With the alleged transfers spanning late 2024 through early 2025 and authorities already moving a large portion of funds into government control, the immediate focus will likely shift to how the court evaluates Yaroch’s admissions, the role of credential misuse, and the extent of any additional assets or counterparties involved. For crypto market participants, the practical lesson remains clear: insider credential access and wallet recovery material can convert administrative or investigative power into direct custody of funds, making rapid investigation and wallet-level response essential.
Crypto World
BTC price rises as Coldcard exploit, Strategy sales recede. ADA advances: Crypto Markets Today
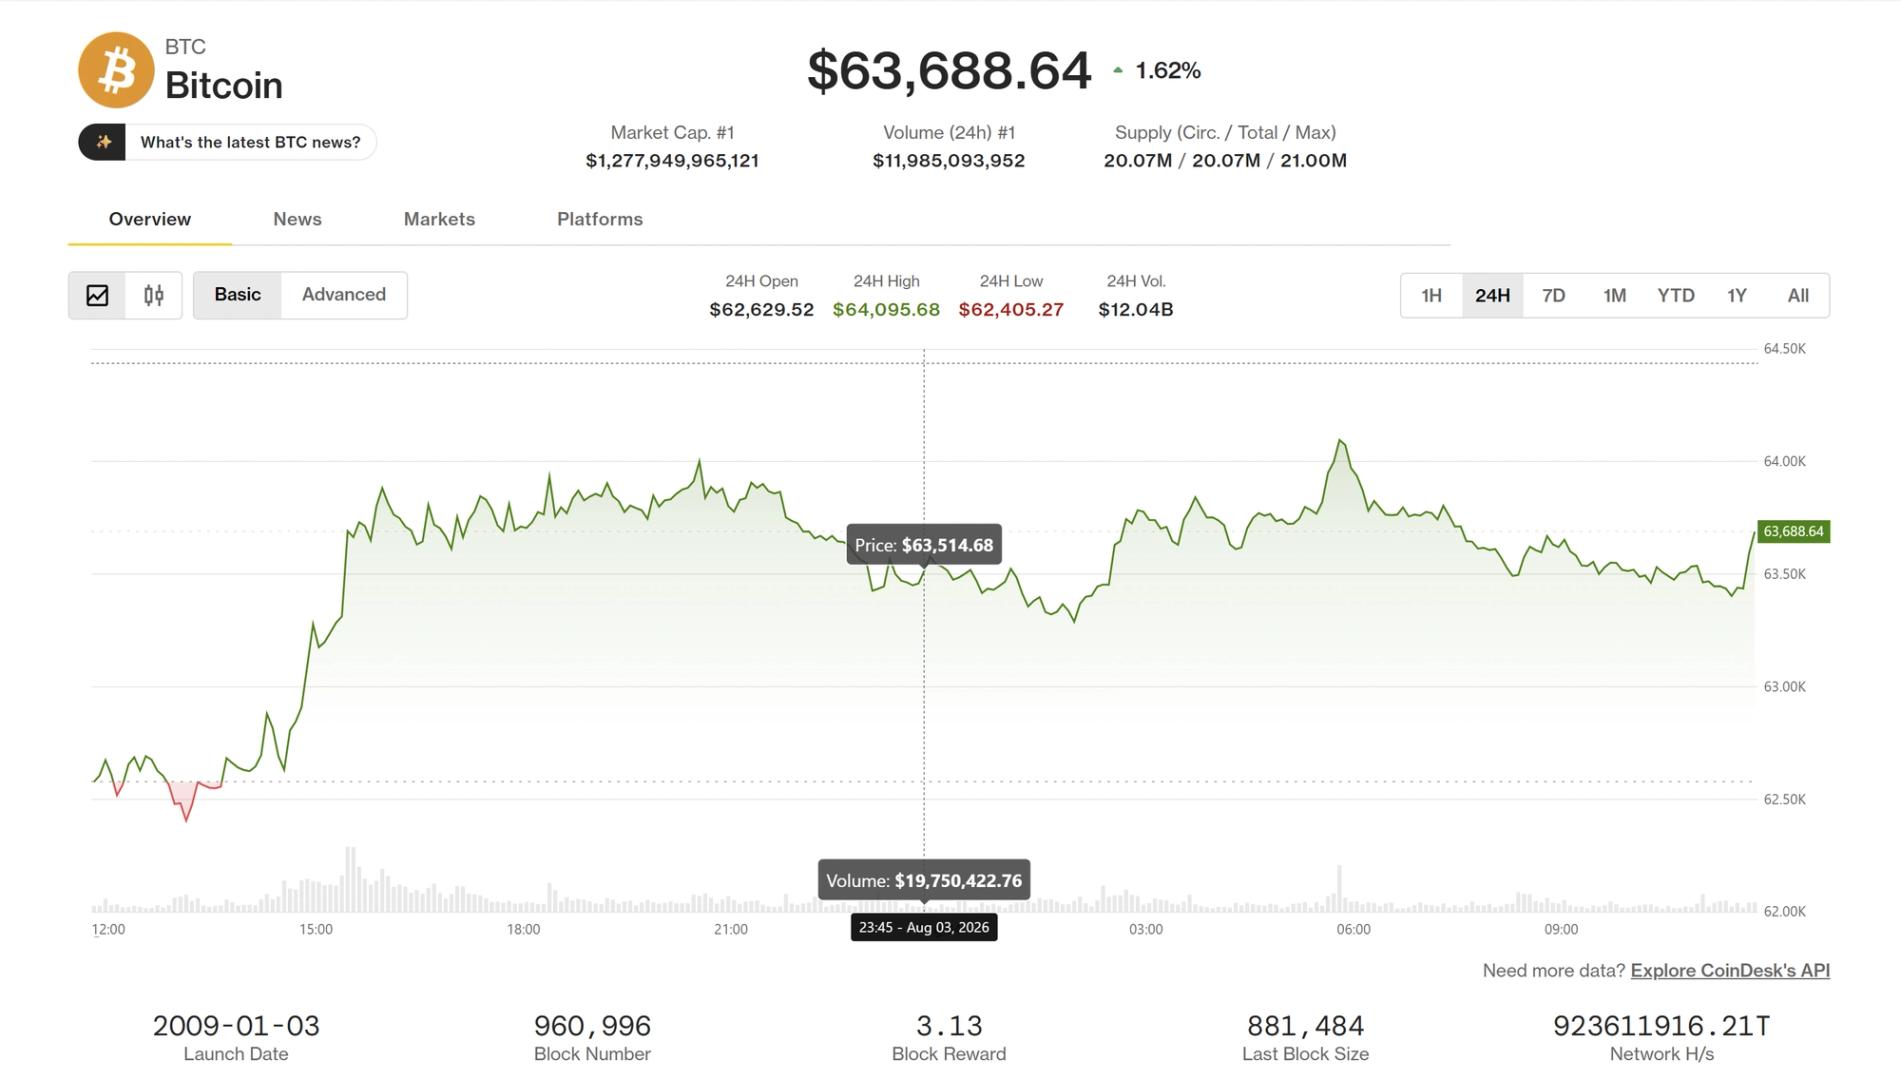
Bitcoin rose 1.6% over the last 24 hours, climbing as high as $64,160 to the highest since July 31 before retreating. The rebound followed a selloff spurred by an exploit that targeted a cold wallet over the weekend and bitcoin sales by the world’s largest corporate holder .
Roughly 1,816 BTC, about $114 million, was removed from more than 5,200 addresses since July 30, according to researchers tracking the cold wallet hack, which exploited a flaw in the Coldcard wallet’s firmware.
In addition, Strategy (MSTR) sold 1,638 bitcoin between July 27 and Aug. 2 at an average price of $63,957, its third sale of the year and below the company’s $75,419 average cost. Strategy uses the proceeds to fund dividends and buybacks on its preferred stock, STRC.
The Crypto Fear & Greed Index has dropped to “extreme fear” at 25. Spot bitcoin ETFs saw $61.5 million outflows last week, while $170 million came in yesterday. Ether ETFs saw $27.4 million inflows last week, with another $11.4 million leaving on Monday.
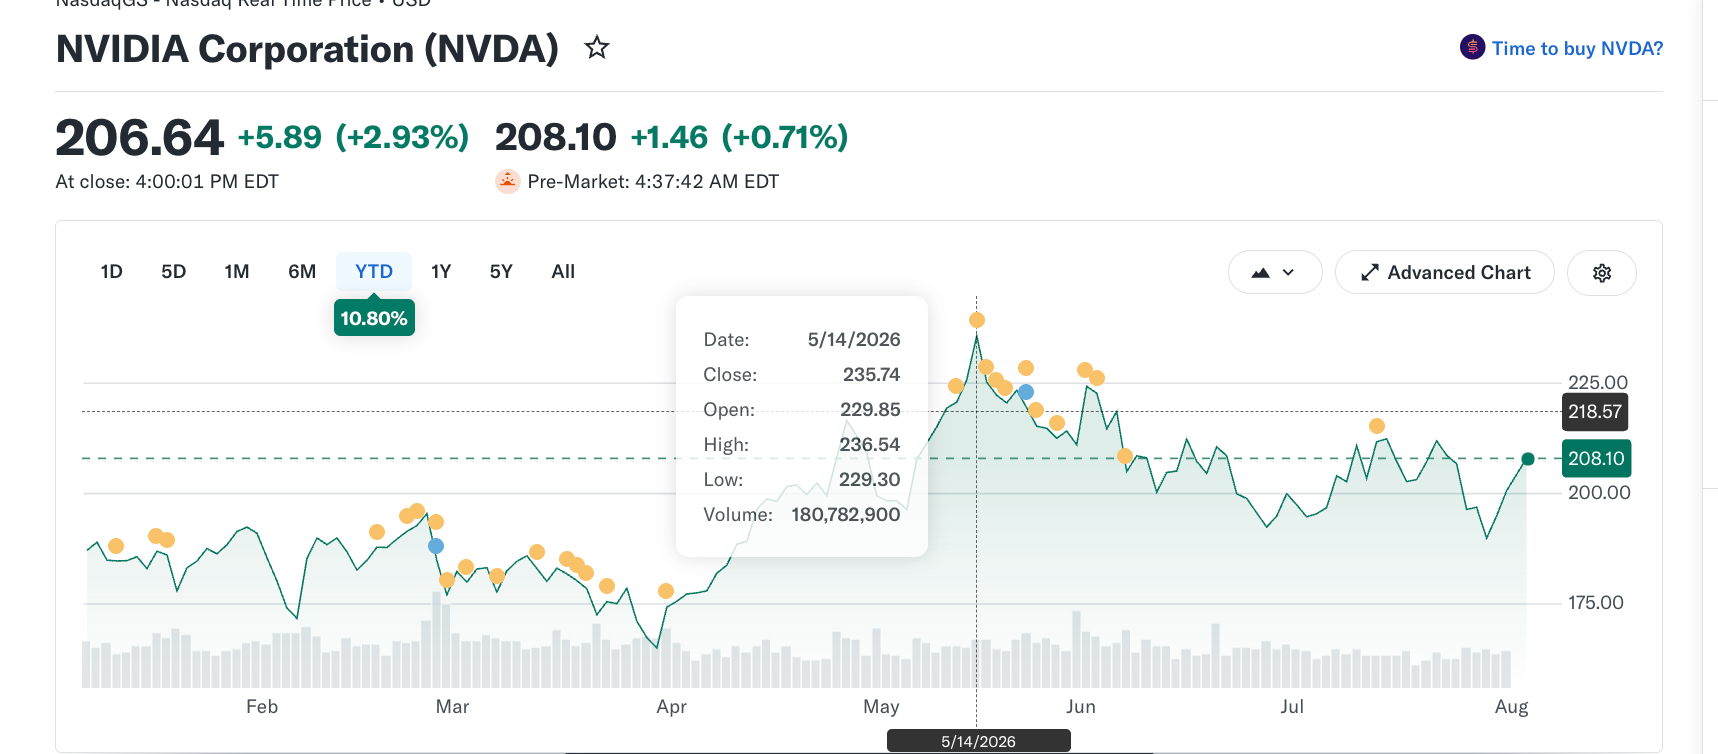
Heading into its August 26 earnings, the Nvidia stock looks strong. Nearly every analyst covering the stock rates it a buy. The shares have been higher over the past week, month, and year, and the company is expected to almost double its profit.
Nothing on the surface says caution. Yet the real risk is not on the price chart at all. It sits inside the demand everyone is celebrating, and Michael Burry, the investor who called the 2008 housing crash, has put a number on it.
The Nvidia Setup Looks Bulletproof
The tape gives the bulls everything they want. Nvidia (NVDA) has gained nearly 11% this year, bouncing from a spring low around $164 to roughly $208, even if it sits below the $236 record it set in May. The direction matters most.
The stock is now climbing into the report (starting July 29) rather than sliding into it, which usually signals the market expects good news.

The analysts are just as committed. Of the 37 firms covering Nvidia, 36 rate it a buy, one sits at hold, and not one says sell, which lands the stock at a rare Strong Buy consensus.

Their price targets point the same way. The average sits near $309, roughly 49% above where the stock trades now. The forecasts run from a low of $250 to a high of $500. Two heavyweight firms went further, as Bernstein and Wells Fargo both reiterated $315 targets days before the report.

Wall Street also expects the company to nearly double its earnings from a year ago. Moreover, the options are pricing an expected move of nearly 6% around the print.

Our look at Nvidia stock in July found the same optimism. With almost everyone already positioned for good news, even a solid quarter can fall flat. All of it rests on one assumption, that the demand is real. That is the assumption Burry attacks.
The Risk Is Inside the Results
Burry looked at where Nvidia’s demand actually comes from. The company has reportedly moved to backstop around $250 billion of debt tied to OpenAI’s data centers, helping fund the very customers who buy its chips. Put simply, it is like a shop lending you the money to buy its own goods, so the sale still counts as revenue even though the cash came from the seller.
Want more insights like this? Sign up for Editor Harsh Notariya’s Daily Newsletter here.
Burry warned that this is circular spending reaching biblical proportions, a loop in which Nvidia’s sales and its own guarantees quietly feed each other.
The uncomfortable part is who agrees.
Bernstein’s Stacy Rasgon, whose firm still rates the stock a buy at $315, has flagged the same circular-financing concern.
When the loudest bull and the loudest bear describe the same machine, the revenue line on August 26 gets harder to take at face value. The strain echoes OpenAI’s chip financing troubles from earlier this year.
Two smaller cracks sit underneath. China still holds up to $5 billion in sales that one policy shift could erase, and insiders sold roughly $410 million in stock over the past three months while the price ran high. Financing is only half the worry. The other half is whether Nvidia’s technology lead is as safe as it looks.
The Threat to Nvidia’s Lead?
DeepSeek founder Liang Wenfeng argued in remarks that spread online that new tools could lower the barriers to CUDA, the software ecosystem that keeps developers locked to Nvidia hardware. He pointed to Huawei’s Atlas 950 system as a way to take over some Nvidia workloads, though even that case admits Huawei trails by roughly two years.
Add the custom chips Google, Amazon and Meta are building in-house, and Nvidia’s dominance faces a slow squeeze rather than a sudden break.
It is the same doubt that recently weighed on beaten-down semiconductor stocks. And yet the money has not run, which turns this into a standoff rather than a verdict.
What the Big Money Is Still Doing with Nvidia Stock
Even as the warnings pile up, the flow data tells a calmer story. The Chaikin Money Flow reading, a gauge of whether institutional cash is moving into or out of a stock, shows Nvidia in accumulation rather than retreat.
This means buyers are still stepping in. Also, at press time, it is one of the two chip stocks getting institutional money.

The stock is also trading on its own terms. It has been lagging the broader SOXX semiconductor index on relative strength. In plain terms, big investors keep buying Nvidia on its own merits even as skeptics question the chips. And that split is the whole story heading into the print.

Nvidia has beaten estimates for years and its demand is still enormous. Yet, the stock trades above 30 times earnings with no room for error, and it is climbing into the report rather than hiding from it.
That is exactly when a small crack does the most damage. On August 26, the real question is not whether Nvidia beats. It is whether the demand behind that beat is as solid as 36 buy ratings make it look.
The post 36 Analysts Share Their NVIDIA Stock Forecast Before August Earnings appeared first on BeInCrypto.
Crypto World
The bitcoin (BTC) price has plenty of reasons to freak out, yet volatility remains low: Crypto Daily
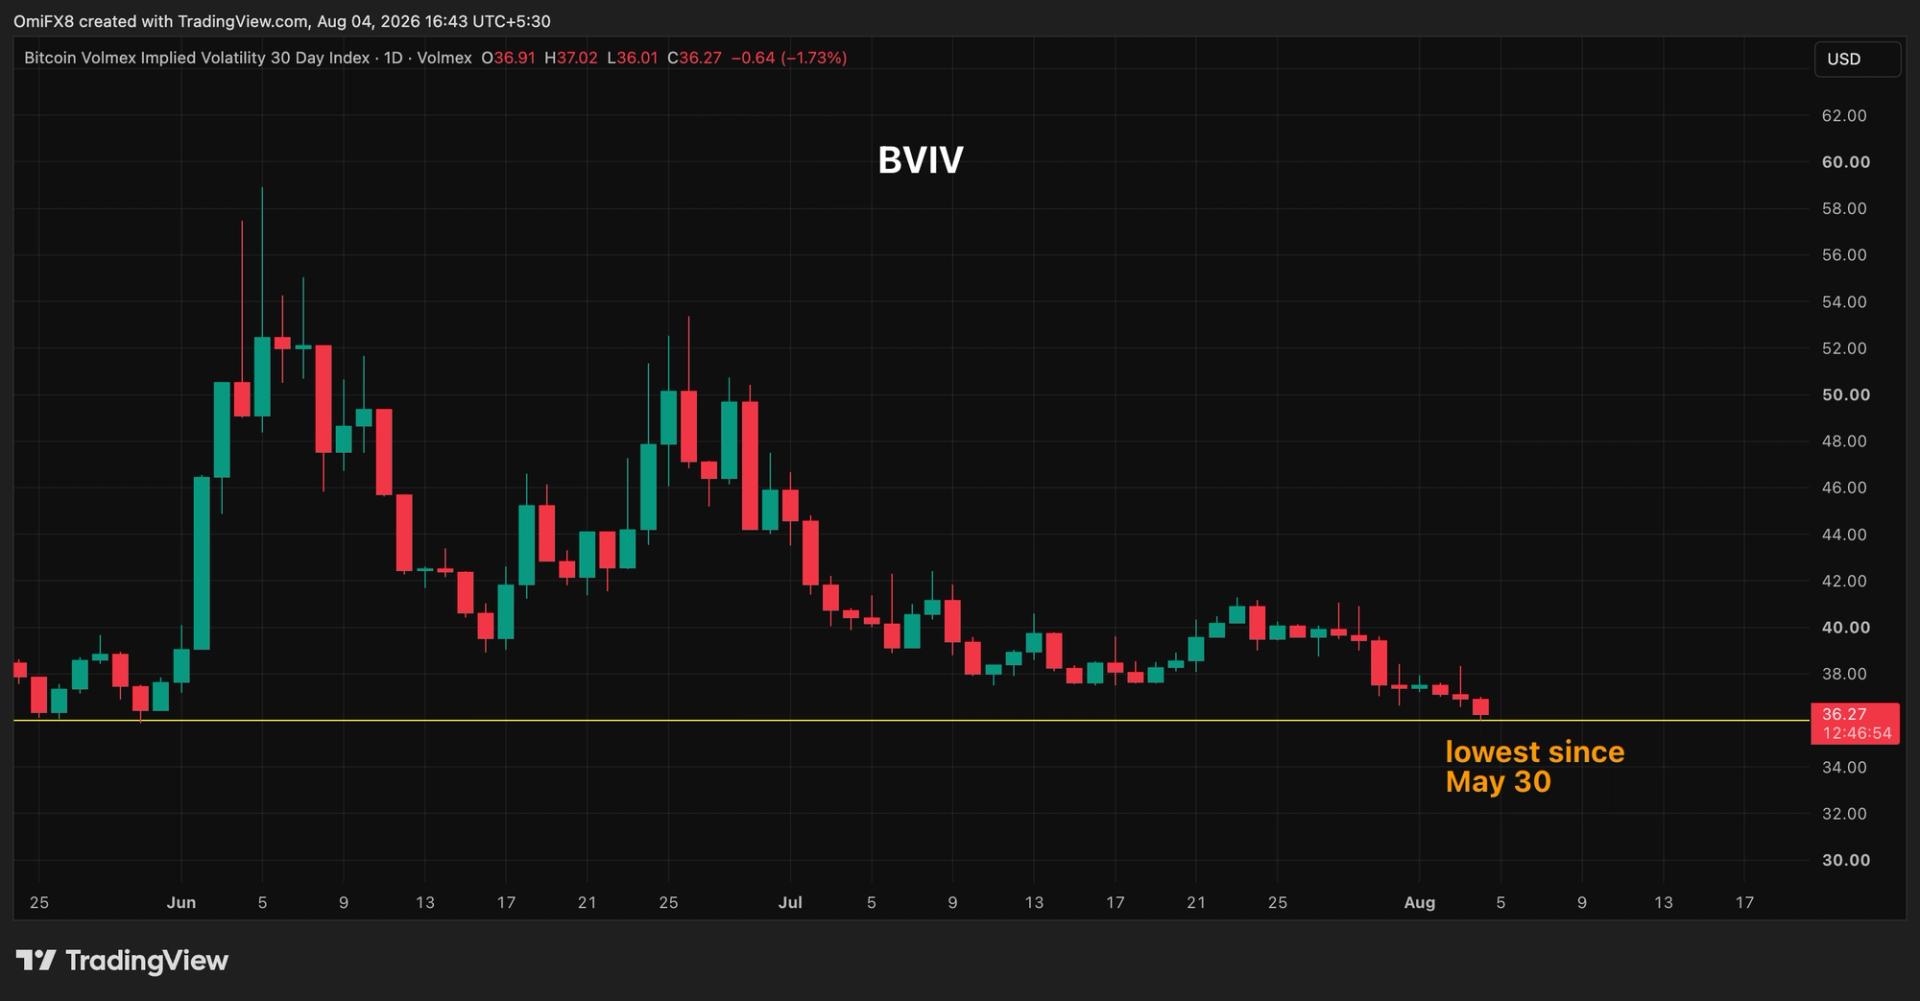
For now, some factors seem to favor the bear case. For instance, institutional demand remains anemic. The U.S.-listed spot bitcoin ETFs posted $61.53 million in outflows last week, snapping a three-week streak of tepid inflows. Moreover, USDT’s market capitalization, the largest among dollar-pegged stablecoins, fell to the lowest level since October, while USDC’s also remains in a downtrend. (check the Daily Signal).
Real or inflation-adjusted returns on longer-duration Treasury notes have risen to the highest since 2008, denting the appeal of investing in emerging technologies and risk assets. Further, the U.S. Clarity Act’s passage remains uncertain.
Still, at least one data point suggests limited downside. That is tied to the number of BTC acquired around current price levels.
“Approximately 155,000 BTC moved into the $62,000-$65,000 cost-basis range, indicating that selling was absorbed by buyers near current prices. This concentration now represents 0.7 percent of circulating supply and could keep BTC range-bound until a stronger catalyst emerges,” analysts at Bitfinex said.
Stay alert!
Read more: For analysis of today’s activity in altcoins and derivatives, see Crypto Markets Today . For a comprehensive list of events this week, see CoinDesk’s “Crypto Week Ahead.”
What’s trending
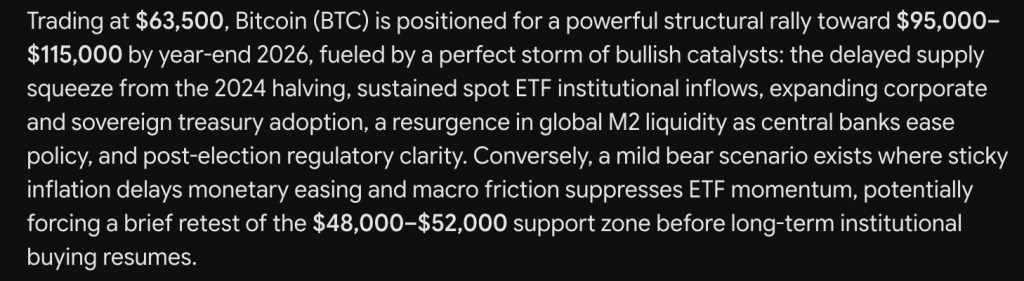
Google Gemini AI predicts a structural rally for Bitcoin, and this price prediction frames the setup as a perfect storm rather than a single catalyst. Trading at $63,500, Bitcoin is positioned for a move toward $95,000 to $115,000 by year end 2026.
The bull case stacks five forces together. The delayed supply squeeze from the 2024 halving is still working through the market. Sustained spot ETF institutional inflows keep arriving.

Corporate and sovereign treasury adoption keeps expanding. Global M2 liquidity is resurging as central banks ease policy. Post election regulatory clarity adds a final layer.
Gemini frames these as converging at once, which is what separates a structural rally from a speculative spike in the model’s own framing.
The bear scenario is described as mild but specific. Sticky inflation could delay monetary easing, and macro friction could suppress ETF momentum, potentially forcing a brief retest of the $48,000 to $52,000 support zone before long term institutional buying resumes.

Bitcoin Price Prediction: BTC USD RSI Has Been Stuck At The Same Level For Eight Months, So is Copilot AI Predicts Realistic?
Bitcoin topped near $97,000 in January before a sharp February collapse dragged price down to $60,000 in a matter of weeks. That crash set off a slow, uneven recovery that carried price back to $82,000 by May, only for a second decline to erase most of those gains by June.
Since that June low near $57,000, price has spent two months grinding sideways in a tight band, unable to build any real momentum in either direction. Price closed today at $63,406, down 0.08%, in a session ranging between $63,270 and $64,176.
Support sits at $60,000, the level defended through both the February and June lows. Resistance stacks first at $68,000, then $73,000, then the far heavier ceiling near $82,000 where the May rally failed outright.
RSI currently reads 47.19 with the signal line just above at 49.69. That is a small negative gap, and what stands out on the chart is how close both lines have stayed to the neutral 50 mark for nearly the entire year, rarely straying far in either direction.
Momentum here is essentially flat, neither building toward a breakout nor collapsing toward the bear case Gemini describes. For the $95,000 target to move from thesis to reality, Bitcoin needs to first clear $82,000, a level that has already rejected one full rally attempt this year.
You Were Right About Bitcoin. It Just Didn’t Pay.
Every trader has had the same experience. You read the analysis, you form a view, the market proves you correct, and it makes you nothing.
The problem isn’t the call. It’s the instrument. When you buy spot to express a view about one thing, you take on exposure to everything: liquidity, sentiment, unrelated flows, whatever happens in an unrelated market at 3am.
Your opinion was about a single question. Your position is exposed to all of them at once.
That’s what Kalshi is. A CFTC-regulated exchange where the prices are set by traders taking real positions, which is why the odds tend to move before the headlines do.
It isn’t free money. A contract that resolves against you goes to zero, and being directionally right on a slow timeline still loses if the contract expires first. Event trading pays for precision about timing, not just direction.
But the analysis above was free. What you do with it doesn’t have to be.
→ Get up to $25 to trade your first market on Kalshi
Don’t Miss Out on Our $1,000 USDT Airdrop on ByBit
The post Google Gemini AI Predicts the Price of Bitcoin by The End of 2026 appeared first on Cryptonews.

Kalshi makes partnership with Comply, compliance tech company

Access Hollywood’s Kit Hoover Debuts New Romance Amid Divorce

Desperate US military asks analysts to brainstorm ways to beat Iran


-

 Business6 days ago
Why Trees Belong on the Risk Register
-

 Fashion4 days ago
Weekend Open Thread: Wit & Wisdom
-

 Politics4 days ago
Meta enters AI-training agreement with far-right ‘propaganda rag’ Newsmax
-
 Entertainment7 days ago
‘Stargate’ Creator’s New Sci-Fi Series Returns for Season 3 Tomorrow
-
 Crypto World3 days ago
MicroStrategy Post-Earnings CLARITY Act Push Could Add New Catalyst for Its Stock
-

 Politics6 days ago
Reform UK betrays West Mids residents by running from party pledges
-

 Business6 days ago
Major shareholder moves on Canyon
-

 Crypto World3 days ago
XRP Ledger v3.3.0 brings five institutional features
-

 News Videos5 days ago
Bitcoin Enters the 3rd Stage of the Bear Market
-

 Crypto World7 days ago
Kraken Enables Retail Access to Jersey Mike’s IPO via Tokenized Shares
-

 Politics5 days ago
Luke Littler’s dominance sparks GOAT debate
-

 Sports4 days ago
Seema Kaliramna Wins Discus Throw Bronze, Takes India’s CWG Medals Tally To 17
-

 News Videos7 days ago
Claude: Build Financial Dashboards in Minutes (2026)
-

 Crypto World2 days ago
Crypto PAC spending tops $2M in Michigan House race
-

 Crypto World3 days ago
New York sues Kalshi over prediction market gambling
-

 Business7 days ago
Johnson & Johnson agrees to $5.5B settlement over talc cancer claims
-

 Business4 days ago
Trump Announces Hamas Disarmament Agreement as Iran Strikes Kuwait Air Base and US Attacks Pause Overnight
-

 Politics2 days ago
Zack Polanski: an incitement to murder Nigel Farage?
-

 Tech6 days ago
Gemini can now summarize the messiest comment threads in Google Docs
-

 Tech2 days ago
ESET tracks rise in malicious AI skills and adaptable malware
You must be logged in to post a comment Login