
Crypto World
Bitcoin Price Bounce Triggers Crash Risk to $58,000?
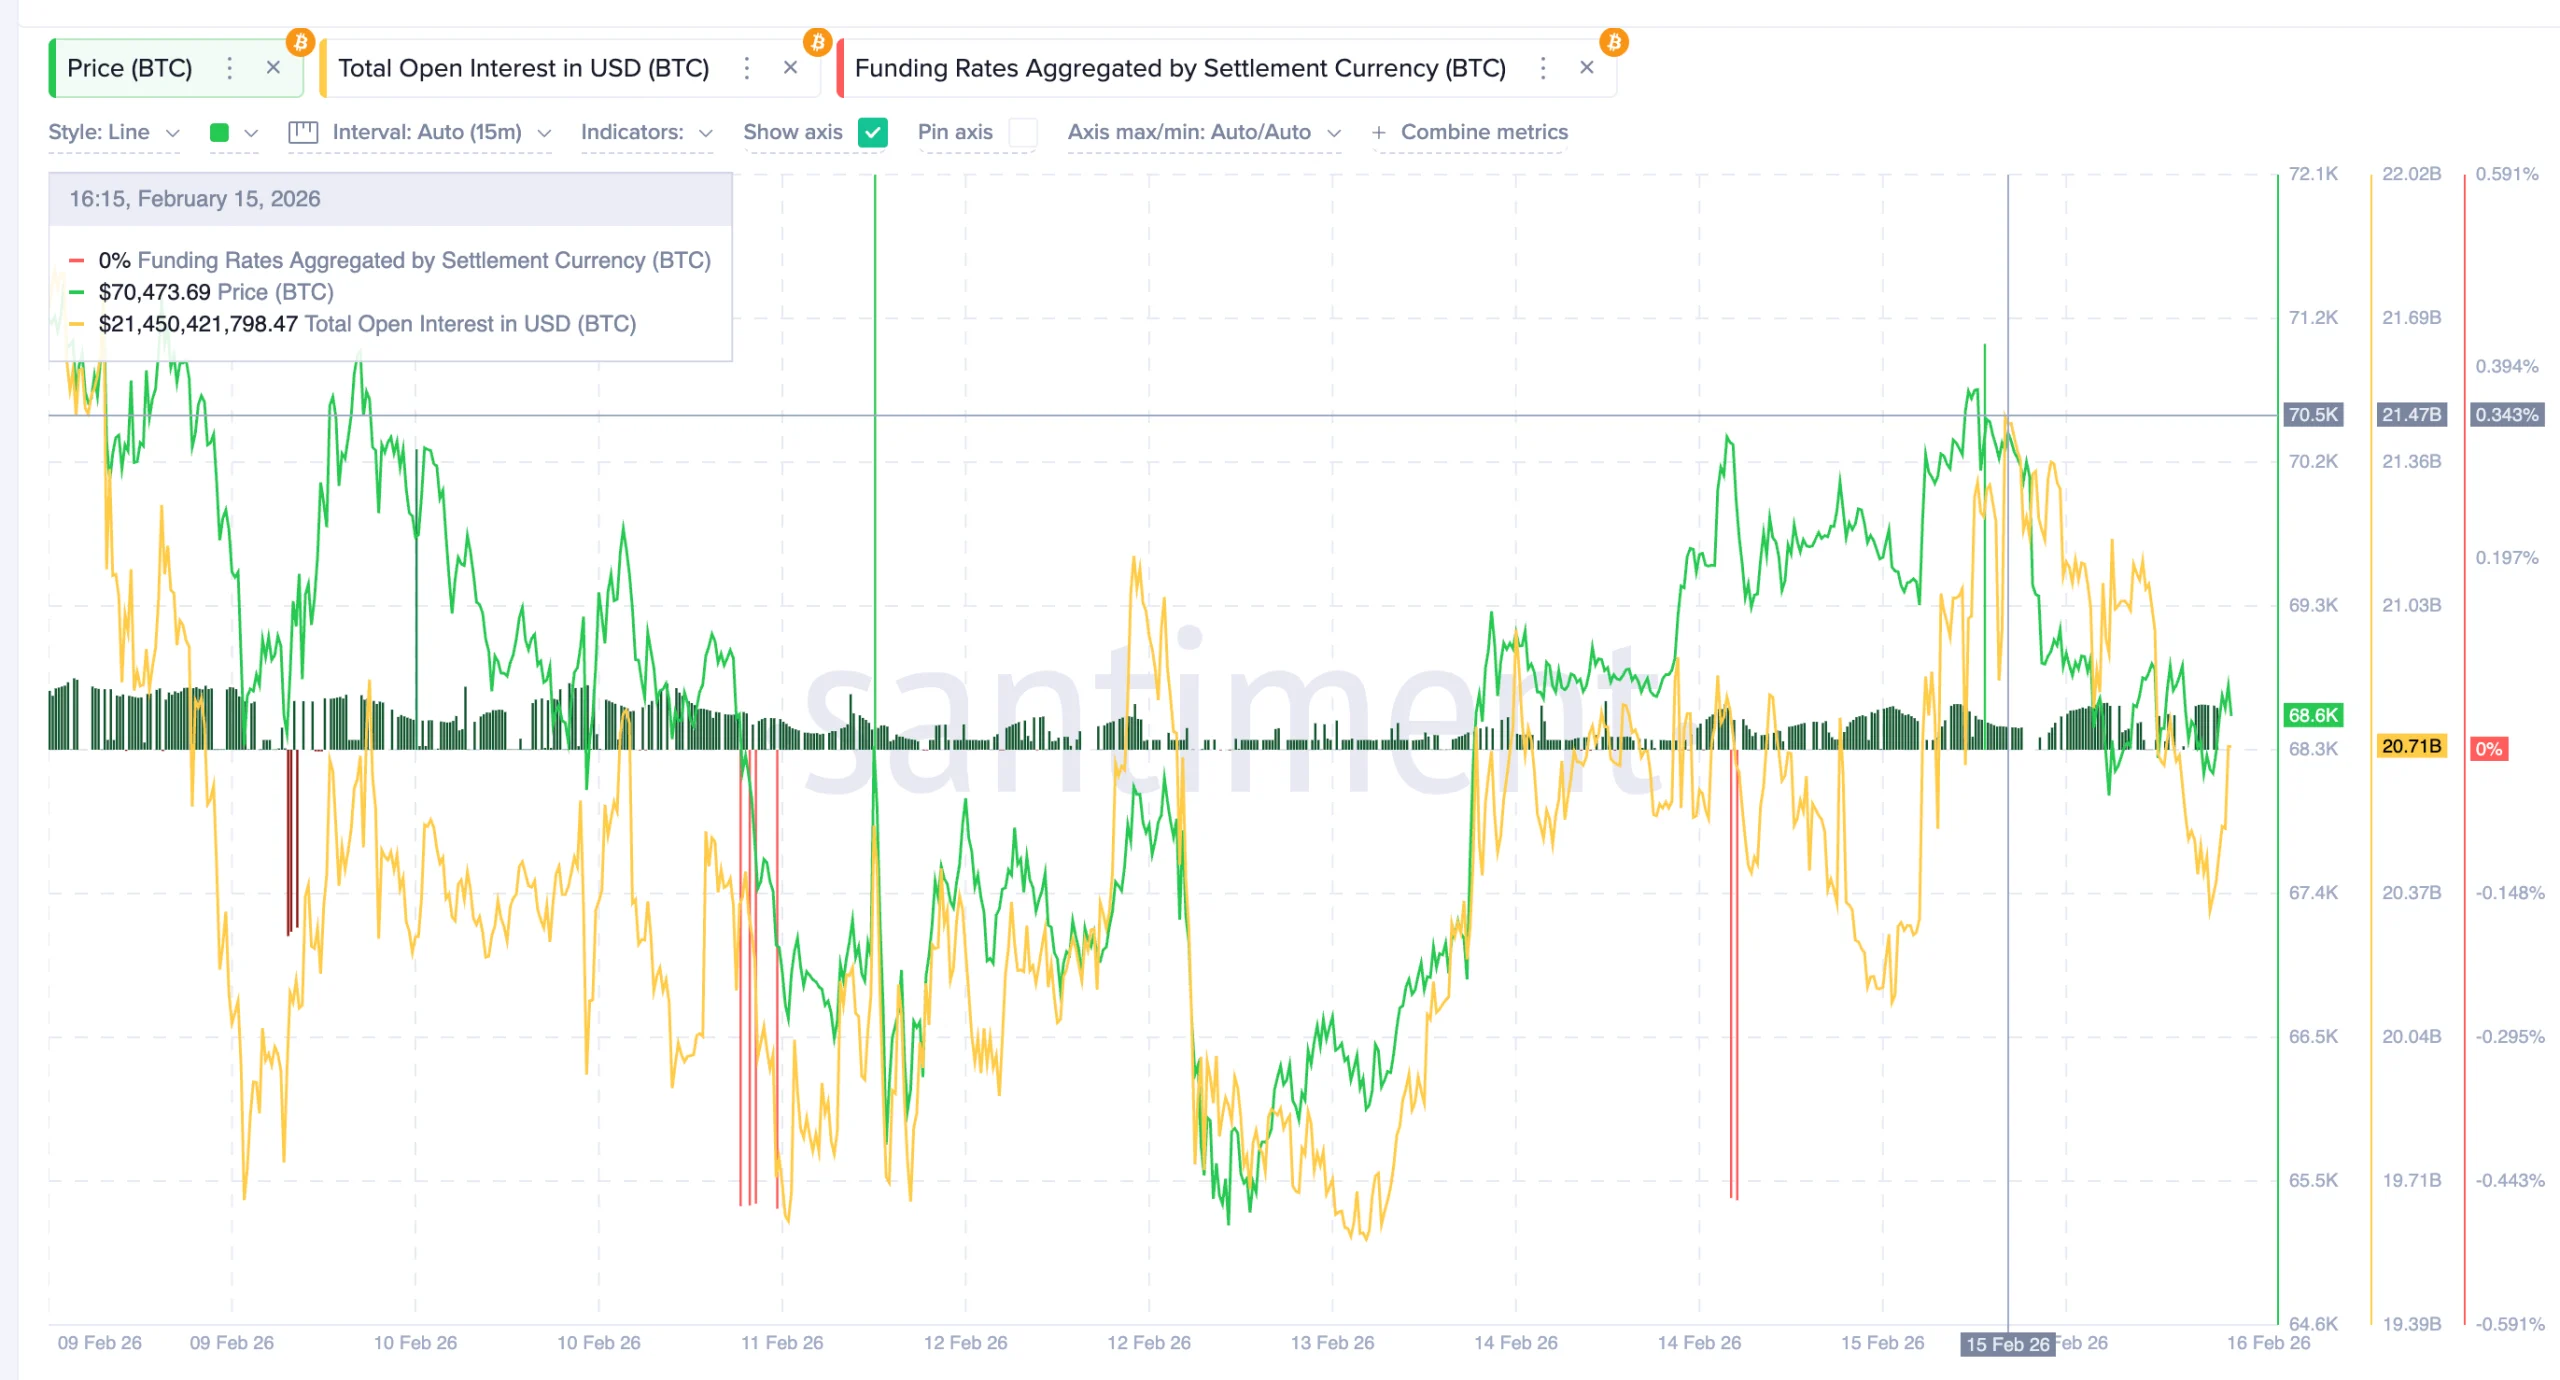
BTC’s recent recovery may be hiding a dangerous signal. The Bitcoin price bounced nearly 9% between February 12 and February 15, giving the impression that the worst of the correction was over.
But the rebound is already weakening. Now, leverage data, momentum signals, and on-chain profit trends suggest the bounce may have increased crash risk instead of ending it.
Sponsored
Sponsored
Bitcoin’s 9% Bounce Drew Nearly $2 Billion in Long Bets
Between February 12 and February 15, Bitcoin climbed roughly 9%. At the same time, futures traders aggressively positioned for further upside. Total open interest, which tracks the total value of active futures contracts, rose from $19.59 billion to $21.47 billion. This was an increase of about $1.88 billion, or roughly 9.6%, between February 13 and February 15.
This increase did not happen in isolation. Funding rates also turned strongly positive, rising toward +0.34%. The funding rate is the fee paid between long and short traders. When it is positive, long traders pay short traders. This shows that most BTC traders were betting on prices rising.
Want more token insights like this? Sign up for Editor Harsh Notariya’s Daily Crypto Newsletter here.
Together, rising open interest and positive funding rates confirmed that the market was positioning for a larger recovery. But the larger chart structure reveals a critical problem.
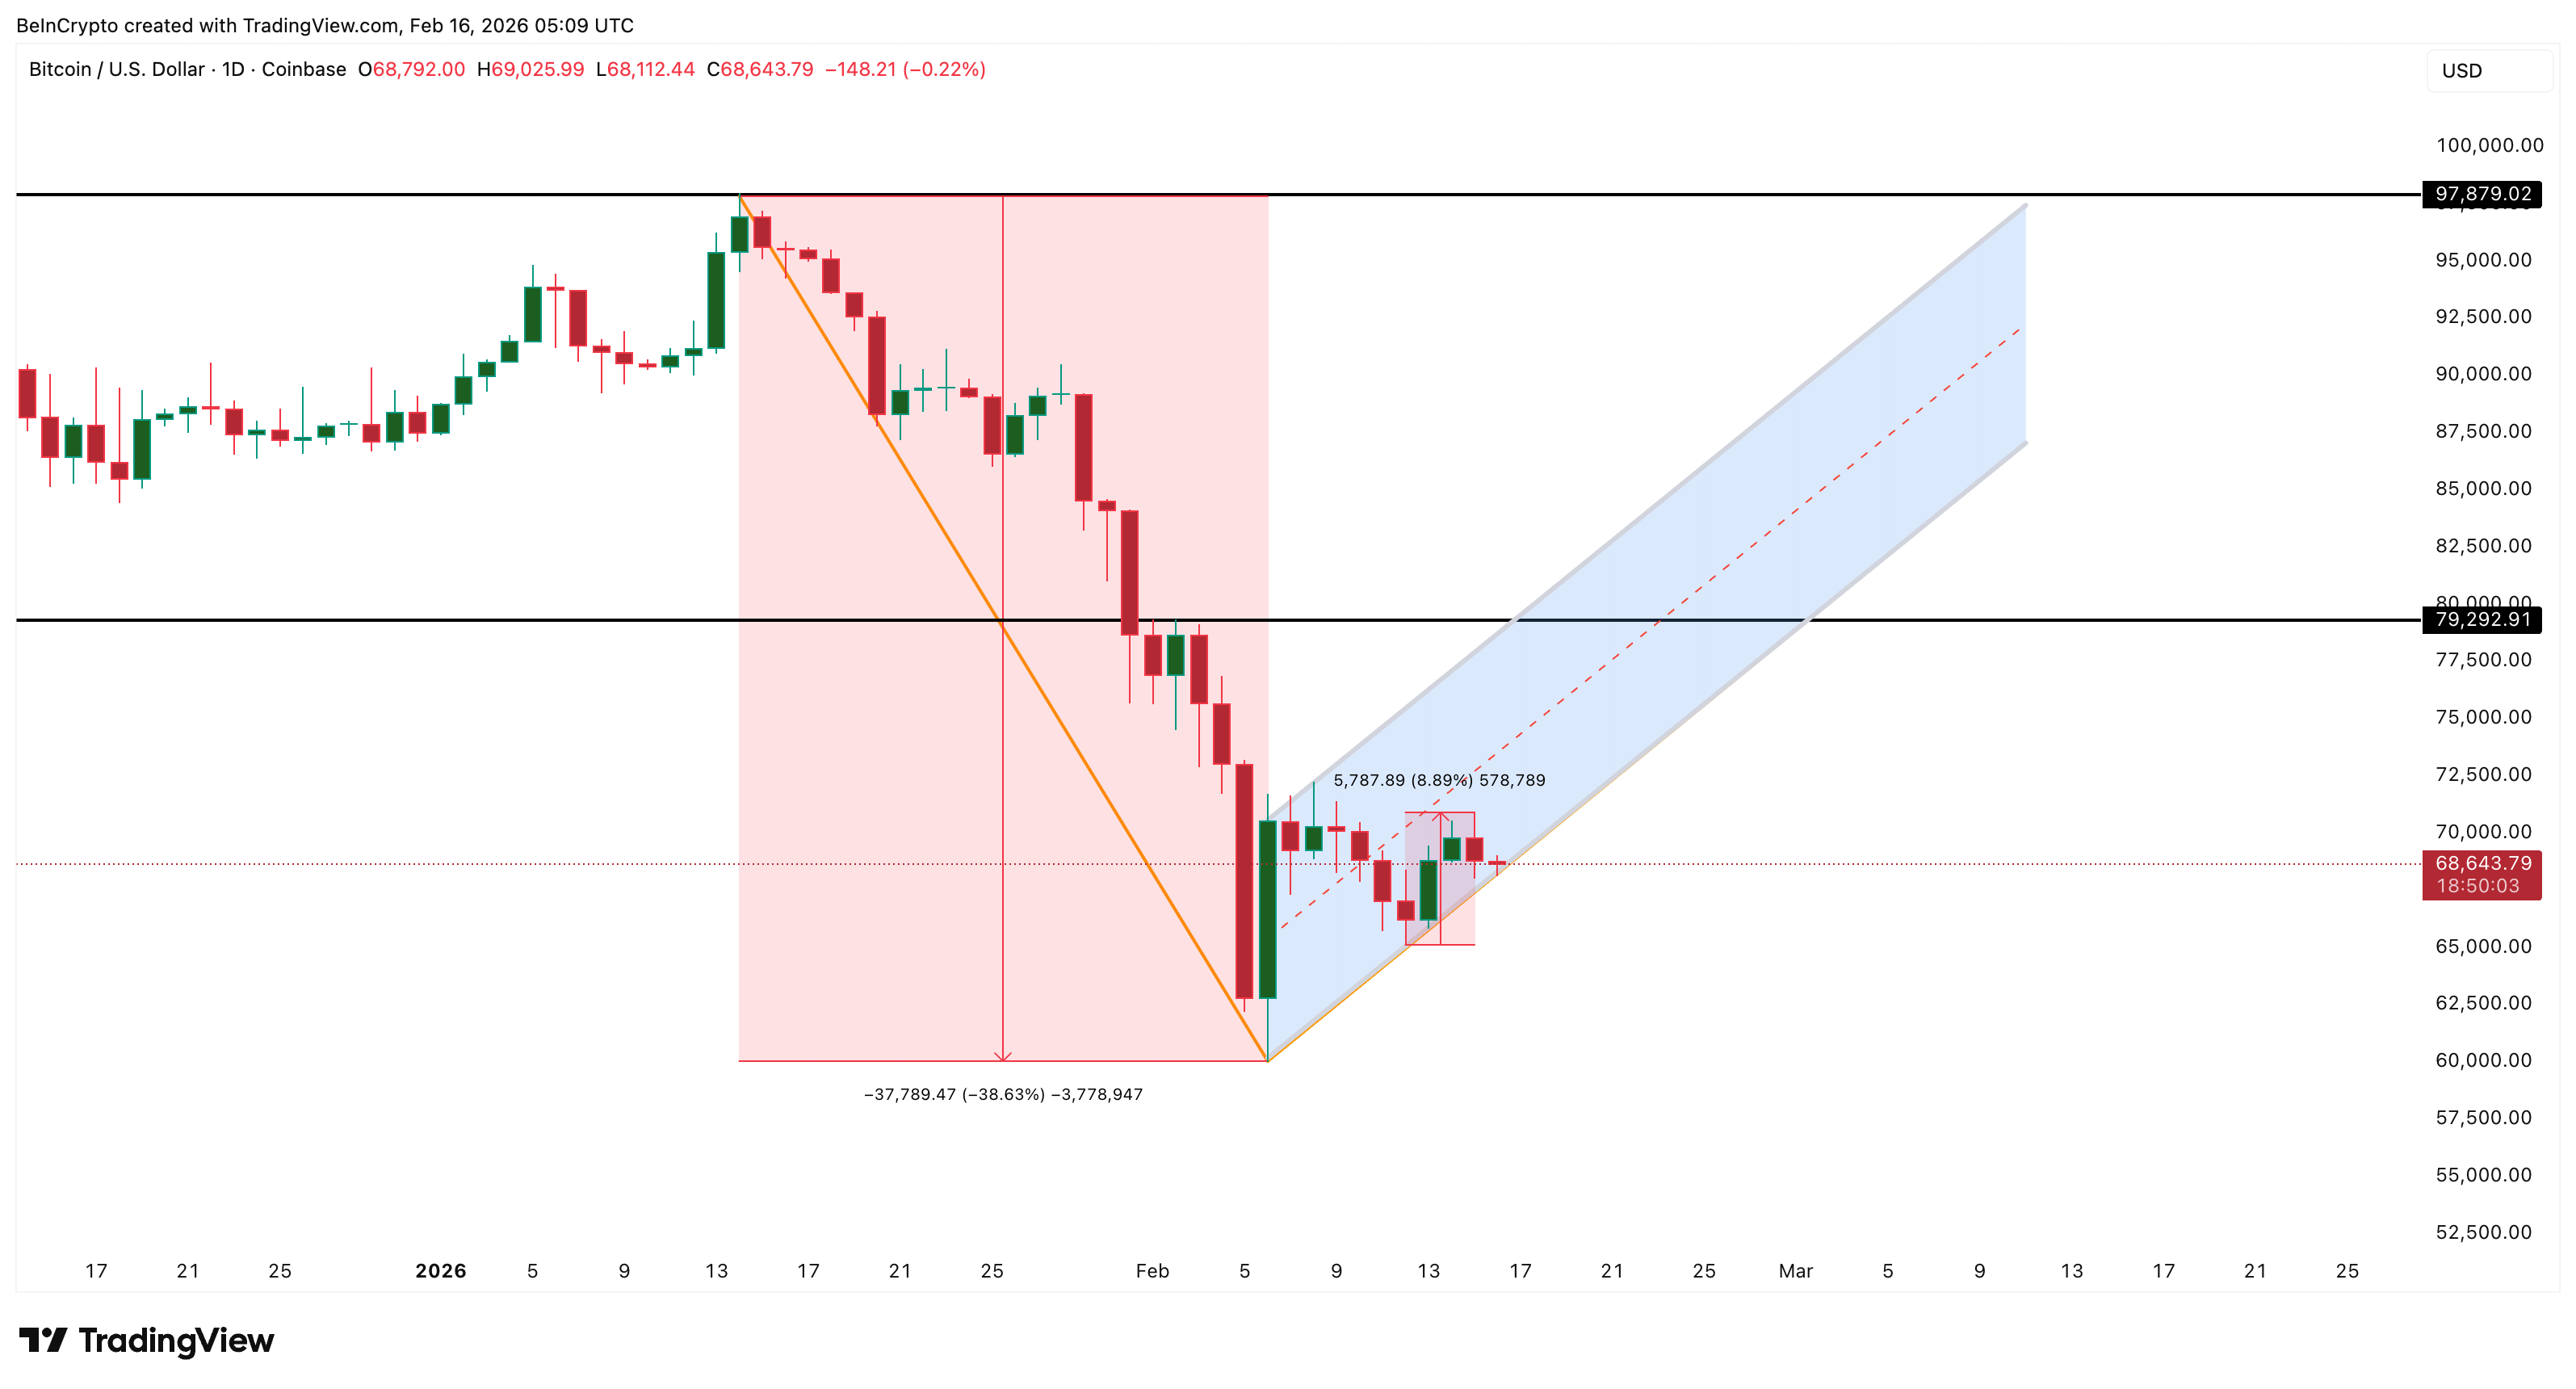
This entire rebound happened inside a bear flag pattern. A bear flag forms when the price rises slowly after a sharp drop but remains inside a downward continuation structure. It often acts as a pause before another decline.
Sponsored
Sponsored
The recent rejection near the local peak and the ongoing pullback now show that Bitcoin is still trading inside this bearish pattern. Price is already drifting toward the lower boundary of the flag. If this lower support breaks, the next leg of the weakening Bitcoin price prediction could begin.
Hidden Bearish Divergence and 90% Profit Surge Show Sellers Are Returning
Momentum indicators are now starting to confirm this growing weakness. On the 12-hour chart, Bitcoin formed a hidden bearish divergence between February 6 and February 15.
During this period, the price formed a lower high, meaning the recovery was weaker than the previous peak. But the Relative Strength Index, or RSI, formed a higher high. RSI measures the strength of buying and selling momentum.
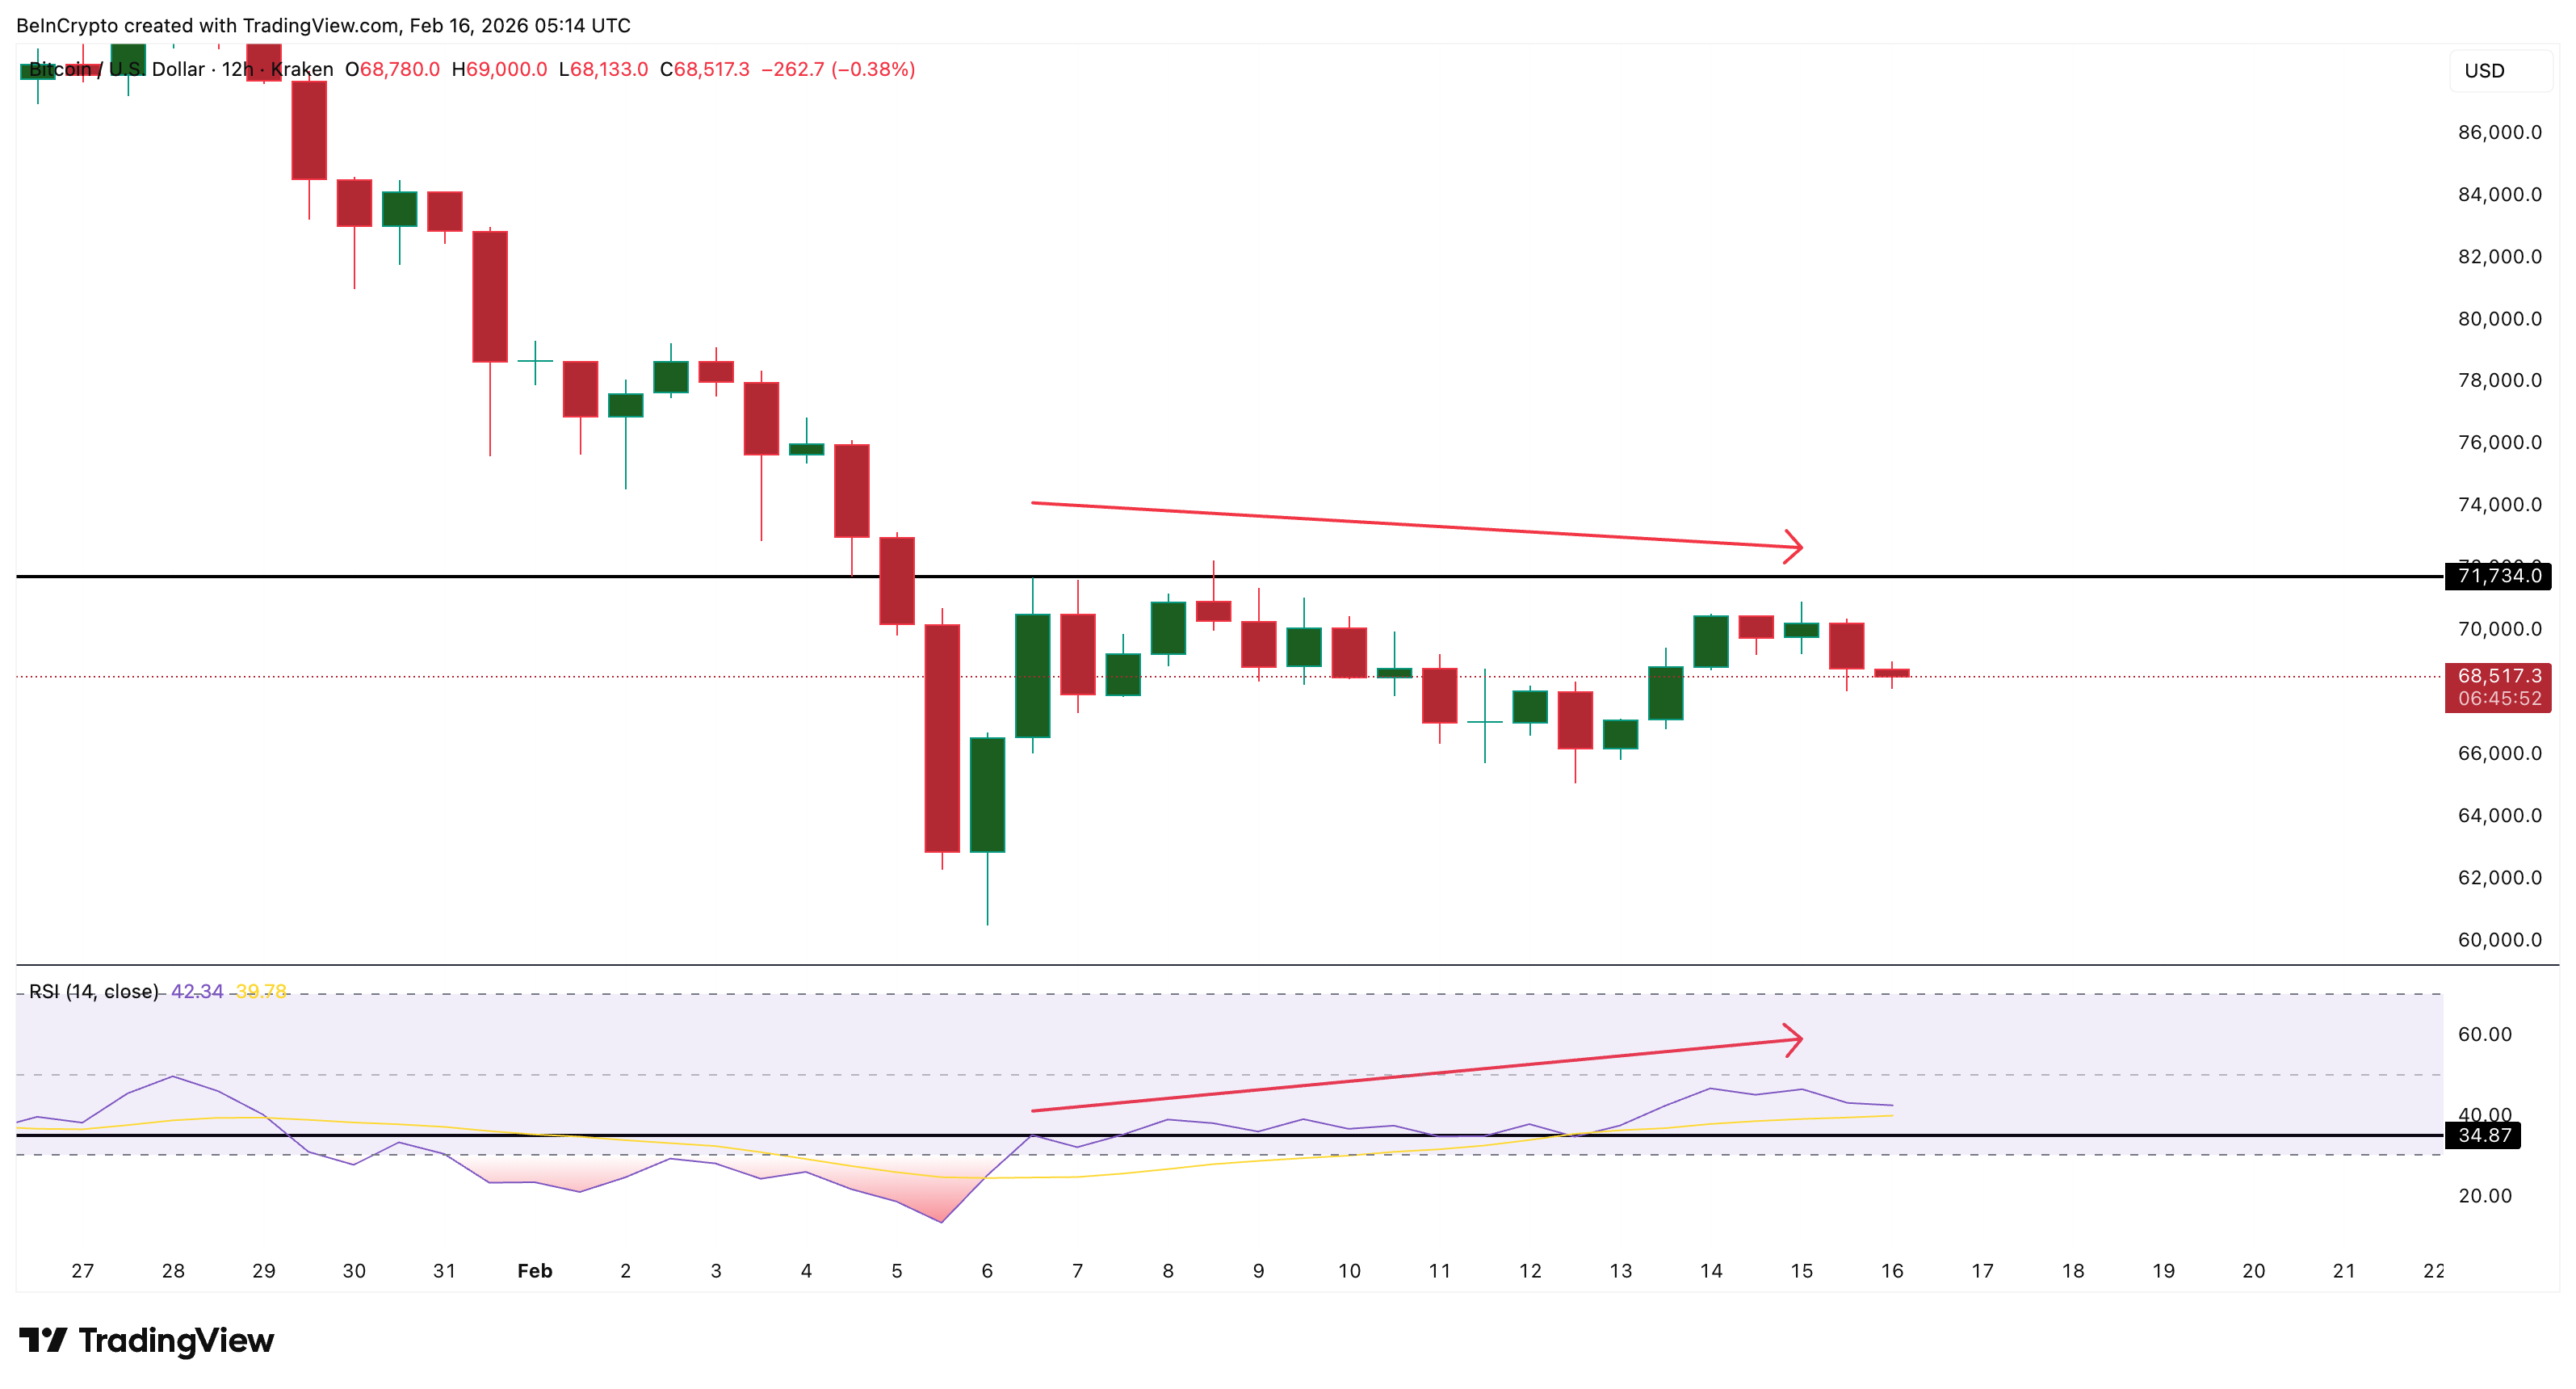
This combination is called hidden bearish divergence. It usually appears when buying momentum rises temporarily, but the overall trend remains weak. It signals that sellers are quietly regaining control. Shortly after this signal appeared, Bitcoin’s pullback began.
Sponsored
Sponsored
At the same time, on-chain profit data surged sharply, creating another warning sign. Bitcoin’s Net Unrealized Profit/Loss, or NUPL, rose from 0.11 on February 5 to 0.21 on February 14. This was an increase of about 90%. It is currently moving near the same zone, at press time.
NUPL measures the average unrealized profit across all Bitcoin holders. It shows how much profit investors are holding on paper. When NUPL rises sharply, it means many investors are suddenly back in profit, even if it is a small amount. This increases the risk of profit-taking.
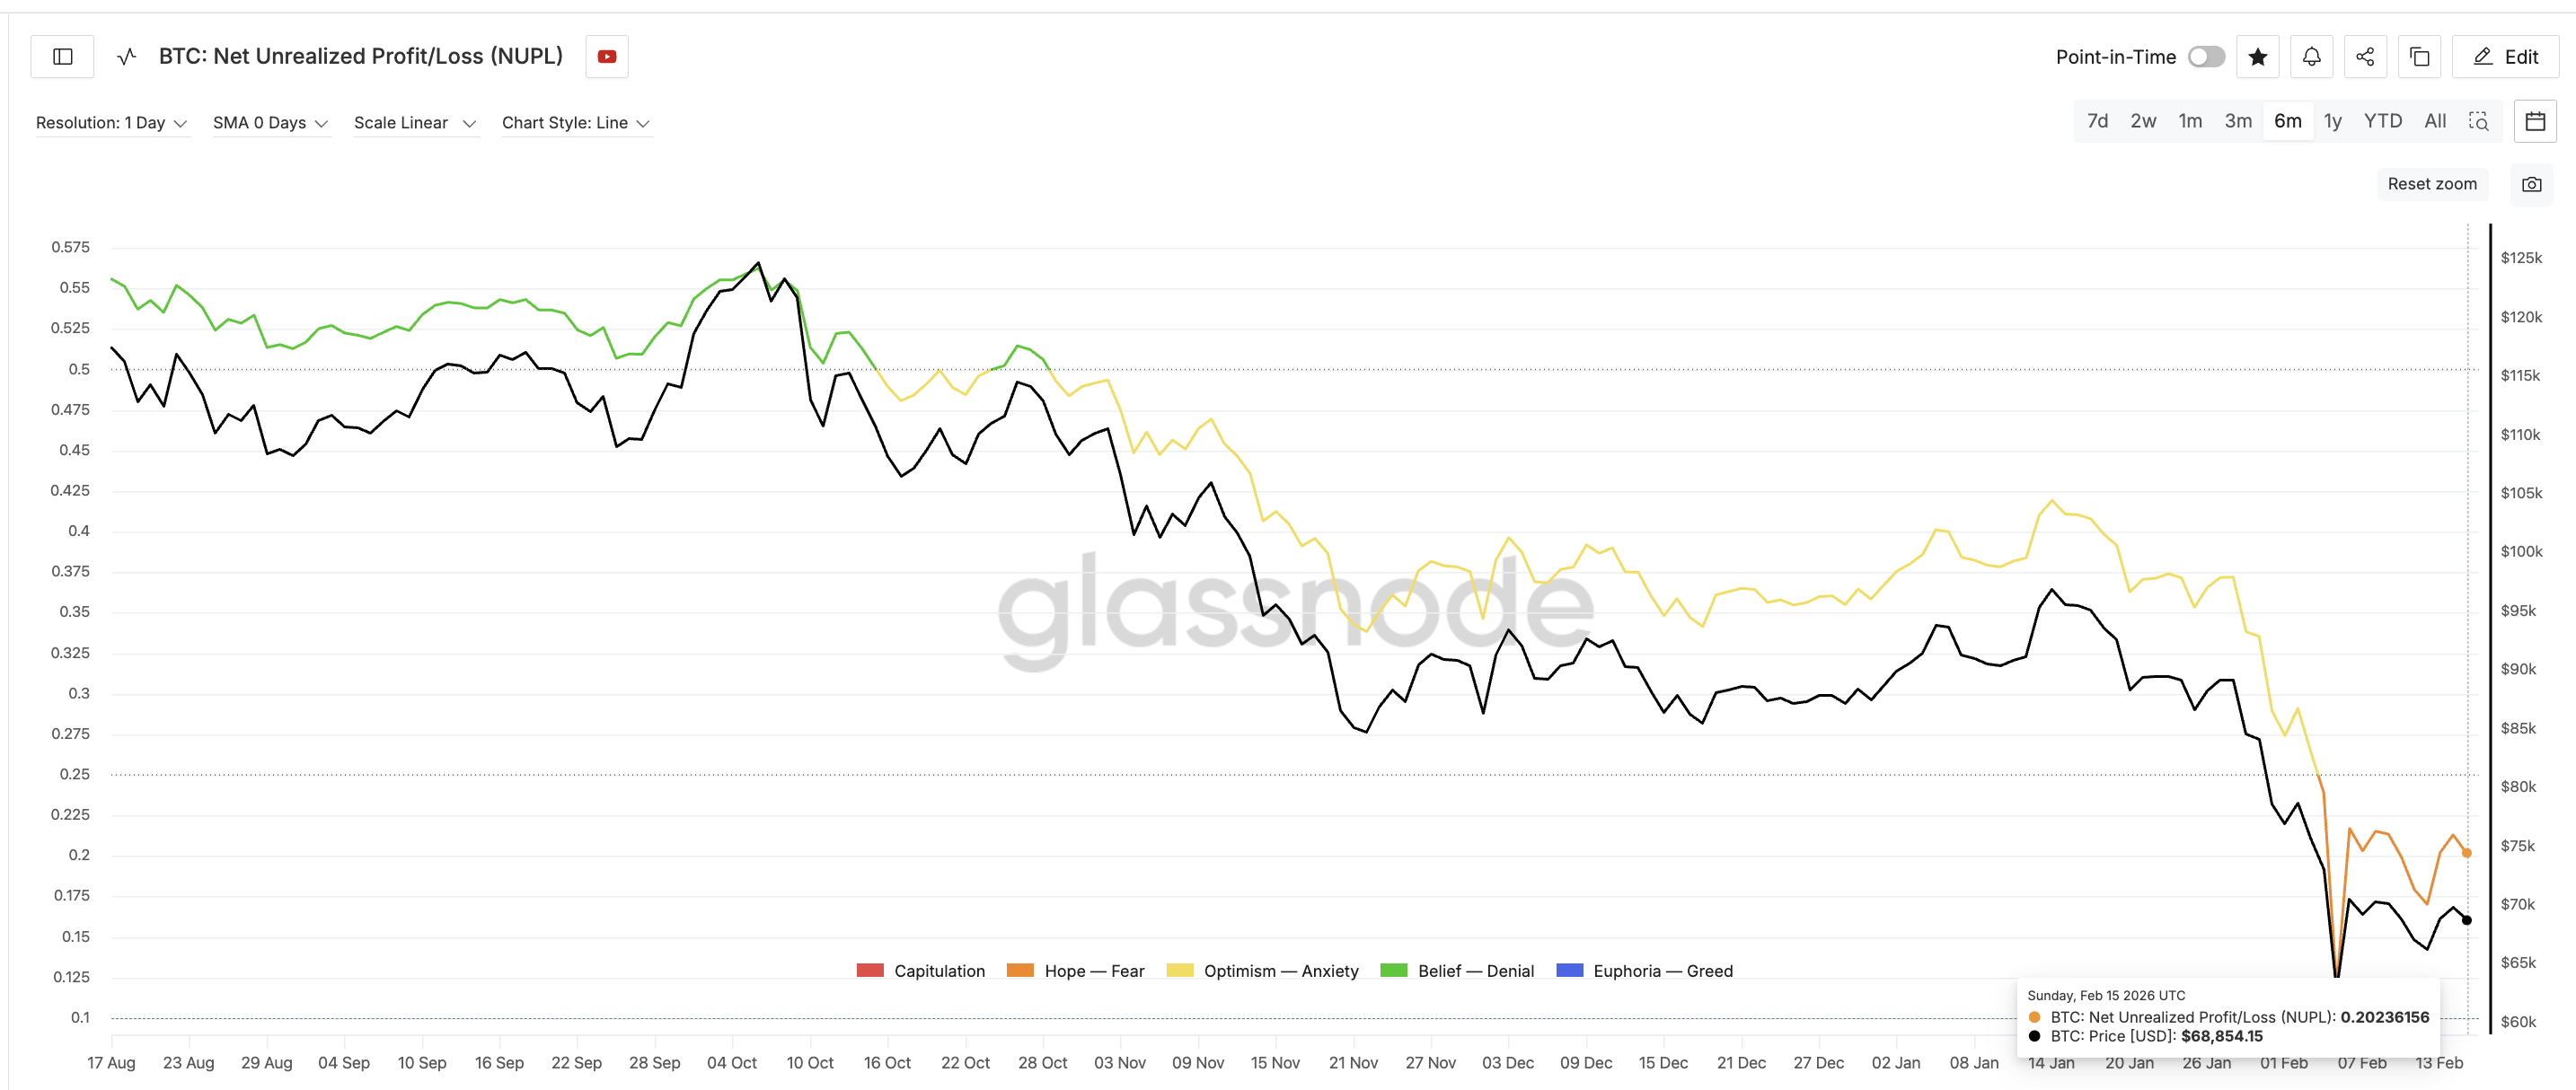
The last time NUPL reached similar levels was on February 4. At that time, Bitcoin was trading near $73,000. Within one day, the price collapsed to around $62,800. That was a drop of nearly 14%. Now, the same profit structure has appeared again.
This creates a scary situation. Investors holding fresh profits may sell quickly if prices start falling. That selling can accelerate the correction. This aligns with the hidden bearish divergence already visible on the chart.
Sponsored
Sponsored
Together, these signals show that the recent bounce may have strengthened sellers instead of removing them.
Key Bitcoin Price Levels Show Breakdown Risk Toward $58,800
Bitcoin is now approaching the most important support zone in its current structure. The first critical level is $66,270. This level forms near the lower boundary of the bear flag pattern breaks.
If Bitcoin breaks below this Fib level, the bearish continuation pattern would activate. The next major downside target sits at $58,880 (the $58,000 zone). This level aligns with the 0.618 Fibonacci retracement level ( a structurally strong zone) and represents roughly a 14% decline from current prices.
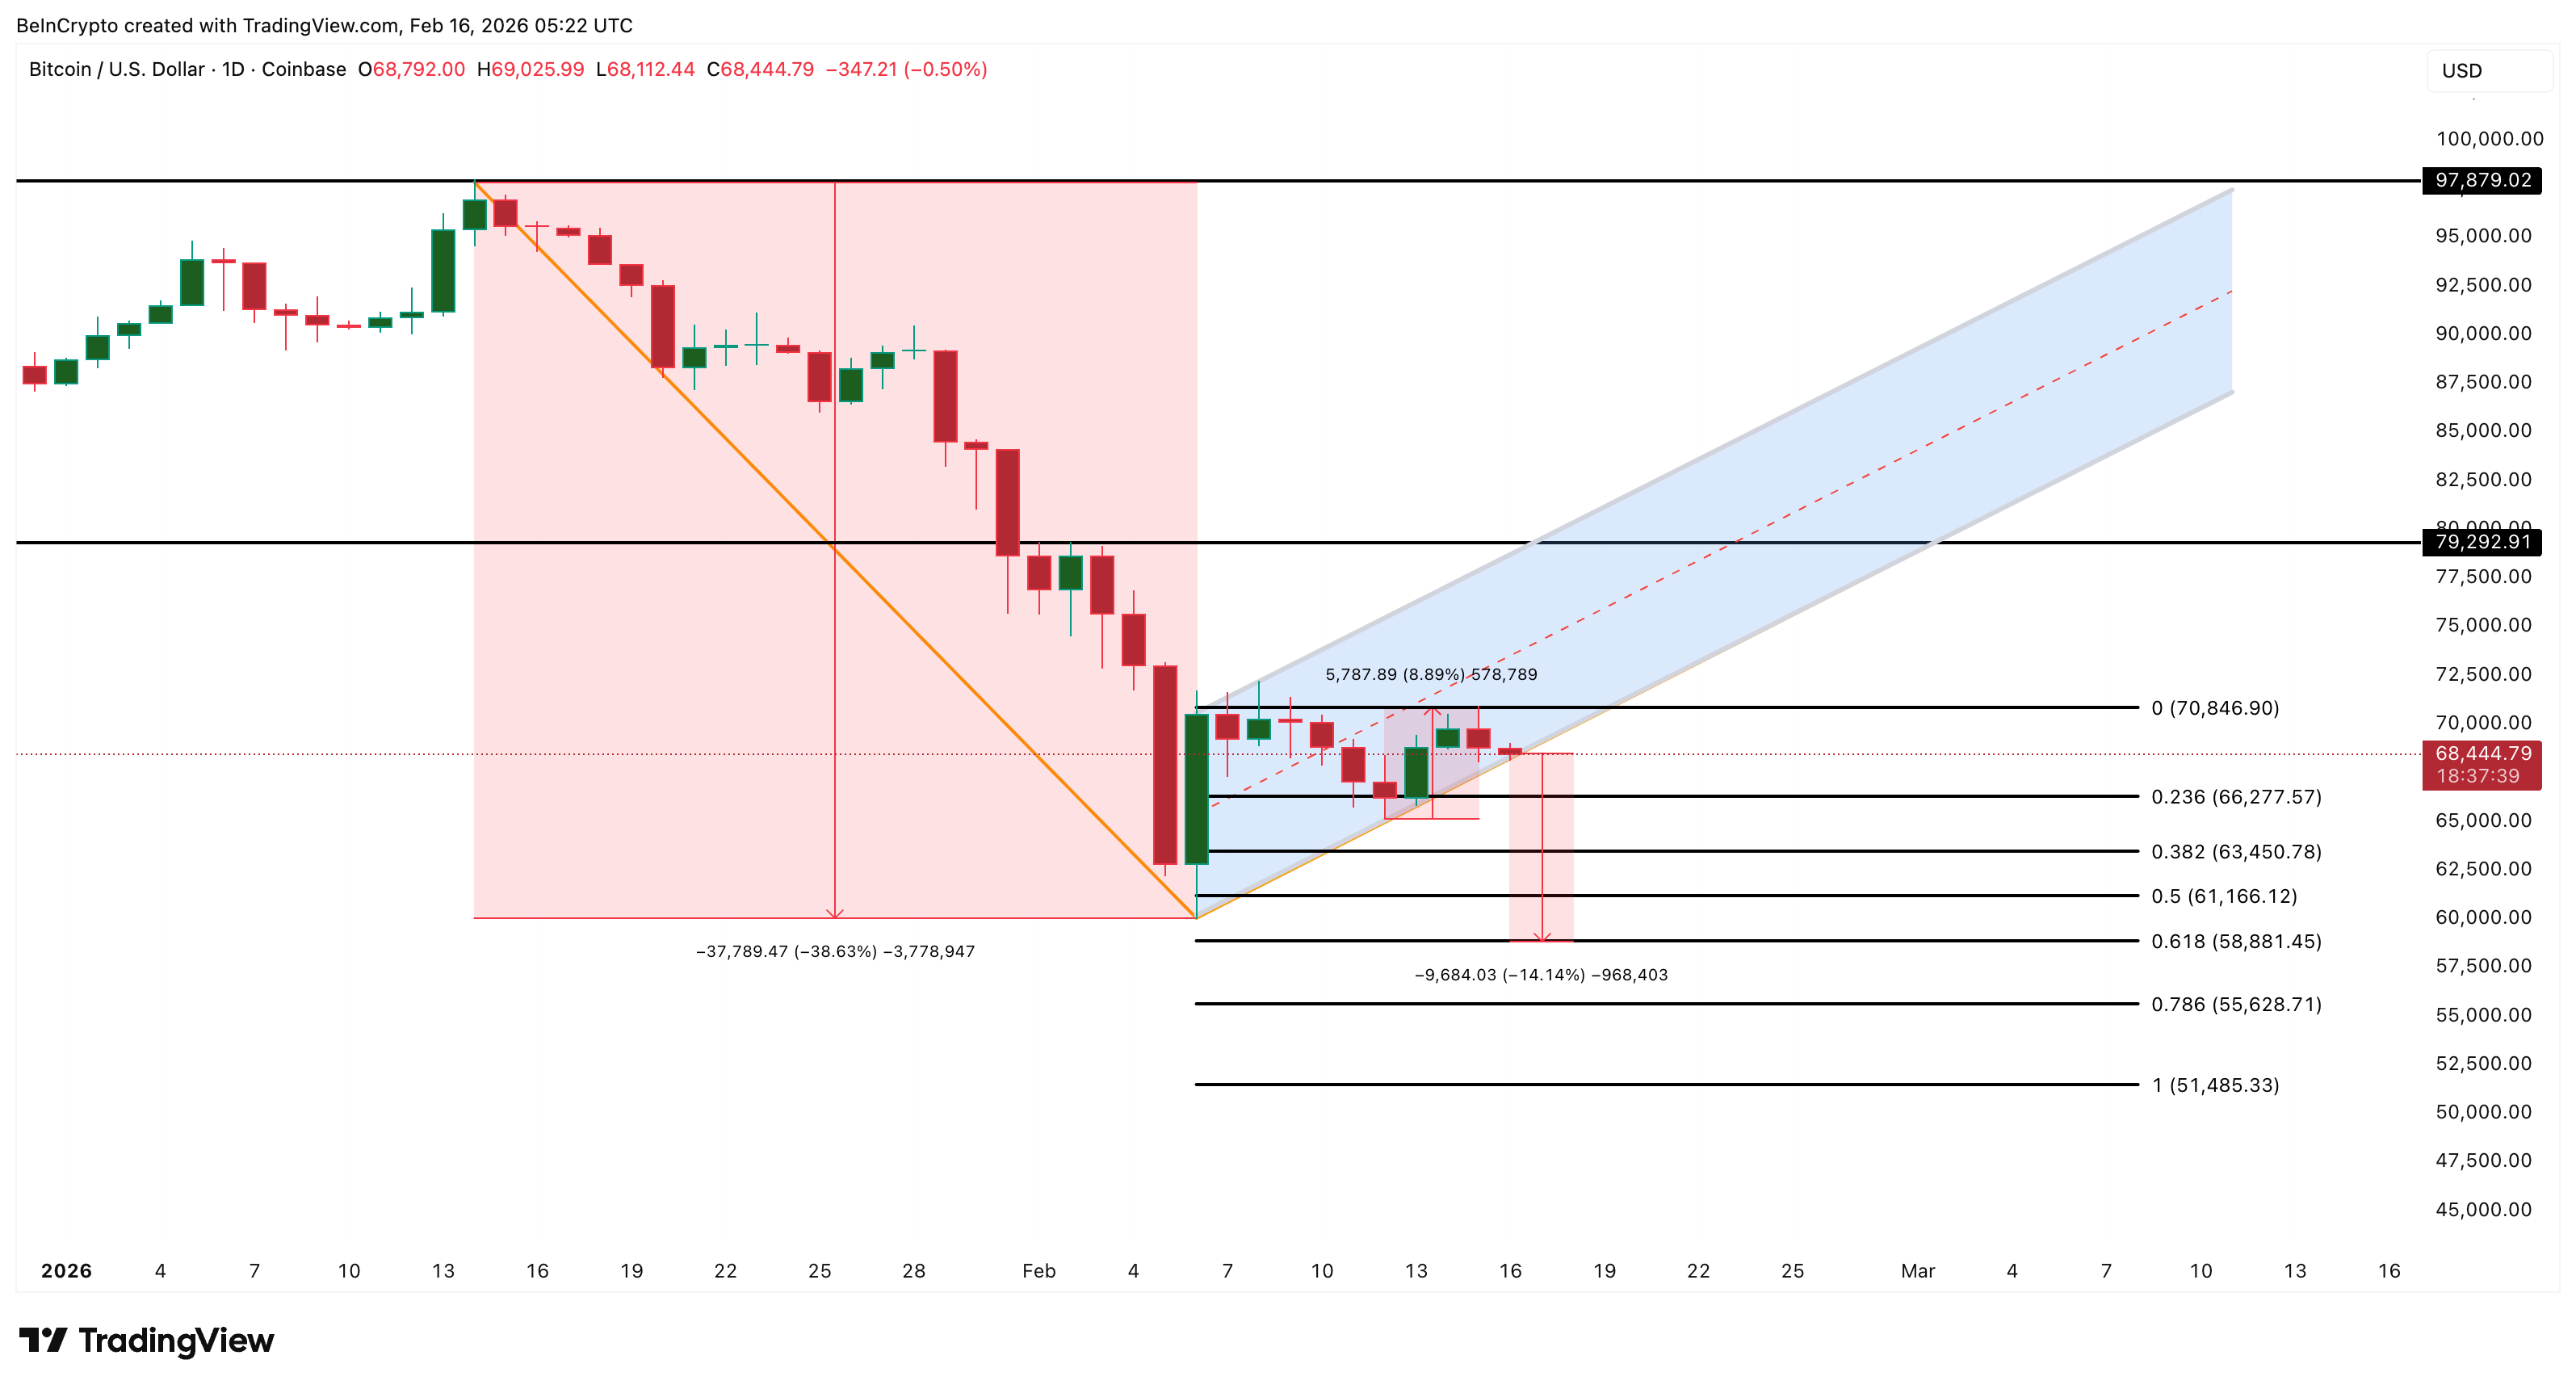
If selling pressure accelerates further, Bitcoin could fall toward the $55,620 zone, which aligns with the deeper projection of the bear flag structure. On the upside, Bitcoin must reclaim $70,840 to stabilize in the short term.
A stronger breakout above $79,290 would fully invalidate the bearish structure. That would signal that buyers have regained control. Until then, the risk remains tilted to the downside. The recent bounce improved sentiment briefly. But rising leverage, hidden bearish divergence, and a 90% surge in unrealized profits now show that the Bitcoin price recovery may have created the conditions for another drop.

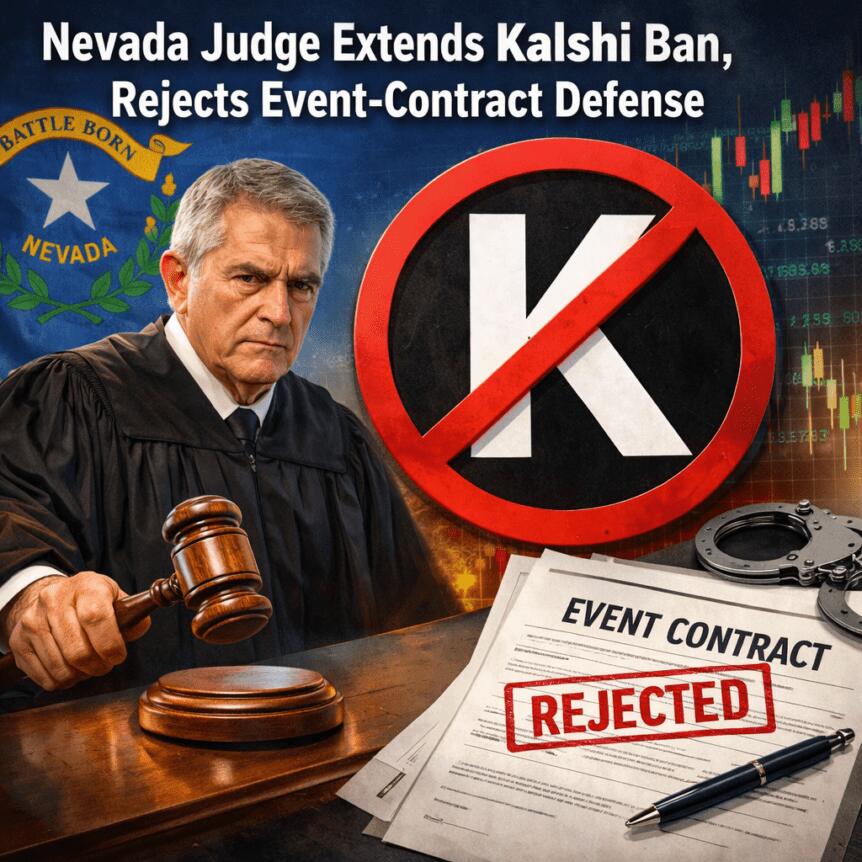
A Nevada judge has extended a court-ordered halt on Kalshi’s ability to offer event-based contracts to residents in the state, ruling that the products fall under unlicensed gambling as defined by Nevada law. In a Friday hearing in Carson City, Judge Jason Woodbury granted a preliminary injunction sought by the Nevada Gaming Control Board, barring Kalshi from letting Nevadans place bets on outcomes ranging from sports to elections and entertainment without a gaming license, according to Reuters.
The injunction builds on a temporary restraining order issued on March 20, which will stay in place through April 17 while the court considers longer-term restrictions. Kalshi, which operates from New York, contends that its contracts are financial derivatives—specifically swaps—that should be overseen exclusively by the Commodity Futures Trading Commission (CFTC).
Key takeaways
- Nevada extends a ban on Kalshi’s event-based contracts, blocking trading in the state without a gaming license.
- The judge frames Kalshi’s contracts as functionally indistinguishable from traditional sports betting, effectively classifying them as gambling under state law.
- Kalshi argues the products are CFTC-regulated swaps, setting up a clash between state gaming authorities and federal market regulators.
- The CFTC has signaled it will defend its regulatory remit over prediction markets in court against state challenges.
- Regulatory pressure is broadening, with Utah moving to block Kalshi and similar platforms, underscoring a shifting legal landscape for prediction markets in the U.S.
Nevada’s ruling and Kalshi’s legal position
During the hearing, Judge Woodbury described Kalshi’s contracts as essentially mirroring the mechanics of licensed sports betting. He stated that, no matter how one frames the product, placing a wager on a game outcome via Kalshi is “indistinguishable” from traditional gaming activity and thus requires a Nevada gaming license. Reuters characterized the judge’s comments as a strong alignment with the board’s position that Kalshi’s offerings violate state gaming statutes.
The court’s decision reinforces a broader pattern of state regulators scrutinizing prediction markets, with Nevada’s action marking the first time a state has obtained a court-enforceable ban on Kalshi. Kalshi has argued that its contracts are swaps—financial instruments that should fall under federal oversight by the CFTC rather than state gaming commissions. The dispute illustrates a central tension in U.S. financial-regulatory policy: whether prediction markets should be treated as gambling, derivative trading, or something in between subject to multiple layers of regulation.
Regulatory backdrop: CFTC’s stance and the broader market implications
At the federal level, the CFTC has maintained that it has jurisdiction over prediction markets and has signaled it is prepared to defend that authority in court against state challenges. In a recent industry appearance, CFTC Chair Rostin Behn emphasized the potential value of prediction markets as “truth machines”—markets where financial incentives are aligned to reveal more reliable signals about future events than traditional polling. The department’s posture suggests a willingness to push back against state-level attempts to curb or reinterpret the scope of what constitutes a regulated market in this space.
The Nevada decision comes against a backdrop of growing state action targeting prediction-market-style bets. In nearby Utah, lawmakers advanced legislation aimed at classifying proposition-style bets on in-game events as gambling, effectively blocking Kalshi and similar platforms in the state. While Utah’s move is separate from Nevada’s court action, it signals a broader regulatory trend that could constrain operators seeking to offer event-based contracts across multiple jurisdictions.
What this means for traders, investors, and builders
For participants who once considered Kalshi’s offerings as a way to hedge uncertainty around events, the Nevada ruling highlights the volatility of a regulatory landscape that remains unsettled at the state level. The outcome could influence where Kalshi and other prediction-market platforms search for licenses, or whether they pivot to offer alternative products that fit within existing regulatory frameworks. Investors and developers alike should monitor both state actions and federal court challenges, as a ripple effect could shape pathway approvals, compliance costs, and the speed at which new markets might emerge in regulated environments.
From a market-structure perspective, the clash underscores a growing complexity for platforms that rely on real-money participation tied to outcome-based events. If regulators ultimately converge on a uniform approach—whether to treat such markets as gambling, as regulated derivatives, or under a hybrid framework—the regulatory timeline and required safeguards will determine how quickly participants can access these products in major markets.
What to watch next
The Nevada case remains open as the court continues to consider longer-term restrictions beyond the current injunction. Key questions include whether Kalshi can secure the necessary gaming licenses in Nevada, how the company will position its product as it navigates state-by-state licensing regimes, and how federal authorities will respond to continued state-level challenges. In parallel, lawmakers in other states may push forward with legislation that redefines the legal boundaries of prediction markets, potentially accelerating a more unified approach—or further fragmenting access across the United States.
Readers should stay tuned for court updates, as well as any statements from the CFTC or Kalshi on the evolving regulatory posture. The next phase will likely clarify whether prediction markets survive within a patchwork of state licenses and whether federal guidance or court rulings will ultimately steer the sector’s regulatory trajectory.


A Nevada court has moved to keep Kalshi out of the state’s event-contract market while the legal fight continues.
Summary
- Nevada judge backed regulators and said Kalshi’s event contracts are no different from sports betting.
- The ruling extends Kalshi’s Nevada ban while the court reviews longer-term restrictions through April 17.
- The case deepens the clash between state gambling laws and federal oversight claims over prediction markets.
The ruling came after the Nevada Gaming Control Board asked the court to block the company from offering contracts tied to sports, elections, and entertainment outcomes.
The case adds to a wider debate over whether prediction market contracts fall under federal derivatives law or state gambling rules. Kalshi has said its products are financial contracts, while Nevada regulators have argued that the offerings match gambling activity under state law.
Judge Jason Woodbury said he would grant a preliminary injunction against Kalshi at a hearing in Carson City. According to Reuters, the order prevents the company from allowing Nevada residents to trade event contracts without a gaming license.
The move extends a temporary restraining order issued on March 20. That order will stay in effect through April 17 while the court completes the next steps in the case.
Kalshi had argued that its contracts are “swaps” and fall under the oversight of the Commodity Futures Trading Commission. The company has maintained that federal law gives the CFTC authority over these products.
The judge did not accept that position. Reuters reported that Woodbury said buying a contract tied to a game result is the same as placing a wager through a sportsbook. He said, “No matter how you slice it, that conduct is indistinguishable.”
State regulators score early court win
The ruling marks the first time a state has secured a court-enforced ban that is currently active against Kalshi. That gives Nevada an early legal win as more states question prediction markets tied to sports and similar events.
Utah has also moved against the sector. Lawmakers there passed a bill last month that classifies proposition-style bets on in-game events as gambling and seeks to block such products from platforms including Kalshi and Polymarket.
The dispute also comes as the CFTC continues to defend its role in prediction markets. CFTC Chairman Michael Selig said last month that the agency is ready to fight in court to protect its jurisdiction from states and other regulators.
Selig also described prediction markets as “truth machines” during an industry conference. He said markets where users risk money on outcomes can offer a clearer signal about future events than opinion polls, setting up a sharper clash between federal oversight claims and state gaming laws.

Anthropic confirmed it will block Claude subscription access for third-party AI agent tools, including OpenClaw, effective April 5 at 12 pm PT.
The policy shift forces thousands of developers who built autonomous workflows on flat-rate Claude plans to either pay API token rates or migrate to competing models.
Why Anthropic Cut OpenClaw From Claude Subscriptions
Boris Cherny, Anthropic’s Head of Claude Code, announced the restriction, indicating that subscriptions were never designed for the heavy usage patterns generated by third-party agentic tools.
“Capacity is a resource we manage thoughtfully, and we are prioritizing our customers using our products and API,” he said.
The economic mismatch had been growing for months. Agentic loops in OpenClaw can consume millions of tokens in a single session.
A single afternoon of automated debugging could burn through enough tokens to cost upwards of $1,000 at standard API rates, Skypage making $200 flat-rate subscriptions deeply unprofitable for Anthropic.
Anthropic offered subscribers a one-time credit equal to their monthly plan cost, discounted usage bundles, and full refunds for those who cancel.
Developer Backlash and Migration Signals
The response has been quick, with some users already canceling their subscriptions. The general sentiment is that the decision is an admission that Anthropic cannot compete with open-source agents.
“No thanks. Subscription canceled. New models have already been configured,” wrote one user.
Developer Alex Finn called it a “massive mistake” and predicted local models would match Opus 4.6 performance within six months.
He outlined a hybrid setup using Claude Opus as orchestrator with Gemma 4 and Qwen 3.5 for execution, costing roughly $200 monthly.
Others criticize Anthropic for gaslighting users, arguing that the company initially blamed usage patterns before admitting it was prioritizing its own products.
Users want published token budgets for each subscription tier and advance notice of future policy changes.
A Dual Strategy Takes Shape
The timing reveals a broader Anthropic play as the company expands its Microsoft 365 connector to all Claude plans, including Free.
The integration connects Claude with Outlook, SharePoint, OneDrive, and Teams, Microsoft positioning it directly against Microsoft Copilot’s $30-per-user monthly pricing.
OpenClaw creator Peter Steinberger recently joined OpenAI, VentureBeat, adding competitive tension to the decision.
Anthropic has been building Claude Cowork as an alternative to third-party agent tools, and this restriction steers users toward that product.
Whether the cost of lost developer trust outweighs the infrastructure savings remains the open question heading into Q2 2026.
The post AI Fallout Begins as Claude Creators Cut Off Their Most Powerful Users appeared first on BeInCrypto.

If the closing bell has long been a business model, then 24/7 trading is an attempt to break it. As the NYSE, Nasdaq, CME and Cboe race to introduce round-the-clock trading, the question is who stands to gain and who could lose.
The answer is quite simple, Mati Greenspan, CEO and founder of Quantum Economics, told CoinDesk: “The biggest losers in 24/7 stock trading won’t be traders: they’ll benefit massively. It’ll be the middlemen who’ve long made money when traders can’t trade.”
Greenspan, also a market analyst, alleged that when markets reopen after what he called a big event, “a handful of firms decide the first tradable price. Oftentimes, they will explicitly use a price that triggers stop losses for their clients, closing them out at a loss and making a profit for the broker who is essentially trading against the client.”
When Greenspan was asked whether brokers coordinate around pricing during market closures, he was blunt in his claim: “Yes, manipulation outright.”
“They basically get to control prices, often with hours to strategize,” he said. “Often hunting stops losses. When big news happens on weekends, the house tends to take liberties with pricing at the opening bell.”
His comments come as several major U.S. exchanges are looking to offer around-the-clock trading services. The NYSE said it is seeking SEC approval for 24/7 trading. Nasdaq announced similar plans in December. CME plans to roll out 24-hour crypto futures in 2026, pending approval, and Cboe recently expanded U.S. index options to 24/5 trading.
‘Plausible deniability’
While Greenspan’s comments could be seen as accusatory, it’s not hard to see why such practices could be prominent in the after-hours market. When the usual trading hours come to a close, at 4 p.m. ET, the thin liquidity can make prices easier to influence.
“After the 4 p.m. closing bell, you simply don’t have the same liquidity,” said Joe Dente, a floor broker at the New York Stock Exchange. “People have gone home and the liquidity is not there, so you’re going to see larger spreads.”
Wider spreads and thinner order books, he said, create an environment where price movements can be exaggerated compared with the regular session.
Academic research also supports the view that extended trading sessions are structurally different from core market hours. A widely cited joint UC Berkeley–University of Rochester study found that after-hours price discovery is “much less efficient,” citing lower volume and thinner liquidity that limit the speed at which information is incorporated into prices.
When asked whether manipulation already occurs during those periods, Dente said it is “possible,” but he also pointed out that “the event of 24-hour trading is going to leave things open to manipulation,” referring to conditions already seen in after-hours markets
Greenspan, meanwhile, noted that these alleged manipulation practices are “not exactly above board, so they [brokers who might be taking part in such actions] tend to maintain plausible deniability.”
This is where the line between actual manipulation and proof that such practises occur starts to blur.
A widely cited SSRN study on opening price manipulation shows how brokers can influence prices during the pre-open auction by submitting and canceling large orders, temporarily pushing stocks away from their fundamental value before broader liquidity returns.
The research found that such manipulation can create distorted opening prices that are later corrected once the full market begins trading, leaving investors who bought at the inflated price with losses. Because these distortions occur before normal trading volume returns, the resulting price moves can appear indistinguishable from ordinary market volatility.
Still another broker, familiar with overnight trading practices and who asked not to be named because they were not authorized to speak publicly, said thin overnight liquidity can occasionally make it easier for coordinated strategies to influence prices in less widely traded stocks.
And this is not just anecdotal evidence.
In late 2025, the SEC settled charges over a multi-year spoofing scheme involving deceptive orders used to move prices in thinly traded securities. Regulators also fined Velox Clearing $1.3 million for failing to detect “layering” and “spoofing” in volatile stocks.
Meanwhile, the U.S. Financial Industry Regulatory Authority (FINRA), in its 2026 Annual Regulatory Oversight Report, cited firms for “failing to maintain reasonably designed supervisory systems and controls, including with respect to the identification and reporting of potentially manipulative activity conducted in after-hours trading.”
A win for retail?
Whether it’s hard to point out how widespread these accusations are, one thing is for sure: if trading goes 24/7, traders will be the ultimate winners, particularly retail traders.
In today’s electronic markets, traders who respond fastest to market news have a structural advantage.
“There’s always an edge for whoever has the fastest computers and the best program writers,” said Dente, noting that algorithms can react to news and orders “in a nanosecond.” For individual investors, he added, keeping up with that speed is difficult. “How does the human person keep up with that?”
And reacting to these events becomes even harder for smaller investors when the market is closed, leaving those retail or smaller traders at a massive disadvantage.
Pranav Ramesh, head of quantitative research for options at Nasdaq and co-founder of Leadpoet, said thin markets can amplify those risks.
“Broker coordination may often show up as industry-wide alignment around routing and execution practices, especially where a large share of retail flow ends up with a small number of wholesalers,” he said. “Outside regular hours, scrutiny can be harder because the market is thinner and there are fewer straightforward reference points for investors to benchmark execution quality,” Ramesh said in his personal capacity.
Sources familiar with broker routing and liquidity practices told CoinDesk that price-setting power in thin sessions is real, particularly when major news breaks while markets are closed. According to those sources, coordination around routing, spreads and execution practices during extended gaps has historically been easier precisely because retail traders cannot participate.
This is precisely what around-the-clock trading will solve for traders, according to Greenspan, who said 24/7 markets would blunt fintech firms’ advantage by removing the weekend vacuum entirely.
The recent Middle East conflict has been a perfect example of how this can open up more trading opportunities when markets remain closed. Decentralized exchange, Hyperliquid, which trades on blockchain 24/7, has seen growing interest from traders betting on traditional financial assets, including oil and gold, during the weekend, when traditional exchanges are closed.
It has become so popular that weekly derivatives trading volume on the platform topped $50 billion, while it generated $1.6 million in revenue over 24 hours, outpacing the entire Bitcoin blockchain’s revenue. The platform has also recently added an S&P 500 perpetual contract.
Needless to say, major exchanges will also likely benefit from trading fees if they open for 24/7 trading.
Whether round-the-clock trading ultimately weakens brokers’ influence on price setting remains to be seen. What is clear is that exchanges and investors stand to gain from markets that never close.
“Traders can react in real time without being at the mercy of the middlemen — the brokers,” said Greenspan.
Read more: Bitcoin’s weekend selloff may be over with CME’s 24/7 crypto trading move
A Nevada judge has reportedly extended a ban preventing Kalshi from offering event-based contracts in the state, ruling that the products constitute unlicensed gambling under state law.
Judge Jason Woodbury said at a hearing in Carson City on Friday that he will grant a preliminary injunction requested by the Nevada Gaming Control Board, barring the company from allowing residents to trade on outcomes such as sports, elections and entertainment events without a gaming license, according to Reuters.
The decision extends a temporary restraining order issued on March 20, which will remain in effect through April 17 while the court finalizes longer-term restrictions.
Kalshi, based in New York, has argued that its contracts are financial derivatives, specifically “swaps,” that fall under the exclusive oversight of the Commodity Futures Trading Commission (CFTC).
Related: Appeals court denies Kalshi request to block Nevada enforcement action
Judge says Kalshi contracts mirror sports betting
Woodbury rejected Kalshi’s argument, claiming that there is a direct comparison between traditional sports betting and Kalshi’s platform, according to Reuters. He said that placing a wager through a licensed sportsbook and buying a contract tied to a game outcome are functionally the same, per the report.
“No matter how you slice it, that conduct is indistinguishable,” the judge reportedly said, adding that such activity qualifies as gaming under Nevada law and cannot be offered without proper licensing.

The case marks the first time a state has secured a court-enforced ban currently in effect against the company.
Last month, Utah lawmakers also passed a bill targeting Kalshi and Polymarket that classifies proposition-style bets on in-game events as gambling, aiming to block such offerings in the state.
Related: Kalshi CEO fires back against Arizona criminal charges as ‘total overstep’
CFTC vows court fight over prediction market oversight
The CFTC has asserted authority over prediction markets, with Chairman Michael Selig warning that the agency is prepared to defend its jurisdiction in court against any challenges from states or other regulators.
Speaking at an industry conference last month, Selig said prediction markets can act as “truth machines,” arguing that when participants put money behind their views, these markets can produce more transparent and reliable signals about future events than traditional opinion polling.
Magazine: Bitcoin may take 7 years to upgrade to post-quantum — BIP-360 co-author
Crypto World
Hyperliquid Burns 49,000+ HYPE Tokens in a Single Day, Confirming Net Deflationary Status

TLDR:
- HyperCore burned 49,360.33 HYPE at ~$35.09 on April 2, pushing the protocol into net deflationary territory.
- Even with 26,665 HYPE distributed to stakers and validators, net circulation still dropped by 17,075 tokens.
- Hyperliquid’s annual deflation rate stands at ~6.15M HYPE, contrasting sharply with Solana’s 25.19M SOL inflation.
- The HIP-3 flywheel ties protocol revenue directly to buybacks, creating self-sustaining and organic supply reduction.
Hyperliquid recorded a net removal of 17,075 HYPE tokens from circulation on April 2, 2026. HyperCore repurchased and permanently burned 49,360.33 HYPE at an average price of approximately $35.09.
Alongside this, HyperEVM gas fees contributed an additional 146.43 HYPE to the burn total. Even after distributing 26,665 HYPE as staking and validator rewards, the protocol remained firmly in net deflationary territory for the day.
Buyback Mechanism Drives Daily Deflationary Pressure
The April 2 activity placed Hyperliquid’s annualized deflation rate at roughly 6.15 million HYPE per year. On a monthly basis, that translates to approximately 512,262 HYPE removed from circulation.
These figures reflect a consistent pattern emerging from HyperCore’s revenue-backed buyback program. The numbers stand in sharp contrast to Solana, which inflates by around 25.19 million SOL annually through staking and validator rewards.
HyperCore’s buyback model operates on a price-sensitive basis, which makes it naturally self-adjusting. When HYPE prices rise, fewer tokens are repurchased with the same revenue.
Conversely, when prices fall, the same revenue buys and burns more tokens. This mechanism creates a built-in buffer against extreme supply pressure at different points in the market cycle.
The burn also accounts for a worst-case assumption regarding team token unlocks. Hyperliquid Labs is allocated 173,000 HYPE per month in vesting, equal to about 5,766 HYPE per day.
Even if this entire allocation were sold into the market, the protocol would still achieve net deflation under the current numbers. That assumption was already factored into the 17,075 HYPE net removal figure.
This structure sets Hyperliquid apart from many protocols that rely on token emissions to incentivize participation.
Here, buybacks are funded by actual trading revenue from HyperCore, not newly minted supply. That distinction matters when evaluating the long-term sustainability of the deflationary model.
HIP-3 Adoption Strengthens the Protocol’s Revenue Flywheel
Greater adoption of HIP-3 is central to sustaining and potentially accelerating this deflationary trend. As more users trade through the protocol, activity increases and so does revenue.
Higher revenue, in turn, supports larger buybacks and more burns. The cycle reinforces itself without depending on external capital injections.
This flywheel effect ties protocol growth directly to supply reduction. Each new participant adds to the trading volume that funds the next round of buybacks.
Over time, this creates persistent and organic buy pressure on HYPE. The pressure comes from protocol economics, not from speculative demand or marketing cycles.
Trading activity on HyperCore feeds directly into the buyback pool used for burns. The April 2 figures show that this model is already producing measurable results at current price levels.
As HIP-3 usage grows, the mechanism is designed to scale accordingly. The connection between adoption and deflation is direct and quantifiable.
Validators and stakers received 26,665 HYPE in rewards during the same period. That distribution ensures continued network participation while the broader supply still contracts.
The balance between rewarding contributors and reducing circulating supply appears to be working as intended on April 2.


Ethereum stayed near $2,050 on April 4 as traders weighed price resistance, ETF outflows, and fresh staking activity from the Ethereum Foundation.
Summary
- Ethereum stayed near $2,050 as foundation staking approached 70,000 ETH and resistance held near $2,150.
- US spot Ethereum ETFs ended the week negative, with more than $42 million withdrawn overall.
- Analysts said ETH must clear $2,100-$2,150, while losing $2,000 could trigger long liquidations across markets.
On-chain data showed that the Ethereum Foundation staked about 69,500 ETH in less than two months. At current prices, that amount stood above $140 million. The group had earlier said it planned to use staking to support research, development, and broader ecosystem work through yield.
The latest move involved 45,034 ETH sent on Friday in batches of 2,047 ETH to the Eth2 Beacon Chain deposit contract. Arkham data also showed the Ethereum Foundation holding more than 102,000 ETH, while its treasury across 14 addresses was valued at about $270 million.
While the foundation kept adding staked ETH, US spot Ethereum ETFs continued to record net withdrawals for most of the recent period. The funds saw eight straight sessions of outflows before posting a small net inflow of about $5 million on March 30.
Another positive day followed on March 31 with $31.17 million in net inflows. Still, the trend turned negative again after later sessions posted $7.1 million and $71.17 million in outflows. That left the week in the red, with more than $42 million leaving the products.
Analysts watch key ETH price levels
Analyst Crypto Patel said Ethereum had stayed between $1,500 and $4,100 for nearly five years. He compared the current structure with the 2018 to 2020 range and said a breakout could lead to a much larger move if history repeats.
That view added to wider market debate, but short-term traders remained focused on nearer resistance and support levels. ETH traded at $2,050.69, with a 24-hour trading volume above $6 billion, a daily gain of 0.12%, and a seven-day increase of 2.59%.
In addition, analyst Ted Pillows said Ethereum needs to break above the “$2,100-$2,150” area to restart stronger upside momentum. He noted that ETH moved close to $2,400 a few weeks ago but failed to hold that advance and slipped back below the key zone.
He also warned that a drop below the “$2,000” support level could trigger a long liquidation event.
Disclosure: This article does not represent investment advice. The content and materials featured on this page are for educational purposes only.
Crypto World
Metaplanet Outperforms MicroStrategy in Q1 Bitcoin Acquisition Using Options-Based Treasury Strategy
TLDR:
- Metaplanet added 5,075 BTC to permanent holdings in Q1 through a structured options income rotation system.
- The firm generated $18.63 million in options income, reducing its net Bitcoin cost to roughly $76,227 per coin.
- MicroStrategy acquired 89,599 BTC at $80,929 average, while Metaplanet’s net cost came in nearly $4,700 lower.
- Metaplanet separates Bitcoin into two buckets — income generation and long-term holdings — never mixing the two.
Metaplanet, the Japanese hotel company turned Bitcoin treasury firm, has drawn attention after shifting to quarterly Bitcoin purchase announcements.
The company added 5,075 BTC to its permanent holdings in Q1 2025. Its average purchase price came in near $79,898.
Meanwhile, a detailed breakdown from a prominent analyst suggests the firm may have outperformed MicroStrategy, widely regarded as the benchmark for corporate Bitcoin acquisition.
Metaplanet’s Two-Bucket Bitcoin System Explained
Metaplanet reportedly operates two distinct Bitcoin buckets. One is dedicated to income generation, and the other holds long-term Bitcoin positions.
According to analyst Ragnar, the two buckets remain strictly separate. Long-term holdings are never exposed to options contracts under this structure.
The income generation bucket works through a rotation of cash-secured puts and covered calls. When the team holds cash, they sell put options below the current Bitcoin price.
If Bitcoin stays above the strike price minus the premium, the puts expire and the premium is collected. This process repeats weekly, compounding returns over the quarter.
If Bitcoin falls below that threshold, Metaplanet gets assigned and acquires Bitcoin below market price. At that point, the team pivots to selling covered calls against those holdings.
The calls either expire, generating more premium, or get assigned, returning the position to cash and restarting the cycle.
At the quarter’s close, the team transfers the accumulated Bitcoin into the permanent holdings bucket. This transfer marks the official addition to their long-term treasury, which is what gets announced publicly each quarter.
Q1 Numbers Show Metaplanet Acquired Bitcoin Cheaper Than MicroStrategy
The Q1 figures offer a clearer picture of performance. Metaplanet generated $18.63 million in income from its options activity during the quarter.
Dividing that by the 5,075 BTC added to permanent holdings gives roughly $3,671 of income per Bitcoin acquired.
Ragnar’s post breaks this down further. Subtracting the income generated from the average purchase price of $79,898 brings the effective net cost to approximately $76,227 per Bitcoin.
That figure excludes direct capital deployment and accounts only for options-based income offsetting acquisition costs.
By comparison, MicroStrategy purchased 89,599 BTC in Q1 at an average price of $80,929. That puts Metaplanet’s net cost roughly $4,700 lower per Bitcoin when income generation is factored in. Even without that adjustment, Metaplanet still came in around $1,000 cheaper per coin.
Ragnar noted that Metaplanet achieved this result while its preferred share structure still awaits approval. The analyst added that he remains more bullish on the company following this analysis, though he clarified the post represents personal speculation pending confirmation from the Metaplanet team.


Block plans to revive the Bitcoin “faucet” model on April 6 through a new site, btc.day, as Jack Dorsey pushes another public effort tied to Bitcoin access and education.
Summary
- Block will relaunch the Bitcoin faucet on April 6 through a new countdown site, btc.day.
- The company has not disclosed claim rules, eligibility, or total Bitcoin set for distribution yet.
- Dorsey’s rollout revives Gavin Andresen’s 2010 faucet model, which once gave users five Bitcoin.
The site already shows a countdown timer, an orange faucet symbol, and the phrases “The Faucet is Back” and “Buy, Secure, Spend.”
Dorsey announced the move on Friday through an update tied to Bitcoin at Block. The company said the faucet will return through btc.day, though it has not yet shared the full rules for how users will claim free Bitcoin.
The website does not currently ask users to complete any task. It only shows a timer and basic branding linked to the old faucet idea. Block has also not said how much BTC it plans to distribute.
The faucet model dates back to 2010, when software developer Gavin Andresen used it to introduce people to Bitcoin. His original site gave users five BTC after they completed a captcha and entered a wallet address.
At that time, Bitcoin was new and had little public reach. Early builders used simple tools like faucets to help people test wallets, send coins, and learn how the network worked. The model later became part of Bitcoin’s early history.
In addition, the new rollout appears to borrow from that original approach. By bringing back the faucet concept, Block is linking a modern campaign to one of Bitcoin’s best-known early distribution methods.
The company has not confirmed whether the new version will use captchas, wallet checks, or any other participation step. It also has not said whether the giveaway will be open globally or limited to specific users or regions.
Community watches for more details
Crypto users have started discussing the relaunch across social platforms. Some described the move as a way to keep Bitcoin more accessible, while others pointed to the larger number of wallet users today compared with 2010.
The market is now waiting for details on the size, timing, and structure of the giveaway. Block held 8,883 BTC as of its accumulation record dating back to October 2020, but neither Dorsey nor the company has said how much of that Bitcoin, if any, will be used for the faucet.
Key takeaways:
-
Bitcoin hitting $72,000 would liquidate $2.5 billion in shorts, potentially crushing bears who are overleveraged.
-
Iran’s war and high oil prices currently pressure BTC, but a ceasefire or ETF inflows could spark a rapid recovery.
$2.5 billion in shorts at risk if BTC hits $72,000
Bitcoin (BTC) has consistently failed to hit new highs since attempting to reclaim the $75,000 level since March 17.
Bearish Bitcoin futures bets have been piling up as the war in Iran pushed oil prices to their highest levels since June 2022. However, two events could propel Bitcoin to $72,000 in the coming weeks and help cement a sustainable bull run.

According to Coinglass estimates, a total of $2.5 billion in short positions on Bitcoin futures will be liquidated if Bitcoin rises just 7.5% to $72,000 from the current $67,100 level.
BTC bears benefit from miners’ sales, weak S&P 500
Bears have been adding shorts since March 25, when Iran reportedly refused to negotiate a ceasefire. Additional selling pressure emerged as MARA Holdings (MARA US) announced it sold 15,133 BTC on March 26. The publicly listed Bitcoin miner shifted its focus to AI computing and chose to reduce its Bitcoin holdings to pay down debt.
After peaking near 7,000 points on Jan. 28, the S&P 500 dropped 10% by March 30. Investors fear recession risks because central banks have less room to cut interest rates due to inflation.
Oil prices have jumped over 70% since the war in Iran started in late February, which hikes logistics costs and cuts into consumer spending.

Traders are pricing in 89% odds that the Fed will keep interest rates steady through September, with 5% odds of a hike to 4%.
In early March, bond futures showed the opposite, with 79% odds of rate cuts. Returns on fixed-income investments will likely stay attractive for longer.

Meanwhile, confidence among Bitcoin bears has increased, as reflected by the negative funding rate in perpetual futures contracts.
In neutral market conditions, longs usually pay to keep positions open, causing this indicator to range between 5% and 10% to compensate for capital costs.
Negative funding rates signal a lack of demand for bullish leveraged bets and potential overconfidence from the bears.
Ceasefire or economic weakness may boost Bitcoin
While it is impossible to predict the outcome of the war involving Iran, a ceasefire agreement could spark bullish sentiment and catch bears by surprise.
Bitcoin jumped from $69,150 to $74,900 during the five days ending March 16 after US-listed Bitcoin exchange-traded funds saw $1.5 billion in net inflows over two weeks. If ETF inflows resume, Bitcoin could also reclaim the $72,000 level.
Related: Bitcoin ETFs ‘will be larger’ than gold ETFs–Analyst

US President Donald Trump has asked Congress to boost defense spending to $1.5 trillion, according to a 2027 budget proposal released Friday. These plans include a 10% cut in other areas to offset military expenses.
Trump reportedly said at a private White House event on Wednesday: “We’re fighting wars. We can’t take care of day care,” according to CNBC.
If the US economy loses steam, or if private credit redemptions continue to pressure the market, investors will likely look for alternative hedges.
Consequently, Bitcoin’s appeal would grow as the it presently trades 47% below its all-time high. Thus, a bull run to $72,000 might happen regardless of how long the war in Iran lasts.
This article is produced in accordance with Cointelegraph’s Editorial Policy and is intended for informational purposes only. It does not constitute investment advice or recommendations. All investments and trades carry risk; readers are encouraged to conduct independent research before making any decisions. Cointelegraph makes no guarantees regarding the accuracy or completeness of the information presented, including forward-looking statements, and will not be liable for any loss or damage arising from reliance on this content.
5 Costco Tool Finds To Add To Your Garage This Spring

Money Cutting Magic : Real or Fake ?
Donald Trump demands $152m from taxpayers to reopen Alcatraz as functioning prison


-

 NewsBeat2 days ago
Steven Gerrard disagrees with Gary Neville over ‘shock’ Chelsea and Arsenal claim | Football
-

 Business2 days ago
No Jackpot Winner and $194 Million Prize Rolls Over
-

 Fashion20 hours ago
Weekend Open Thread: Spanx – Corporette.com
-
Entertainment5 days ago
Fans slam 'heartbreaking' Barbie Dream Fest convention debacle with 'cardboard cutout' experience
-

 Crypto World3 days ago
Gold Price Prediction: Worst Month in 17 Years fo Save Haven Rock
-

 Tech6 days ago
The Pixel 10a doesn’t have a camera bump, and it’s great
-
Crypto World4 days ago
Dems press CFTC, ethics board on prediction-market insider trades
-
 Entertainment7 days ago
Lana Del Rey Celebrates Her Husband’s 51st Birthday In New Post
-

 Tech5 days ago
Avatar Legends: The Fighting Game comes out in July and it looks pretty slick
-

 Tech4 days ago
EE TV is using AI to help you find something to watch
-

 Sports4 days ago
Tallest college basketball player ever, standing at 7-foot-9, entering transfer portal
-

 Business2 days ago
Login and Checkout Issues Spark Merchant Frustration
-

 Fashion6 days ago
Amazon Sundays: Soft Spring Layers
-

 Tech6 days ago
Elon Musk’s last co-founder reportedly leaves xAI
-

 Fashion5 days ago
The Best Spring Trends of 2026
-

 Tech4 days ago
How to back up your iPhone & iPad to your Mac before something goes wrong
-

 Politics5 days ago
Should Trump Be Scared Strait?
-

 Tech5 days ago
Apple will hide your email address from apps and websites, but not cops
-

 Crypto World5 days ago
U.S. rule change may open trillions in 401(k) funds to crypto
-

 Tech4 days ago
Flipsnack and the shift toward motion-first business content with living visuals
You must be logged in to post a comment Login