RAMALLAH, West Bank (AP) — Israeli prosecutors said Monday that they plan to charge a settler in the killing of a Palestinian activist during a confrontation that was caught on video, opening a rare prosecution of violence by Jewish settlers in the occupied West Bank.
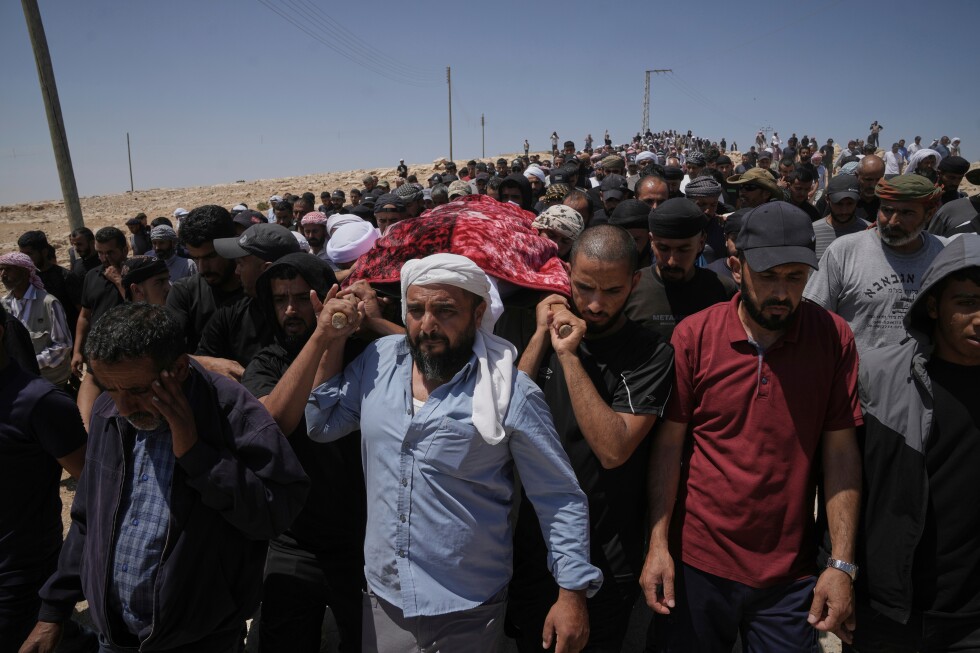
Attacks from settlers and home demolitions by authorities have spiked dramatically over the past two years, but the death in July of Awdah Hathaleen has drawn particular attention due to his involvement in the 2025 Oscar-winning film “No Other Land,” which chronicled Palestinian villagers’ fight to stay on their land. The case also stands out because the confrontation between Palestinians and Yinon Levi, an internationally sanctioned settler, was captured on video from multiple vantage points.
In a video that family members say was taken by Hathaleen himself, Levi could be seen firing toward the person holding the camera. Another showed Levi firing two shots without showing where the bullets struck.
An Israeli judge released Levi from custody six months ago, citing a lack of evidence that he fired the shots that killed Hathaleen.
Israel’s State Attorney General’s office confirmed in a statement Monday that it had initiated proceedings to indict Levi. It did not specify the charges.
Eitan Peleg, an attorney for Hathaleen’s family, said the office had informed them it planned to indict Levi for reckless homicide, triggering a process that allows Levi to contest charges before they’re formally filed.
“Enforcement of the law in cases like this involving Palestinians in the West Bank is very rare, so this is unique,” Peleg told The Associated Press on Monday.
Israel’s military referred questions on the indictment to police, who have not yet responded. Both bodies enforce laws in the area.
More than 3.4 million Palestinians and 700,000 Israelis live in the occupied West Bank and east Jerusalem, territories captured by Israel in 1967 and sought by Palestinians for a future state. The international community overwhelmingly considers Israeli settlement construction in these areas to be illegal and an obstacle to peace.
Palestinians and rights groups say authorities routinely fail to prosecute settlers or hold them accountable for violence. Under National Security Minister Itamar Ben-Gvir, investigations into settler attacks have plummeted, according to the Israeli rights group Yesh Din.
Khalil Hathaleen, Awdah’s brother, said the family was glad some measure of justice was being pursued but felt the charge of “reckless homicide” was insufficient.
“It was an intentional killing in broad daylight, with prior intent and premeditation,” he said.
Levi’s attorney, Avichai Hajbi, declined Monday to comment on the coming indictment, which he said he hadn’t received. After the shooting, he told The Associated Press that Levi acted in self-defense, without elaborating. Levi did not answer phone calls Monday.
Parts of the confrontation were filmed
Video released last year by B’Tselem, an Israeli human rights group showed Levi firing a gun toward the person filming. At the moment that B’Tselem says Hathaleen collapsed, the visuals are jostled but moans of pain can be heard. The group said it obtained the video from the family of Hathaleen, who said he filmed it.
Additional footage obtained by the AP last year showed Levi waving a pistol during the standoff in Umm al-Khair that was with a group of Palestinians over an excavator that had rolled down from a nearby settlement and damaged Palestinian property earlier in the day.
Alaa Hathaleen, a cousin who filmed the encounter, told AP at the time that he had approached Levi to tell him the group was unarmed and to stop the bulldozing.
In the video, one Palestinian insults Levi and another challenges him to shoot. Levi shoves someone just out of the frame, demands to know who threw stones, and later fires a shot, seemingly away from the crowd. He then fires again and yells toward the crowd to get away from the excavator.
The footage did not show where bullets struck, though other relatives said they saw Awdah Hathaleen fall immediately after shots were fired.
Levi was detained before being released to house arrest. That condition was eventually lifted, too.
Levi was among the Israeli settlers sanctioned by the United States and other Western countries over allegations of violence toward Palestinians in 2024. U.S. President Donald Trump lifted the U.S. sanctions after taking office the following year.
Attacks spike as spotlight grows
Activists and crew members on the film “No Other Land” have said settler attacks have intensified on the village portrayed since the movie won the Oscar.
Hamdan Ballal, one of the film’s directors, said his family home in Umm al-Khair was subject to another attack on Sunday. Four relatives were arrested during the confrontation, he said.
Ballal said a soldier, who came to their home accompanied by another soldier and a settler-herder, grabbed his brother by the neck and tried to choke him. Neither the army nor the police responded to requests for comment on the incident.
“The year after I won the Oscar, the assaults increased significantly. On a daily basis, settlers come and destroy the fields, destroy the trees, destroy the crops around the house,” he said.
Israeli proof-of-ownership rules spark anger
As prosecutors move to indict Levi and violence persists across the West Bank, Israel is moving ahead with measures to deepen its control over land in the occupied territory.
On Sunday, it announced it would resume a land registration process across the West Bank to require anyone with a claim to land to submit documents proving ownership. Rights groups say the process could strip Palestinians of land they’ve lived on and farmed for generations and transfer vast swaths of land to Israeli state control.
Israel’s Foreign Ministry said the steps countered Palestinian Authority land registration efforts in areas where Israel maintains civil and military control.
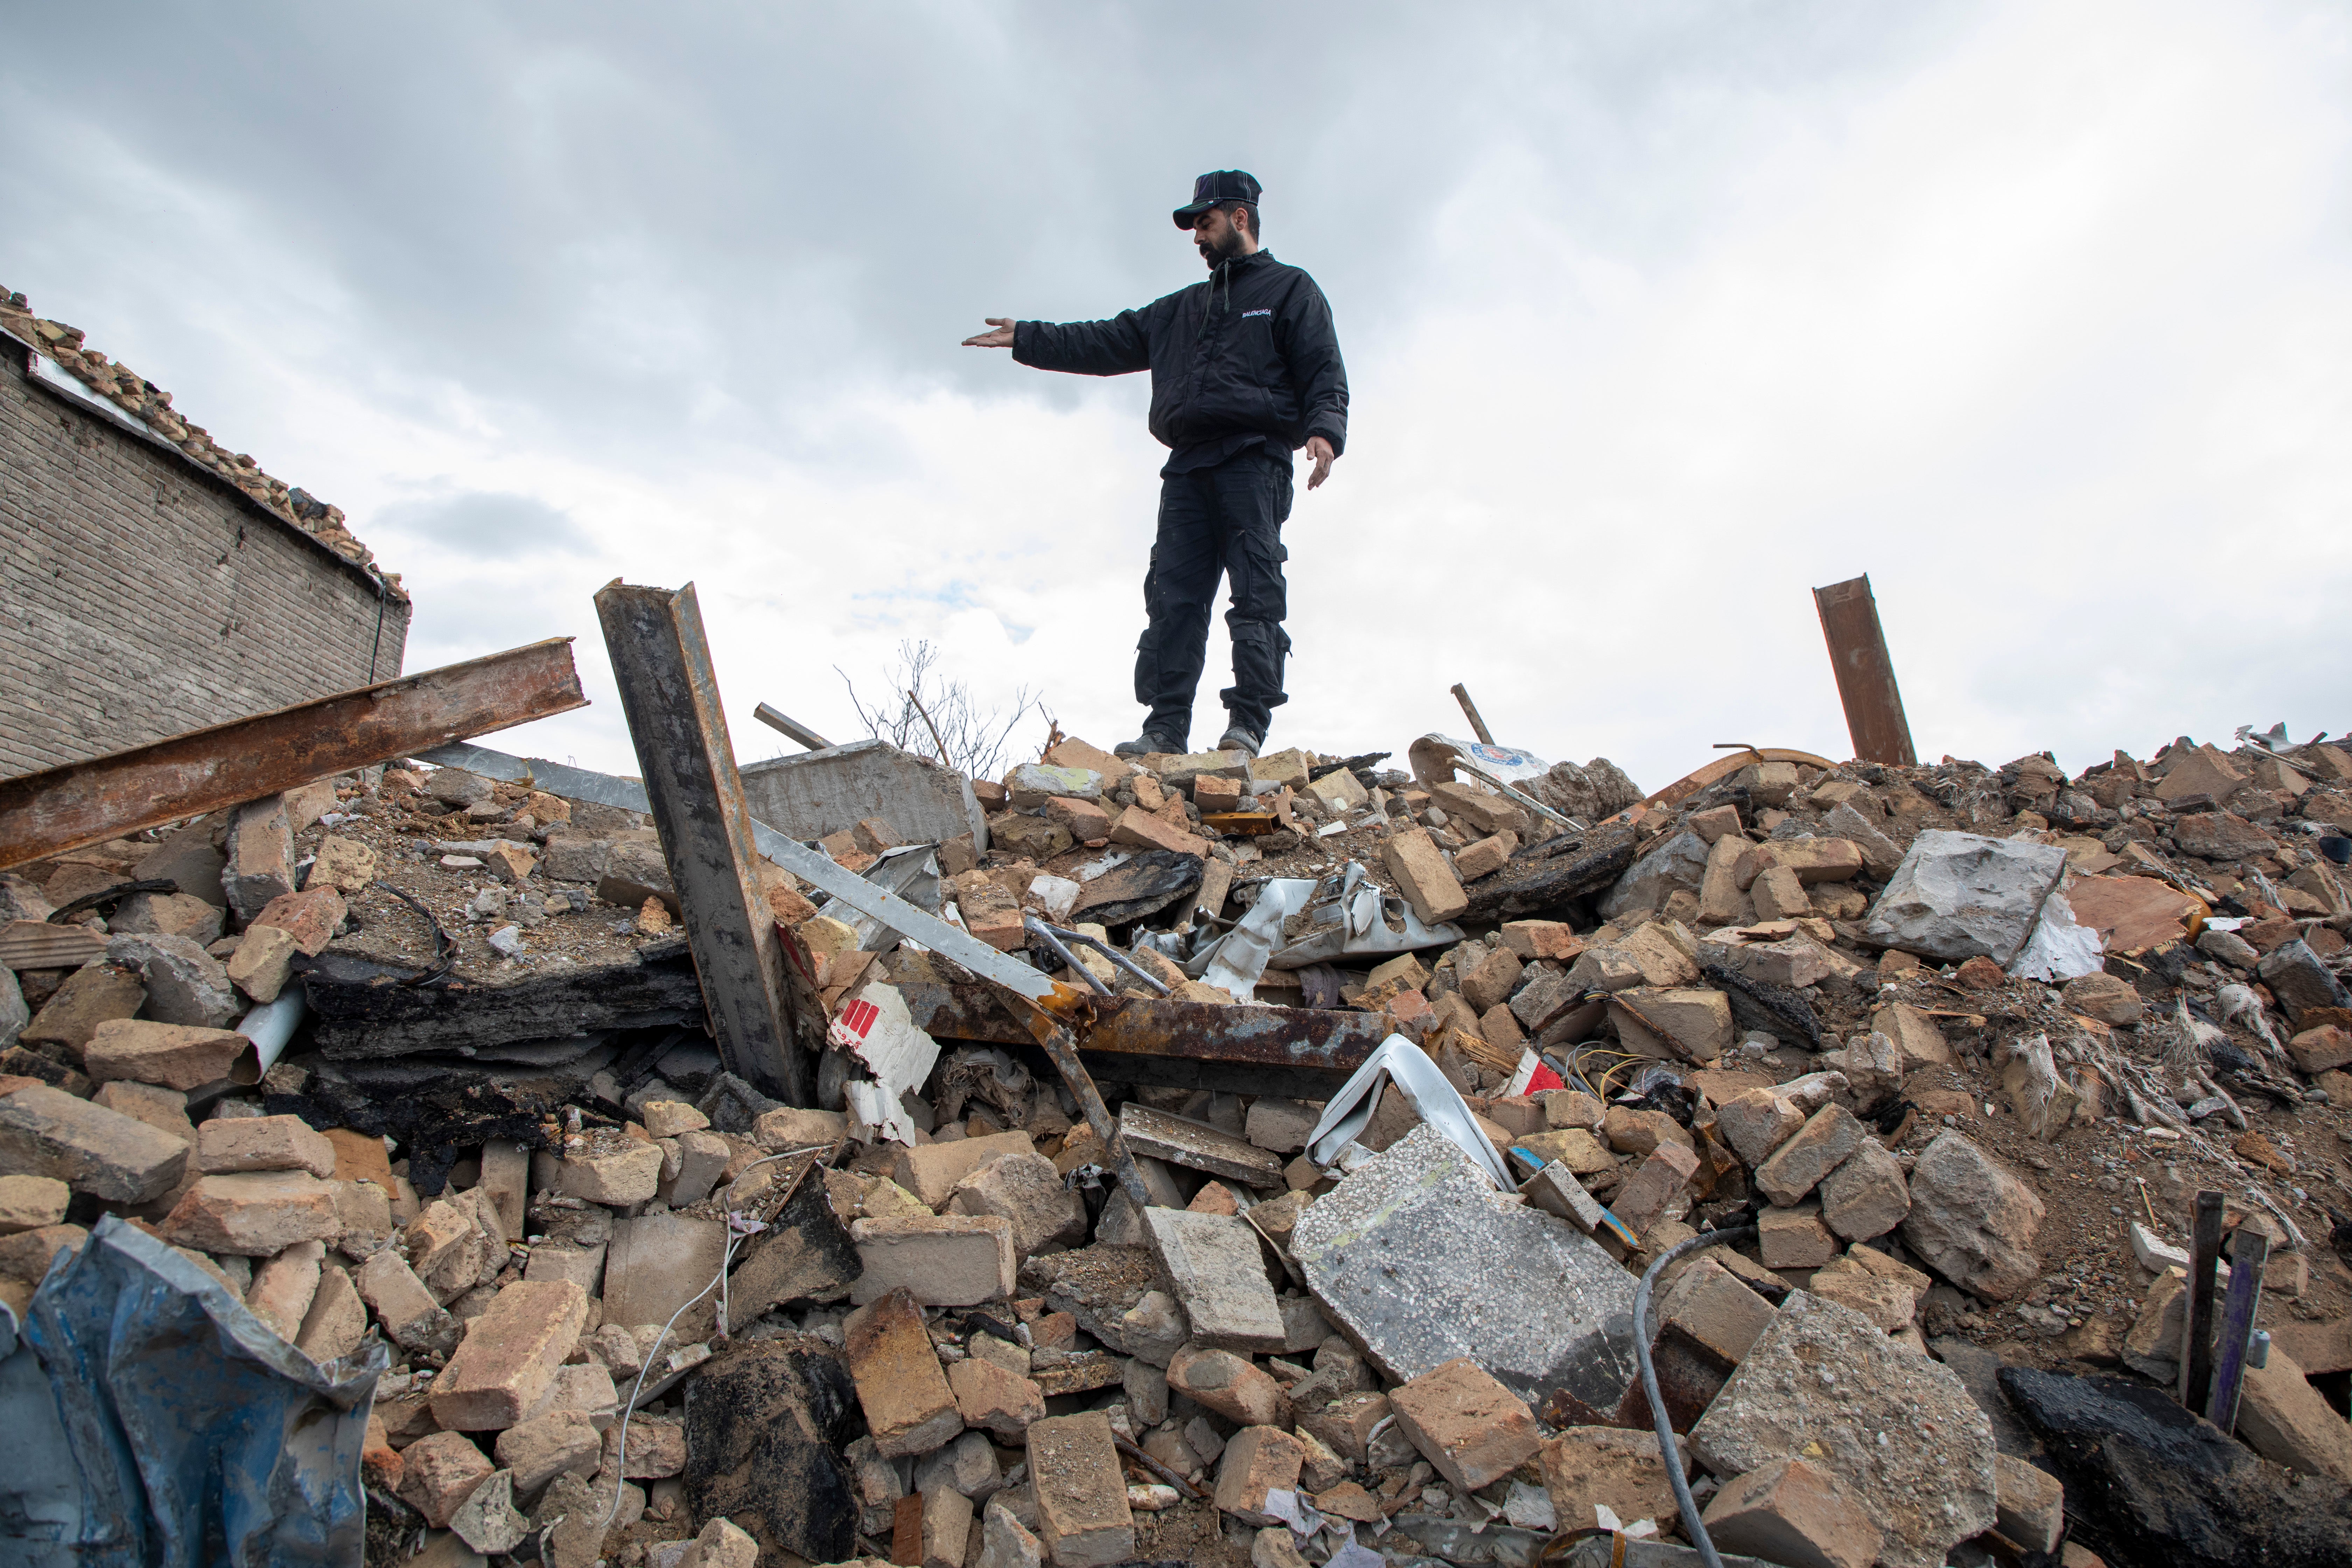
The measures follow years of accusations by Palestinians that actions by settlers and the military — campaigns of violence, harassment and demolitions — have pushed them from their land.
The decisions have drawn widespread condemnation as violations of international law, including from countries involved in the ceasefire process in the Gaza Strip and Trump’s Board of Peace.
Saudi Arabia’s Foreign Ministry in a statement on Monday said the measures were part of Israel’s effort to impose a “new legal and administrative reality” that undermines prospects for peace and stability. Egypt’s Foreign Ministry called the move a “flagrant violation” of international law, warning it would escalate tensions in the Palestinian territories and across the region.
U.N. Secretary-General António Guterres condemned Israel’s decision, calling it not only destabilizing but unlawful according to the International Court of Justice, the U.N.’s highest tribunal, his spokesman Stéphane Dujarric said.
___ Associated Press writer Melanie Lidman contributed reporting from Tel Aviv.


You must be logged in to post a comment Login