
Crypto World
Relative Strength Index (RSI): Trading Strategies, Settings, and Market Applications
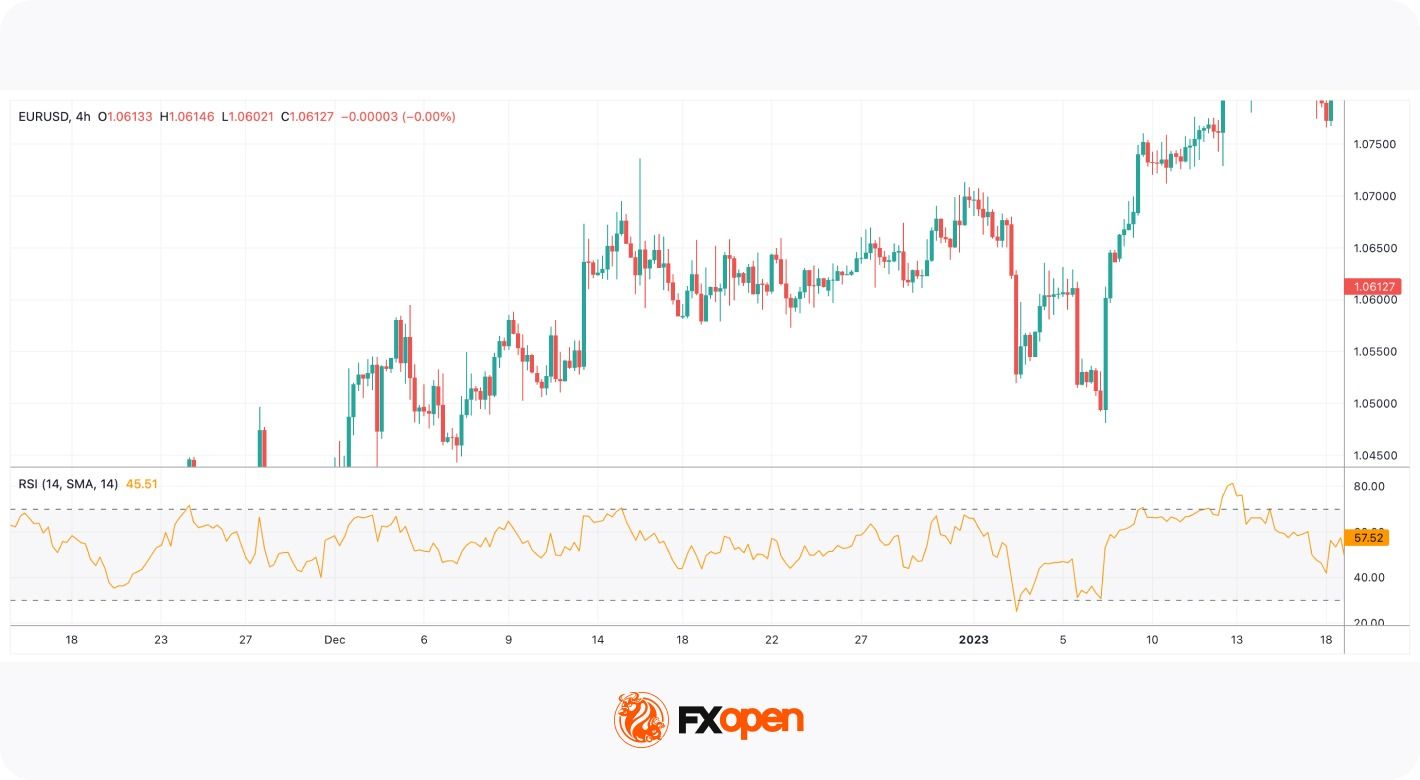
RSI is a popular momentum indicator in technical trading across forex, stock, and cryptocurrency* markets. The Relative Strength Index (RSI) is a momentum oscillator developed by J. Welles Wilder that measures the speed of price movements on a 0–100 scale. Traders use it to detect overbought/oversold conditions, trend strength, pullbacks, and exhaustion.
Although often viewed as a basic oscillator, the RSI plays a more nuanced role in professional trading strategies, particularly when combined with trend and volatility indicators. Understanding how the RSI behaves in different market environments may help traders refine entries, implement risk management strategies, and confirm trade setups.
In this article, we will consider how the RSI indicator works, how it is calculated, and how it can be applied in practical trading strategies across multiple asset classes.
Takeaways
- The Relative Strength Index (RSI) is a momentum indicator that measures the speed and magnitude of recent price movements to evaluate whether an asset is overbought or oversold.
- Developed by J. Welles Wilder, the RSI is plotted on a scale from 0 to 100 and is most commonly calculated over a 14-period timeframe.
- At its core, the RSI compares the average size of recent gains with the average size of recent losses over a defined period.
- Traditionally, RSI trading rules suggest that readings above 70 indicate overbought conditions, while readings below 30 signal oversold levels.
- Besides overbought and oversold signals, the indicator can provide divergence, trend strength, and failure swings signals.
What Is the Relative Strength Index?
The Relative Strength Index (RSI) is a momentum oscillator in modern technical analysis. Developed by J. Welles Wilder Jr. and introduced in 1978 in New Concepts in Technical Trading Systems, the indicator measures the speed and magnitude of recent price movements in order to evaluate underlying market momentum.
The RSI is plotted on a scale from 0 to 100 and is classified as an oscillator because it fluctuates within a fixed range rather than following price directly. This structure allows traders to evaluate whether buying or selling pressure is strengthening or weakening relative to recent market activity.
In practice the RSI functions less as a reversal indicator and more as a momentum persistence gauge. In directional markets the oscillator spends extended time in one half of its range, reflecting order-flow imbalance rather than exhaustion. Professional traders therefore interpret extreme readings as trend participation signals unless market structure begins to break.

Although the RSI is often introduced as a simple overbought-oversold tool, its practical application in professional trading is considerably broader. In leveraged markets such as forex and CFDs, traders use the indicator to identify pullbacks within trends, detect momentum divergence, and refine entry timing across multiple timeframes. The RSI therefore functions less as a standalone signal generator and more as a contextual momentum filter within broader trading systems.
The RSI belongs to the family of bounded momentum oscillators introduced by J. Welles Wilder in New Concepts in Technical Trading Systems (1978), alongside the average true range (ATR), the average directional movement index (ADX), and the parabolic stop and reverse (Parabolic SAR).
RSI Formula and Calculation
How is RSI calculated? It’s quite difficult to calculate the RSI. Fortunately, you don’t need to do it manually, as it’s one of the standard indicators implemented in most trading platforms. For instance, you can use TickTrader to examine the RSI without making complicated calculations.
However, it’s worth understanding how the indicator is measured to know which metrics can affect its performance.
The RSI Formula Explained
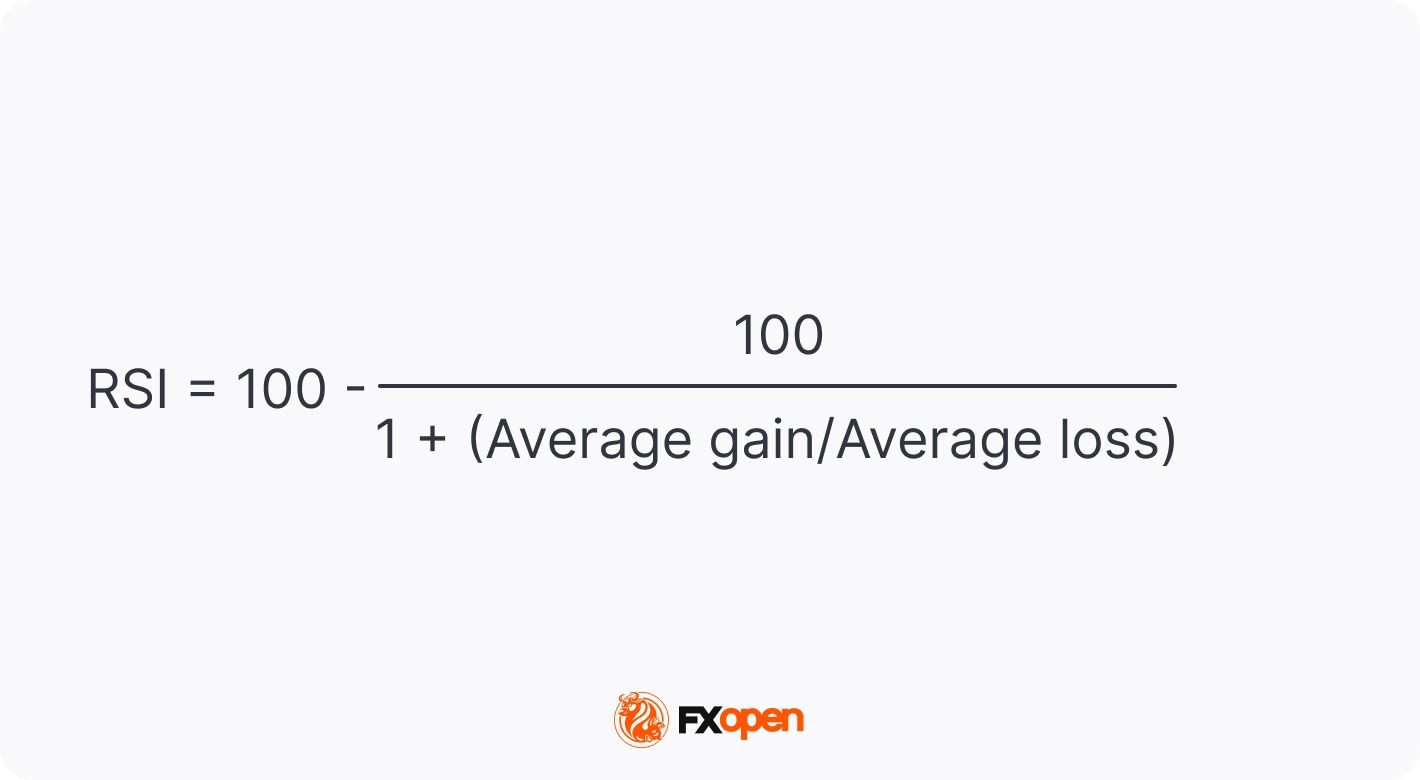
RSI formula
The calculation involves three main steps. First, the average gain and average loss over the selected period are determined. Second, these values are used to calculate relative strength, defined as the ratio of average gains to average losses. Finally, this ratio is transformed into an index value between 0 and 100 using the RSI formula.
The most popular RSI period is 14, meaning its values are based on closing prices for the latest 14 periods, regardless of the timeframe. We will use this period as an example of RSI calculations.
The standard RSI formula description:
Step 1: Average Gain and Average Loss
To calculate average gains and losses, you need to calculate the price change from the previous period.
Note: If the current price is higher than the previous one, add the gain to a total gain variable. If the price declined from the previous period, add the figure to a total loss variable.
After you calculate the change for all 14 periods, you need to add up the gains and divide them by 14 and sum up the losses and divide the total by 14.
Step 2: Calculate the Relative Strength (RS)
RS = Average Gain / Average Loss
To calculate the relative strength, divide the average gain by the average loss.
Step 3: Calculate the RSI
Now that you calculated the RS, you can proceed with the RSI value. For this, you need to add 1 to RS, divide 100 by the sum, and subtract the result from 100.
Relative Strength Index = 100 – 100 / (1 + RS)
Because the calculation uses smoothed averages of gains and losses, the RSI reacts to volatility contraction faster than to volatility expansion. This asymmetry explains why the indicator often gives early signals near market tops but delayed signals near lows.
What RSI Setting Do Traders Use?
The standard period is 14. Shorter lookback periods produce a more sensitive indicator that reacts quickly to price changes but generates more noise. Longer periods smooth out fluctuations but may lag behind rapid market shifts. This trade-off explains why RSI settings are often adjusted according to strategy type, whether scalping, day trading, or swing trading.
The following adjustments are common depending on strategy and timeframe:
Scalping strategies often use shorter RSI periods to capture rapid momentum shifts on lower timeframes. While this increases signal frequency, it also requires stricter risk management due to higher noise levels.
Want to learn how to read the RSI indicator signals?
How Is the RSI Indicator Used in Trading?
How to interpret the RSI indicator? There are four common ways to use the RSI indicator when trading: spot overbought and oversold conditions, find price divergences, implement failure swings for reversal signals, and determine market trends.
Relative Strength Index: Overbought/Oversold Indicator
The traditional interpretation of RSI levels focuses on the 70 and 30 thresholds. Readings above 70 are commonly described as overbought, while readings below 30 are considered oversold. However, in professional trading environments these thresholds are treated as reference zones rather than absolute signals.
The 70/30 framework works primarily in rotational markets. During macro-driven trends, price commonly continues moving after entering overbought or oversold territory because positioning flows dominate short-term mean reversion. In these conditions the RSI defines pullback zones rather than reversal zones.
During sustained uptrends, the RSI typically fluctuates between 40 and 80 (sometimes reaching 90 in very strong trends). Pullbacks often hold above 40, showing that bullish momentum remains intact. In sustained downtrends, the RSI usually ranges between 20 and 60, with rallies failing near 60, reflecting persistent selling pressure. These shifting RSI ranges may help traders assess trend strength rather than relying solely on the traditional 70/30 overbought–oversold levels.
Sustained RSI range shifts usually reflect systematic positioning rather than retail momentum. When the oscillator establishes a higher equilibrium range, dips towards the mid-zone often coincide with passive liquidity absorption rather than trend rejection.
On the daily chart of the GBP/USD pair, the RSI entered the oversold area on 22nd April, left it for a while on 4th May, but returned to it and continued moving upwards only on 15th May.
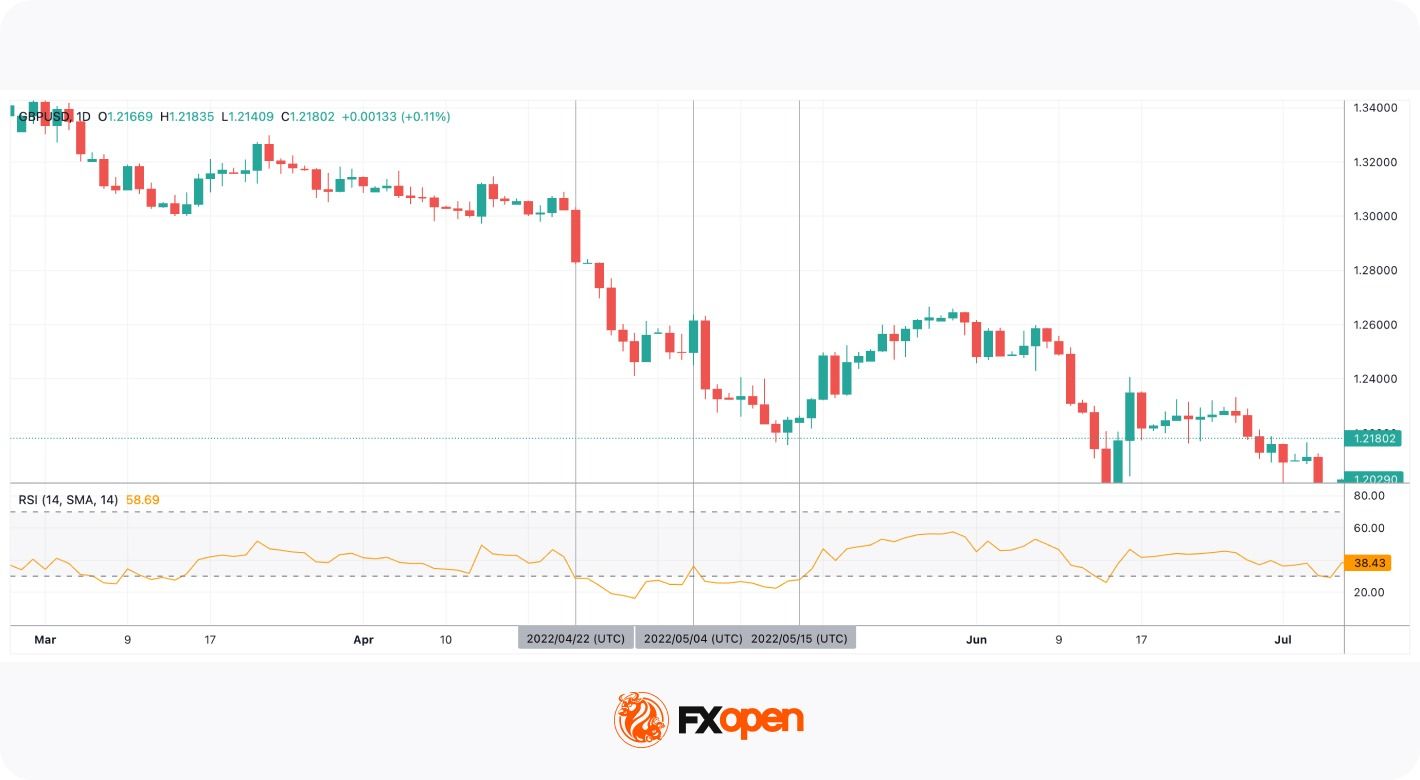
An example of the oversold RSI
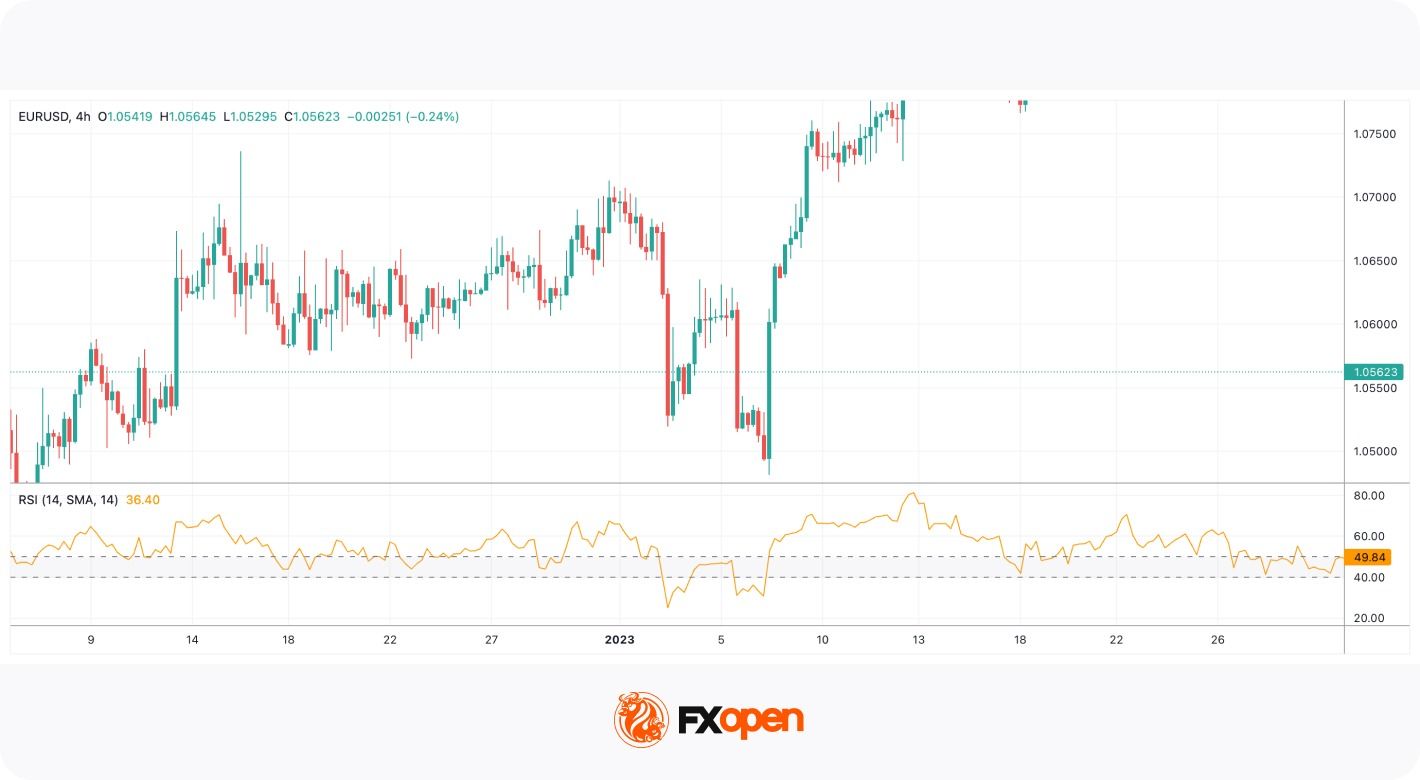
Additionally, when using overbought/oversold signals, traders keep in mind that they can reflect an upcoming correction, not a trend reversal. The GBP/USD pair was trading in a strong downtrend, and the RSI provided a signal of a short-term correction only.
To distinguish between corrections and reversals, traders combine the RSI with other tools. A cross of a moving average can confirm a change in the trend.
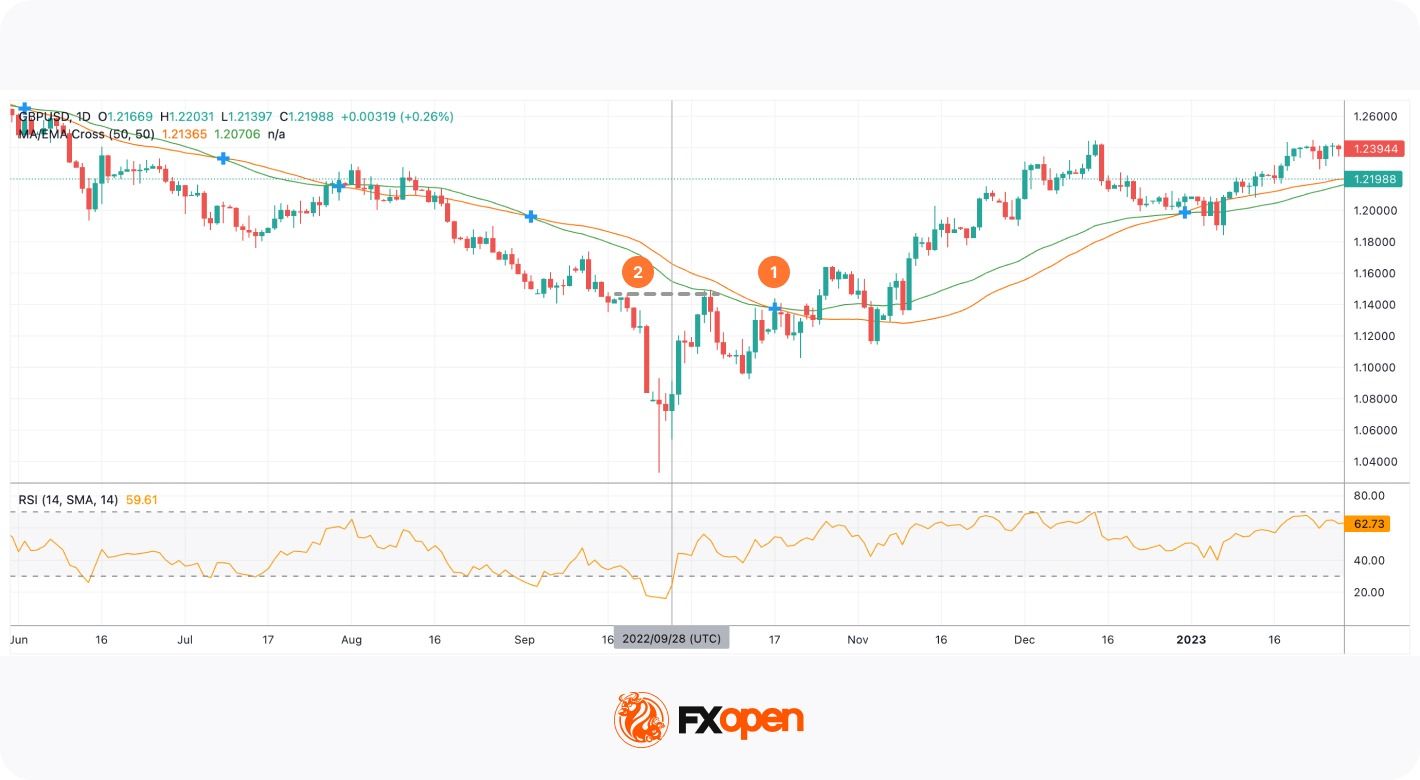
Oversold RSI strategy
On the chart above, the RSI broke above the 30 level on 28th September. A trader could go long, using a trailing take profit. After the MA/EMA cross occurred (1), a trader could trail the take-profit target. Another option would be to place the take-profit order at the closest resistance level (2) and wait for the cross to confirm the reversal signal. After the confirmation, a trader could open another buy position and drive the uptrend.
RSI Divergence Strategy
RSI is a divergence indicator. Another option for using the RSI is to look for divergences between the indicator and the price chart. Divergence occurs when price action and indicator momentum move in opposite directions, signalling a potential shift in underlying market dynamics.
A convention widely used in exchange educational materials is:
- An RSI bullish divergence forms when price records a lower low while the RSI prints a higher low. This pattern indicates that selling pressure is weakening even as price continues to decline.
- An RSI bearish divergence, by contrast, appears when price reaches a higher high but the RSI forms a lower high, suggesting diminishing upward momentum.
Divergence is more popular when it occurs near key support or resistance levels. However, because divergence can persist for extended periods before price reverses, it is rarely traded in isolation. Many traders confirm RSI divergence using tools such as the MACD or structural breaks in market structure.
Hidden divergence is another variation that signals trend continuation rather than reversal. In trending markets, this form of divergence may help traders identify pullbacks that are likely to resolve in the direction of the prevailing trend.
- A bullish divergence forms when the price rises with higher lows, but the relative strength index declines with lower lows, traders expect the price to move upwards.
- A bearish divergence forms when the price falls with lower highs, but the relative strength index moves upwards with higher highs, traders believe the price will decline.
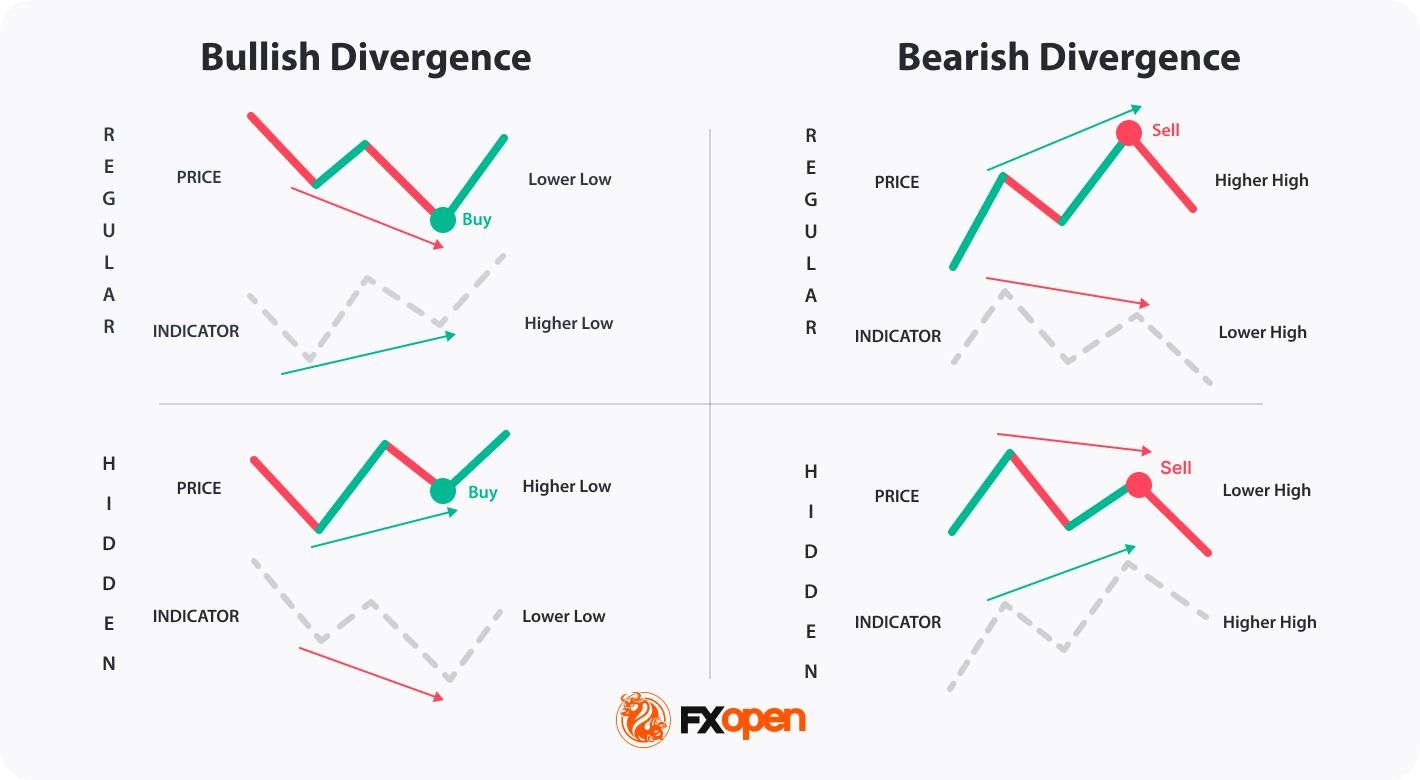
Regular and hidden RSI divergence
Divergence frequently precedes momentum slowdown instead of immediate reversal. Markets often transition into consolidation before changing direction, which is why many traders wait for structure breaks rather than trading the first divergence signal. For example, in liquid index markets the first divergence often leads to range formation before trend change.
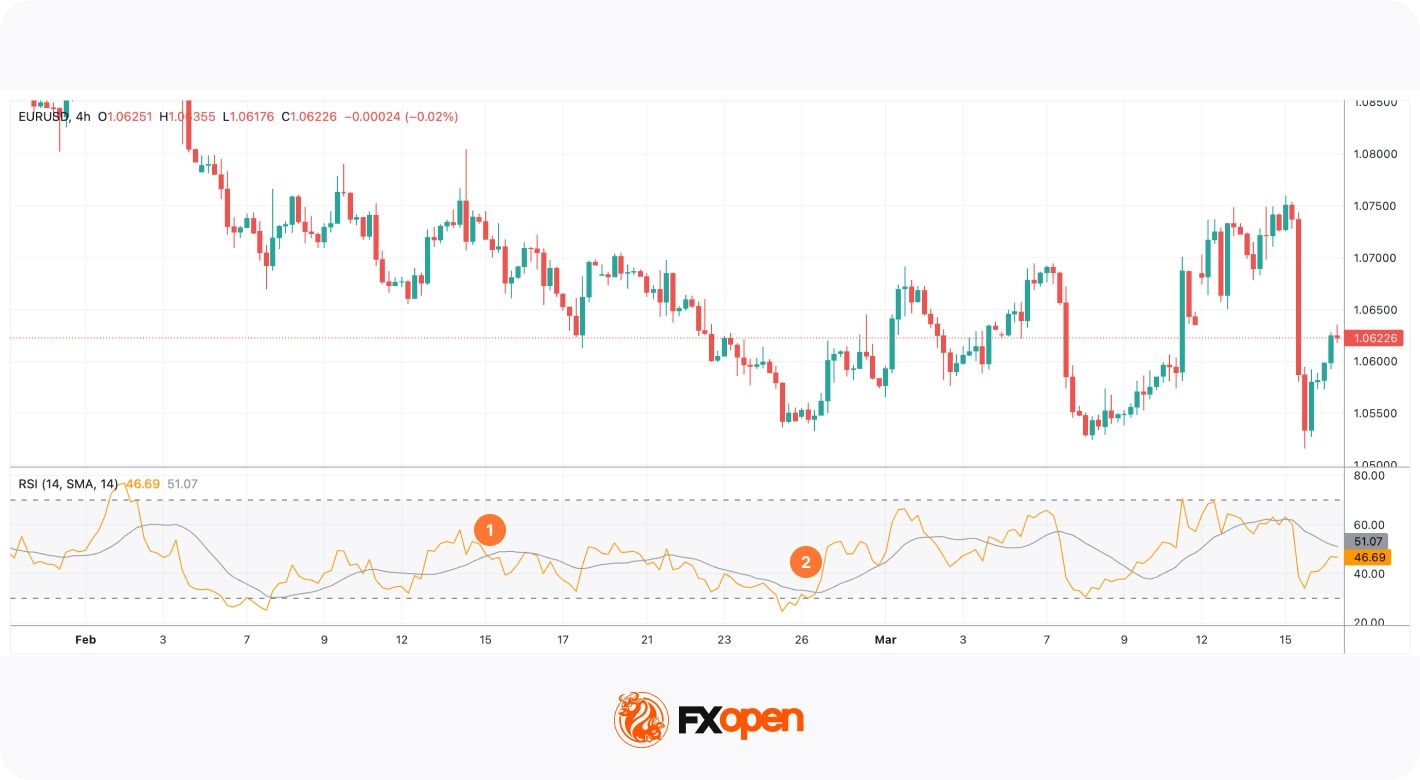
In the RSI example chart below, the indicator and the price formed a regular bearish divergence. As a result, the price fell (1). There was another divergence before the fall, but the price decline was short-lived (2). This highlights risks associated with the incorrect signals the RSI divergence may provide.
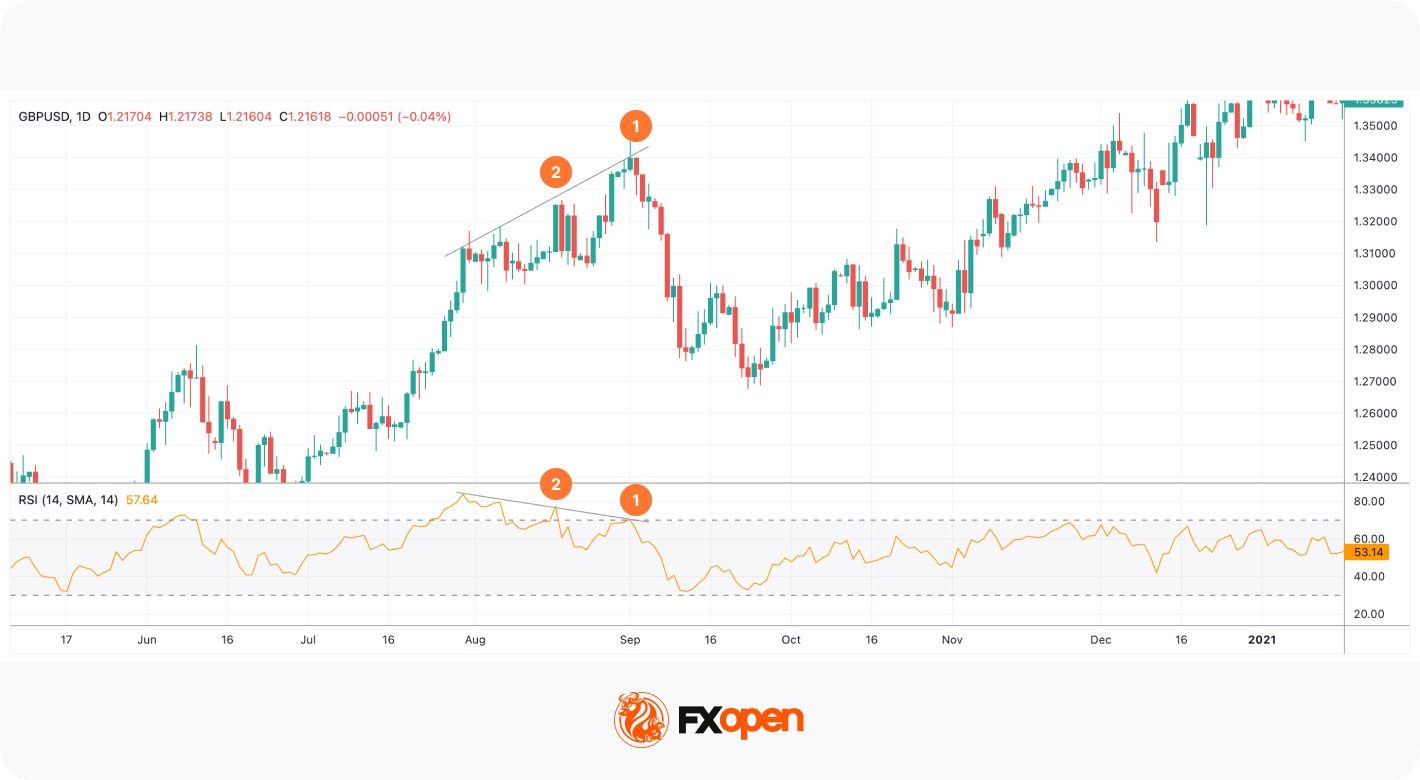
An example of the RSI divergence
RSI Failure Swings: A Reversal Signal
Another signal that traders can consider is failure swings of the RSI which occur before a strong trend reversal. Although it is less common than the others, traders can add it to their list of tools.
The theory suggests traders don’t consider price actions but look at the indicator alone.
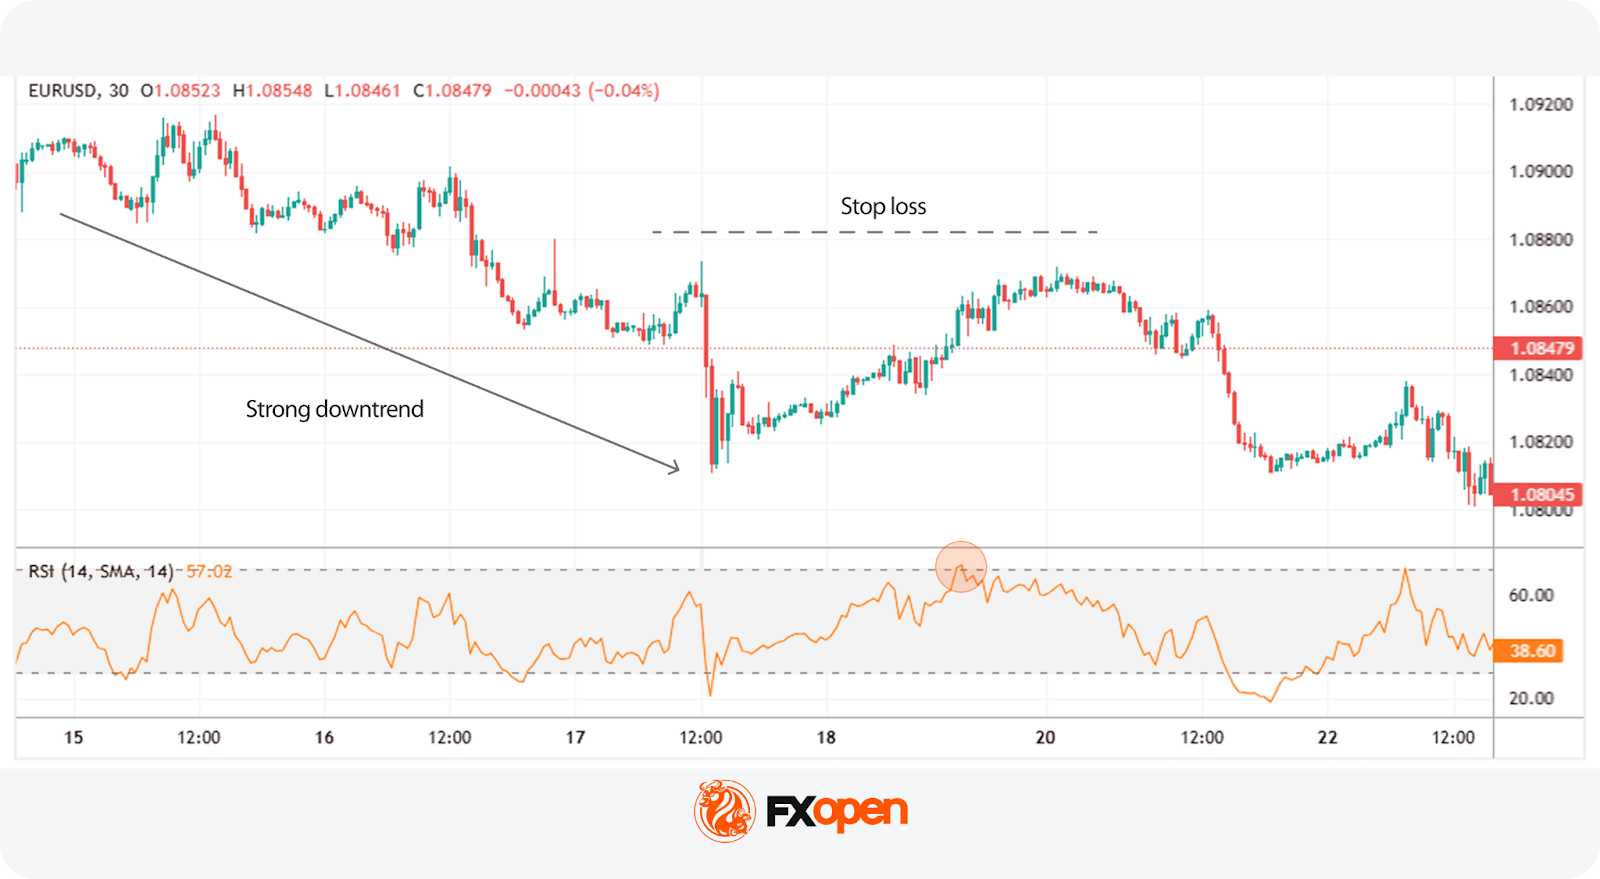
- Bullish reversal. A trend may turn bullish when the RSI breaks below 30, leaves the oversold area, falls to 30 but doesn’t cross it and rebounds, continuing to rise.
- Bearish reversal. A trend may reverse down when the RSI enters the overbought area, crosses below 70, and returns to 70 but bounces and continues falling.
An example of RSI failure swings
Failure swings lose significance during volatility expansion events such as economic releases, when directional movement is driven by repricing rather than momentum decay.
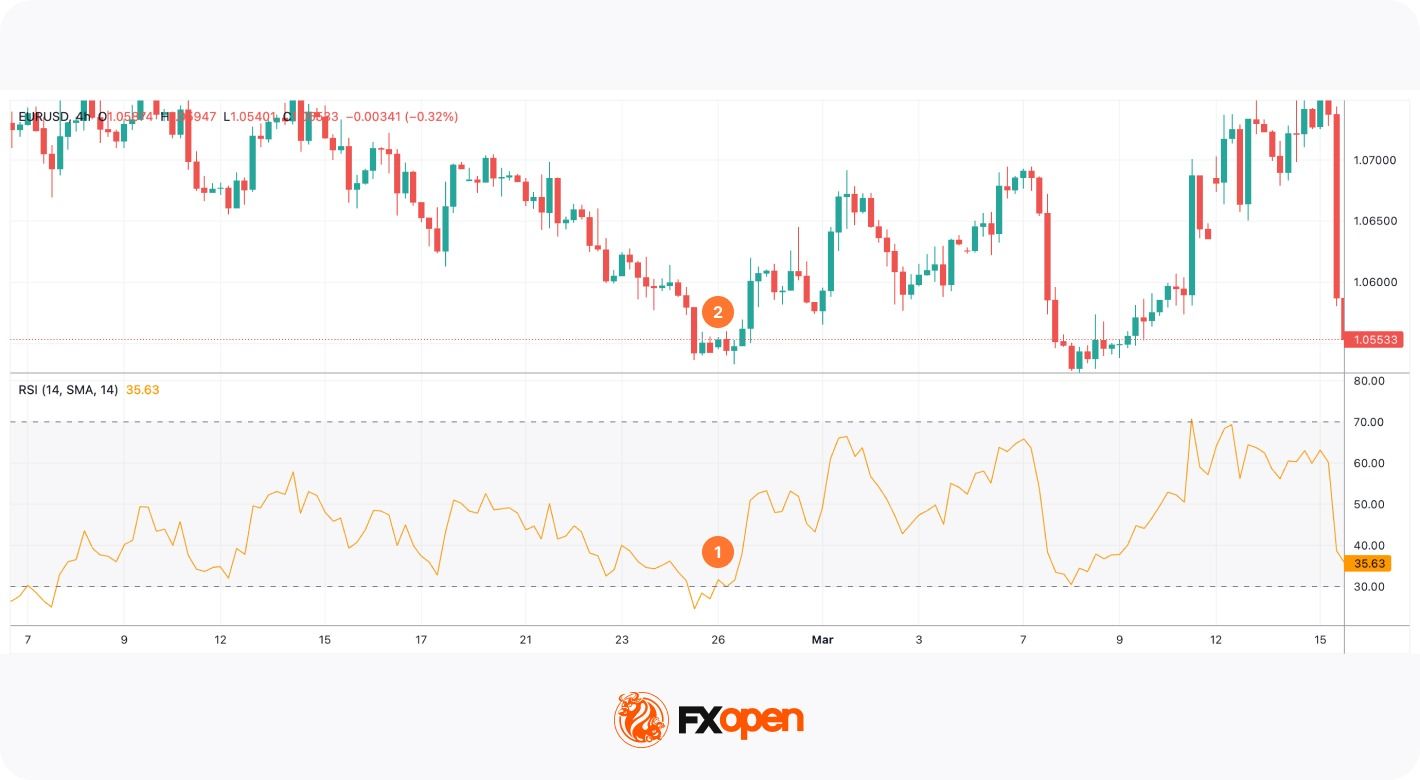
In the chart above, the RSI trading indicator broke below 30, left the oversold area, and retested the 30 level (1). At the same time, the price formed the bottom, and the downtrend reversed upwards (2).
Failure swings are more common on short-term timeframes and do not always reflect a trend reversal. Therefore, traders combine the RSI with trend and volume indicators.
How Traders Identify Market Trends with RSI
The RSI can be used to identify a trend direction. Constance Brown, the author of multiple books about trading, noticed in her book Technical Analysis for the Trading Professional that the RSI indicator doesn’t fluctuate between 0 and 100. In a bullish trend, it moves in the 40-90 range. In a bearish trend, it fluctuates between 10 and 60.
To identify the trend, traders consider support and resistance levels. In an uptrend, the 40-50 zone serves as support. In a downtrend, the 50-60 range acts as resistance.
An example of trend determination using the RSI
In the chart above, the RSI stayed above 40 as the price was moving in a solid uptrend. Once it broke below the 40-50 support level (1), the trend changed (2).
However, there may be incorrect signals. In the chart below, the RSI broke below the support level twice, but the trend didn’t change.
An example of unsuccessful trend detection using RSI
Ranges may vary depending on the trend strength, price volatility, and the period of the RSI.
RSI and Simple Moving Average
Usually, the RSI indicator consists of a single line. However, there are variations of the indicator. It can be combined with the simple moving average. The moving average usually has the same period as the RSI.
The rule is that when the RSI breaks below the SMA, the price is supposed to fall (1). When the RSI rises above the SMA, the price is expected to increase (2).
RSI and Simple Moving Average
However, there are some aspects to consider. Firstly, traders avoid using RSI/SMA cross signals in the ranging market as the lines move close to each other and cross all the time, providing many fake signals. Secondly, a cross doesn’t determine the period of a rise or a fall. Traders use additional tools to identify where the price may turn around.
Note: The RSI is sensitive to volatility clustering. During news-driven sessions the indicator’s thresholds lose value because price movement is distribution-driven rather than momentum-driven.
RSI Trading Strategies Used by Professional Traders
Professional use of the RSI typically involves integrating the indicator into structured trading frameworks rather than relying on single signals. Several widely used approaches illustrate how momentum analysis can support decision-making.
What Is the 70-30 RSI Trading Strategy?
70-30 RSI Trading Strategy
The 70-30 RSI strategy simply uses the overbought and oversold RSI readings to identify potential turning points. However, instead of simply going short above 70 (overbought RSI) and long below 30 (oversold RSI), traders typically apply a few levels of refinement.
Entry:
- Traders determine if the trend is bullish or bearish.
- They apply a trend filter. The RSI can produce false signals in a strong trend, showing overbought for a long time in a bullish trend and vice versa. They often use the 70-30 strategy to look for shorts when the price rallies in a downtrend and longs when the price dips in an uptrend.
- They enter the market when the RSI crosses back into the normal range. For instance, they’ll open a short trade when the RSI falls back below 70, indicating that a potential bearish reversal may be underway.
Stop Loss:
- Stop losses are often set beyond a nearby swing point.
Take Profit:
- Profits might be taken at an area of support or resistance when the RSI hits the opposite extreme (e.g. 70 when long), or when other indicators signal a price reversal.
Mean-reversion RSI strategies statistically depend on market volatility compression. As volatility expands, breakout continuation tends to dominate over oscillator reversal signals.
50-60 and 40-50 Trading Strategies
50-60 RSI Trading Strategy
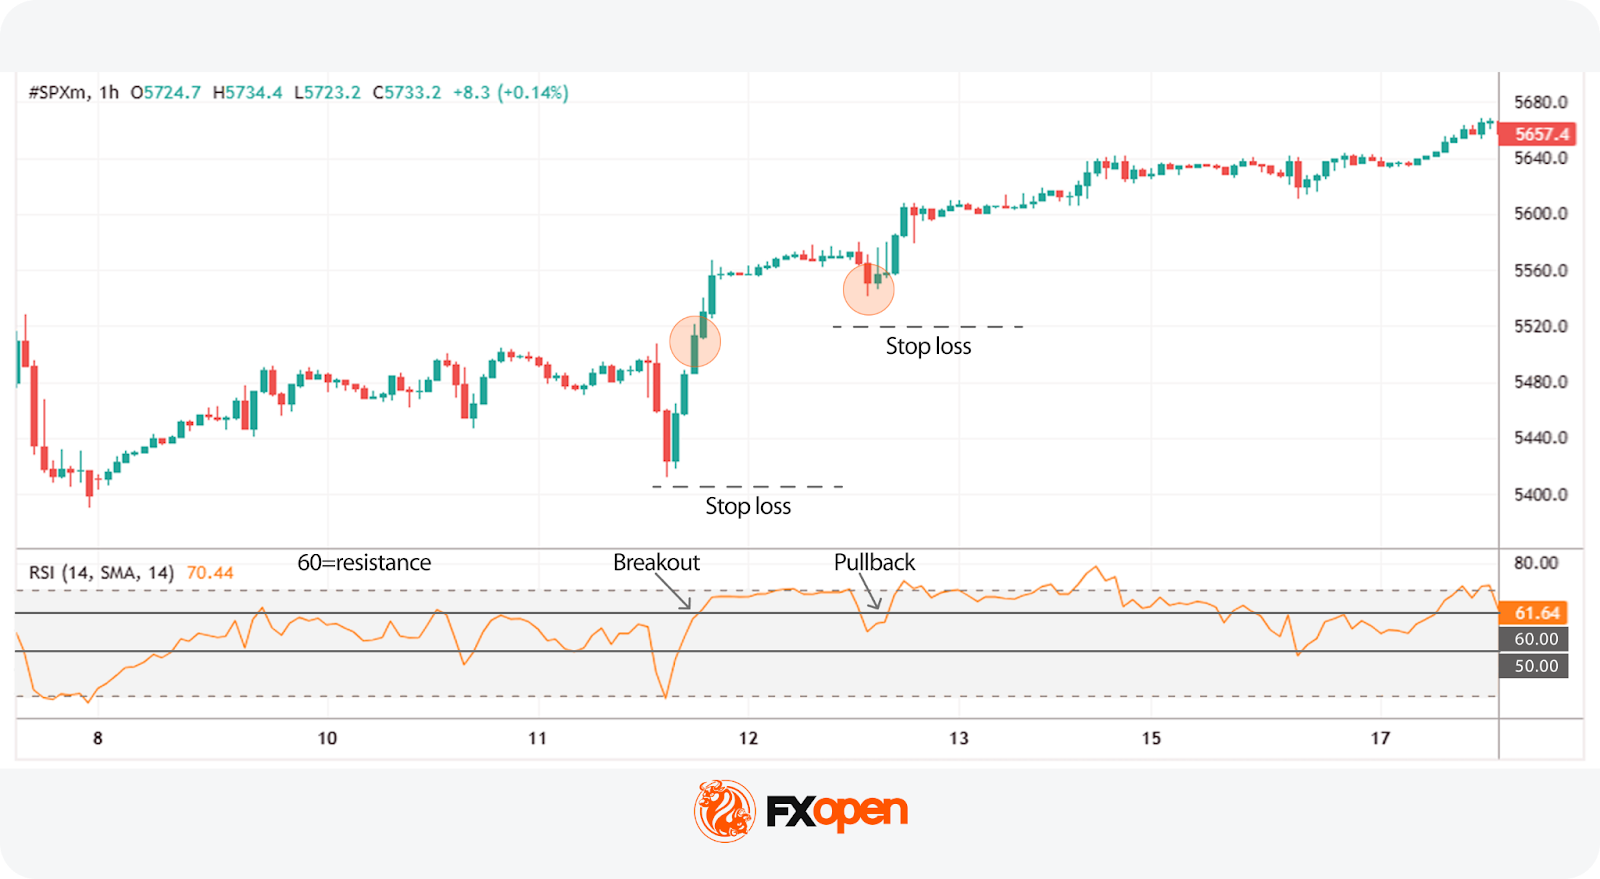
What is the 50-60 RSI trading strategy? The 50-60 RSI strategy works on the idea that the market shows bullish momentum above 50, with 60 acting as a resistance level. When the price breaks through 60, it can signal that bullishness is strong, offering a potential entry point.
Note:
- Despite the name, the same logic can be applied in a bearish trend, where 40 acts as a support level.
- This strategy is popular in markets with a strong trend. Indices, such as the S&P 500 and Nasdaq 100, or commodities like gold, that exhibit strong trends are often chosen by traders.
Entry:
- Traders may enter the market when the price crosses above 60 for the first time.
- Alternatively, they might wait for a pullback to 60 before going long.
Stop Loss:
- A stop loss may be set beyond the nearest major swing point or just beyond the entry candle on a pullback.
- Alternatively, some traders manually stop out if the price crosses below 50.
Take Profit:
- Profits might be taken when the price crosses below 50, giving room for the trade to run in a strong trend. However, this may limit potential returns when trading on short-term timeframes. Therefore, some traders prefer the closest resistance levels.
Typical RSI Strategy Comparison
RSI Meaning in Trading: Forex, Stocks, and Crypto* Markets
The RSI is applied across asset classes, but it behaves differently because persistence characteristics vary. Equity indices exhibit autocorrelation, currencies exhibit mean reversion around macro levels, and digital assets display momentum clustering. RSI interpretation should therefore be adjusted to the instrument’s structural behaviour rather than fixed thresholds.
In forex trading, where macroeconomic factors often drive sustained directional moves, the RSI is commonly used to identify pullbacks within trends rather than outright reversals. Currency pairs can remain overbought or oversold for extended periods when central bank policy or macro data supports a strong directional bias.
What is the RSI indicator in the stock market? In the stock markets, the indicator is frequently applied to mean-reversion strategies around key support and resistance levels. Stocks tend to exhibit more frequent range-bound behaviour than major currency pairs, making traditional overbought-oversold interpretations somewhat more applicable.
Cryptocurrency* markets, characterised by high volatility and rapid sentiment shifts, often produce extreme RSI readings. In this environment, divergence analysis becomes particularly valuable, as momentum frequently weakens before price reverses.
How to Use the Relative Strength Index with Other Indicators
In professional trading systems, the RSI is rarely used in isolation. Combining momentum analysis with trend, volatility, and volume tools may help traders filter signals and false entries.
RSI with MACD
RSI and MACD (moving average convergence divergence) are oscillators. However, they measure momentum differently, which allows one to confirm the signals of another. Usually, traders look for RSI overbought/oversold signals and MACD divergence. For instance, when the RSI is in the oversold zone but the MACD has a bullish divergence with the price chart, traders consider this a confirmation of a coming price rise. Read our article RSI vs. MACD.
RSI with Moving Averages
Early signals are one of the limitations of the RSI indicator. Therefore, traders often combine them with lagging technical analysis tools. An exponential moving average (EMA) is one of the options. Traders add two EMAs with different periods to the chart and wait for a cross to confirm the trend reversal signal the RSI provided.
RSI with Bollinger Bands
Bollinger bands are used similarly to the RSI, showing when the market is possibly overbought or oversold. Used together, these two indicators can provide confluence; for example, if the RSI indicates overbought and the price has closed through the upper band, then there may be an increased likelihood of a bearish reversal, and vice versa.
RSI with On-Balance Volume (OBV)
The on-balance volume (OBV) is a tool that tracks volume to confirm trends. Paired with the RSI, it has two uses. The first is that it can indicate trend strength. If the RSI is falling alongside the OBV, the bearish trend is likely genuine and vice versa. The second is confirming divergences. The OBV can diverge from the price like the RSI, so if both diverge, a reversal may be inbound.
Using RSI on Trading Platforms
Most trading platforms include the RSI as a standard built-in indicator. Platforms such as MetaTrader 4 and MetaTrader 5 allow traders to adjust periods, apply smoothing, and set custom alert levels. Also, you can implement the RSI indicator into your trading strategy on TradingView and TickTrader platforms, which also allow you to set up the indicator for your unique trading style.
Professional traders often integrate RSI signals into multi-timeframe analysis. For instance, a higher-timeframe RSI reading may define directional bias, while a lower-timeframe signal provides entry timing. This approach reduces the likelihood of trading against broader market momentum.
Pros and Cons of the RSI Indicator
Although the relative strength index is one of the most popular indicators, it has limitations. Let’s explore the two sides of the coin.
Benefits of the RSI in Trading
The relative strength index is a useful tool because of:
- Numerous signals. The RSI provides different signals so traders with different trading approaches can add it to their tool list.
- Numerous assets and timeframes. One of its advantages is that you can use the RSI on any timeframe of any asset. What does the RSI stand for in stocks? The same thing that it stands for in forex, commodity, and cryptocurrency* markets.
- Simplicity. Despite the wide range of signals, it’s easy to remember them. If you are familiar with other oscillators such as the stochastic oscillator, you will quickly learn how to use the RSI indicator.
- Standard settings. Although you can change the period of the RSI, its standard period of 14 is used in many trading strategies.
- Working signals. The RSI is one of the most popular trading tools. However, the reliability of its signals depends on trader skills and market conditions.
Limitations and False Signals of RSI
Although the RSI is a functional tool, there are some pitfalls traders should consider.
- Weak at trend reversals. The indicator may provide early signals when spotting trend reversal.
- False signals. The relative strength index isn’t a very popular tool in ranging markets.
- Lagging indicator. The RSI is based on past price data, meaning it may be relatively slow to react to sudden movements.
- Overbought/oversold conditions can persist. In strong trends, prices may remain above 70 or below 30 for long periods, leading to premature entries and exits.
Note: The RSI does not determine price direction; it measures the condition of the current move. Its primary value lies in distinguishing continuation conditions from exhaustion conditions.
Final Thoughts
The Relative Strength Index continues to play a central role in technical trading across forex, equities, and cryptocurrency* markets. Its value lies not in reflecting reversals in isolation but in providing insight into the strength and sustainability of price movements. When used alongside trend analysis, volatility measures, and volume indicators, the RSI becomes a powerful component of structured trading strategies.
For traders operating in leveraged CFD and forex markets, proper application involves combining the indicator with broader analytical tools, adapting settings to the trading timeframe, and maintaining disciplined risk management.
You can consider opening an FXOpen account today to build your own trading strategy in over 700 instruments with tight spreads from 0.0 pips and low commissions from $1.50 (additional fees may apply).
FAQ
What Does the RSI Stand For?
RSI stands for relative strength index. It’s a momentum-based indicator that measures the speed and magnitude of price movements.
What Is the RSI Setting?
The only setting of the Relative Strength Index is the period, which reflects the number of past candles used to calculate average gains and losses, affecting how sensitive the RSI is to price changes. The default period is 14, though shorter or longer settings may be applied depending on trading style and timeframe.
How Traders Use the RSI Indicator
The RSI moves between 0 and 100, with >70 meaning the asset is overbought and <30 meaning oversold. It can be used to spot potential market reversals and confirm trend strength.
Is RSI Used in Forex Trading?
Yes. The RSI is widely used in forex to identify pullbacks, confirm trends, and detect divergence signals.
How Do Traders Use RSI Divergence?
Divergence between price and RSI is often used to identify weakening momentum and potential reversals, particularly when confirmed by other indicators or price-structure analysis.
What Is the RSI in Stocks?
The RSI meaning in stocks refers to the same RSI indicator used in other asset classes. It’s used to gauge buying and selling pressure.
Is High RSI Bullish or Bearish?
A high RSI (above 70) signals bullish momentum, suggesting an overbought market and a potential soon downward reversal.
*Important: At FXOpen UK, Cryptocurrency trading via CFDs is only available to our Professional clients. They are not available for trading by Retail clients. To find out more information about how this may affect you, please get in touch with our team.
This article represents the opinion of the Companies operating under the FXOpen brand only. It is not to be construed as an offer, solicitation, or recommendation with respect to products and services provided by the Companies operating under the FXOpen brand, nor is it to be considered financial advice.


Bitcoin is trading at $67,100 on Sunday, roughly flat over the weekend, but the mood around it is the worst it has been since the Iran conflict began on February 28.
Santiment data published Saturday shows social media commentary on bitcoin has hit a ratio of five bearish posts for every four bullish ones, the most negative skew in five weeks. The last time sentiment was this one-sided was the day Operation Epic Fury launched and bitcoin dropped below $65,000 for the first time in the conflict.
🗣️ According to social data across X, Reddit, Telegram, and other platforms, Bitcoin is seeing the highest ratio of bearish discussions (fear) since February 28th. With crypto’s #1 market cap sitting at $66.8K, FUD has crept back in with the community showing a key lack of… pic.twitter.com/Ym7SbUC22I
— Santiment ✈️ 🇫🇷 EthCC (@santimentfeed) April 4, 2026
The Fear and Greed Index sits at 9, deep in extreme fear territory, where it has been pinned between 8 and 14 for over a month. That kind of sustained single-digit reading without a corresponding price collapse is unusual. In 2022, the index hit comparable levels during the LUNA crash and the FTX implosion, both of which involved actual capitulation events with 20% to 30% single-day drawdowns. This time, bitcoin is grinding sideways in a $65,000 to $73,000 range while sentiment collapses around it.
What matters is that sentiment and price are telling completely different stories. Bitcoin has spent five weeks absorbing war headlines, Trump speeches, $403 million liquidation events, and the most bearish on-chain demand data in years without actually going anywhere. It is still trading within 5% of where it was when the conflict started, grinding sideways while the mood around it collapses.
The reason it hasn’t broken lower is visible in the institutional flow data. ETFs absorbed approximately 50,000 BTC in March, the highest monthly pace since October 2025. Strategy added another 44,000 BTC. Morgan Stanley received approval for a bitcoin ETF at 14 basis points, opening 16,000 advisors and $6.2 trillion in assets under management. The institutional bid is real and it is holding the floor.
But the floor is all it is holding. A CoinDesk analysis from early Saturday showed overall 30-day apparent demand at negative 63,000 BTC, meaning the rest of the market is selling faster than institutions can absorb. Whales holding 1,000 to 10,000 BTC have swung from adding 200,000 BTC a year ago to removing 188,000 today, one of the most aggressive distribution cycles on record.
April has historically been one of bitcoin’s strongest months, finishing green 10 out of 15 years with an average gain of 20.9%. But seasonality does not trade against a war, a negative Coinbase Premium, record whale distribution, and a Fear and Greed Index stuck in single digits.


Ant Digital Technologies, the blockchain division of Chinese conglomerate Ant Group, has unveiled a new platform aimed at enabling AI agents, not humans, to become the main participants in crypto transactions called Anvita.
Unveiled at the company’s Real Up summit in Cannes, Anvita is Ant’s bet on what it calls an “agent-to-agent economy,” where autonomous software programs can hold assets, trade, and make payments with little to no human involvement.
Anvita consists of two main products at its inception. The first, Anvita TaaS (Tokenization-as-a-Service), is focused on tokenizing real-world assets for institutions, including custody and treasury tools. The second, Anvita Flow, is a platform for AI agents to register, find each other, coordinate tasks and settle payments in real time.
“Pure RWA is just the ‘static infrastructure’ of digital assets,” said Zhuoqun Bian, president of blockchain business at Ant Digital Technologies. “The real transformation lies in moving toward an onchain agentic economy, where autonomous agents will not just analyze data — they will hold assets, execute trades, and optimize portfolios.”
Anvita Flow integrates the x402 protocol, developed by Coinbase and Cloudflare, which enables stablecoin payments directly over HTTP. Agents interacting on the platform can complete sub-cent transactions instantly using USDC, removing the need for traditional billing systems, subscriptions or human approval.
The system also includes an Agent Store with modules for data collection, financial analysis and gaming. Developers can list their own agents, and the platform supports major frameworks like OpenClaw and Claude Code, with flexible hosting options.
In practice, the potential extends beyond tokenized assets toward a more active onchain economy. Agents could allocate resources, execute trades, handle services on behalf of users, and settle micro-transactions automatically as they interact.
Ant Digital joins a growing field of companies building infrastructure for AI-driven commerce. Visa and Coinbase have released competing protocols for agent-based payments, with Visa’s Trusted Agent Protocol targeting card-rail checkout and Coinbase’s x402 targeting stablecoin micropayments.
Google unveiled its Agent Payments Protocol (AP2) in September, backed by over 60 organisations. Mastercard acquired stablecoin firm BVNK for $1.8 billion in the largest stablecoin infrastructure deal on record, signaling that traditional payment networks also see blockchain settlement as part of their future.
The Solana Foundation has reported the network already processed over 15 million onchain agent transactions, and Coinbase CEO Brian Armstrong has said he expects agents to surpass humans in transaction volume.
McKinsey has projected that AI agents could mediate $3 trillion to $5 trillion of global consumer commerce by 2030.
Still, usage remains lackluster. The x402 protocol is currently seeing roughly $28,000 in daily volume, much of it from testing, with Artemis analysts flagging roughly half of observed transactions as artificial activity.
Ant Digital’s blockchain, which already supports tokenized assets from various financial institutions, is currently pursuing USDC integration with Circle and applying for stablecoin licences in Hong Kong, Singapore and Luxembourg.


Satoshi Nakamoto’s listed birthday has again drawn attention across the crypto market on April 5.
Summary
- Satoshi Nakamoto’s profile lists April 5, 1975, making Bitcoin’s founder 51 years old on Sunday.
- April 5 may be symbolic because it matches Executive Order 6102 and gold ownership history.
- Satoshi’s final known public forum post came in 2010, followed by last messages in 2011.
The date comes from the Bitcoin creator’s profile on the P2P Foundation and remains one of the few public details tied to the pseudonymous founder.
The Bitcoin community marked April 5 as the birthday linked to Satoshi Nakamoto. The date appears on Nakamoto’s P2P Foundation profile, where the birth date is listed as April 5, 1975.
Based on that entry, Satoshi would turn 51 on April 5, 2026. Still, there is no public proof that the date reflects a real birthday, and the identity behind the name remains unknown.
Satoshi Nakamoto is the name used by the person or group that created Bitcoin, wrote its white paper, and launched its original software. Even after more than a decade, verified facts about the founder remain limited.
That is why the birthday entry continues to attract attention each year. The profile detail stands out because Satoshi left very little personal information in public view, making even a simple date a recurring point of discussion.
The date has also drawn interest because some Bitcoin users connect it to US monetary history. April 5 matches the anniversary of Executive Order 6102, a 1933 order that restricted private gold ownership in the United States.
Some members of the crypto community also point to the listed birth year of 1975, when private gold ownership again became legal in the US. Because of that overlap, some observers believe the date may have been symbolic rather than personal. That view remains uncertain, and no direct proof confirms the reason behind the choice.
Bitcoin founder remains absent from public view
Satoshi’s public silence has added to the mystery around the profile entry. On Dec. 13, 2010, Satoshi made the final known post on the BitcoinTalk forum.
In 2011, Satoshi sent the last known private messages to developers and said Bitcoin was in “good hands.”
Since then, no verified public message has appeared from the Bitcoin founder. Whether April 5, 1975 is a real birthday or a symbolic reference, the date continues to serve as a yearly reminder of the person or group behind Bitcoin’s creation.

X Head of Product Nikita Bier says no technology exists to fix the spam replies plaguing crypto accounts, claiming 80% of crypto activity is driven by bots.
The statement comes amid complaints that the platform is a “horrible website,” and concessions that it remains the least-worst channel for open communication.
X’s Bier Draws a Line on Crypto Spam
Bier’s admission marks a shift in tone from X’s earlier confidence in fighting spam through technical measures.
“The financial incentive to spam on X will decline enormously over the next 30 days and soon be negative,” X’s Nikira Beir said in March.
Over the past year, the platform reportedly purged 1.7 million bot accounts, revoked API access from InfoFi apps that incentivized posting, and rolled out a dislike button to suppress low-quality replies.
However, Bier now argues those tools have limits. He said the only viable path forward is enabling 2nd-degree reply restrictions, a feature X has been testing with Premium+ subscribers.
“There is no technology in the world that could ever fix the spam replies of a crypto account — because 80% of crypto is simply bots. The only path out is to enable 2nd-degree reply restrictions,” wrote Bier in a Sunday post.
The setting expands who can reply to a post beyond just direct followers to include followers of followers, while still blocking unknown accounts and bots.
The concession suggests X (Twitter) views the crypto bot problem as structural rather than solvable solely through detection.
If 80% of crypto accounts are bots, as Bier claims, no filtering system can separate legitimate users from automated ones at scale without collateral damage to real accounts.
Solana’s Anatoly Yakovenko and the Crypto Communication Crisis
Yakovenko’s response highlighted a deeper frustration within the crypto industry. The Solana co-founder called the platform “horrible,” yet acknowledged that open threads on X remain the best available option for public crypto communication.
The exchange followed a satirical post by Solana community member that mocked the state of crypto communications.
The post listed increasingly absurd rules, from not answering X DMs and Telegram messages to not answering your door or responding if your name is called.
The joke landed amid heightened security concerns following the $285 million Drift Protocol exploit on April 1, which used social engineering rather than code vulnerabilities.
That context added weight to the humor. The Drift attacker compromised administrative access through misleading approvals, not a smart contract bug.
In that environment, trusting any inbound communication becomes a genuine operational risk for crypto builders.
X’s Anti-Spam Playbook So Far
Bier has driven several anti-spam measures since joining X as Head of Product in mid-2025. In January 2026, he revoked API access from InfoFi apps like Kaito, which rewarded users for posting on X.
The move crashed Kaito’s token price by 20% and forced the project to sunset its Yaps incentive program.
In March 2026, X teased a dislike button on replies, and Bier signaled that spam’s financial incentive on the platform would turn negative within 30 days.
The platform also began preparing an auto-lock feature that flags accounts posting about crypto for the first time, requiring identity verification before they can continue.
Despite those efforts, Bier’s latest statement reframes the fight. Rather than promising to eliminate crypto spam, he is now telling users the problem is too deeply embedded in crypto’s own ecosystem for any platform to solve.
Could the 2nd-degree reply restrictions meaningfully reduce spam, or would they simply push bot operators to adapt?
Do you have something to share about Twitter’s spam problem, or any other topic? Write to us or join the discussion on our BeInCrypto Telegram channel and in our newsletters.
Follow us on X to get the latest news as it happens
The post 80% of Crypto Is Bots: Why X (Twitter) Might Never Fix the Spam Problem appeared first on BeInCrypto.


Anthropic has entered US election financing with a new political action committee as debate over artificial intelligence policy grows in Washington.
Summary
- Anthropic launched AnthroPAC, giving employees a channel to support candidates during rising AI policy debate.
- The PAC arrived as Anthropic battles Pentagon limits tied to weapons use and surveillance policy.
- Google-backed Texas expansion shows Anthropic is growing political reach while scaling infrastructure for AI demand.
The move adds a new political step for the company at a time when it is also fighting the Pentagon in court and expanding its AI infrastructure plans.
Anthropic filed a statement of organization with the Federal Election Commission on April 3 to create “AnthroPAC.” Reports said the committee is an employee-funded PAC tied to Anthropic and set up as a “separate segregated fund.”
The PAC is expected to back candidates from both major parties. Reports also said the money will come from voluntary employee contributions, while federal campaign finance rules require public disclosure and limit how much PACs can give to federal candidates.
The filing comes as AI policy draws more attention in Washington. Anthropic has already taken part in the political debate this cycle through a $20 million contribution to Public First Action, a group that supports AI safety efforts.
The new PAC gives Anthropic another channel to support lawmakers working on AI rules. That step places the company more directly inside the policy fight as lawmakers, regulators, and technology firms push different approaches on AI governance.
Anthropic is also in a legal dispute with the Pentagon over how its AI systems can be used. The company said in March that the Department of War labeled it a “supply chain risk” after it opposed the use of its tools in autonomous weapons and mass surveillance.
A federal judge in California temporarily blocked that action in late March. The Associated Press reported this week that the Trump administration has appealed that ruling to the Ninth Circuit.
Google backs Texas expansion
At the same time, Anthropic is expanding its computing capacity. Reports said Google plans to help finance a Texas data center project for Anthropic that could exceed $5 billion in its first phase and is being developed with Nexus Data Centers.
That project shows how fast AI infrastructure demand is growing. It also links Anthropic’s political move with a wider business push as the company seeks more influence in policy and more capacity for model development.

Key Takeaways
- Elon Musk’s SpaceX is preparing for a potential IPO with a valuation reaching $1.5 trillion
- The company’s Starlink division pulled in approximately $11.8 billion during 2025
- xAI, Musk’s artificial intelligence venture, was absorbed into SpaceX this year
- Investor confidence remains shaky after 2021 IPO class suffered massive losses of 70–80%
- Direct investment in SpaceX remains unavailable to retail traders, with limited fund access through ARKVX
Elon Musk’s aerospace powerhouse is preparing for what could become one of the largest initial public offerings in American market history. With a private valuation climbing to $1.5 trillion, SpaceX currently holds the title of the planet’s most valuable privately-held enterprise.
Musk launched SpaceX back in 2002 with Mars colonization as his ultimate vision. Over two decades, the enterprise has transformed into a leading player across rocket technology, satellite-based internet connectivity, and artificial intelligence applications.
The Falcon 9 launch vehicle stands as the globe’s most economically efficient and dependable rocket system, having completed more than 633 successful missions. Meanwhile, the company’s Starship platform represents a completely reusable spacecraft engineered for transporting humans and equipment to lunar and Martian destinations.
SpaceX’s Starlink internet constellation generated roughly $11.8 billion during 2025, establishing itself as a cornerstone revenue driver for the organization.
The integration of xAI into SpaceX’s portfolio occurred earlier this year. Musk has publicly stated his vision for space-based solar energy collection to fuel AI computing infrastructure on a massive scale, explaining the strategic rationale behind combining these ventures.
Market Volatility and IPO Concerns
The timing of SpaceX’s public market entry comes amid lingering skepticism about new listings. The IPO frenzy of 2021 left countless investors nursing substantial losses.
Allbirds serves as a cautionary tale—once commanding a $2.2 billion valuation, the company recently sold for approximately $39 million. BuzzFeed has seen its market capitalization collapse from over $1 billion to roughly $23 million. Names like UiPath, GitLab, and Warby Parker continue trading 70–80% beneath their debut prices.
These spectacular failures have created a more skeptical investor base. SpaceX faces pressure to demonstrate sustainable profitability rather than relying on market enthusiasm alone.
Unlike numerous ventures from the 2021 cohort, SpaceX operates as an established business generating substantial revenue. However, market observers note that restoring investor confidence requires clearing a significantly higher bar following years of disappointing IPO performance.
Mainstream investors lack direct purchasing options for SpaceX equity at present. Access remains limited to specialized vehicles like the ARK Venture Fund and XOVR ETF, both maintaining modest positions in the company.
Publicly Traded Space Sector Alternatives
Investors seeking immediate exposure to the space economy can access several companies already trading on public exchanges.
Rocket Lab has successfully deployed 252 satellites and is advancing development of its Neuron next-generation launch system. Intuitive Machines maintains a NASA partnership and provided critical infrastructure for the recent Artemis 2 lunar mission.
AST SpaceMobile operates as a direct Starlink competitor in satellite communications, with AT&T and Verizon among its strategic partners.
On the reporting date, Intuitive Machines’ shares surged 18.53%. AST SpaceMobile climbed 10.28%, while Rocket Lab advanced 3.27%.

Crypto World
OpenAI Cap Table Leak Reveals Microsoft’s 17x Windfall While Sam Altman Holds Zero Equity
Key Takeaways
- Microsoft’s approximately $13B investment in OpenAI now stands at roughly $228B — delivering a 17x multiple
- SoftBank deployed $64.6B and has unrealized gains exceeding $50B, with holdings valued at approximately $99.3B
- OpenAI CEO Sam Altman maintains no ownership position in the artificial intelligence company
- The nonprofit OpenAI Foundation retains 25.8% ownership acquired at no cost — while maintaining complete board control
- Nvidia’s position shows a slight loss, holding $29.6B in value against a $30.1B investment
An ownership breakdown detailing OpenAI’s shareholder structure surfaced online in early April, sparking widespread discussion about the distribution of value within the AI giant. Investor Sheel Mohnot shared the document on X, which appears compiled from publicly available filings and secondary market transactions. The data reflects OpenAI’s current $852 billion post-money valuation after completing a $122 billion capital raise.
The spreadsheet details each major investor’s ownership percentage, capital deployed, and return multiplier. This information provides unprecedented transparency into the financial structure of one of tech’s most valuable private companies ahead of its anticipated public offering.
Microsoft emerges as the dominant financial beneficiary according to the leaked data. The tech giant deployed approximately $13 billion through multiple funding rounds — beginning with a $1 billion investment in 2019, followed by a massive $10 billion injection in January 2023, plus an additional $2 billion during 2024. The company’s 26.79% ownership stake carries an estimated value of $228.3 billion, representing approximately a 17.6x return multiple. This combination of scale and returns is unmatched among OpenAI’s investor base.
Microsoft’s quarterly SEC filings verify the $13 billion total investment amount. OpenAI recently identified Microsoft as a material business dependency in investor disclosures, referencing revenue-sharing agreements and exclusive cloud infrastructure commitments.
SoftBank stands as the largest capital contributor beyond Microsoft, having pledged $64.6 billion to OpenAI. The Japanese conglomerate’s 11.66% ownership position is currently valued at approximately $99.3 billion. This represents unrealized gains surpassing $50 billion on the investment. CNBC reporting verified that SoftBank completed funding its $40 billion commitment by December 2025, utilizing a $40 billion bridge financing facility arranged by JPMorgan and Goldman Sachs.
Original Backers See Extraordinary Multiples
First movers in OpenAI’s funding history achieved the most impressive return multipliers, despite smaller absolute dollar amounts. Khosla Ventures deployed roughly $50 million during 2019, with that position now valued at approximately $1.5 billion — representing a 30x gain. Sound Ventures, the investment firm co-founded by entertainer Ashton Kutcher, committed between $20–30 million and currently holds about $1.3 billion in value, translating to a 43x multiple. Thrive Capital invested $3.5 billion and maintains a 1.98% stake currently worth $16.9 billion.
Nvidia represents the sole investor showing negative returns. The chipmaker holds 3.47% of OpenAI with a current valuation of $29.6 billion, compared to an initial cost basis of $30.1 billion. Much of Nvidia’s contribution came through GPU compute infrastructure rather than direct cash, making the return calculation more nuanced.
CEO Sam Altman’s Equity Remains Undetermined
Perhaps the most striking revelation in the ownership document is that Sam Altman, who has served as OpenAI CEO since 2019, currently possesses zero equity in the organization. His ownership line item shows as undecided. Board chairman Bret Taylor publicly stated in October 2024 that Altman’s equity arrangement had not been finalized. Altman personally refuted speculation about imminent equity grants during an internal employee gathering.
The original OpenAI Foundation nonprofit entity maintains 25.8% ownership with zero capital invested — theoretically producing an infinite return on a holding valued at approximately $219.8 billion. While representing a minority economic interest, the Foundation retains absolute authority over all board member appointments.
OpenAI is preparing for a public market debut targeted for 2026 or early 2027, with discussions centering on a potential $1 trillion valuation. Industry observers anticipate Altman’s ownership compensation will be addressed in connection with that liquidity event.


Drift Protocol said the April 1 attack on its platform followed months of planning and social engineering.
Summary
- Drift said attackers spent six months building trust before using malicious tools to breach contributor devices.
- The exchange linked the exploit with medium-high confidence to actors behind Radiant Capital’s October 2024 hack.
- Drift said repeated in-person contact at crypto events helped attackers study contributors and gain access.
The decentralized exchange linked the case to a group that spent time building trust with contributors before sending malicious tools and links. External estimates put the loss at about $280 million.
Drift Protocol said its early review found a long and organized campaign against the platform. The team said the attackers showed “organizational backing, resources, and months of deliberate preparation” during the operation.
The exchange said the contact began around October 2025. According to Drift, people posing as members of a quantitative trading firm approached contributors at a major crypto conference and claimed they wanted to integrate with the protocol.
Drift said the group kept meeting contributors at several industry events over the next six months. The team said the people involved were technically skilled, knew how Drift worked, and appeared to have real professional backgrounds.
That steady contact helped the group gain trust. Drift said the attackers later used malicious links and tools shared with contributors to compromise devices, carry out the exploit, and remove traces of their activity after the breach.
In addition, Drift said it has “medium-high confidence” that the same actors behind the October 2024 Radiant Capital hack carried out this exploit. That earlier attack caused losses of about $58 million and also involved malware used to gain access to internal systems.
Radiant Capital said in December 2024 that a North Korea-aligned hacker posed as a former contractor and sent malware through Telegram. Radiant said “this ZIP file” later spread among developers for feedback and opened the way for the intrusion.
Drift warns conferences can become attack targets
Drift said the people who met contributors in person “were not North Korean nationals.” At the same time, the team said DPRK-linked threat actors often use third-party intermediaries for face-to-face contact and relationship building.
The exchange said it is now working with law enforcement and other crypto industry participants to build a full record of the April 1 attack.
The case has also added a fresh warning for crypto firms, as conferences and in-person meetings can give threat groups a chance to study teams, build trust, and prepare later attacks.

Key Highlights
- Marvell’s shares climbed 21.3% throughout March, fueled by robust quarterly results and a transformative Nvidia partnership
- Fourth-quarter revenue increased 22.1% to $2.2 billion, while adjusted earnings per share rose 33.3% to $0.80
- Nvidia committed $2 billion to Marvell through an equity investment and unveiled a comprehensive strategic collaboration
- Company executives project 40% data center revenue expansion in fiscal 2027, significantly exceeding Wall Street’s 25% forecast
- Erste Group launched coverage with a Buy recommendation on April 2, highlighting robust financial metrics and AI market positioning
March proved to be a landmark month for Marvell Technology. The semiconductor company not only exceeded expectations with its quarterly performance but also secured a game-changing agreement with Nvidia.
Marvell Technology, Inc., MRVL
The fourth-quarter financial results impressed investors. Revenue surged 22.1% compared to the prior year, reaching $2.2 billion. Adjusted earnings per share hit $0.80, representing a 33.3% increase. Both metrics exceeded Wall Street projections.
Forward-looking guidance reinforced the positive momentum. Executives forecast a 9% sequential revenue boost in the first quarter, with adjusted EPS projected at $0.79. These projections also surpassed analyst expectations.
However, the month’s most significant development arrived on March 31. Nvidia revealed a $2 billion equity stake in Marvell, accompanied by an extensive strategic alliance.
The collaboration encompasses custom silicon development, networking solutions, and optical technology innovations. At its core sits NVLink Fusion, Nvidia’s framework for incorporating external chips into its artificial intelligence infrastructure ecosystem.
The arrangement’s significance lies in the architectural flexibility it creates. Previously, AI infrastructure typically followed two paths: Nvidia-centric systems or custom XPU chip configurations with Ethernet connectivity. This alliance introduces hybrid possibilities — combining XPUs with Nvidia’s GPUs, CPUs, and interconnect technologies.
Data Center Revenue Projections Exceed Expectations
Management established ambitious targets for fiscal 2027. The chipmaker anticipates data center revenue will expand by 40% — substantially surpassing the 25% consensus among financial analysts.
This optimism appears rooted in its XPU operations, which supply custom AI chip intellectual property to cloud computing giants. While concerns had emerged about potential market share erosion at Amazon following the launch of Amazon’s Trainium chips, the aggressive guidance indicates the XPU business remains robust.
Marvell has simultaneously diversified its client portfolio. Microsoft introduced its enhanced Maia2 XPU processor in January, incorporating Marvell’s intellectual property into the chip architecture.
The Nvidia alliance also encompasses silicon photonics — an emerging technology poised to eventually supplant copper-based networking within AI data centers. Given that Nvidia’s existing NVLink infrastructure relies on copper, the partnership with Marvell represents a strategic shift toward optical interconnect solutions.
Wall Street Coverage Intensifies
On April 2, Erste Group launched coverage of Marvell with a Buy recommendation. The investment firm noted that net profits have doubled across the previous five quarters, while return on equity has climbed to 19%.
Erste additionally emphasized Marvell’s competitive advantages in high-performance analog and optical DSP technologies as fundamental drivers behind its optimistic assessment.
The Nvidia investment propelled Marvell to 52-week peak valuations. The stock had traded within a constrained range for much of the preceding six months, but the convergence of impressive earnings and Nvidia’s endorsement triggered a breakout.
Marvell presently trades at approximately 27 times forward earnings projections — a valuation premium compared to last year, though one that numerous analysts consider justified given the data center expansion outlook.
The company’s XPU offerings now interface with Nvidia’s NVLink Fusion infrastructure, potentially unlocking additional revenue opportunities throughout Nvidia’s expanding network of hyperscale clients.

Anthropic, the AI safety-focused lab behind several widely used language models, has moved to formalize its political engagement by launching an employee-funded political action committee named AnthroPAC. A filing with the Federal Election Commission shows the organization as a connected entity to Anthropic, organized as a separate segregated fund and aimed at receiving voluntary contributions from employees. The filing outlines the PAC’s intent to participate in federal elections while remaining aligned with the company’s stated interest in AI policy and safety considerations.
Under U.S. campaign finance rules, individual contributions to a federal candidate are capped at $5,000 per election, with disclosures required through public filings. AnthroPAC’s organizers say the fund is designed to support candidates from both major parties. However, observers and industry watchers are already raising questions about how closely the effort will stay within bipartisan lines, given broader debates over AI regulation, safety standards, and the strategic direction of AI policy in Washington.
The AnthroPAC move lands as Anthropic navigates a fraught relationship with the U.S. government over how its technology should be employed. Separately, the Defense Department in February designated Anthropic as a supply chain risk—an action tied to the company’s stance against the use of its AI in fully autonomous weapons and mass surveillance. Anthropic has challenged that designation in court, contending it constitutes retaliation for a protected position. A federal judge in California has temporarily blocked the measure and paused further restrictions while the dispute unfolds.
Beyond governance and defense concerns, Anthropic has already been active politically this cycle. Notably, the company contributed $20 million to Public First Action, a political committee focused on AI safety and related policy advocacy, underscoring the firm’s broader strategy to influence AI-related regulation and public safety standards.
Meanwhile, Anthropic’s broader ecosystem is drawing capital and infrastructure support that could accelerate its technology roadmap. In a related development, Google is preparing to back a multibillion-dollar data-center project in Texas that would be leased to Anthropic via Nexus Data Centers. The project’s initial phase could exceed $5 billion, with Google expected to provide construction loans and be joined by banks arranging additional financing. The arrangement highlights the growing demand for AI infrastructure capable of supporting expansion in model training, inference, and data storage.
Key takeaways
- Anthropic formed AnthroPAC, an employee-funded political action committee registered as a separate segregated fund under the company’s umbrella.
- The PAC is intended to support candidates from both parties, with strict contribution limits and mandatory disclosures under U.S. election law.
- The move occurs amid fraught relations with the Pentagon over AI use, including a safety-focused designation that Anthropic is challenging in court.
- Anthropic has a track record of political giving in this cycle, including a $20 million contribution to Public First Action focused on AI safety.
- Google’s backing of a Texas data-center project for Anthropic signals strong infrastructure demand and potential financing mechanisms that could accelerate AI deployment.
Anthropic’s political engagement and the policy context
The formation of AnthroPAC marks a notable step in how AI firms engage with lawmakers and regulators. By coordinating staff contributions through a dedicated PAC, Anthropic signals a structured approach to influencing elections and policy debates that shape the development and governance of artificial intelligence. The FEC filing describes AnthroPAC as a “connected organization” operating under a separate segregated fund, aligning with typical industry practices for corporate-employee political activity. While the stated aim is bipartisanship, the broader AI policy environment in the United States has become highly polarized, with differing views on liability, safety mandates, data privacy, and government access to AI systems.
Investors and builders watching the space can interpret this as part of a broader trend: major AI developers increasingly engage directly in policy conversations, seeking to frame the regulatory environment in ways that balance innovation with oversight. The implications extend beyond ethics and governance; policy direction can materially affect the regulatory runway for product development, procurement, and collaboration with public sector actors. The presence of a formal PAC also raises questions about how corporate political contributions could influence which AI-safety and governance proposals gain traction on Capitol Hill and in regulatory agencies.
Defense frictions and legal maneuvering
The tension between Anthropic and the Department of Defense centers on how the company’s models should be deployed in sensitive contexts. The Pentagon’s decision to label Anthropic as a supply chain risk stemmed from the company’s public stance against fully autonomous weapons and broad surveillance use. Anthropic has challenged that designation in court, arguing that it amounts to retaliation for a viewpoint it regards as legitimate and protected. A federal judge in California issued a temporary ruling to pause the measure and related restrictions while the case proceeds, illustrating the jurisdictional balance between corporate risk assessments and national-security considerations in AI technology usage.
For policymakers, the case underscores a core policy question: where should the line be drawn between compelling safety and preserving innovation? If courts narrow how procurement risk designations can be wielded, it could affect how similar technology providers are treated as the government expands its AI procurement and testing programs. Conversely, if the government can justify risk designations on safety grounds, it could strengthen leverage for tighter controls on how AI systems are used in defense contexts.
Political giving and AI-safety advocacy
Anthropic’s political activity isn’t limited to its new PAC. Earlier in the cycle, the company contributed a sizable $20 million to Public First Action, a political arm focused on AI safety and public-interest considerations tied to the development and governance of AI technologies. This level of funding signals a broader strategy to influence public discourse and regulatory design around AI, complementing the PAC’s electoral role with policy advocacy and education efforts. Observers are watching how such funding patterns translate into concrete policy outcomes, particularly in an environment where legislators are weighing landmark AI bills and safety standards that could shape model development, data usage, and transparency requirements.
Infrastructure bets amid AI acceleration
Infrastructure matters are increasingly central to AI strategy, and Google’s involvement in a Texas data-center project for Anthropic is a vivid illustration. The Nexus Data Centers-leased facility, if realized as outlined, could become a cornerstone asset to support large-scale model training and deployment. The project’s initial phase exceeding $5 billion underscores the capital intensity of modern AI initiatives and the financial orchestration that underpins them. Google’s expected role in providing construction loans, alongside competitive financing arrangements from banks, points to the consolidation of AI infrastructure finance as a distinct sub-market within the tech sector. For Anthropic and similar firms, such backing could shorten timelines to deploy more capable models and scale services that demand robust, energy-efficient, and highly reliable data-center capacity.
As policy debates progress, industry participants and investors should monitor both political and practical developments: how much traction new AI safety proposals gain in Congress, how procurement rules evolve in defense programs, and how infrastructure financing evolves to accommodate the next wave of AI workloads. Each of these strands will influence not only which AI products reach market first, but also how quickly the industry can translate research advances into real-world use cases across enterprise, healthcare, and public services.
Readers should stay attentive to any updates on Anthropic’s PAC activity and the Pentagon case outcomes, as both arenas will shape the company’s public-facing strategy and its broader partnerships. The balance between safety-driven governance and aggressive innovation remains a live tension set to define the next phase of AI adoption and investment.

‘Hidden gem’ Robin Hood’s Bay ranked a top staycation spot

Medik8 Physical Sunscreen SPF50+ Urgently Recalled in Australia Over Failure to Meet Advertised SPF Rating

BTC enters April at its most hated level since the war began


-

 NewsBeat3 days ago
Steven Gerrard disagrees with Gary Neville over ‘shock’ Chelsea and Arsenal claim | Football
-

 Business3 days ago
No Jackpot Winner and $194 Million Prize Rolls Over
-

 Fashion2 days ago
Weekend Open Thread: Spanx – Corporette.com
-
Entertainment6 days ago
Fans slam 'heartbreaking' Barbie Dream Fest convention debacle with 'cardboard cutout' experience
-

 Crypto World4 days ago
Gold Price Prediction: Worst Month in 17 Years fo Save Haven Rock
-

 Tech6 days ago
The Pixel 10a doesn’t have a camera bump, and it’s great
-
Crypto World5 days ago
Dems press CFTC, ethics board on prediction-market insider trades
-

 Tech6 days ago
Avatar Legends: The Fighting Game comes out in July and it looks pretty slick
-

 Business3 days ago
Login and Checkout Issues Spark Merchant Frustration
-

 Sports15 hours ago
India men’s 4x400m and mixed 4x100m relay teams register big progress | Other Sports News
-

 Tech6 days ago
Apple will hide your email address from apps and websites, but not cops
-

 Sports5 days ago
Tallest college basketball player ever, standing at 7-foot-9, entering transfer portal
-

 Tech5 days ago
EE TV is using AI to help you find something to watch
-

 Politics6 days ago
Should Trump Be Scared Strait?
-

 Tech5 days ago
Flipsnack and the shift toward motion-first business content with living visuals
-

 Fashion6 days ago
The Best Spring Trends of 2026
-

 Tech5 days ago
How to back up your iPhone & iPad to your Mac before something goes wrong
-
Crypto World7 days ago
Bitcoin’s Six-Month Losing Streak: What On-Chain Data Says About the Market’s Next Move
-

 Politics6 days ago
BBC slammed for ignoring author of The Fraud
-
Tech5 days ago
Daily Deal: StackSkills Premium Annual Pass
You must be logged in to post a comment Login