
Crypto World
Solana price risks pullback as MACD turns bearish

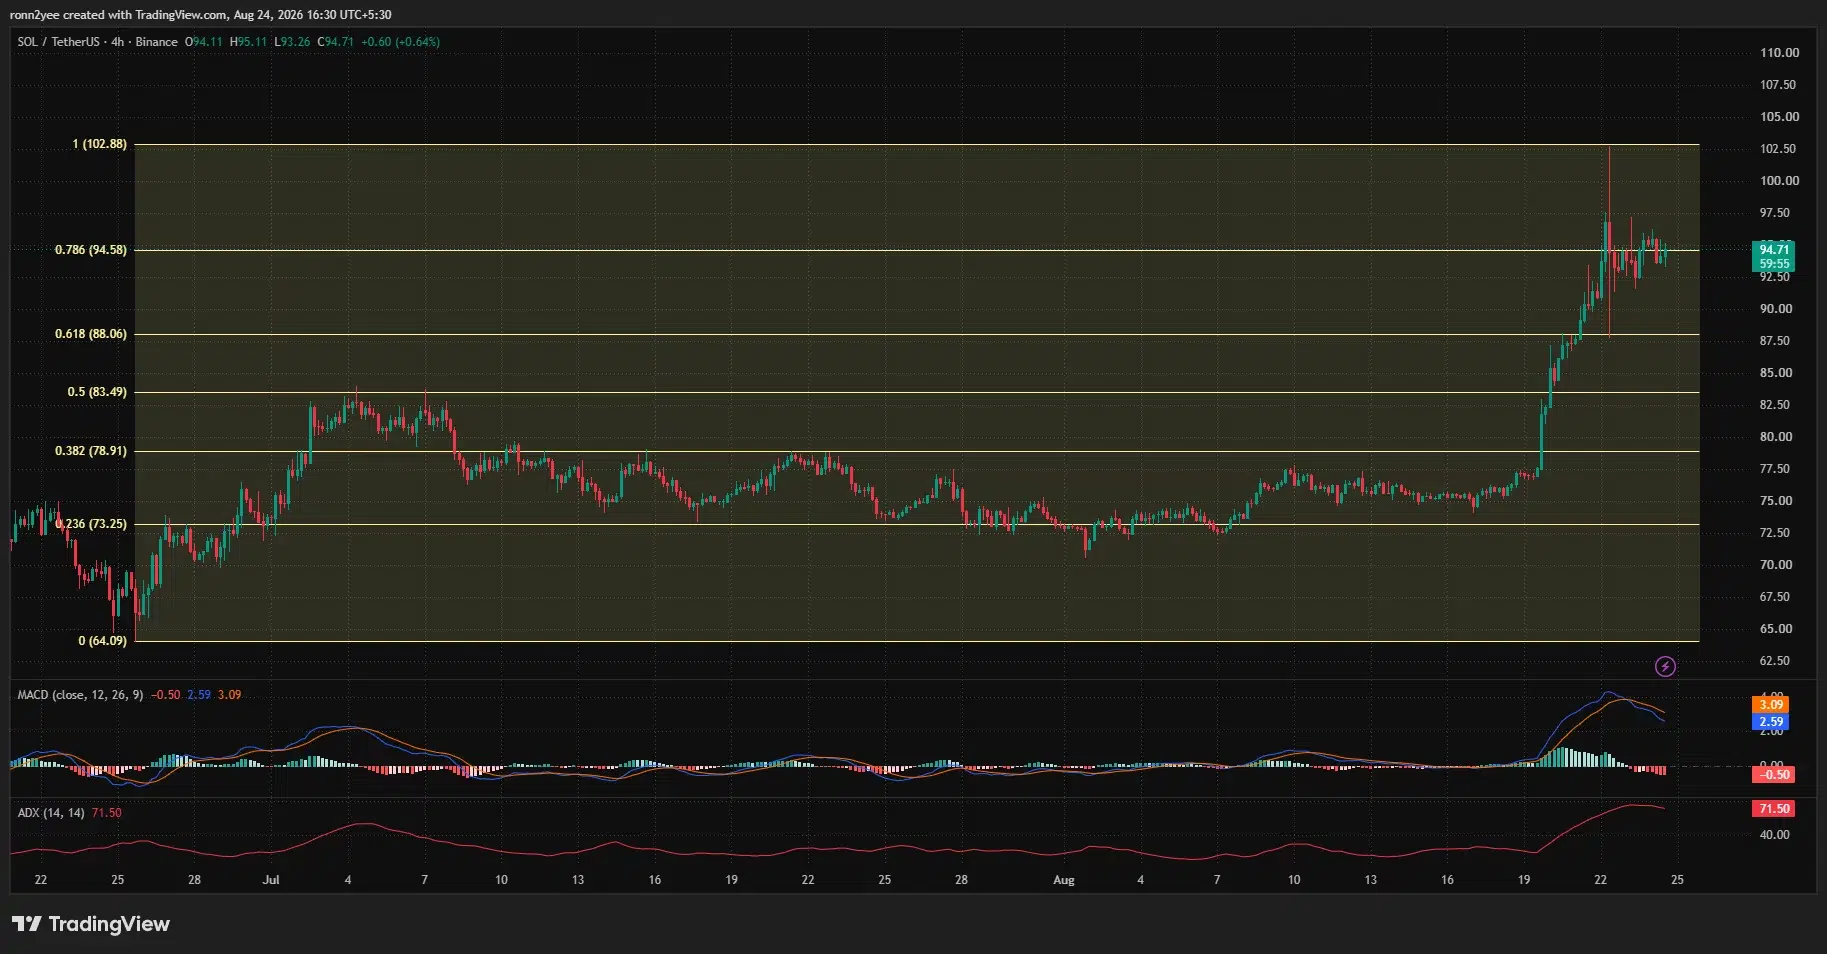
Solana price held near $95 on Aug. 24 after gaining roughly 26% as regulatory optimism, record tokenized-asset value and active network governance votes supported the rally.
Summary
- Solana price gained about 26% after breaking above the former $78 resistance level.
- SOL faces daily resistance between $97.68 and $98.44 after briefly reaching $102.88.
- Validators are voting on proposals covering governance, inflation, and transaction fees.
- Liquidation liquidity is concentrated near $96.30, with another cluster around $93.
Solana price action today
According to data from crypto.news, Solana (SOL) price traded at $94.71 at press time on Aug. 24. The token had risen from around $75 before accelerating above $78 on Aug. 19.
On the 4-hour chart, SOL extended the breakout through $83.49 and $88.06, corresponding to the 50% and 61.8% Fibonacci retracement levels measured from $64.09 to $102.88. The rally briefly carried the price above $100 before sellers forced it back toward $88.
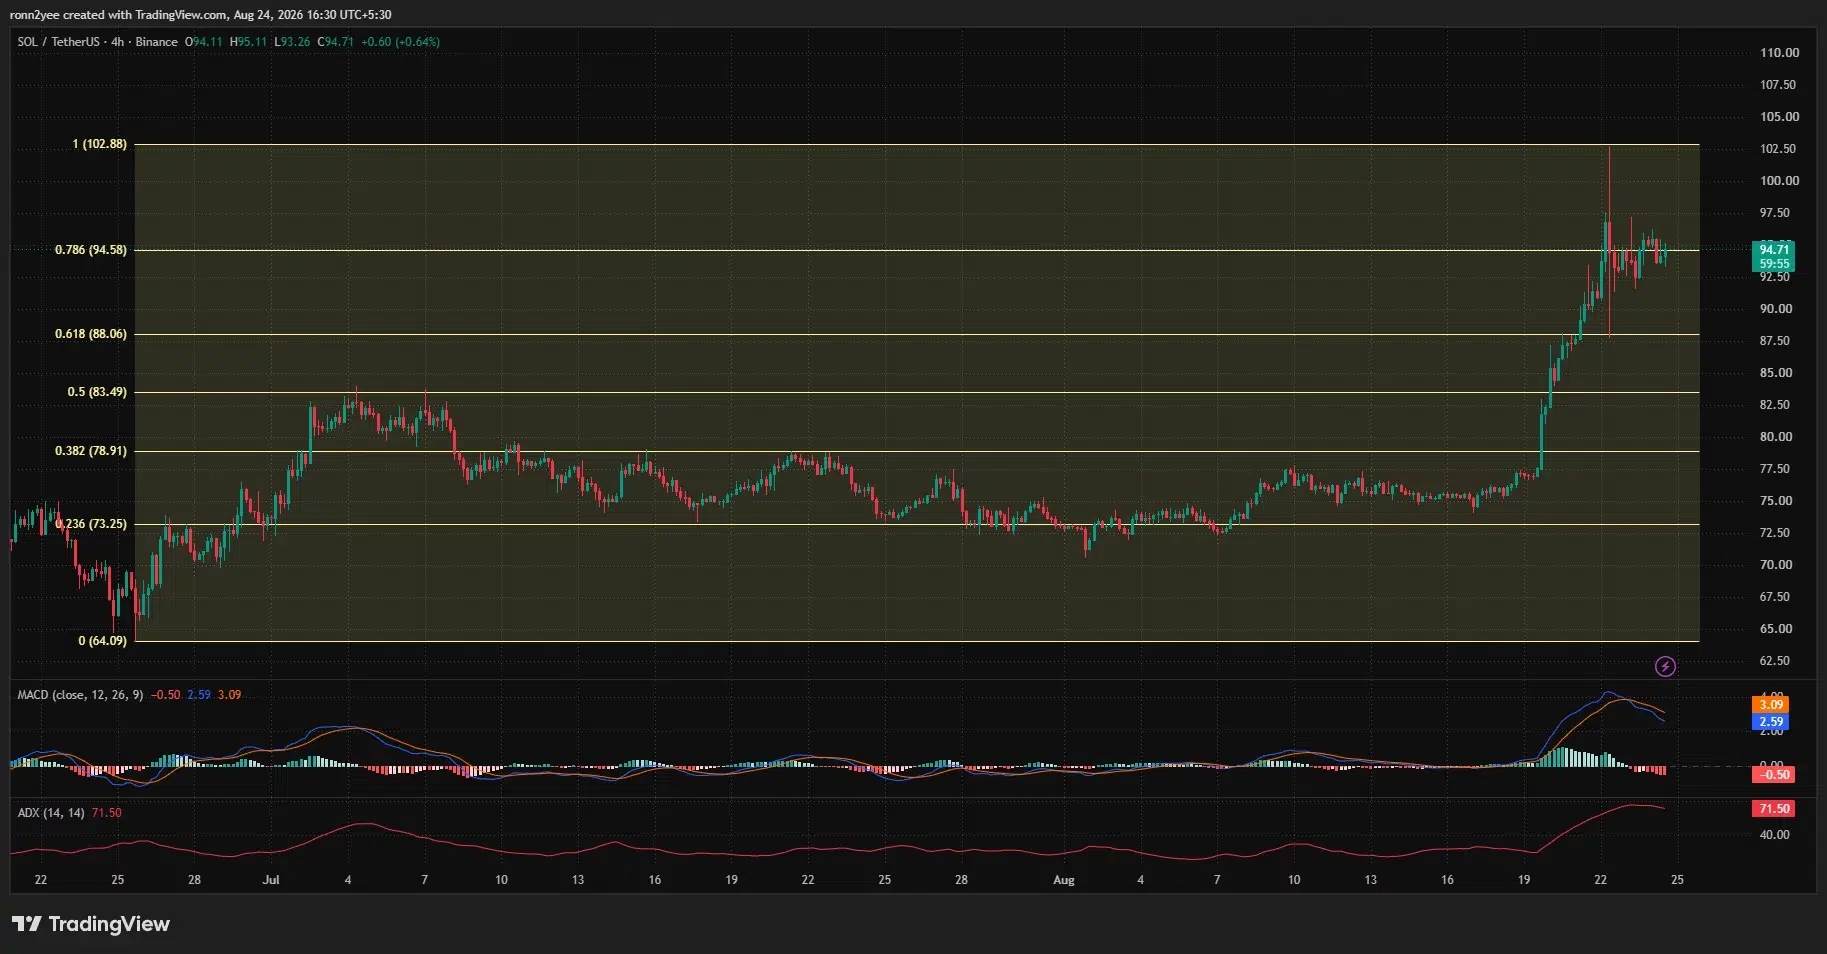
Buyers subsequently defended the pullback and returned SOL to the $94.58 Fibonacci level. Price was consolidating slightly above that mark at the time of the chart capture, leaving the market near the upper end of its two-month range.
The daily chart shows SOL trading above its 20-, 50-, 100-, and 200-day moving averages. Those averages were positioned between $76.56 and $81.27, showing how far the price moved from its recent trend levels during the rally.
SOL’s advance also followed a wider crypto recovery. Bitcoin and crypto-linked U.S. stocks rose after the Treasury expanded its long-duration debt buybacks and President Donald Trump renewed his push for the CLARITY Act.
What is driving the SOL rally?
The rally coincided with the U.S. Securities and Exchange Commission’s Aug. 18 proposal for a new framework called Regulation Crypto Assets.
The SEC said the proposed rules would give crypto companies clearer routes to raise capital under federal securities laws. The framework would also establish conditions under which certain crypto-related investment contracts could move outside existing securities requirements.
The proposal does not amount to a Solana-specific ruling or automatically remove every regulatory risk facing SOL. However, its publication reduced some of the uncertainty surrounding how U.S. securities rules may apply to functional blockchain networks and token offerings. Public comments remain open through Oct. 20.
Solana also received a network-specific catalyst when voting opened on its first three formal governance proposals. According to crypto.news, voting will remain open through epoch 1023, expected to end on Aug. 27 at approximately 15:30 UTC.
SGP-0001 would introduce the Solana Constitution as a common governance framework. SGP-0002 would double the network’s annual disinflation rate from 15% to 30%, potentially removing about 18.9 million SOL from scheduled emissions over six years.
SGP-0003 proposes a new resource and inclusion fee structure. SolanaFloor estimated that the change could raise daily SOL burning from about 648 tokens to roughly 9,000, although the outcome depends on validator approval and subsequent network activity.
Solana’s tokenized real-world asset market provided another source of support. RWA.xyz data showed that the value of tokenized assets on the network crossed $4 billion for the first time, while the number of RWA holders reached approximately 348,489.
SOL resistance sits between $97.68 and $102.88
SOL must first close decisively above the daily resistance zone between $97.68 and $98.44 to extend its recovery. The price tested the area during the latest rally but failed to hold above it.
A confirmed breakout would bring $100 back into view, followed by the Aug. 22 wick at $102.88. Clearing that high would remove the most visible nearby supply zone on the provided charts.
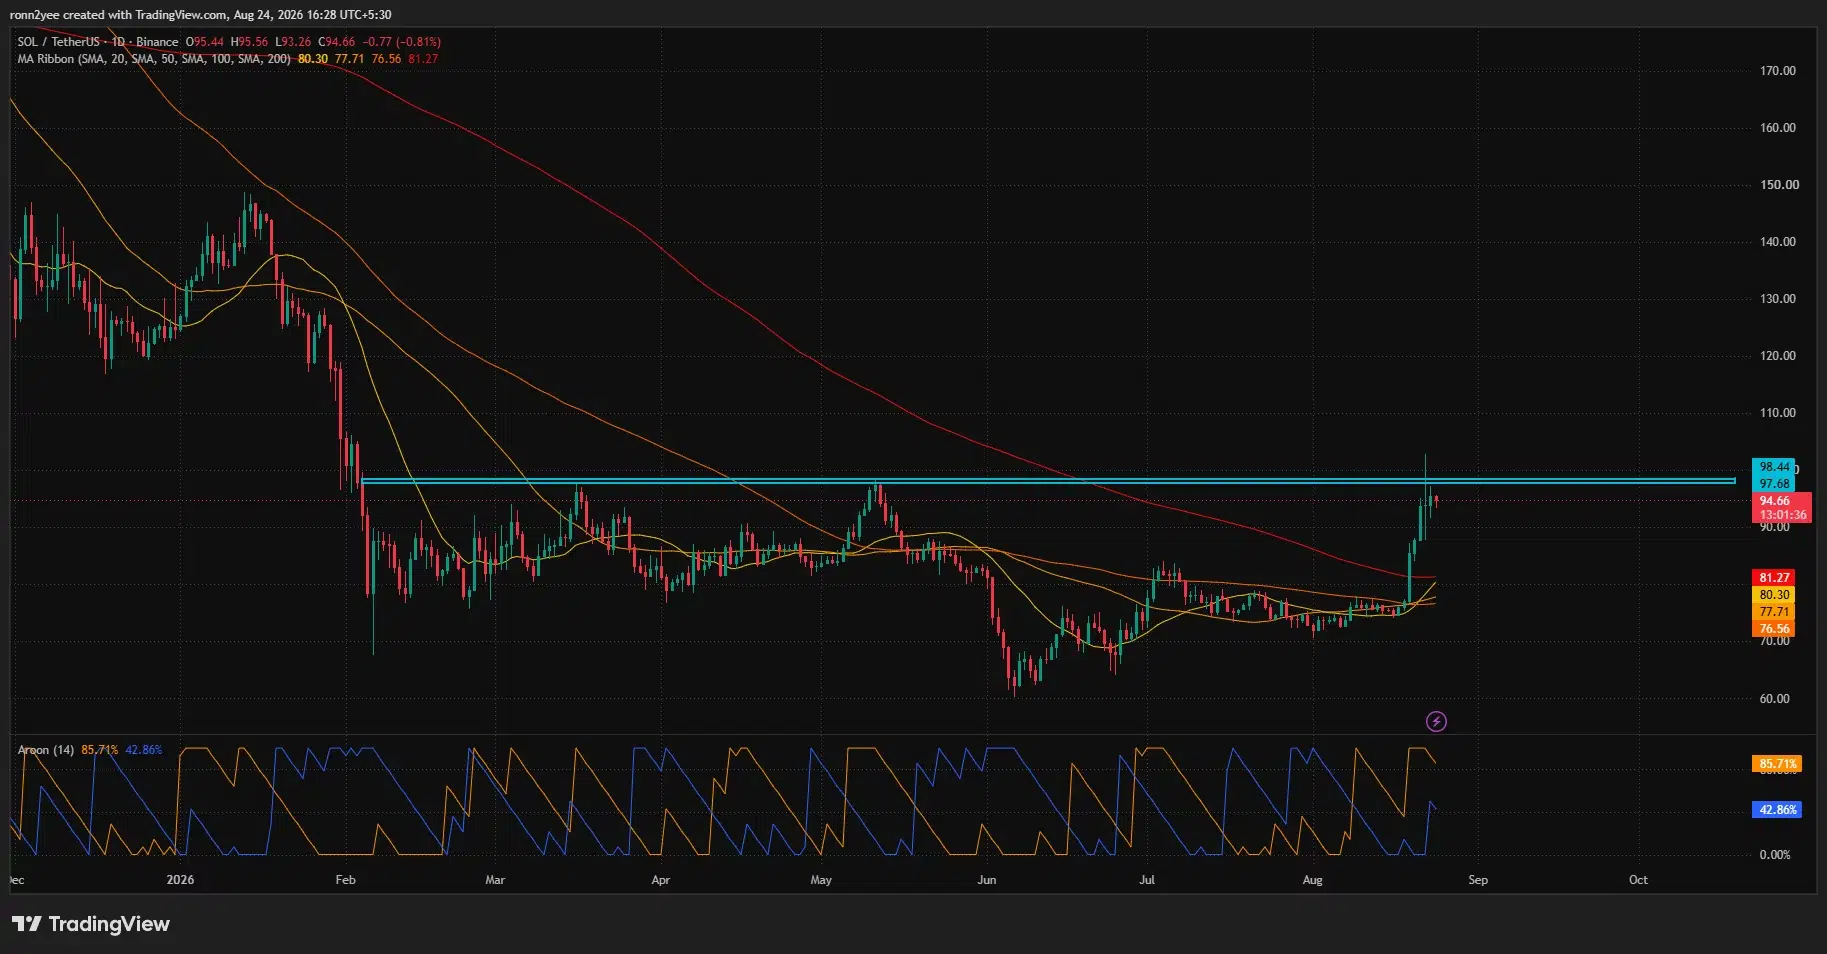
The Aroon indicator supports the broader bullish setup. Aroon Up stood at 85.71%, compared with Aroon Down at 42.86%, showing that a recent high carried more weight than the latest low.
Trend strength also remained elevated on the 4-hour chart, where the Average Directional Index registered 71.50. An ADX reading above 25 generally signals a strong trend, although the indicator measures strength rather than direction.
Short-term momentum has started to weaken. The 4-hour MACD line fell to 2.59, below its signal line at 3.09, while the histogram declined to minus 0.50. The bearish crossover suggests SOL may consolidate or retest support before attempting another breakout.
The first support sits near $94.58. A close below that level would expose the $92.50–$93.25 area, followed by $88.06. The deeper $83.49 level would become important if sellers reverse the breakout, while a move below $78.91 would materially weaken the current structure.
Liquidation map points to a battle near $96
CoinGlass’ 24-hour liquidation heatmap shows the largest nearby concentration of leveraged positions around $96.20–$96.40. Price often moves toward areas containing dense liquidation orders, but the map does not guarantee that SOL will reach or break the cluster.
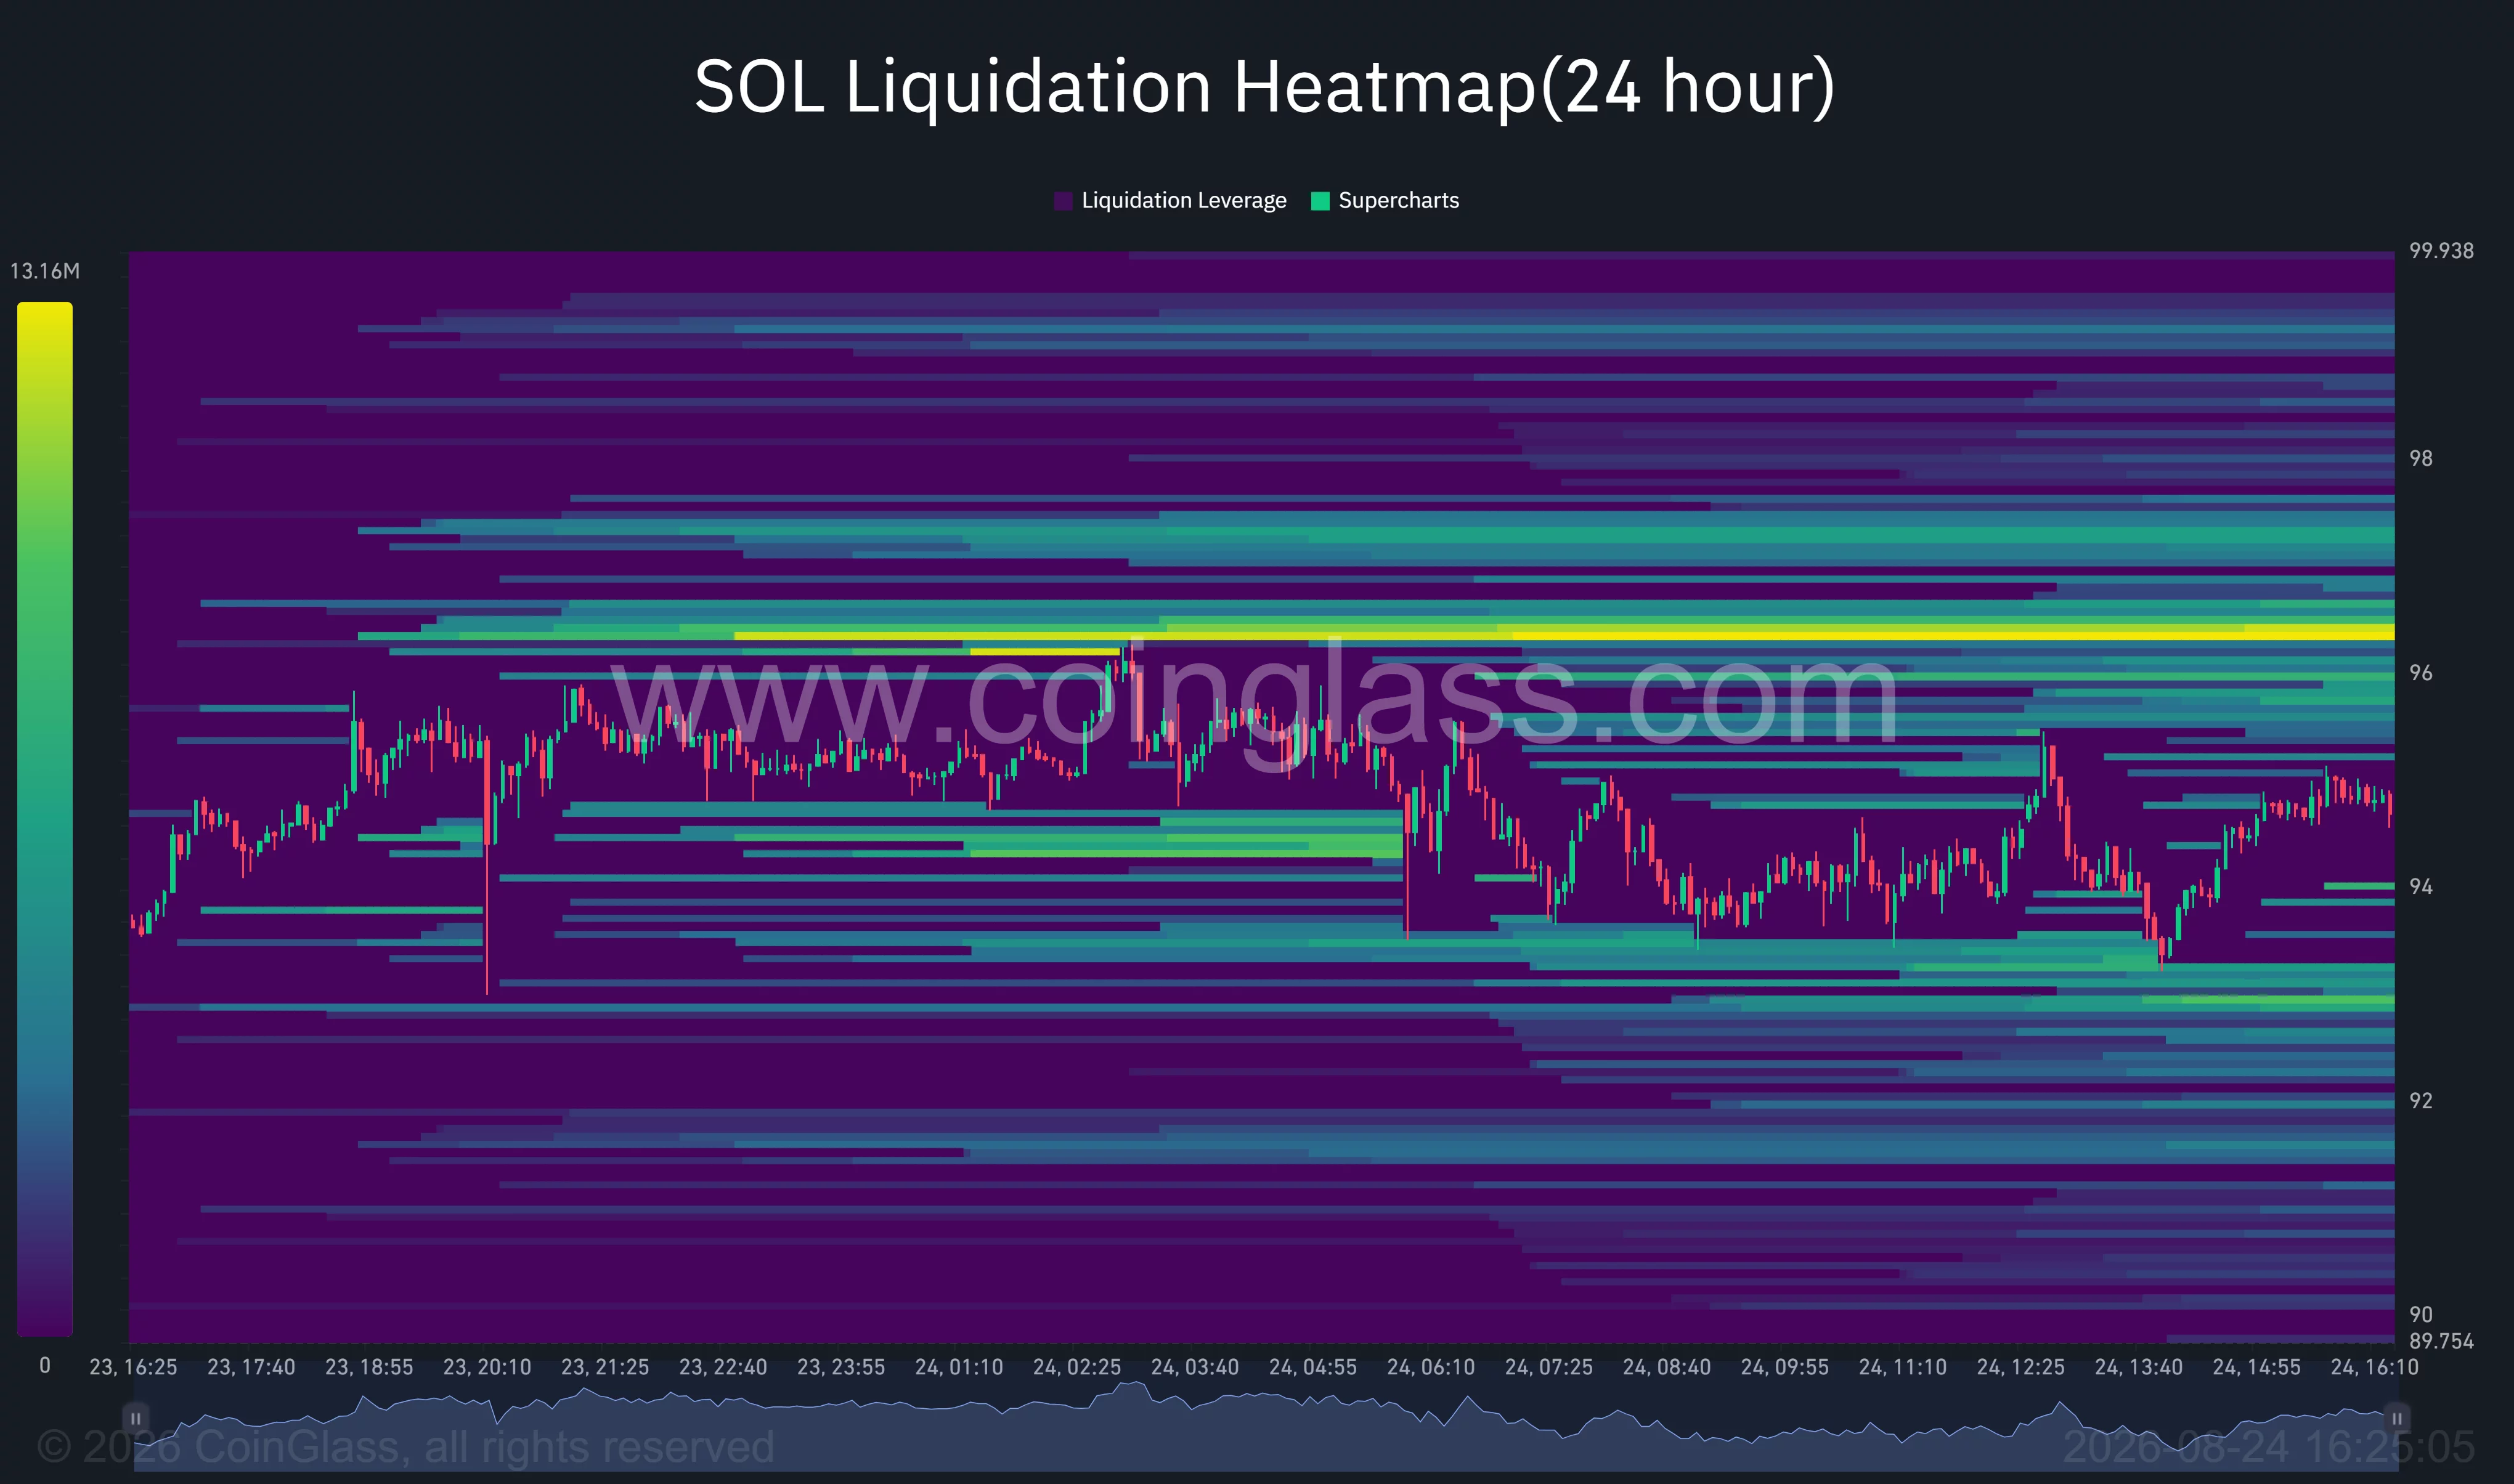
A move above $96 could force some short positions to close, potentially helping SOL retest the $97.68–$98.44 resistance zone. Further liquidity appears between approximately $97 and $99.50.
Below the market, liquidation concentrations are visible around $93 and from $91.50 to $92. A rejection below $94 could therefore produce a faster move toward those lower pools before spot buyers re-enter.
The chart does not support attributing the wider market’s reported multibillion-dollar liquidation total solely to SOL. Any such figure should be described as covering the broader crypto derivatives market unless CoinGlass provides an asset-specific total.
What analysts are watching next
Crypto analyst Haris identified the $98–$102 area as the main resistance zone after SOL’s latest rejection. The analyst said a break below $85 would weaken the setup, while the supplied daily chart places more immediate support at $88.06 and $83.49.
The governance vote may provide the next Solana-specific catalyst. Approval of SGP-0002 would reduce future token issuance faster, while SGP-0003 could increase the amount of SOL burned through network fees. Rejection would preserve the existing emission or fee structure.
For U.S. investors, the SEC proposal remains the larger policy event. The rules are still at the proposal stage and may change following public comments, meaning the recent rally reflects expectations rather than a completed regulatory change.
SOL’s ability to hold $94.58 while momentum resets will determine whether the move becomes a sustained breakout. A daily close above $98.44 would strengthen the bullish case toward $102.88, while a loss of $88.06 would raise the risk that the rally is unwinding.
Disclosure: This article does not represent investment advice. The content and materials featured on this page are for educational purposes only.

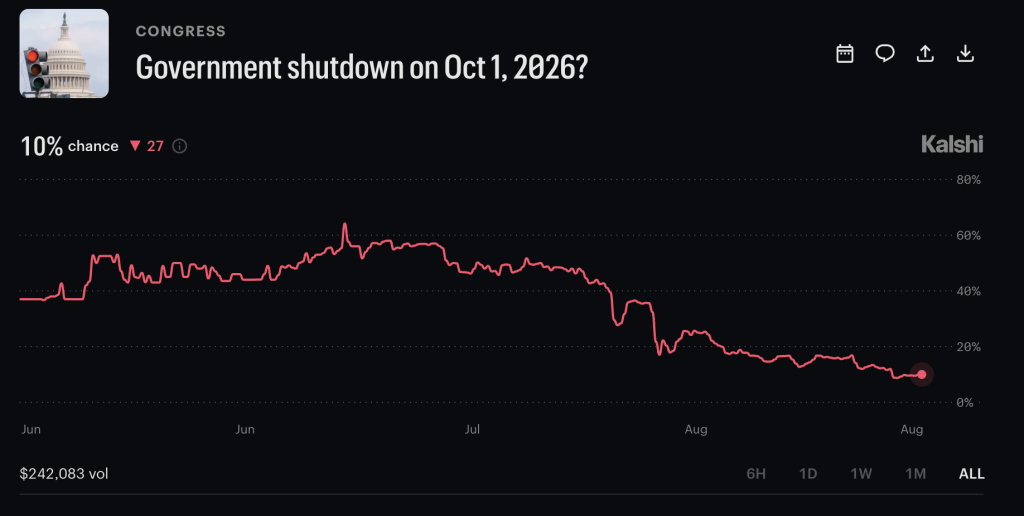
Kalshi’s contract on a federal government shutdown on October 1, 2026 priced YES at 15-16 cents, an implied odds near 10% and down sharply from 35% just three weeks earlier.
Polymarket’s parallel market, which resolves on a different trigger and a later cutoff, still showed 16.5 cents as of August 14, per Polymarket Trader’s snapshot. The gap between those two numbers says less about Washington than about how differently the two venues define a shutdown.
The Goverment Shutdown Odds In 2026 Aren’t Pricing the Same Bet
Kalshi’s contract resolves YES only if part of the government is shut down at 10:00 a.m. ET on October 1 specifically. Polymarket runs two separate contracts on the same date: one requiring an actual shutdown, agencies suspending non-excepted operations, typically with furloughs, by 11:59 p.m. ET, and a second, broader “any-duration lapse” contract that pays out even on a brief technical gap with zero operational impact.
On August 14, Polymarket priced the shutdown version at 16.5 cents and the lapse version at 13.5 cents.

A third Polymarket market bundles “another shutdown by January 31, 2027” with the 2026 House winner. Its no-shutdown legs had already settled at zero cents by the August 14 check, while the shutdown-plus-Democratic-House leg traded at 87.3 cents.
That is the market telling traders something specific: a lapse somewhere in the current funding cycle is priced as close to certain, even while an October 1 lapse specifically sits in the mid-teens.
A Five-Week Repricing, Told Through Three Snapshots
Kalshi’s own market commentary put the shutdown contract at 35% on July 31, with Senate negotiators reportedly nearing a stopgap that would fund the government to December 4 while capping a disputed OMB rule on appropriated spending.
By August 3, the cross-venue average had fallen to 28%, with Kalshi at 25% and PredictIt at 31%. Two weeks later, Kalshi had drifted down again to the 12-13% range on roughly $193,000 in contract volume.
That trajectory, 35%, then 28%, then roughly 12-13%, is a repricing toward “Congress avoids the specific date,” not toward “shutdown risk is gone.”
The combined Polymarket market’s zeroed-out no-shutdown legs for January 31 make that distinction explicit: traders are separating the October 1 deadline from the broader fiscal-year window, and pricing them very differently.
Both books remain thin relative to 2025, when related shutdown contracts on Polymarket cleared roughly $157 million in cumulative volume on the start-date market alone – a reminder that current liquidity of a few thousand to a few hundred thousand dollars leaves these prices more exposed to spread and single-trade repricing than last year’s deeper markets.
The Percentage Is Only Half the Trade. Kalshi Lets You Trade the Exact Question.
The shutdown market shows why prediction trading is more than glancing at a headline probability. A 15% contract can mean something very different from another market showing 16% if the resolution rules, timing, and trigger are not identical.
That precision is part of Kalshi’s appeal.

Users can trade directly on defined real-world outcomes across politics, economic data, Fed decisions, crypto, and other major events, with every contract spelling out exactly what must happen for YES or NO to settle.
For traders following Washington into October, that creates a cleaner way to express a view than trying to guess how stocks, bonds, Bitcoin, or the dollar might react to the same event.
The government may avoid a shutdown at 10:00 a.m. on October 1 and still face another funding crisis weeks later. Kalshi lets traders separate those questions rather than treat them as a single macro bet.
Eligible new users who join through CryptoNews can also receive $25 through our referral link.
Make Your Prediction Count With $25 For Free on Kalshi
The post Goverment Shutdown 2026 Odds Fall as Markets Split the October 1 Risk appeared first on Cryptonews.


The planned tie-up would make Gemini the exclusive CFTC-regulated venue for crypto event contracts offered through Apex’s futures commission merchant.
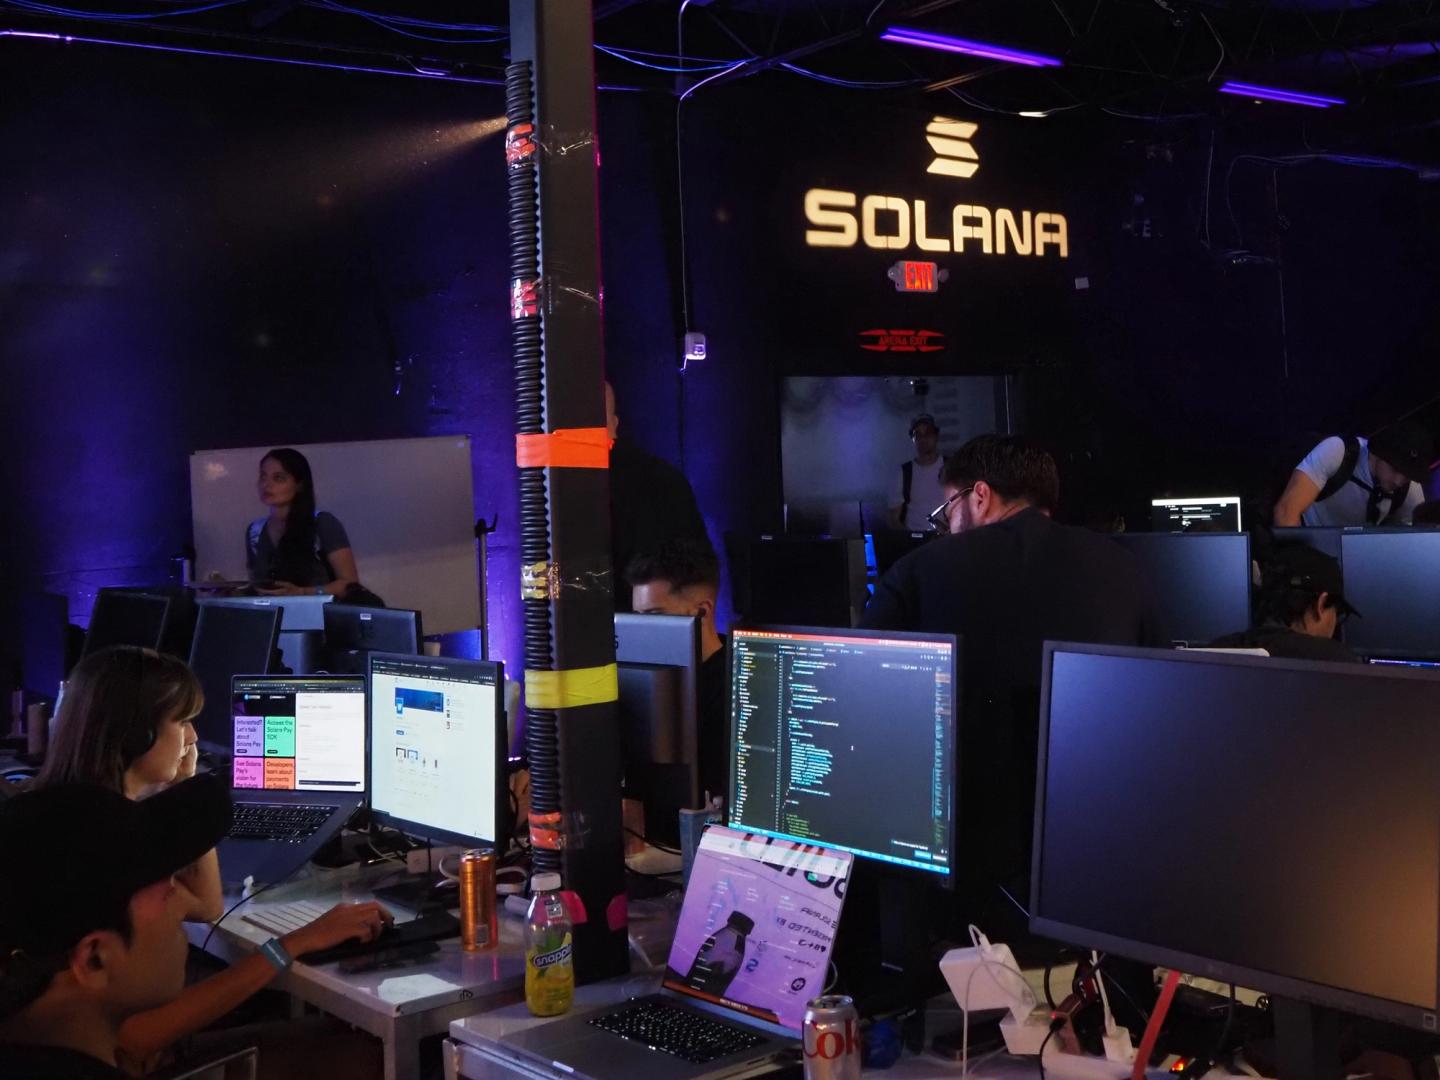
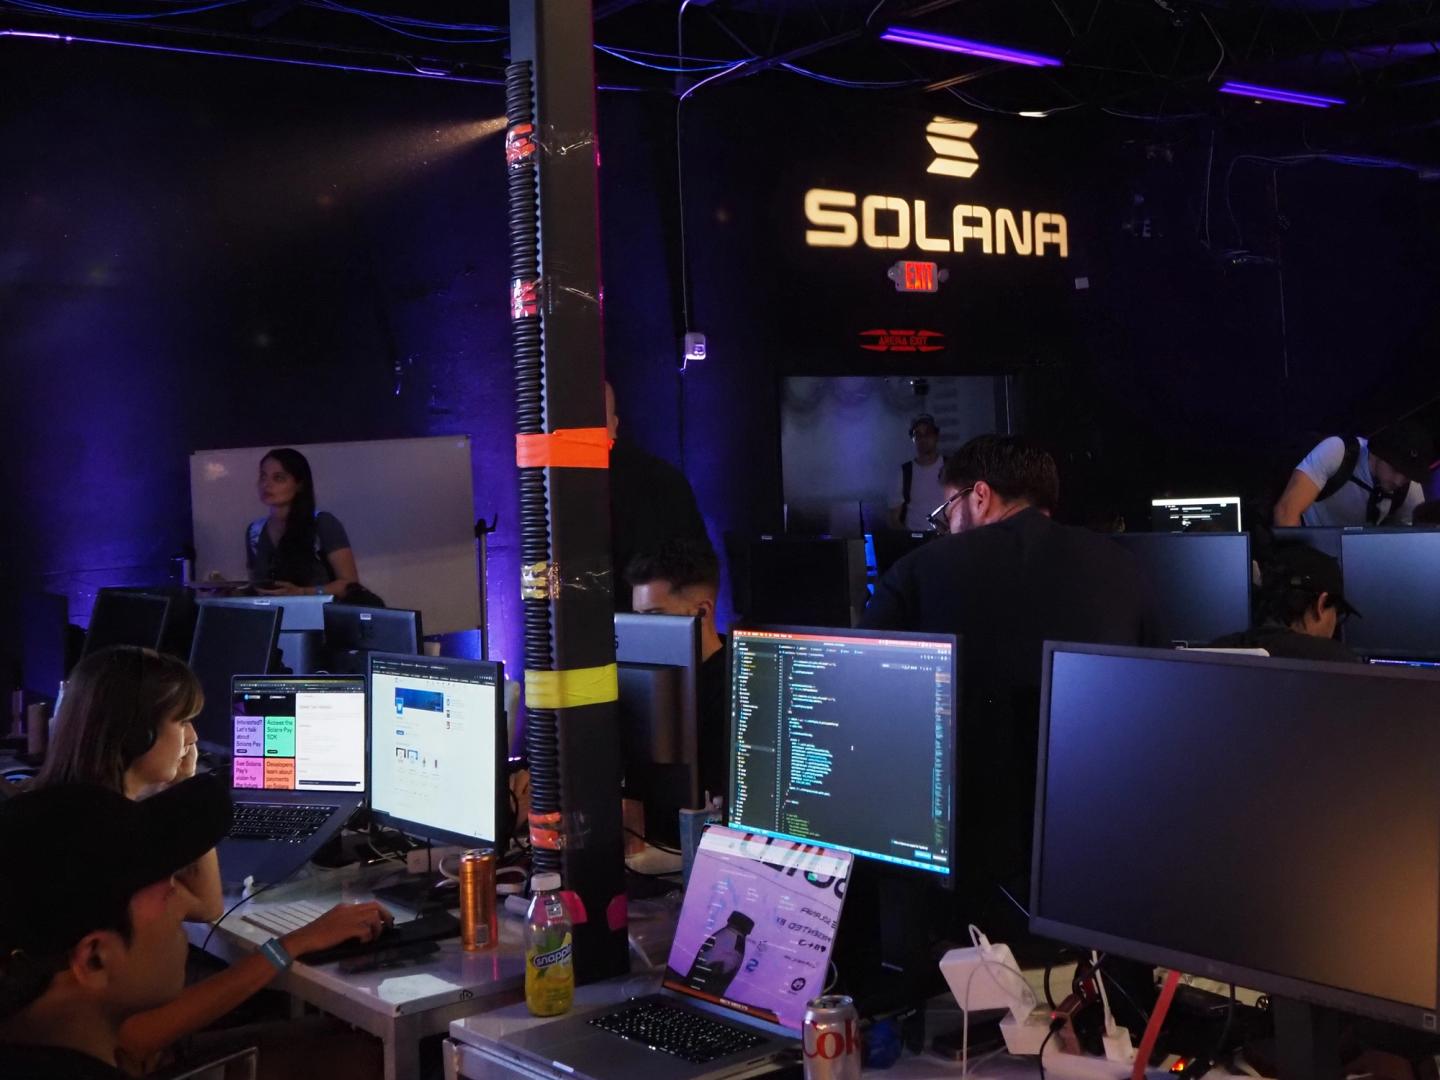
Two of the three proposals would reduce SOL supply growth by speeding up Solana’s inflation decline and raising daily fee burns from about 650 SOL to as much as 9,000 SOL.
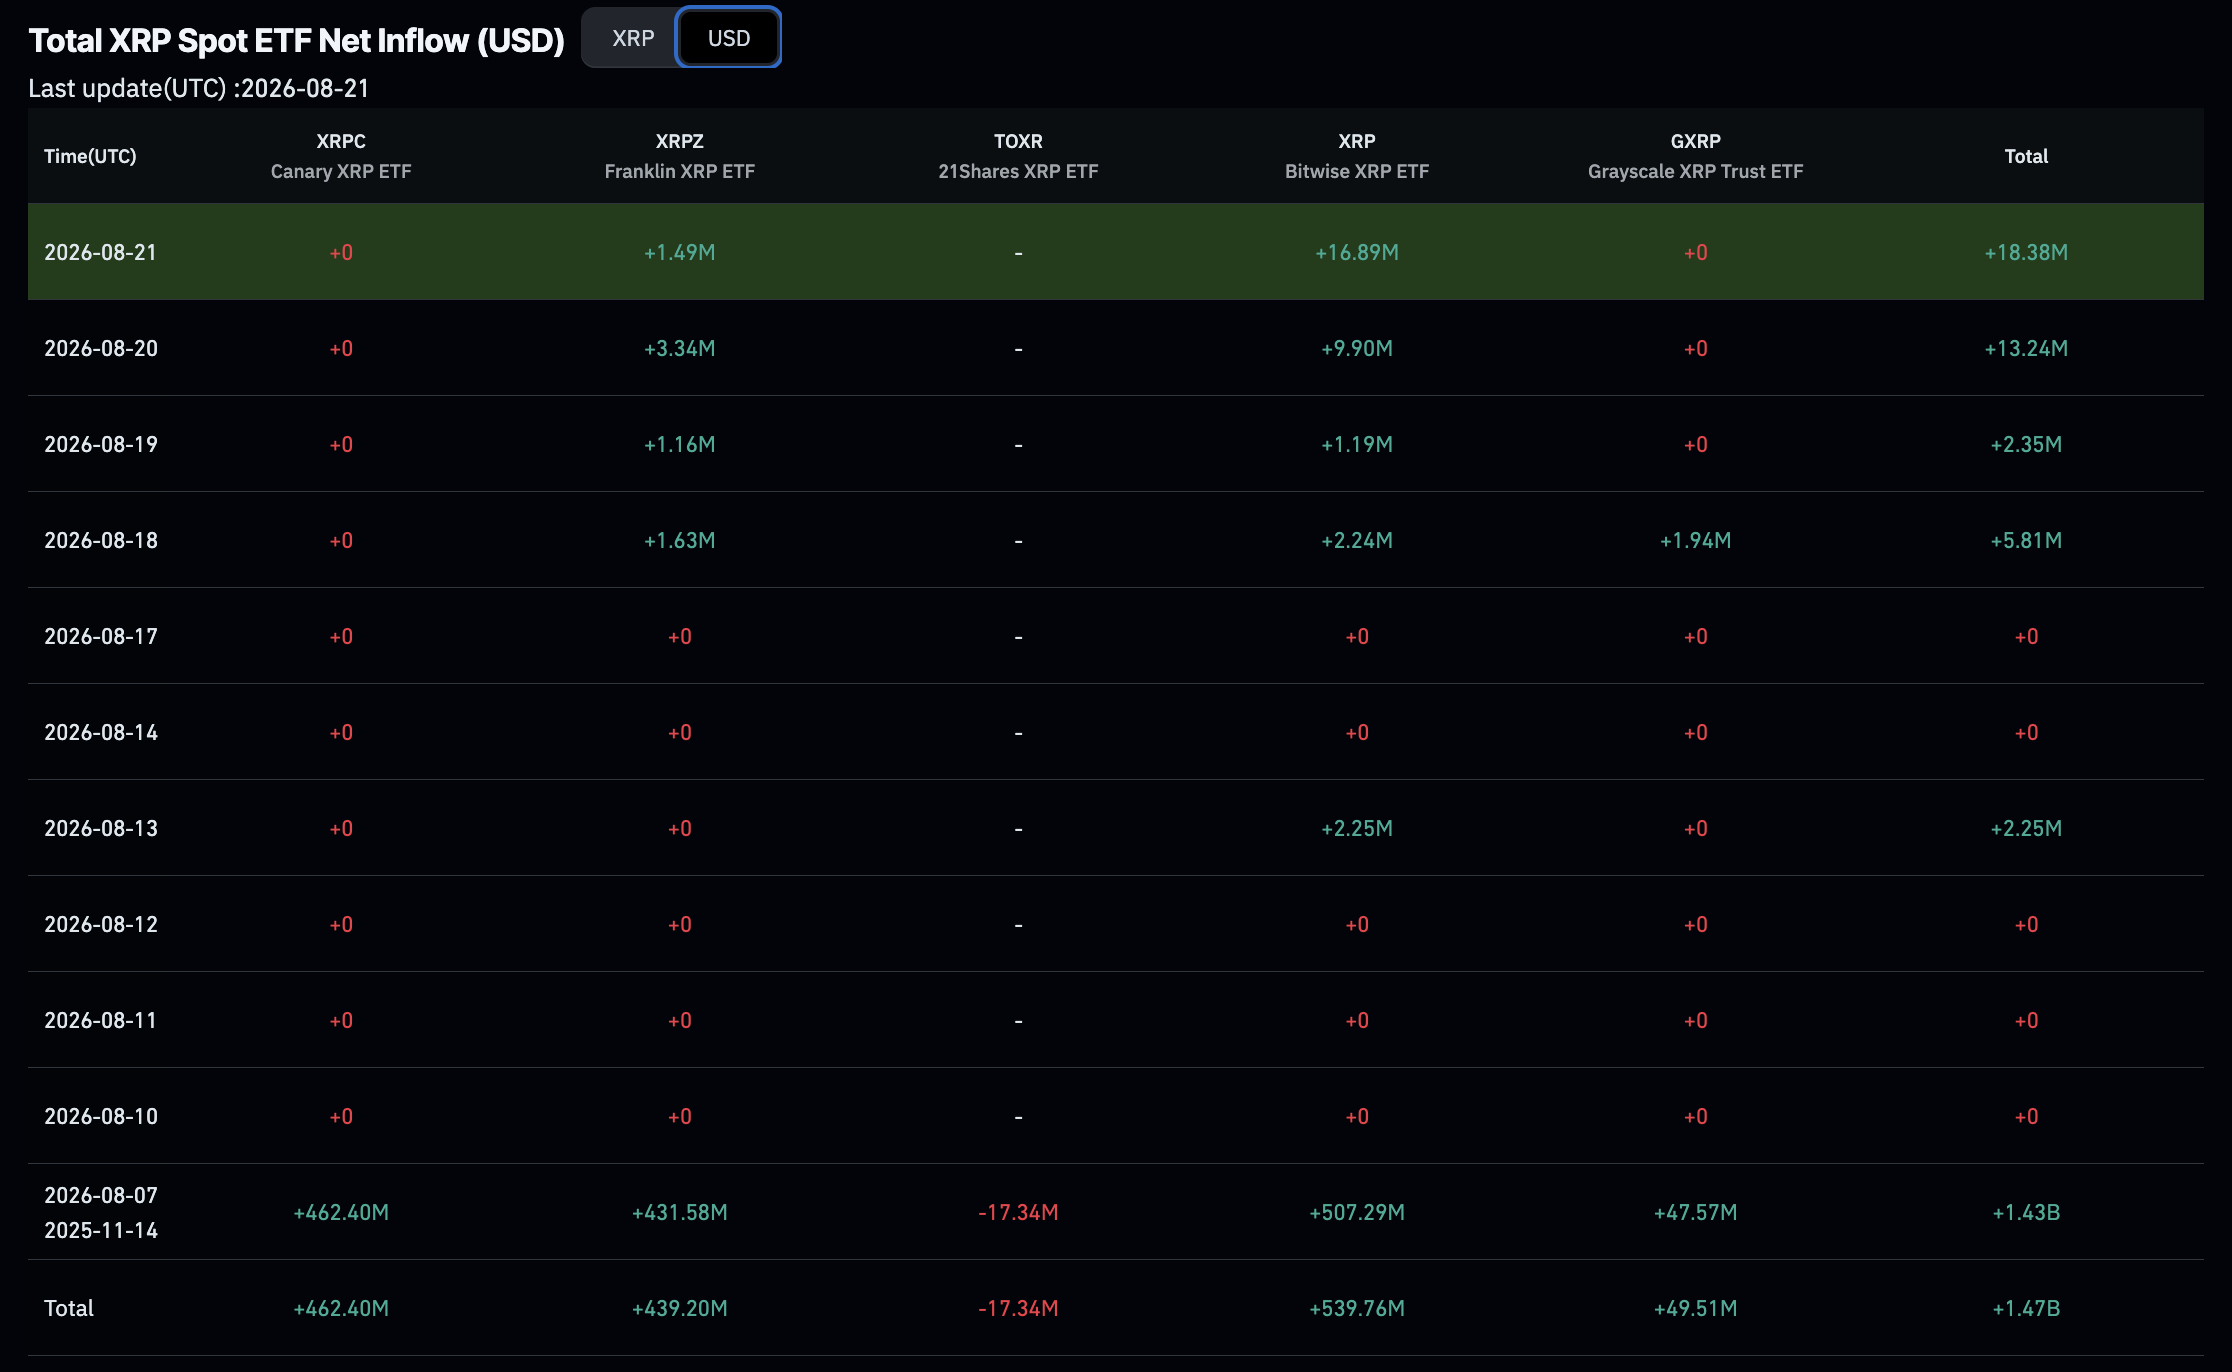
XRP is changing hands at $1.47, down 1.25% over the last 24 hours, a pullback that looks minor against the backdrop of what’s happening in the ETF complex. Cumulative net inflows into U.S. spot XRP ETFs hit roughly $1.51 billion, with total net assets sitting between $940 million.
The Friday’s flow data shows inflows of about $18 million, led by Bitwise, Grayscale, and Franklin, a rebound from a rougher stretch where weekly inflows collapsed roughly 93% to just $1.01 million earlier in August. Markets seem to be pricing that optimism in real time.

The bigger question: does $1.5 billion in cumulative inflows represent durable institutional conviction, or is it a headline number masking week-to-week fatigue?
Discover: The Best Crypto to Diversify Your Portfolio
XRP Price Prediction: Hit $2 This Week?
At $1.47, XRP has already cleared levels that recent coverage framed as resistance. Our reports from earlier in the month had the token oscillating between $0.98 and $1.01 after briefly losing the psychological $1 handle.
XRP is at a meaningful structural shift. The $1.20 resistance zone that bulls were watching has been taken out entirely, and the token is now trading well above the consolidation range that defined most of August.

If ETF inflows continue their rebound, regulatory clarity headlines keep landing, and XRP grinds toward new multi-month highs with $1 acting as freshly minted support, XRP could catapult towards its $2 high. If price consolidates in the $1.40–$1.55 band, traders will digest the recent move and wait for the next flow update.
However, a sharp reversal of ETF sentiment or a broader risk-off macro shift, as the $40 trillion federal debt overhang isn’t going away, drags XRP back toward $1.20 support. Watching the next ETF flow print will likely settle which scenario plays out.
Trade XRP on Bybit and Get a Chance to Win Our $1,000 USDT Airdrop
LiquidChain Targets Early Mover Upside as XRP Tests Key Levels
Anyone who bought XRP price near $1 in early August is sitting on a solid move. But here’s the catch: at XRP’s current market cap, a repeat of that percentage gain requires billions more in fresh capital rotation.
Institutional flows help, but they move slowly. Traders chasing the next multiple often look further down the risk curve, toward assets still in price discovery.
LiquidChain is making “which chain?
” a thing of the past.
⟁https://t.co/vqvBcdSQYC pic.twitter.com/ip83gw1P0u
— LiquidChain (@getliquidchain) August 23, 2026
That’s the pitch behind LiquidChain ($LIQUID), a Layer 3 infrastructure project fusing Bitcoin, Ethereum, and Solana liquidity into a single execution environment.
The presale token sits at $0.01493, with closer to $950K raised so far. The pitch centers on a deploy-once architecture, so developers build once and access liquidity across all three ecosystems, rather than fragmenting deployments chain by chain.
Verifiable settlement and single-step execution round out the technical case.
Research LiquidChain directly before committing capital.
Discover: The Best Token Presales
The post XRP Price Prediction: $1.5B ETF Inflows and Institutional Backing appeared first on Cryptonews.
Crypto World
Backlash After Hakeem Jeffries Holds Private Meeting With Jared Kushner Ahead of Midterms
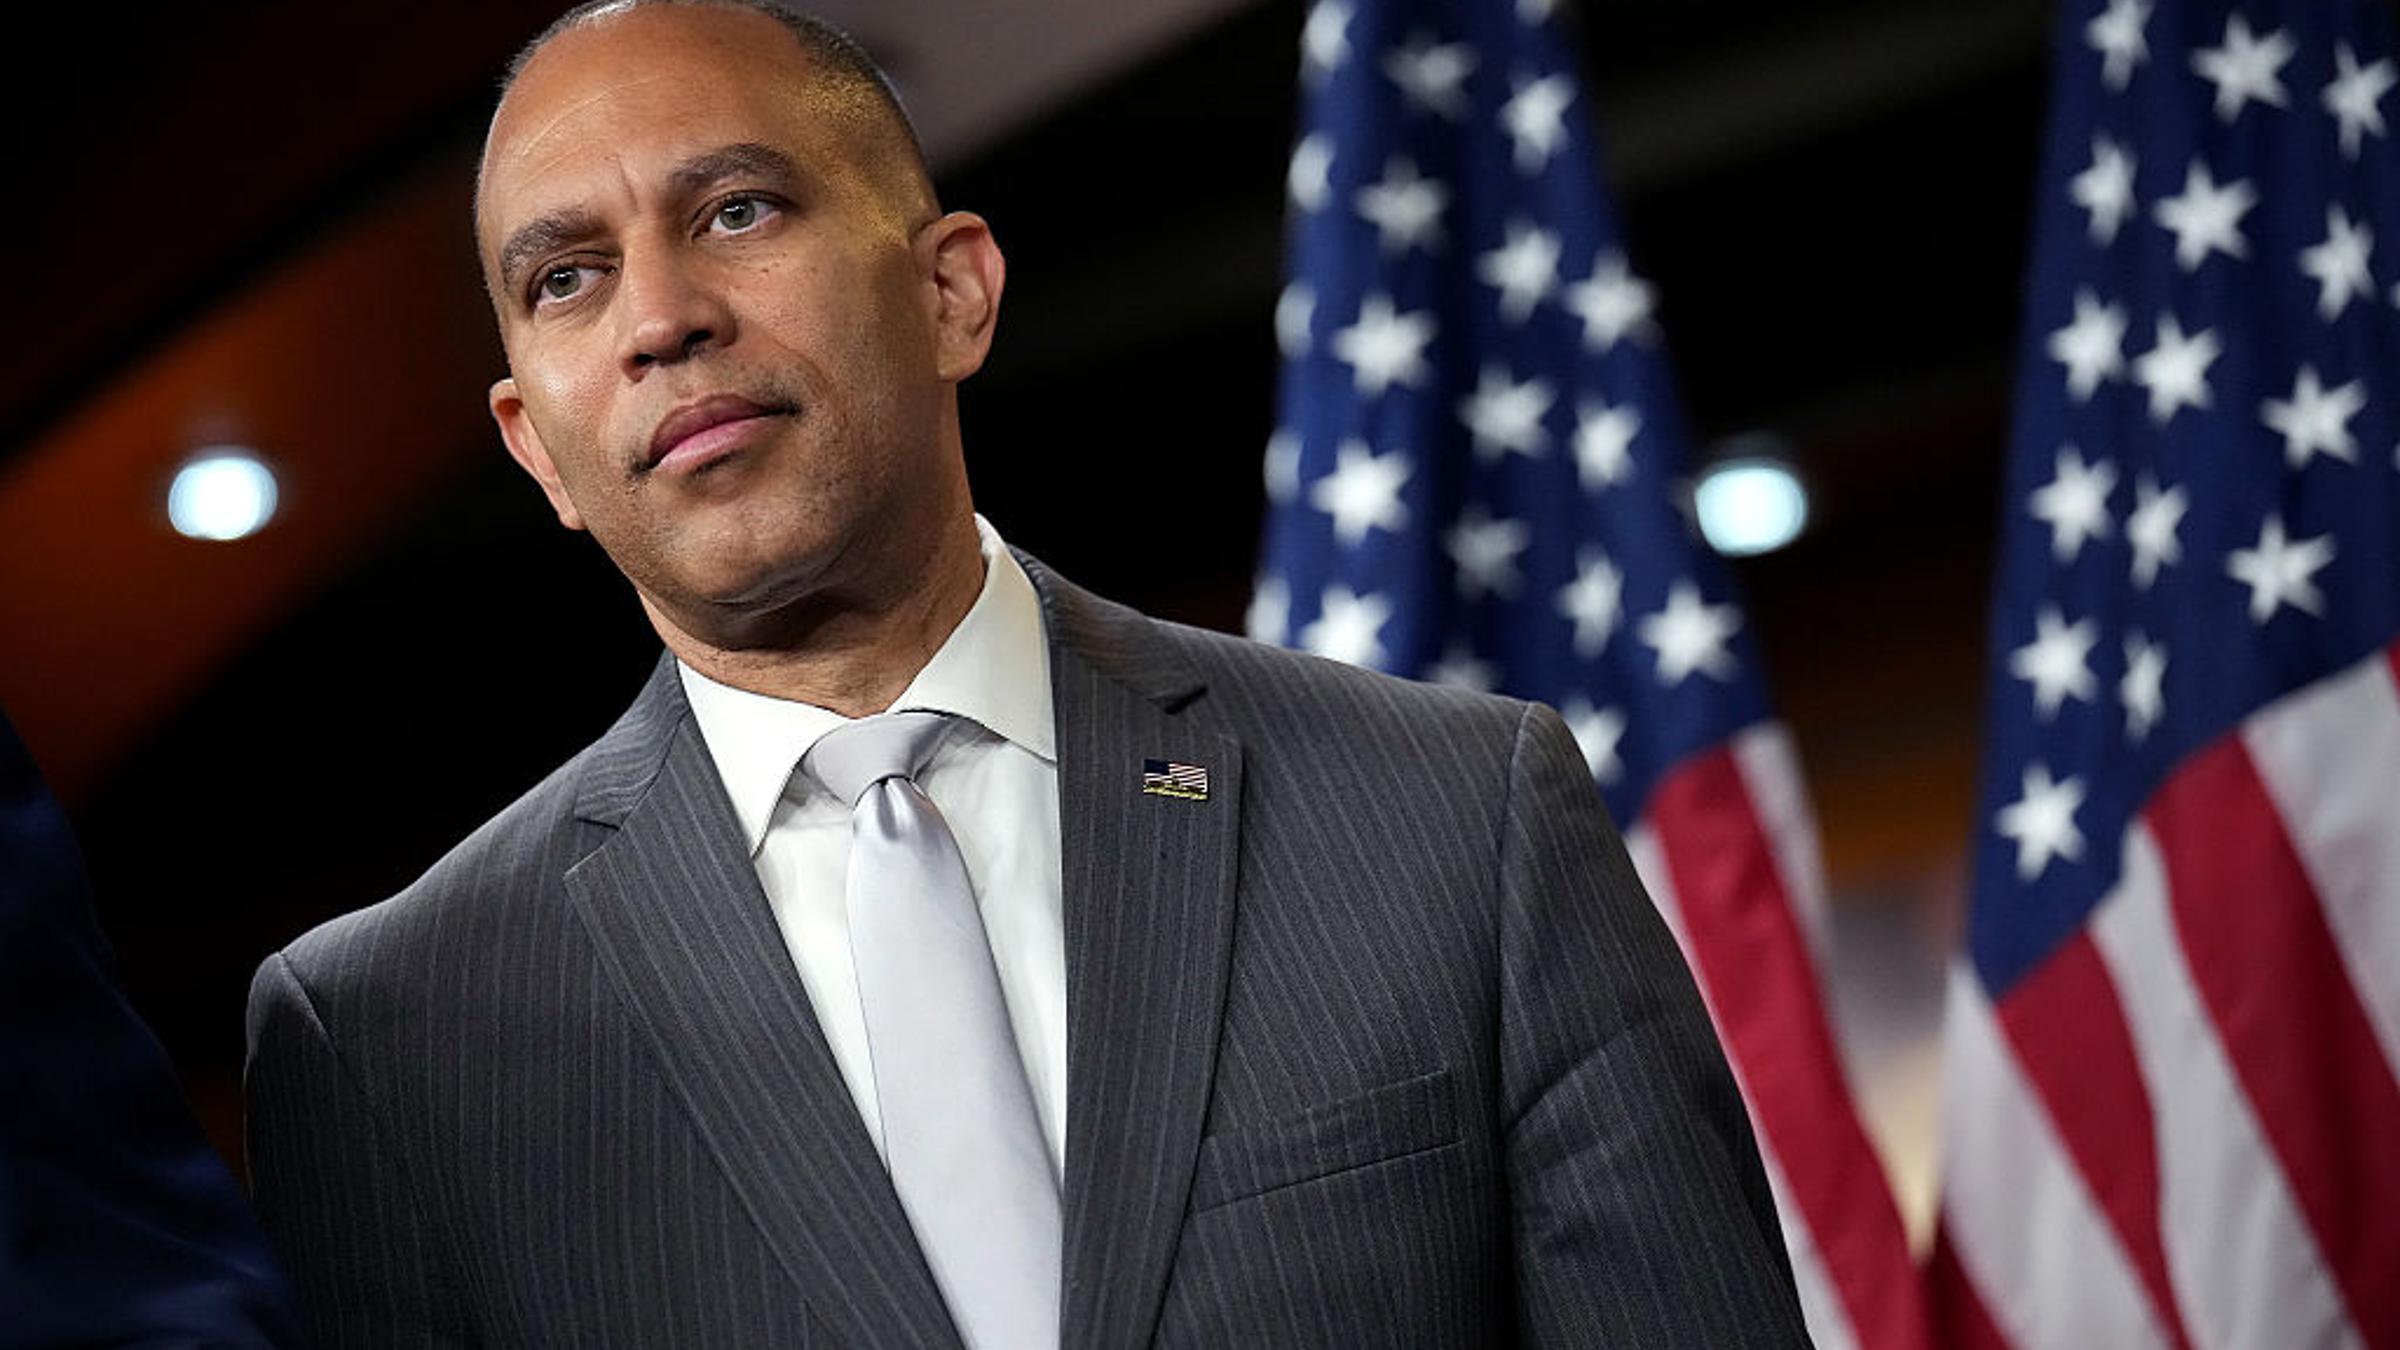
Tommy Vietor, a former aide to President Barack Obama and now a co-host of the podcast Pod Save America, was far less diplomatic.
“Jared Kushner has no actual government job, he just uses his family connections to get money from Gulf autocrats and fund corrupt deals. The only way Jeffries should work with him is with demands for documents and subpoenas,” Vietor said.
House Speaker Mike Johnson said Sunday that he first learned of the meeting that same day, when reports began circulating in the media.
“I don’t know what that’s about,” Johnson said on Fox News. “I know Jared has interests and lots of other things going on. He’s not really directly involved in the admin, at least in the day-to-day in the White House.”
Johnson, however, remained confident that Republicans could retain control of the House.
“I’m telling you what, you better not bet against the House Republicans,” he said.

Cathie Wood continued betting big on SpaceX on Friday. Her ARK Invest firm purchased over 200,000 shares of Elon Musk’s space company across multiple ETFs worth almost $27 million, according to company logs. Wood has long placed high value on Musk’s companies, pumping hundreds of millions into investments in SpaceX (SPCX) and Tesla (TSLA) over the years. ARK Invest Buys…
Copyright ©2026 Investor’s Business Daily, LLC. All rights reserved. 87990cbe856818d5eddac44c7b1cdeb8

The Tom Lee-chaired Ethereum accumulator has ramped up its ETH acquisitions amid the asset’s major price revival experienced last week.
The company has acquired 32,447 tokens over the past week, and its total has skyrocketed to 5,847,611 ETH as of August 23. With Ethereum’s price jumping to $2,440 yesterday, this put the firm’s position at $14.3 billion – or about $3 billion higher than the previous week.
97% of the Way
Taking into consideration the latest purchase announced earlier on August 24, the company’s total stash of almost 5.85 million ETH represents approximately 4.8% of Ethereum’s entire 120.7 million token supply. This means that the firm has completed 97% of its so-called “Alchemy of 5%” strategy. The ultimate goal is to control 5% of the altcoin’s supply, an ambitious move it started in late June last year.
BitMine hasn’t been deterred by the recent price moves in the crypto industry. Recall that ETH traded at around $1,900 by last Wednesday and has shot up by 30%, topping $2,500 briefly before it calmed just below that level today. This became its largest weekly surge since May 2025.
Tom Lee highlighted that the previous two comparable weekly rallies, in July 2021 and May 2025, were subsequently followed by gains of 167% and 170%, respectively. Although this sounds quite impressive, it’s worth noting (again) that historical performance provides no guarantees that the asset will repeat either move.
Bitmine’s latest purchase was also a lot higher than most of its previous ones, which dropped to around 10,000 ETH on several occasions. As reported last week, the company bought 10,270 tokens after acquiring 9,926 ETH the week before.
Keep Staking
The other major development highlighted in the most recent announcement was the continuous staking effort from the company. It has now staked over 5,067,300 tokens, worth approximately $12.4 billion at current prices. This represents 87% of Bitmine’s entire Ethereum treasury.
The current estimates show that the company could generate approximately $330 million in annualized revenue based on a seven-day annualized yield of 2.67%. If it stakes its entire portfolio through its own institutional platform called MAVAN, the projected numbers could rise to $381 million.
The post BitMine Nears Massive Ethereum Milestone as ETH Holdings Reach 5.85 Million appeared first on CryptoPotato.


Fasset raised $68 million in a Series C led by SBI Group as the companies plan a digital bank in Malaysia and to expand stablecoin payments.
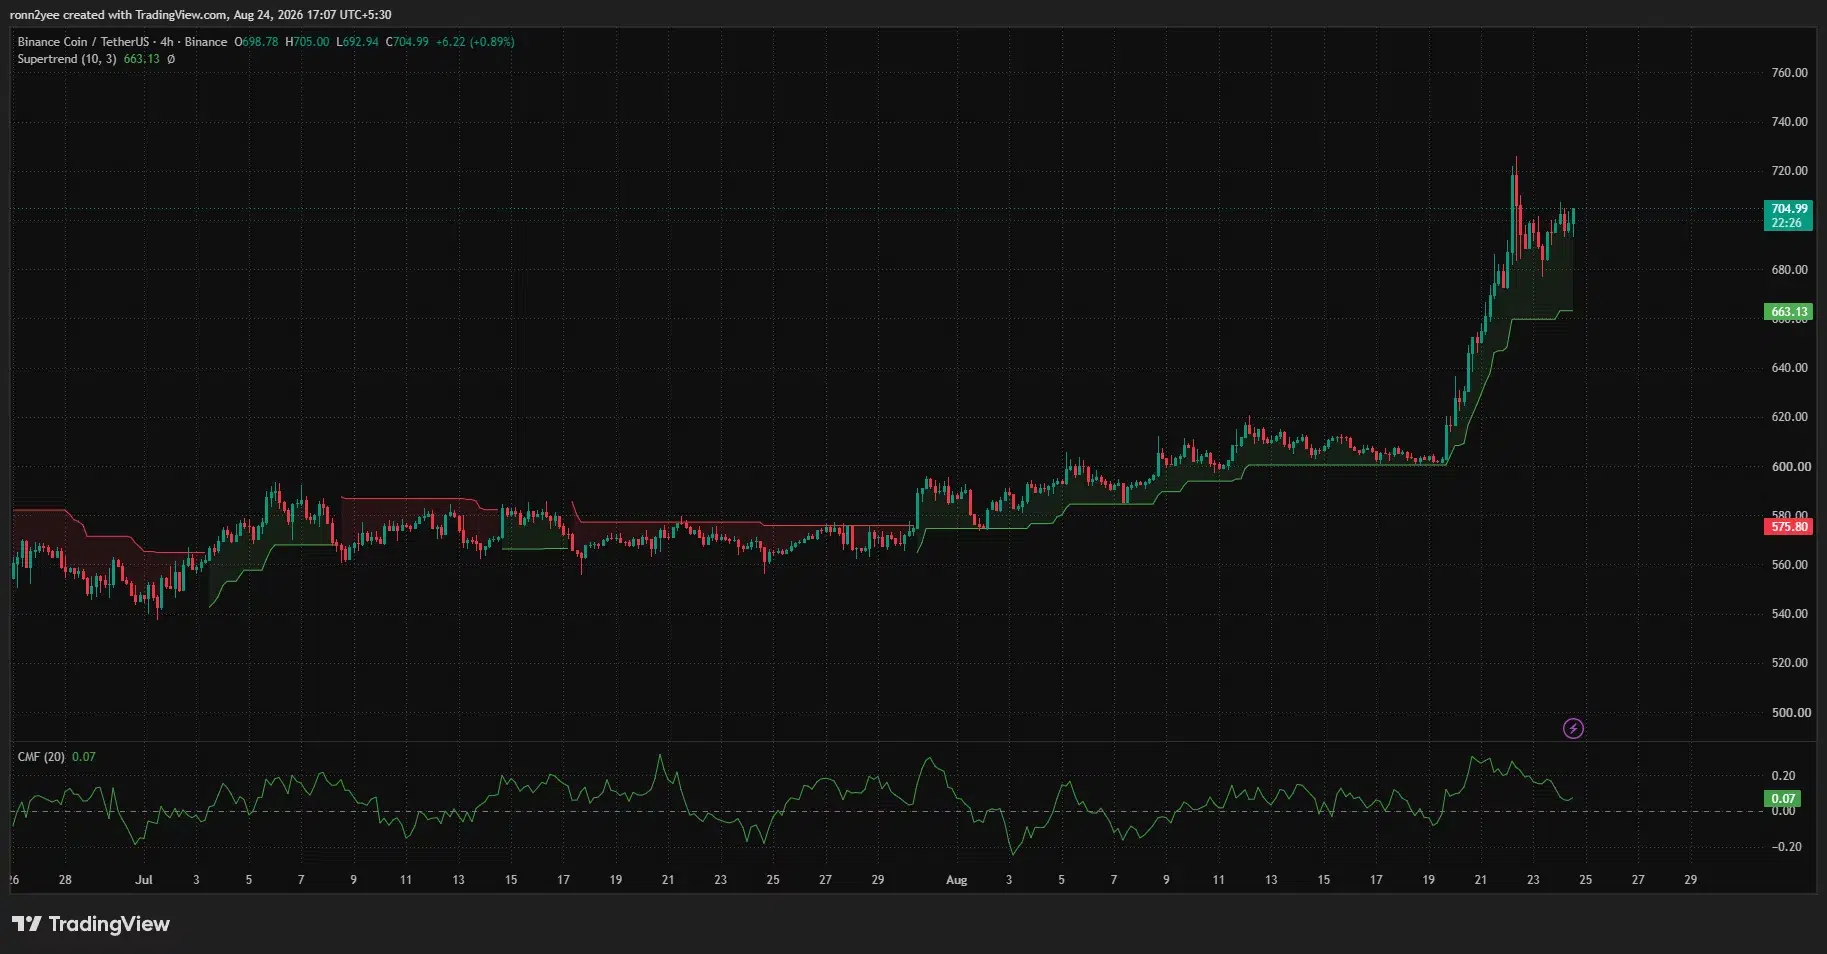
BNB price traded near $704 on Aug. 24 after gaining almost 16% in seven days, as momentum from the broader crypto rally and the upcoming Pasteur hard fork kept buyers in control.
Summary
- BNB price rose about 16% over seven days and reached a weekly high near $725.
- The daily RSI reached 85.25, placing the token deep in overbought territory.
- A 4-hour Supertrend signal remained bullish, with dynamic support at $663.
- Liquidation clusters at $710 and $719 could attract price if BNB continues higher.
BNB price action today
According to data from crypto.news, BNB (BNB) price was trading near $704 at the time of writing, up about 1% over the previous 24 hours. The token had gained almost 16% over seven days, lifting its market capitalization to approximately $93 billion.
The rally accelerated after BNB broke out of the $600–$620 range that had restricted price action during the first half of August. Buyers pushed the token through $650 on Aug. 20 before it briefly climbed above $720 over the weekend.
BNB reached a weekly high near $725 before profit-taking pulled the price back below $690. Buyers absorbed the decline, however, and the token returned above the psychological $700 mark on Aug. 24.
The 4-hour chart showed BNB forming higher lows following the pullback. Its latest candle traded between $692.94 and $705, indicating that buyers were defending dips below $700.
Chaikin Money Flow stood at 0.07 on the 4-hour chart. A positive reading means more capital is entering the asset than leaving it, although the indicator has eased from the elevated levels recorded during the initial breakout.
Pasteur hard fork supports BNB Chain activity
BNB’s advance comes one day before the Pasteur hard fork is scheduled to activate on BNB Smart Chain.
According to BNB Chain’s upgrade schedule reported by crypto.news, Pasteur will go live at 2:30 a.m. UTC on Aug. 25. Node operators must install client version v1.7.7 before the activation.
The upgrade combines three proposals intended to improve cross-chain transfer security, restrict permissions linked to replaced validator keys, and increase block capacity. Internal testing raised transaction throughput from 1,237 to 2,324 transactions per second.
Pasteur does not directly change BNB’s supply, making it difficult to separate the upgrade’s effect from the broader market rally. Still, the approaching activation has given traders a network-specific event to watch while demand for major crypto assets remains strong.
BNB Chain has also recorded a sharp expansion in tokenized real-world assets. RWA.xyz data showed more than 1.15 million RWA holders on the network, up nearly 580% over 30 days at the latest reading.
The network held about $5.8 billion in distributed asset value, while 30-day RWA transfer volume reached $28.17 billion. Those figures measure activity involving tokenized assets and do not represent capital flowing directly into BNB.
US policy shift strengthens the broader market backdrop
BNB’s rally followed a market-wide rise that lifted Bitcoin above $77,000 and pushed several large-cap altcoins through long-standing resistance levels.
Improving US regulatory expectations formed part of that move. On Aug. 18, the Securities and Exchange Commission proposed Regulation Crypto Assets, a tailored securities offering framework for certain investment contracts involving crypto assets.
The proposal does not classify BNB or grant the token regulatory approval. However, it signals that the SEC is considering defined fundraising and disclosure pathways instead of applying the existing securities registration system without crypto-specific exemptions.
US macro conditions also supported risk assets after the Treasury Department doubled the planned size of long-term bond buybacks from a maximum of $2 billion to at least $4 billion per operation.
The program is intended to improve liquidity in older long-dated Treasury securities rather than inject funds directly into cryptocurrencies. Falling yields and a weaker dollar initially accompanied the announcement, creating a more favorable backdrop for Bitcoin and other risk-sensitive assets.
BNB faces resistance at $719 and $734
BNB’s daily chart shows that the rally has moved into an extended technical zone.
The token crossed the Murray Math resistance level at $687.50 and was trading above the $703.13 overshoot level. The next targets shown on the chart are $718.75 and $734.38.
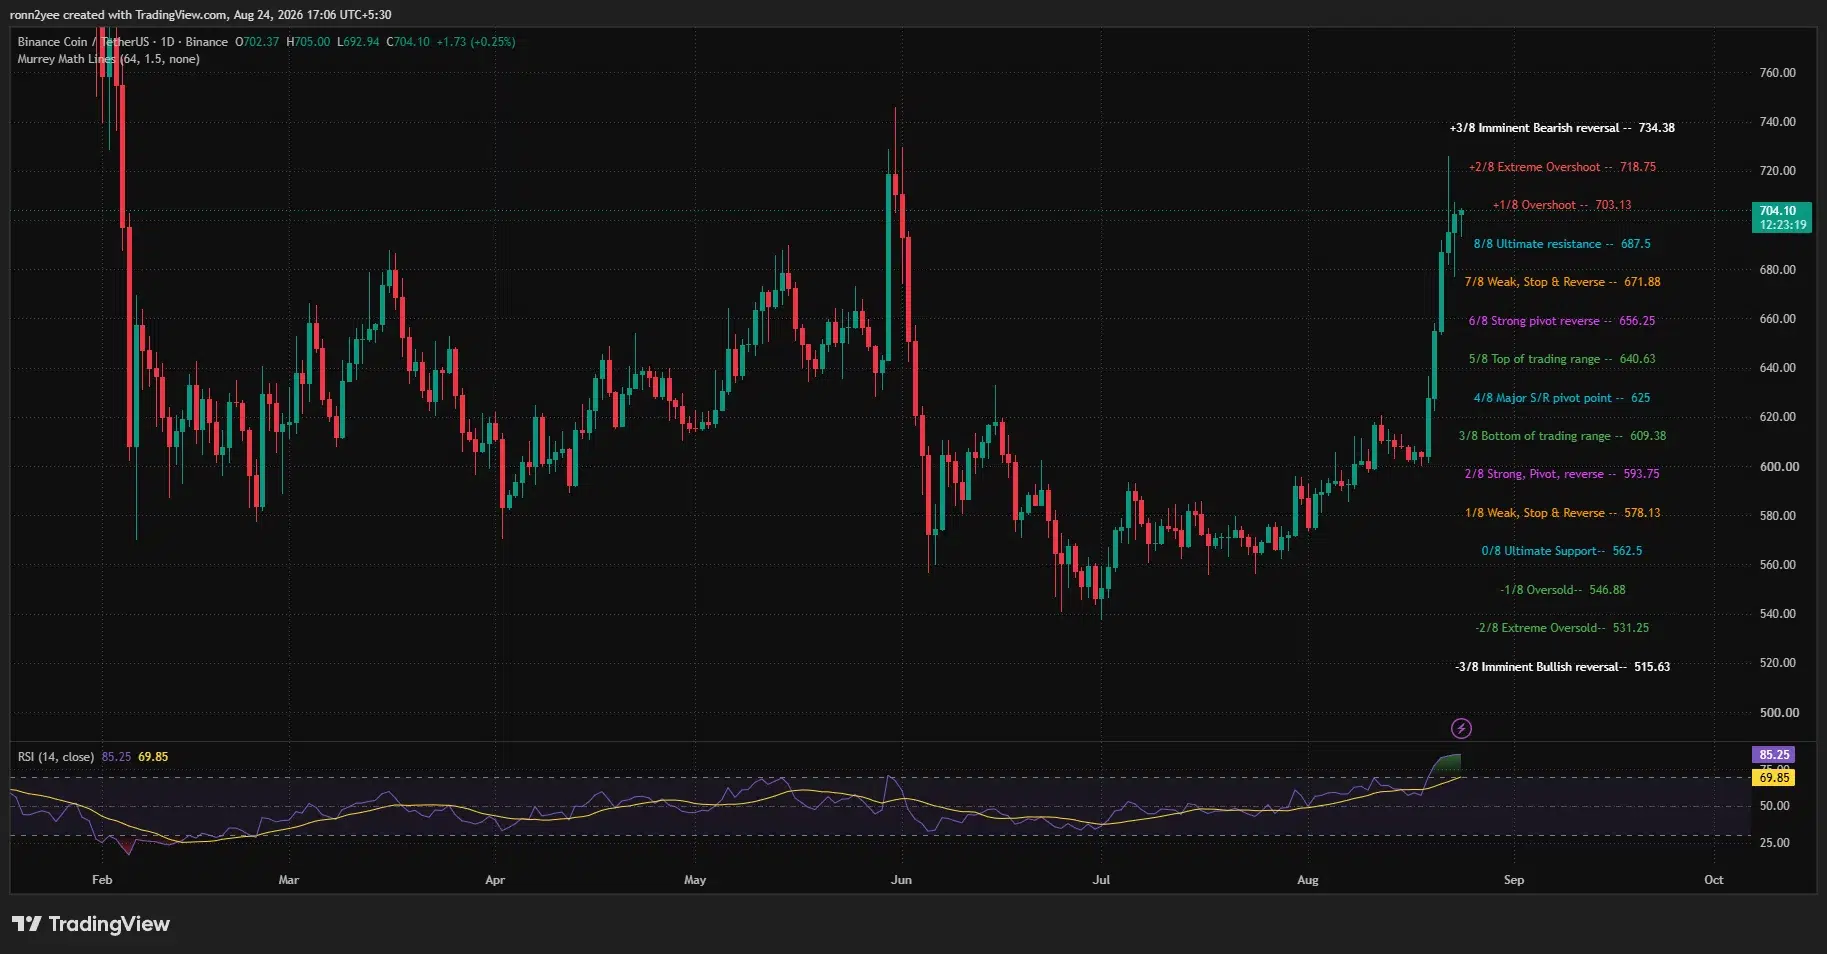
The $719 area is the first major test because it sits near the recent local high and an elevated band of short-liquidation exposure. A daily close above that level could open a retest of $725, followed by the $734–$745 region.
However, the daily Relative Strength Index stood at 85.25, well above the conventional overbought threshold of 70. Its moving average was lower at 69.85, showing how quickly momentum increased during the breakout.
An overbought RSI does not guarantee a reversal, but it raises the risk of consolidation or a sharper pullback if buying slows. The first support sits at $703, followed by the former resistance level at $687.50.
Below that, the 4-hour Supertrend remained bullish at $663.13. A close beneath the indicator would weaken the short-term trend and place the $656–$640 region back in focus.
Liquidation heatmap points to $710 as the next magnet
The 24-hour CoinGlass liquidation heatmap showed the closest large concentration of leveraged positions around $709–$711. BNB was approaching that zone from below at the end of the chart.
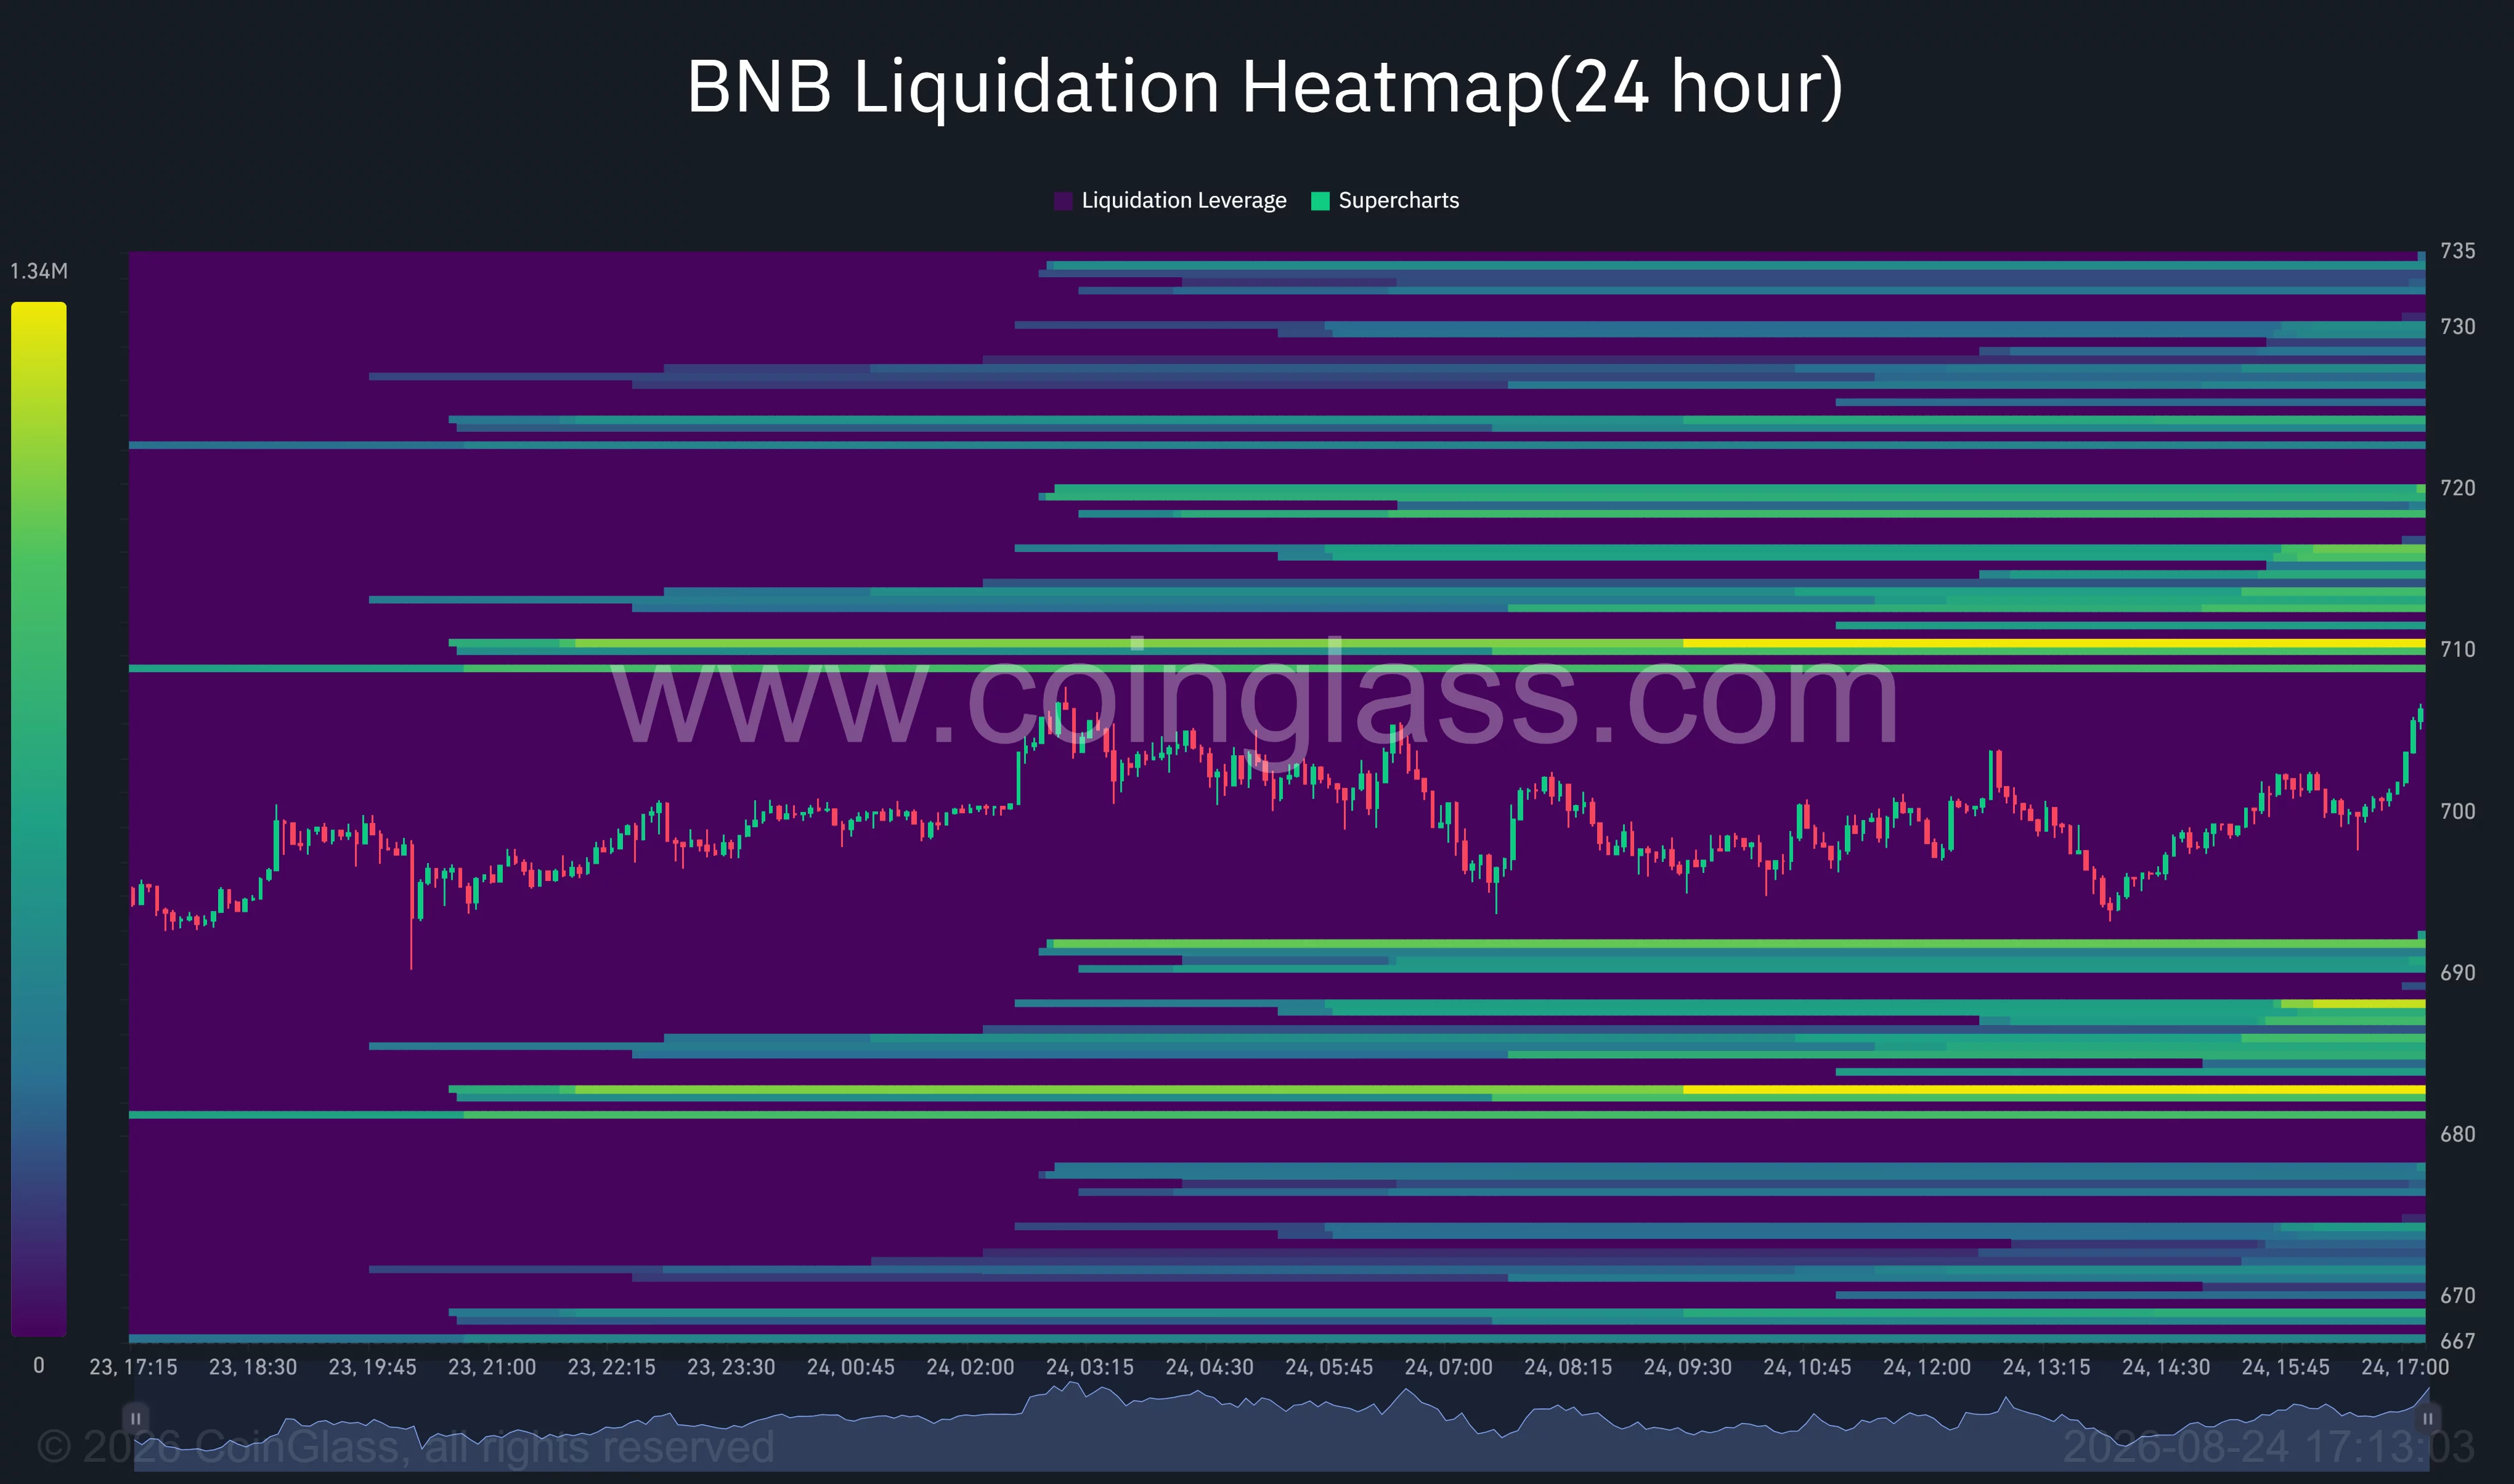
Further liquidation bands appeared between $714 and $720, suggesting that a break above $710 could trigger additional buying as short positions are forced to close. Higher clusters were visible near $724, $730, and $734.
On the downside, notable liquidity rested around $691, $687, and $682. A rejection from $710 could therefore pull the price toward those lower clusters, particularly if highly leveraged traders begin closing long positions.
Crypto analyst EinsteinBTC1 identified $745 as the larger breakout level on BNB’s weekly chart. The analyst said a weekly close above that resistance would confirm a move toward $960, with the former all-time-high region near $1,376 presented as a longer-term target.
$BNB IS APPROACHING A MAJOR BREAKOUT ZONE#BNB has broken its descending trendline and is now pressing against the critical $745 resistance.
THE BULLISH ROADMAP: THE… pic.twitter.com/HT1mLQjKzA — Einstein 👑 (@EinsteinBTC1) August 23, 2026
→ Weekly close above $745 = breakout confirmation
→ $960 = first major target
→ $1,376 = ATH retest zone
The forecast remains conditional. BNB must first overcome the $719–$734 resistance band while managing an overbought daily RSI. Holding above $687.50 would preserve the immediate bullish setup, whereas a loss of $663 would indicate that the current rally is losing strength.
Disclosure: This article does not represent investment advice. The content and materials featured on this page are for educational purposes only.


Strategy held off on new Bitcoin buying, maintaining holdings at 840,447 BTC as it launched a $1.59 billion cash pool after raising $2 billion from MSTR stock sales.

Goverment Shutdown 2026 Odds Fall as Markets Split the October 1 Risk

The House | The world wants our rail expertise

Norris wins Dutch Grand Prix after daring pass on Antonelli





-

 Fashion3 days ago
Weekend Open Thread: Madewell – Corporette.com
-

 Business6 days ago
SMA Solar Technology AG (SMTGY) Q2 2026 Earnings Call Transcript
-

 Crypto World2 days ago
anatomy of crypto’s biggest liquidation event since 2021
-

 Business2 days ago
Musk’s Tesla, SpaceX Confirm $16.8 Billion ‘Terafab’ Chip Plant as World’s Largest Building in Texas
-

 Tech6 days ago
Qwen3.8-27B runs frontier-class coding agents and reasoning locally, no cloud API required
-

 Crypto World7 days ago
OCC Greenlights Trump Family Crypto Firm for Trust Charter
-

 Politics2 days ago
6 months on, Irish renters crushed by effects of government housing bill
-
 NewsBeat2 days ago
The ‘Lucky Dip Gang’ causing carnage for clicks: After five thugs were killed speeding in the wrong direction on a motorway, GUY ADAMS investigates a sick new trend… and why police aren’t even allowed to pursue them
-

 Crypto World7 days ago
NAVI Prime launches institutional lending framework on Sui
-

 News Videos4 days ago
Don’t Leave Your Financial Future To Chance | August 19, 2026
-

 Tech5 days ago
GLM-5.3 hits the API at $1.4/$4.4 per million tokens
-
Tech7 days ago
5 Of The Most Reliable Car Brands To Consider If You’re Buying A Used SUV
-
 Crypto World7 days ago
Dow’s 3-Year Winning Run Isn’t a Crash Signal, Still 49% Odds of Double-Digit Gains
-

 Business6 days ago
Stock Market Today: Tech Futures Slide As Treasury Yields Jump; Nvidia, Micron, Sandisk Sell Off
-

 Tech6 days ago
Keychron K8 Ultra 8K review: a great value keyboard with comfort issues
-
 Tech7 days ago
Nvidia discloses $21B stake in SpaceX
-
Business7 days ago
Fabrinet (FN) Q4 2026 Earnings Call Transcript
-

 Business4 days ago
Five Below: Kids Discount Retailer Reaps Rich Rewards
-

 Business5 days ago
Marvell Shares Jump 7% as Google Chip Deal Confirms Custom AI Silicon Partnership, Analysts
-
 NewsBeat7 days ago
Trump explodes at CNN reporter after question about young blonde aide who wrote him besotted letters
You must be logged in to post a comment Login