
Crypto World
Rocket Lab: Launch This Options Strategy For A $295 Profit


Rocket Lab (RKLB) remains under pressure, languishing below its 50-day and 200-day moving averages. With that in mind, Rocket Lab stock is setting up as an interesting bearish candidate when looking for new option trades. Let’s look at a setup known as a bear put spread. This is a bearish option trade that benefits from further downside in the stock…
Copyright ©2026 Investor’s Business Daily, LLC. All rights reserved. 87990cbe856818d5eddac44c7b1cdeb8

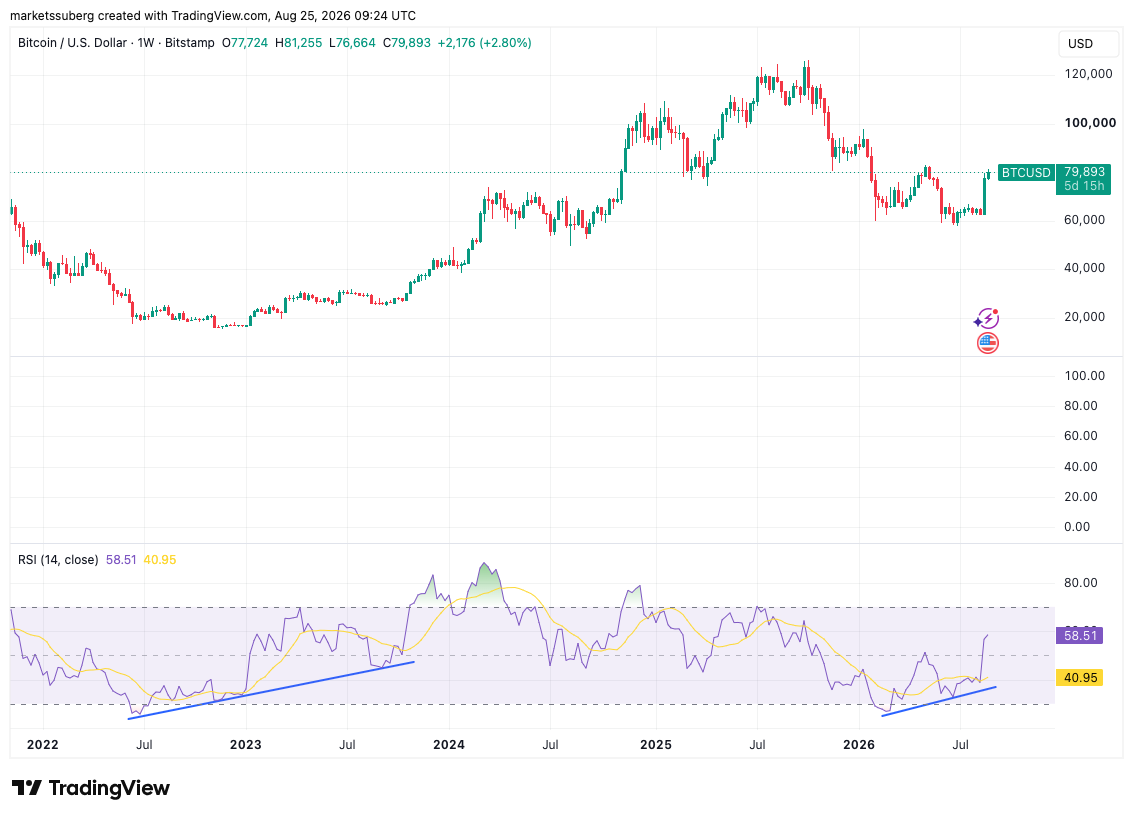
Bitcoin (BTC) price action is offering mixed signals after hitting $80,000 as traders diverge on market trajectory.
Key points:
- Bitcoin weekly relative strength index (RSI) reaches 58.3, repeating a bullish divergence that accompanied the end of the 2022 bear market.
- Daily RSI values reach their most “overbought” since November 2024 near 83.
- Stochastic RSI prints a key crossover but avoids copying previous zero-level bear-market lows.
Weekly RSI echoes Bitcoin’s 2022 bear-market bottom
Relative strength index (RSI) data across daily, weekly and two-month time frames has added to the debate over whether last week’s 25% rebound by Bitcoin will endure.
RSI is a classic indicator for trend momentum. It uses an asset’s average gain or loss over a given lookback window, normally 14 days, to determine the strength of its current trend momentum. For Bitcoin, bullish divergences with price, where RSI makes higher highs while BTC/USD makes lower lows, have accompanied the start of major trend inflections.
In mid-2022, around six months before the end of Bitcoin’s last bear market, weekly RSI began a bullish divergence, locking in higher lows while BTC/USD saw lower lows. Throughout 2026, a similar pattern emerged, data from TradingView shows.
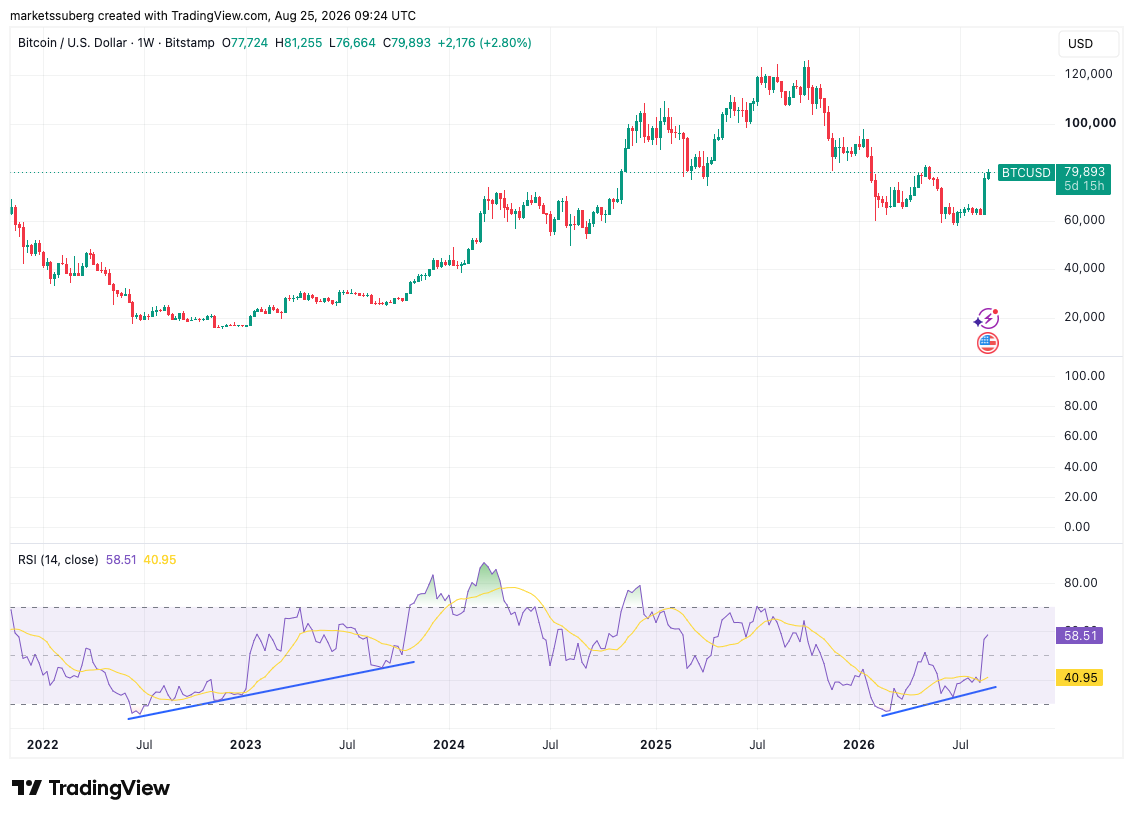
BTC/USD one-week chart with RSI bullish divergences. Source: Cointelegraph/TradingView
While short-term RSI signals present a less reliable picture of overall price trends, weekly signals have led some to rethink the status of the current bear market.
“Weekly is the timeframe that matters here, that’s where you read the secular trend and the cycle inflection points,” Jamie Coutts, chief crypto analyst at Real Vision, wrote in a post on X on Tuesday.
Coutts described weekly bullish divergences as having “real weight,” citing price upside that resulted from previous divergence events.
Weekly RSI currently measures 58.3, its highest levels since BTC/USD hit its latest all-time high of $126,200 in October 2025, having broken through a trend of lower highs. On daily time frames, RSI is now in “overbought” territory at 82.93.
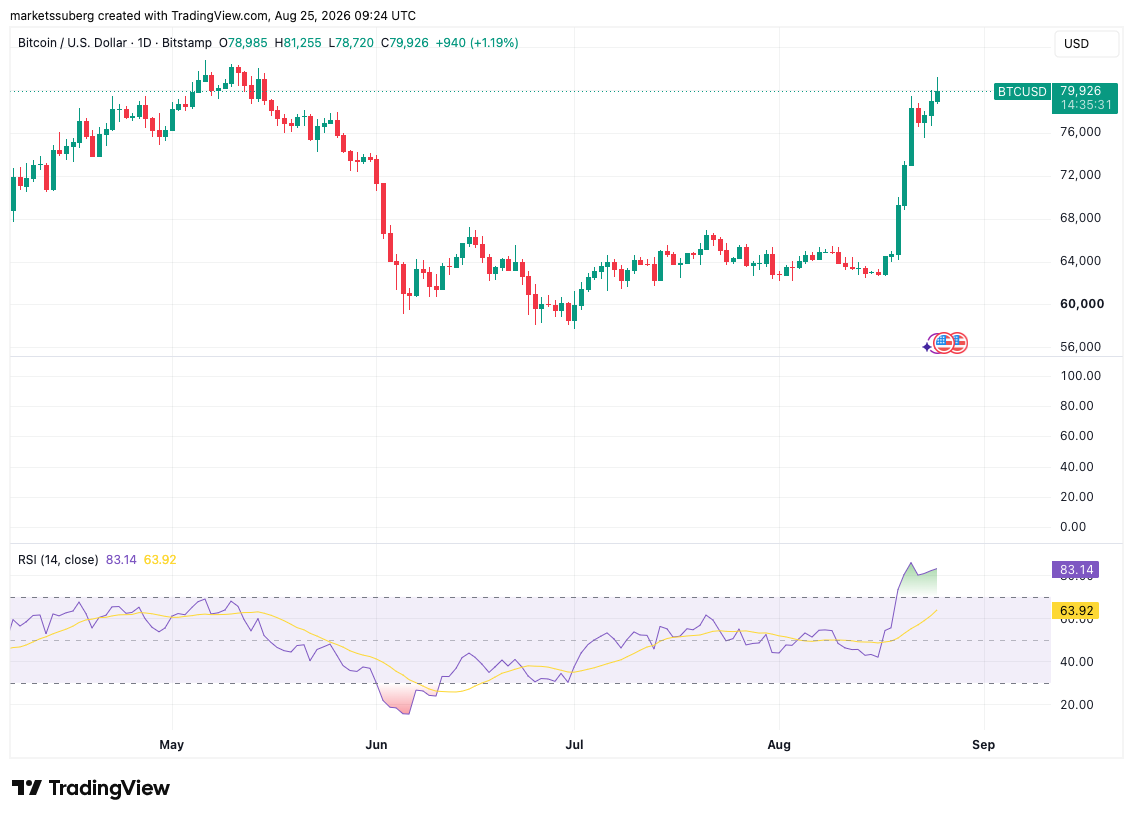
BTC/USD one-day chart with RSI data. Source: Cointelegraph/TradingView
Market participants are split over the implications of the daily readings, which are the highest since November 2024. Some see RSI giving a warning sign of an imminent reversal, while others point to the fact that historically, Bitcoin uptrends have been accompanied by multiple “overbought” periods, where RSI is above 70.
In his latest analysis, Jonatan Randin, senior market analyst at crypto trading platform PrimeXBT, flagged more similarities to late 2022. At the time, daily RSI increased from 40 to 90 over a single weekly candle.
“An extreme move like this usually signals the start of something new,” he told X followers.
“It doesn’t necessarily mean that the bear market is over but it is telling us something. I think what it’s trying to tell us is that we are about to enter a new phase of this cycle.”
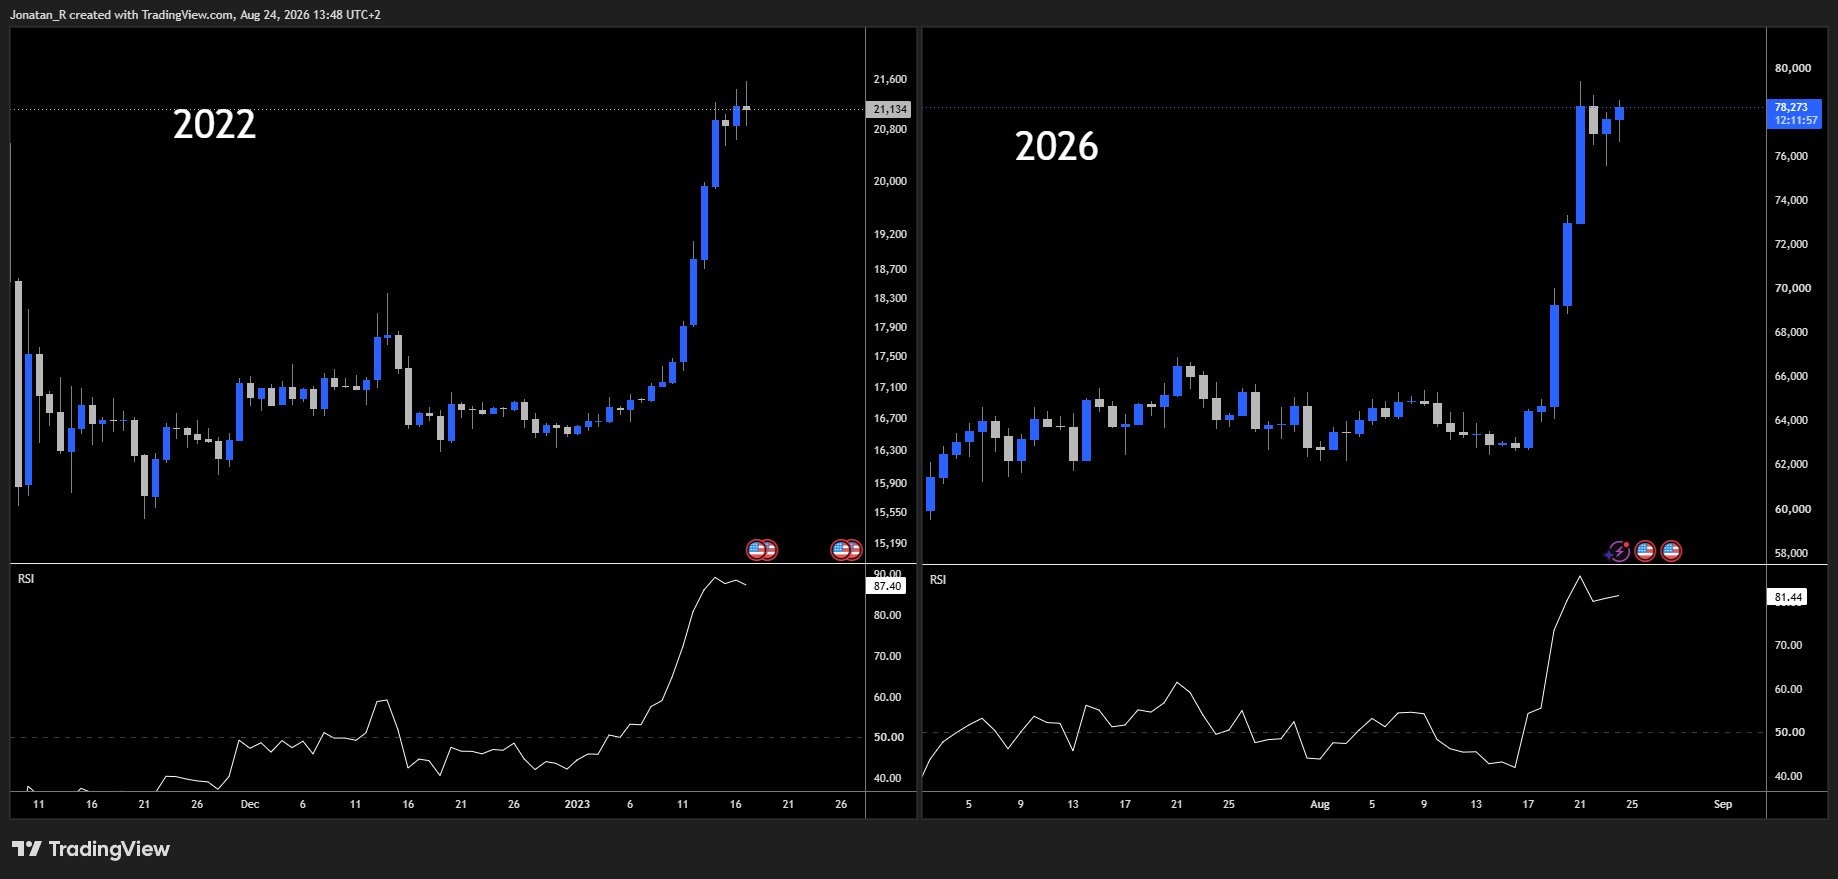
BTC/USD RSI comparison chart. Source: Jonatan Randin on X.com
Stochastic RSI prints anticipated crossover
Previously, Cointelegraph reported on expectations that Bitcoin’s two-month stochastic RSI indicator would repeat historical patterns to provide a clear signal over the end of the bear market.
Related: First bear-market trend line reclaim since 2025: Five things to know in Bitcoin this week
Stochastic RSI privileges more recent price moves, with a crossover of its two constituent trend lines acting as a cue for bullish trend change. This event has now occurred. However, the indicator reached only 4.81, avoiding the macro lows near zero that preceded previous crossovers.
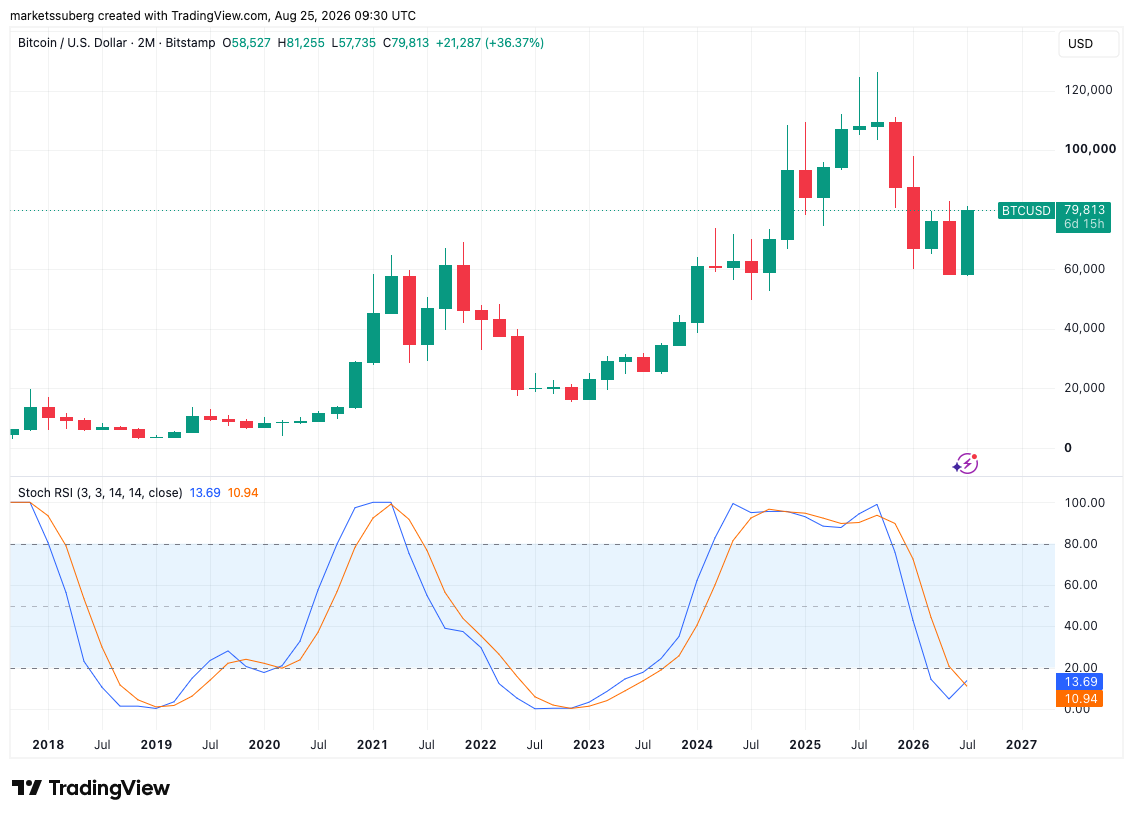
BTC/USD two-month chart with stochastic RSI data. Source: Cointelegraph/TradingView


Bitcoin has entered the early stage of a possible bull market after a 24% rally lifted CryptoQuant’s Bull Score from 30 to 80 within one week.
Summary
- Bitcoin’s Bull Score has reached 80, its highest reading since October 2025.
- Eight of the index’s 10 indicators are now sending bullish signals.
- CryptoQuant requires a weekly close above $83,000 to confirm a new bull market.
- Short-term whale profits and 53,000 BTC in exchange deposits raise pullback risks.
Bitcoin Bull Score has reached a 10-month high
CryptoQuant reported that Bitcoin’s Bull Score rose from 30 to 80 over the past week, reaching its highest level since October 2025 as spot and futures demand strengthened.
Eight of the model’s 10 indicators now show bullish conditions. The index combines several measures of market demand, investor profitability, network activity, and liquidity to assess whether Bitcoin is trading in a favorable or unfavorable environment.
A score of 80 places Bitcoin firmly inside the model’s bullish range, compared with 30 before the rally began. According to the analytics firm, the rapid increase indicates that several parts of the market improved together rather than price rising on one isolated signal.
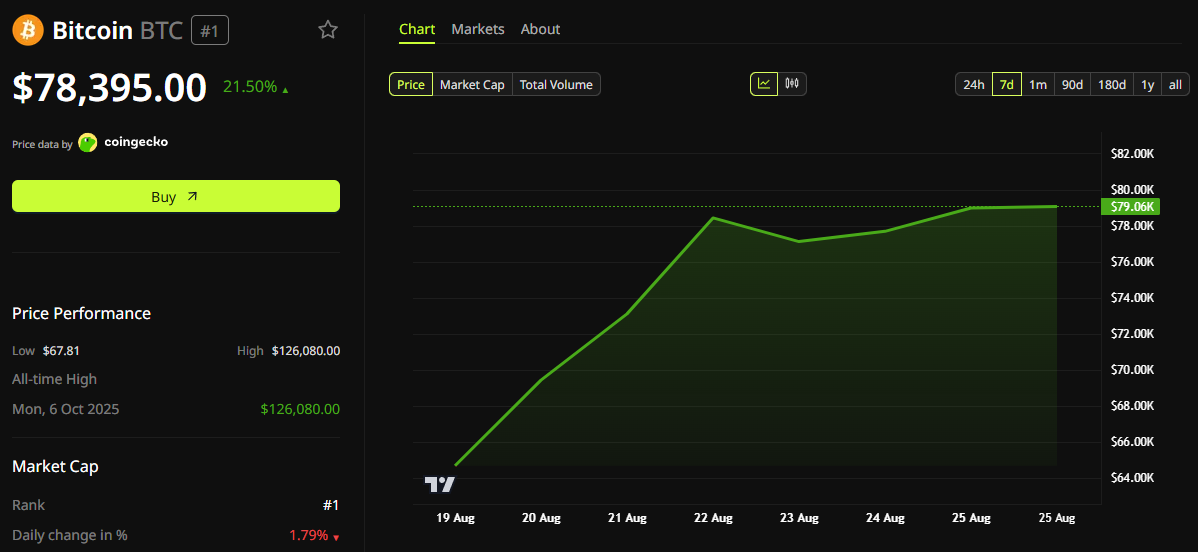
Bitcoin climbed more than 24% from below $64,000 and briefly moved above $80,000 during the advance. At the time of writing, CoinGecko data placed BTC near $79,000 after the cryptocurrency gave back part of its gains.
The rally also carried Bitcoin to its highest price in about three months. On Aug. 25, crypto.news reported on the breakout, including the role of U.S. exchange-traded fund demand and forced buying from traders closing short positions.
Despite the Bull Score reading, CryptoQuant has not treated the move above $80,000 as final confirmation of a new bull cycle. Its model requires Bitcoin to record a weekly close above the 365-day moving average, which currently sits near $83,000.
Why Bitcoin needs a weekly close above $83,000
Rather than relying on an intraday move, CryptoQuant uses the 365-day moving average as a long-term dividing line between improving and weakening market conditions.
A weekly close above roughly $83,000 would place Bitcoin back above that level and confirm the firm’s bull-market signal. Until then, the analytics provider views the current move as an early-stage recovery that still needs price confirmation.
LMAX Group market strategist Joel Kruger identified a similar resistance area. He pointed to Bitcoin’s May 2026 high of $82,820 as the next major price level, putting the previous peak close to CryptoQuant’s 365-day average.
“A clear break above that level would reinforce the view that a meaningful cycle low is now in place and shift attention towards the next major move through $100,000 and, ultimately, the 2025 record high,” Kruger noted in a recent statement.
Bitcoin’s 2025 record stands well above its current price, leaving the $82,820 to $83,000 area as the first test before traders can assess Kruger’s higher targets. A brief move through the zone would not meet CryptoQuant’s condition unless BTC remains above the moving average through the weekly close.
An Aug. 24 analysis of the rally identified $77,000 to $80,000 as the immediate holding area after Bitcoin’s strongest weekly advance since March 2023. Analysts cited in the report said a loss of that range could put $70,000 back in focus, while a sustained breakout could open a move toward $80,000 to $90,000.
Spot and futures demand have risen together
Supporting the Bull Score increase, CryptoQuant said spot and futures demand are growing at the same time for the first time since early October 2025.
Spot demand matters because it involves purchases of Bitcoin itself, while futures activity can include leveraged positions that traders may close quickly. Growth across both markets suggests that the rally has drawn participation from cash buyers alongside derivatives traders, according to the analytics firm.
U.S. spot Bitcoin ETFs have provided an identifiable source of cash-market demand. The funds recorded about $1.9 billion in net inflows during the week ending Aug. 21, their strongest weekly intake since October 2025 and their fifth consecutive positive session.
A previous report on ETF demand showed that the funds received approximately $517 million on Aug. 19 and another $606 million on Aug. 20. Bitcoin moved through $70,000 and $75,000 during the same period, although the concurrent moves do not by themselves prove that ETF purchases caused the full price increase.
Fresh U.S. demand continued after the weekly streak. According to SoSoValue data cited in an Aug. 25 Bitcoin market update, spot ETFs attracted $337.56 million on Aug. 24. BlackRock’s iShares Bitcoin Trust led with $208.9 million, followed by $104.6 million for Fidelity’s Wise Origin Bitcoin Fund.
ETF flows give American investors direct exposure to Bitcoin through regulated, exchange-listed products without requiring them to hold the cryptocurrency in a private wallet. The next completed daily readings may show whether fund investors continued buying after BTC slipped back below $80,000.
Whale profits raise the risk of a pullback
Although its long-term indicators have improved, CryptoQuant warned that several short-term measures show the rally may have become overheated.
Traders’ unrealized profit margin rose to 20.5%, the highest reading since June 2025. The metric estimates the paper gains held by market participants and can indicate increased selling pressure when profits rise quickly.
CryptoQuant compared the latest reading with early May, when the margin reached 19% as Bitcoin traded near $82,000. BTC subsequently fell by about 30%, according to the firm, although a similar reading does not guarantee that the same decline will happen again.
Large short-term holders have already converted part of their paper gains into realized profits. Between Aug. 20 and Aug. 22, short-term holder whales booked about $1.2 billion while Bitcoin traded around $78,000 to $79,000, the report said.
Selling activity peaked on Aug. 20, when the group realized a record $614 million in profits. CryptoQuant classifies the activity as whale profit-taking because it came from large holders whose coins had been held for a relatively short period.
Exchange inflows rose alongside the realized gains. Around 53,000 BTC moved onto trading platforms, the largest deposit total since June, according to the analytics firm.
Coins sent to exchanges are not necessarily sold, as holders may transfer Bitcoin for custody, collateral, or trading purposes. CryptoQuant nevertheless treats rising deposits as a potential source of sell-side supply because the assets become easier to trade once they reach an exchange.
Nvidia (NVDA) and Micron (MU) will drive a third of S&P 500 2026 earnings growth, Schwab’s Liz Ann Sonders said. Bitcoin (BTC) broke above $80,000 the same day.
The chipmaker’s earnings land Wednesday, a report Wall Street is treating as a verdict on the entire AI trade. Sonders called the resulting rotation into concentrated winners and away from crowded positions the market’s defining dynamic.
Nvidia and Micron’s Earnings Concentration
Sonders is chief investment strategist at the Schwab Center for Financial Research. On this week’s “Closing Bell,” she broke down how concentrated 2026 earnings growth has become.
Nvidia alone accounts for 18% of the S&P 500’s expected year-over-year earnings growth, she said. Micron’s AI memory chips add another 14 percentage points.
“I think rotation in and of itself is the new momentum trade.”
Liz Ann Sonders, CNBC
Nvidia’s earnings report arrives after seven straight losing sessions, even as prediction markets price in a near-certain beat. Some earlier analysis of the setup pointed to positioning and options flow, not fundamentals, as the driver of that mismatch.
Bitcoin Broke $80,000 as Capital Looks Elsewhere
Bitcoin’s rally arrived alongside heavier bond market stress and dollar weakness. Both followed the Treasury Department’s move to expand its long-term bond buybacks.
The token touched a fresh multi-month high above $81,000 this week before pulling back, trading near $78,400 at publication time.

Schwab’s own market note called this pattern a “debasement trade” returning. Sonders agreed, tying it to fading confidence in the dollar and Treasury policy. The trade points capital toward scarce assets like Bitcoin and gold.
Nvidia’s results land today, and commentary from the Fed’s annual Jackson Hole symposium is still ahead this week. Traders face two signals to reconcile.
One is whether concentrated AI earnings can keep justifying record index weights. The other is whether Bitcoin’s break above $80,000 marks a lasting rotation into hedges, or just a short squeeze.
The post Schwab Strategist Flags Wall Street's Growth Is Concentrated in Two Firms appeared first on BeInCrypto.
Crypto World
Bitcoin’s Bear Market Isn’t Over? These Analysts Expect a Major Crash in the Short Term
It sounds almost surreal that only weeks ago BTC was fighting to stay above $60,000, while it now trades around $80,000. Its awakening has sparked widespread enthusiasm within the community and prompted analysts to call for an end to the bear market.
However, not all are convinced that the bulls have fully regained control, as some expect the resurgence to be a major trap that could lead to a collapse well below $50,000.
Sharp Red Candle Incoming?
The past several days have been wild for the entire cryptocurrency market and have positively surprised the investors who might have grown tired and uninterested during the prolonged bearish cycle. Bitcoin jumped by 23% over the last week, briefly exceeding $81,000, and here are the exact factors that sparked the rally.
And while many industry participants have popped the champagne and started celebrating the potential beginning of a new bull run, others remain highly cautious. X user AlejandroBTC claimed BTC faces a major pullback ahead that could take the price to as low as $40,000.
“This is what I think happens next: Bitcoin tests $68K–70K. We get a small bounce. Then we come back to that zone again, and this time it doesn’t hold. That’s when the panic starts. Liquidations accelerate, sentiment collapses, and I think we go straight toward $40K,” the analyst predicted.
X user bee also envisioned a hard rejection. In their view, BTC might experience a sharp red candle (not a slow pullback) that could erase almost all of the gains from the past several days.
Earlier this week, Nonzee argued that the asset’s pump was caused by a liquidity squeeze. They believe the green wave could be a bull trap that might eventually lead to a violent move south toward $45,000.
Bitcoin’s Relative Strength Index (RSI) supports the bearish perspective. The ratio has soared to 83, entering extreme overbought territory, a level that has historically been followed by a short-term correction.

BTC’s Fear and Greed Index is also worth mentioning. Today (August 25), the figure jumped to 74, the highest mark witnessed since October last year. This suggests that the market has reached an extreme level of euphoria, which often happens when investors are driven by FOMO, and could be another sign of an incoming pullback.

Bottoming Under This Condition
X user Niels, who has previously been quite pessimistic about BTC, also chipped in following the latest rally. The analyst assumed that a weekly close above $83,000 would mean that the bottom is in and that they were wrong about a potential crash toward $55,000.
“If not, Bitcoin is still following the 4-year cycle, and the macro bottom will happen in October,” Niels added.
The post Bitcoin’s Bear Market Isn’t Over? These Analysts Expect a Major Crash in the Short Term appeared first on CryptoPotato.
Textiles and clothing are also set to be hit by the tariffs, including silk, wool, cotton, yarn, fabrics, carpets, dresses, trousers, T-shirts, sweaters, coats, padded jackets, suits, blazers, tracksuits, and even wigs. Tech-related goods are also included, such as smartphones, video recorders, and camera and computer equipment, alongside leisure and cultural products including toys, puzzles, arcade machines, and video game consoles. Other technology products covered include television and radio transmitters, cameras, radar equipment, and computer monitors.

In the latest Solana news, 3 governance proposals capable of reshaping the network’s supply dynamics head into their final voting window. Voting closes at the end of epoch 1023 on Thursday, a deadline that has quietly become one of the more consequential dates on Solana’s 2026 calendar.
The vote covers a “Solana Constitution” governance framework, a disinflation proposal targeting an 18.9 million SOL emissions cut over 6 years, and a resource fee mechanism designed to push daily SOL burning from roughly 648 to 9,000 tokens.
That is a burn rate increase of nearly 14x. A bullish supply shock narrative is forming around the vote, suggesting traders are front-running the tightening float before implementation even lands.
The timing matters. Broader crypto sentiment has been choppy, yet SOL has decoupled to the upside, a divergence worth watching as governance-driven scarcity narratives collide with technical resistance overhead.
JUST IN: Voting is now live on 3 major @Solana governance proposals and will remain open until the end of epoch 1023 on Thursday
SGP 1: “Solana Constitution,” a new governance framework
— SolanaFloor (@SolanaFloor) August 23, 2026
Gain Access to New Bitcoin Layer 2 Early Here
Solana News: Can SOL Price Hit $105 This Week?
SOL’s daily bar for August 25 opened at $98.64, ran to a high of $102.14, and closed near $101.22. The 7-day gain sits at 31.87%, and the 30-day move is near 35.6%. This is not a single-day spike. It is a sustained trend.
Resistance clusters between $100 and $105.18, with a 13-week high sitting around $102.70. Support has layered in beneath at $88.18, with deeper structural support near $82 to $88 where the EMA20/EMA50 clusters previously held.

A close above $102.70 opens room toward $105 and beyond, especially if the disinflation vote passes cleanly. SOL consolidating between $95 and $102 as traders wait for Thursday’s epoch close before committing further capital is the base case. Rejection at resistance sends price back to retest the $88 to $90 pivot zone and invalidates the current breakout structure.
Traders watching for confirmation should track volume on any push through $102.70. A low-volume breakout would be a red flag.
Gain Access to New Bitcoin Layer 2 Early Here
Bitcoin Hyper Targets Early Mover Upside as Solana Tests Key Levels
A 31.87% weekly rally validates anyone who bought SOL below $80. But at a market cap already pricing in governance-driven scarcity, the remaining upside to $105 is single-digit percentage territory — not the kind of asymmetric return early-stage capital typically hunts for.
That’s pushed attention toward Bitcoin’s own scaling gap, one Solana effectively exploited years ago with its throughput advantage.

Bitcoin Hyper (HYPER) is positioning itself as the first Bitcoin Layer 2 with native SVM integration, smart contract speed on top of Bitcoin’s security, without the base-layer bottlenecks.
The presale has raised $33,080,369.89 at a current token price of $0.0136852, with staking rewards live at launch (APY not yet disclosed). Its Decentralized Canonical Bridge aims to solve BTC’s programmability gap directly, the same limitation that pushed capital toward Solana and Ethereum in the first place.
Presale allocations carry standard early-stage risk: no live mainnet yet, and returns depend on execution. Full breakdown of the raise and Layer-2 mechanics is covered in this presale assignment report.
Unlock Access to Bitcoin’s New Layer 2 Here
The post Supply Shock? SOL Voters Are Deciding Whether to Cut Emissions and 14x the Burn Rate appeared first on Cryptonews.
Jim Paulsen, a veteran market strategist, says the U.S. stock market has used up most of the room it traditionally relies on to climb higher, even as slowing momentum starts to press against record valuations.
Paulsen, a longtime economist who spent years as chief investment strategist at the Leuthold Group, made the case on CNBC’s Closing Bell Overtime. He pointed to profits, valuations, and investor positioning all sitting near historic extremes.
Paulsen Flags Record Stock Market Valuations
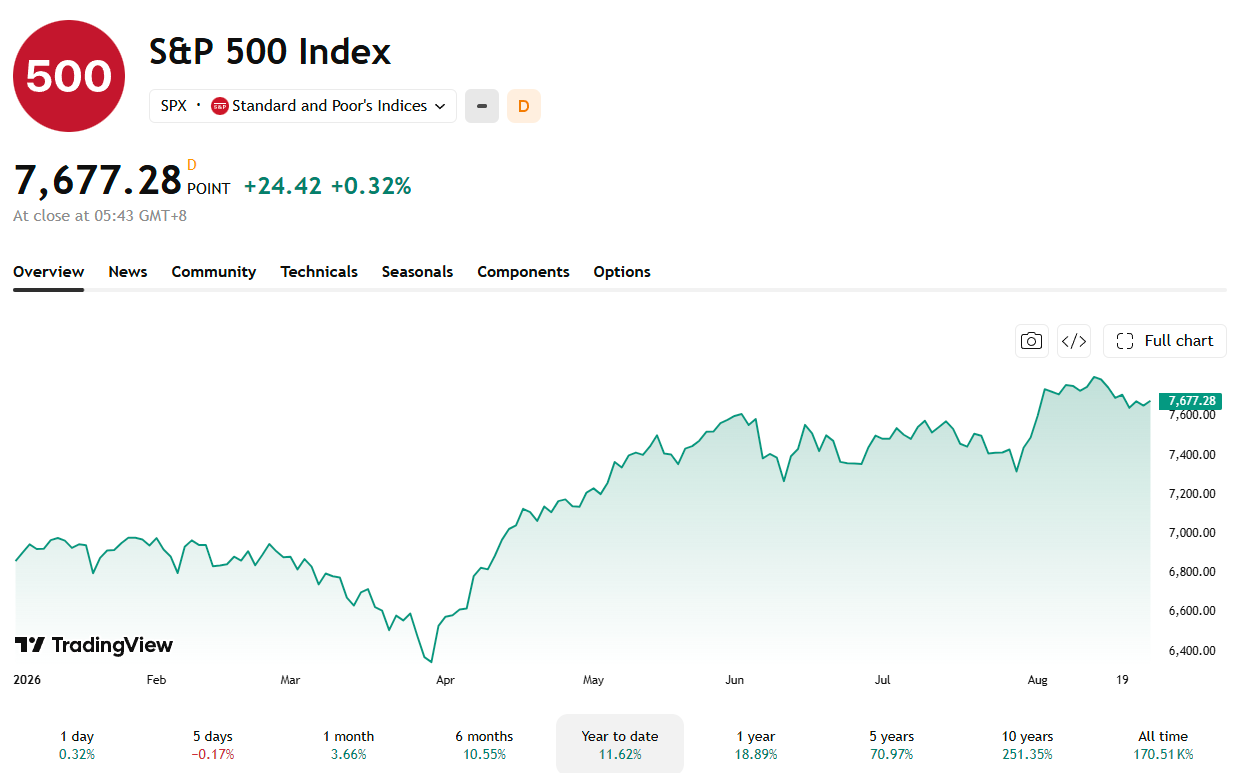
Paulsen said in July that the S&P 500’s price level sits about 60% above its post-World War II trend line. That level has only been matched once before, near the peak of the dot-com bubble.
Trailing 12-month earnings are also 60% above their own trend line. Paulsen called that a record, exceeding even prior cycle peaks such as the dot-com era.
Corporate profit margins and non-residential investment spending, measured against gross domestic product, have also reached record highs. Forward earnings estimates compared with trailing profits have also been unusually high, Paulsen said. That measure is nearing record territory in data going back to 1990.
Valuations are not all at record levels, Paulsen said, but by most measures they remain historically high. He added that household exposure to equities, as a share of financial assets, sits at a record high. Cash holdings relative to market value are close to a record low.
Paulsen called the overall mood complacent, since investors have grown used to buying every dip.
“No one’s worried about recession anymore, Michael, because we haven’t had one for 16 years.”
Jim Paulsen, CNBC

Slowing Momentum Could Flip the Rate-Cut Script
Paulsen flagged weakening data, including recent ADP payroll figures, softer retail sales, and sluggish housing activity. He cited the Citigroup U.S. Economic Surprise Index, which tracks how incoming data compare with forecasts. That gauge has fallen from 60 to 25 in recent weeks.
Paulsen warned that falling rates could coincide with falling stock prices, rather than trigger the rally investors typically expect. That risk grows if the rate declines reflect weakening growth rather than cooling inflation.
He also pointed to the dollar. In real terms, it remains within 8% of the all-time high it set in 1970.
He also downplayed fears tied to the Treasury’s bond buyback plan, which billionaire investor Stanley Druckenmiller criticized. Paulsen called the recent yield moves more noise than substance.
Oil prices are adding further pressure on the system, Paulsen said. That pressure weighs on both corporate margins and household purchasing power.
Whether that slowing momentum turns into an outright pullback remains unclear. Much may depend on how quickly the underlying data keep deteriorating in the weeks ahead.
The post Veteran Strategist Warns Stocks Have ‘Used Up' Room to Keep Climbing appeared first on BeInCrypto.

Bitcoin rose above $80,000 today, reaching more than a three-month high as softer U.S. dollar news revived momentum in the crypto sector. The cryptocurrency was last trading at $80,300 after touching $81,200. It had risen 16% since the prior week.
The move has drawn attention to two forces behind the rally: demand through U.S. spot Bitcoin exchange-traded funds and the unwinding of bearish positions as prices climbed.

This month, the U.S. Treasury doubled its support for longer-dated government bonds, increasing its buyback program from $2 billion to $4 billion. The move does not directly expand the money supply, but it may put downward pressure on long-term yields and can be viewed by markets as having an easing-like effect.
The announcement helped revive discussion of the debasement trade, in which investors seek assets seen as protection against a weaker dollar, persistent deficits, and inflation. Bitcoin’s fixed supply of 21 million coins is part of its appeal to investors who view scarce assets as a hedge against currency weakness.
Dollar weakness accompanied the move. The ICE U.S. Dollar Index fell 0.8% during the week after the Treasury announcement. Gold also moved above its 200-day moving average, which was near $4,518 an ounce, over the same period.
Discover: The Best Token Presales
ETF Flows and Short Covering
U.S. spot Bitcoin ETFs recorded $517 million in net inflows on August 19, their strongest day since May. The funds drew roughly $1 billion in net inflows during the first two weeks of August 2026.

Short covering added to the speed of Bitcoin’s advance. Roughly $1.5 billion in Bitcoin short positions were liquidated as prices rose, with about $700 million cleared in a single minute. When traders with short positions exit their positions, the buying needed to close them can add pressure on an upward price move.
The combination of ETF demand and short liquidations helps explain the scale of the rally. The ETF news reflects flows into regulated products that allow investors to gain Bitcoin exposure through brokerage accounts without directly holding the cryptocurrency.
Bitcoin Pumps, But Bond Yields News Remain in Focus
The Treasury said its larger buyback operations for longer-dated Treasurys would begin September 9 and were intended to provide greater liquidity support. The initial positive reaction in the bond market reversed the following day, however.
The 10-year Treasury yield rose to 4.737%, while the 30-year yield increased to 5.276%, according to Dow Jones Market Data cited by MarketWatch. Those levels brought the rates back to around where they stood before the buyback announcement.
Ian Lyngen, head of U.S. rates strategy at BMO, said concerns over de-dollarization, U.S. creditworthiness, and the need for a higher term premium remained central to the recent bond selloff. His assessment underscored skepticism that the Treasury’s buyback adjustment had changed the underlying drivers of rising yields.
A sustained break could put Bitcoin’s next test in the $95,000 to $100,000 range, but no analyst can reliably determine whether the rally will continue. For now, the August move has highlighted how macroeconomic expectations, ETF flows, and market positioning can converge.
The Treasury action was viewed by some market participants as easing-like, while Bitcoin’s fixed supply kept it in focus alongside gold as investors weighed dollar weakness and inflation concerns.
Discover: The Best Crypto to Diversify Your Portfolio
The post Bitcoin News: ETF Demand and Short Covering Power August Rally appeared first on Cryptonews.
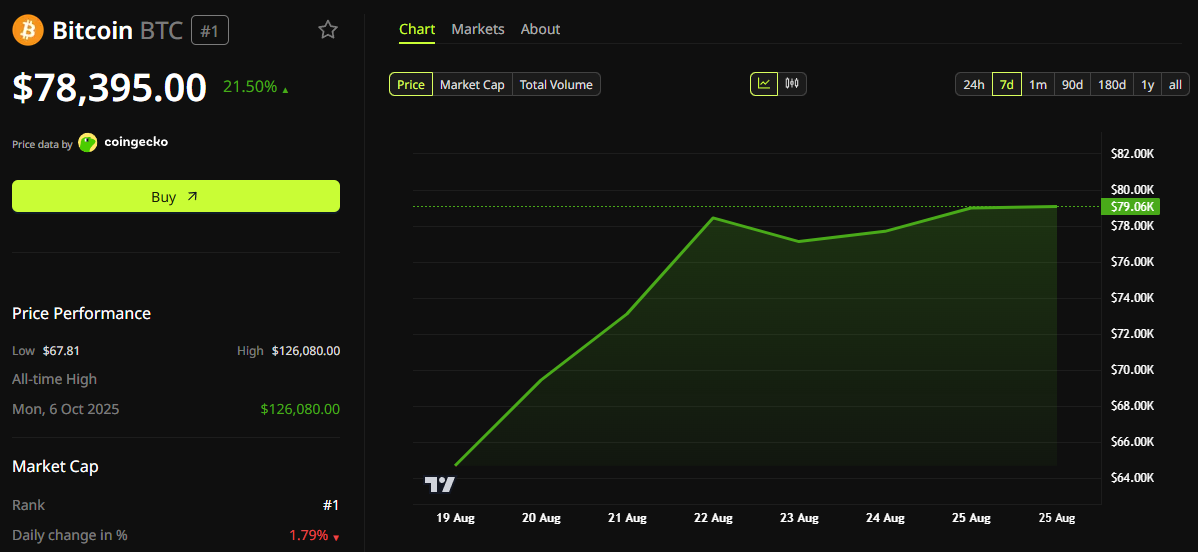
Katie Stockton, founder of Fairlead Strategies, said Bitcoin (BTC) has more room to run than gold right now. She pointed to how differently the two assets bottomed out.
Stockton joined CNBC’s “The Exchange” as BTC extended a sharp recovery. She said the digital asset is no longer oversold but has not become overbought either.
Bitcoin’s Breakout Confirmed
Stockton described a basing phase that started in June. She said the retest came in July, and a breakout is now underway.
BTC cleared its 200-day moving average, a level she called an almost precise hurdle back in May.
“We have obviously very strong short-term momentum and improved intermediate-term momentum now off of these lows.”
Katie Stockton, Fairlead Strategies, on CNBC
Bases often take time to complete, with multiple retests along the way, she noted. She said the immediate follow-through after the breakout helps confirm it.

Gold’s Rally Looks Different
Gold tells a different story, according to Stockton. The metal’s intermediate-term downtrend started later than BTC’s. Its current bounce is a countertrend rally rather than a full trend reversal.
Stockton said gold still carries intermediate-term momentum and should see further gains. She expects that move to hit resistance sooner than BTC’s, though.
The difference comes down to how long each asset spent falling before it turned higher. Stockton said BTC’s longer-term oversold reading followed a more prolonged decline. That gave it more time to complete a proper base.
Gold’s drop was shorter, leaving less room for its rebound to extend. That timing gap is the core of Stockton’s call.

BTC has more room to run before it looks stretched. Gold’s rally is closer to running its course.
BTC traded near $78,400 at the time of publication. Gold sat around $4,636 an ounce.
Both assets have rallied hard over the past several weeks. That has drawn fresh attention from traders comparing the two as stores of value.
Stockton’s read puts her among the more constructive voices on BTC’s outlook right now. She expects BTC’s rally to keep running longer than gold’s advance, giving it more room before hitting resistance.
Traders are still weighing whether the bounce marks a genuine trend change or another rally to sell into. Stockton’s read suggests the former for BTC.
Gold’s advance, by contrast, looks more like a pause within a longer corrective phase.
The post Fairlead Strategies Founder Says Bitcoin's Rally Has More Room Than Gold's appeared first on BeInCrypto.

Until now, the biggest jumps from this type of training have come from coding models, mostly because code has a useful property: it either works or it doesn’t, meaning that the reward signal is immediate, so improvement can happen in a fast loop. (It’s also helpful that there was plenty of coding data already out there on the internet, meaning models were good coders to begin with.)
But AI companies’ long-term goal is to automate large swathes of the economy. That’s where Spirit’s data likely comes in.
What makes the data useful
RL environments are only as good as the data that populates them, says Heiner of Surge AI. Companies like Surge and Mercor often hire human workers who are tasked with populating these environments with realistic data, either from scratch or in partnership with AI tools. “But even that is a little bit removed from literally having actual data that was used in the real world,” Heiner says. “That’s where deals like Spirit come in.”

Xiaomi’s XRING O3 Chip Debuts With Record AnTuTu Score, First-Ever CXMT LPDDR6 Memory in China Chip Milestone

Bitcoin Weekly RSI Has Analysts Eyeing A BTC Price Trend Reversal

Will Celine Dion Appear On ‘Dancing With The Stars’?





-

 Fashion4 days ago
Weekend Open Thread: Madewell – Corporette.com
-

 Business3 days ago
Musk’s Tesla, SpaceX Confirm $16.8 Billion ‘Terafab’ Chip Plant as World’s Largest Building in Texas
-

 Crypto World4 days ago
anatomy of crypto’s biggest liquidation event since 2021
-

 Crypto World1 day ago
A $30 Billion AI Fund Implodes, Now the SEC Is Investigating Wall Street’s Role
-

 Politics4 days ago
6 months on, Irish renters crushed by effects of government housing bill
-
 NewsBeat4 days ago
The ‘Lucky Dip Gang’ causing carnage for clicks: After five thugs were killed speeding in the wrong direction on a motorway, GUY ADAMS investigates a sick new trend… and why police aren’t even allowed to pursue them
-

 Tech7 days ago
GLM-5.3 hits the API at $1.4/$4.4 per million tokens
-

 Business3 days ago
Mystery AI Model ‘Ox Alpha’ Draws Developers With Free Access as Chinese Lab Origins Remain Debated
-

 News Videos6 days ago
Don’t Leave Your Financial Future To Chance | August 19, 2026
-

 Business6 days ago
Marvell Shares Jump 7% as Google Chip Deal Confirms Custom AI Silicon Partnership, Analysts
-

 Business5 days ago
Five Below: Kids Discount Retailer Reaps Rich Rewards
-

 Business1 day ago
Moderna CEO warns China is pouring state money into mRNA technology
-

 Business5 days ago
UK firms in critical financial distress rise 9% to 53,756
-

 Sports3 days ago
Deshaun Watson fires back at Browns fans after being booed: ‘It’s a disrespectful thing’
-

 Business1 day ago
NVIDIA Stock Drops Nearly 2 Percent to $210 on Seventh Losing Day Ahead of Critical AI Earnings
-

 Fashion7 days ago
Jimmy Choo Autumn 2026 collection
-
 Entertainment6 days ago
10 Most Perfect Fantasy Shows of the Last 25 Years
-

 Tech6 days ago
OpenAI confirms ChatGPT is down as logins and signups fail
-

 Business6 days ago
PayPal and Venmo now accepted for tuition at several universities
-

 Crypto World6 days ago
Optimism-funded team's deciding vote shifts $49 million in OP tokens away from users
You must be logged in to post a comment Login