


Connect with us

Business

Fed’s Preferred Inflation Gauge Shows Core Prices Rose 3.3% in July Ahead of Jackson Hole Speech

Published

on

Paladin Energy

WASHINGTON — Consumer prices ticked higher in July, with the Federal Reserve’s preferred inflation gauge showing annual core inflation holding at 3.3%, according to a Commerce Department report released Wednesday, arriving just days before Fed Chairman Kevin Warsh delivers his first major policy speech at the central bank’s annual Jackson Hole symposium.

The personal consumption expenditures price index, the measure the Fed relies on most heavily for its policy forecasting, rose a seasonally adjusted 0.2% for the month, putting the annual headline inflation rate at 3.7%. Both figures came in 0.1 percentage point above the Dow Jones consensus estimate. Stripping out volatile food and energy costs, core PCE posted respective monthly and annual gains of 0.2% and 3.3%, landing exactly in line with economist forecasts. While the Fed monitors both the headline and core measures, policymakers generally treat core inflation as the more reliable indicator of longer-term underlying price trends, given how much short-term volatility in food and energy prices can distort the headline figure.

The broader report also showed personal income rising 0.4% in July, while consumer spending increased 0.2%, with both figures coming in stronger than economists had anticipated, according to CNBC’s coverage of the release.

A closer breakdown of the data revealed diverging trends across different categories of consumer spending. Goods prices actually declined during the month, falling 0.1%, driven primarily by a 2.7% decrease in gasoline and other energy-related goods, alongside a 0.9% drop in furnishings and long-lasting household equipment. Services prices, by contrast, continued climbing, rising 0.3% for the month, pushed higher by a 1.2% increase in financial services and insurance costs along with a more modest 0.3% gain in housing costs.

Advertisement

Financial markets showed a modest, immediate reaction to the data. Stock market futures pulled back slightly following the report’s release, while Treasury yields moved higher, reflecting investor recalibration around the persistence of inflation heading into the Fed’s next major policy decisions.

The report lands at a pivotal moment for Federal Reserve policymakers, who continue weighing their next move even as inflation, despite generally soft monthly readings throughout the summer, remains well above the central bank’s longstanding 2% target. The rate-setting Federal Open Market Committee did not hold a formal policy meeting in August, giving officials a brief reprieve before their next scheduled gathering on Sept. 15-16. According to CNBC, markets are currently pricing in only about a 1-in-3 probability of a rate move at that September meeting, with traders instead viewing December as the more likely window for any potential rate hike.

Although the FOMC itself is not meeting this week, Fed officials are gathering in Jackson Hole, Wyoming, for the central bank’s closely watched annual economic policy symposium, with the event’s centerpiece being a keynote policy address scheduled for Friday from Chairman Kevin Warsh. Since taking office in May, Warsh has remained notably circumspect regarding where he sees monetary policy heading, generally preferring to let markets set their own expectations rather than offering explicit forward guidance, a communication style that has left investors particularly eager for clearer signals during his Jackson Hole appearance.

The inflation data arrives amid a broader backdrop of rising government bond yields that has added further complexity to the Fed’s policy calculus. Both the 10-year and 30-year Treasury yields recently touched their highest levels since 2007, just before the onset of the global financial crisis, according to CNBC. That surge has been attributed to a combination of factors, including growing investor concern about the Fed’s underlying commitment to its inflation target, as well as broader anxiety surrounding the federal government’s debt levels and budget deficits.

Advertisement

In response to those rising yields, Treasury Secretary Scott Bessent announced roughly a week earlier that his department would significantly step up its buybacks of government debt, an initiative aimed at helping stabilize longer-term borrowing costs. However, according to CNBC, market participants have expressed skepticism regarding whether that buyback program will ultimately have a meaningful, lasting impact on yields given the scale of the broader fiscal pressures driving the recent bond market volatility.

Wednesday’s report caps a busy week of market-moving developments, with investors simultaneously digesting the inflation data, Nvidia’s closely watched quarterly earnings report, and Meta’s separate announcement of a roughly $16.7 billion settlement resolving state lawsuits over allegations the company designed its platforms to addict children, developments that have collectively shaped market sentiment even as the underlying inflation picture remains the dominant macroeconomic story heading into the fall.

With core inflation holding steady at 3.3%, comfortably above the Fed’s 2% target but not accelerating further, Wednesday’s report is likely to reinforce the current wait-and-see posture many Fed officials appear to be adopting ahead of their September meeting. Investors and economists alike are expected to parse Warsh’s Friday remarks at Jackson Hole closely for any indication of how the incoming chairman intends to balance the central bank’s continued inflation-fighting mandate against growing concerns about elevated borrowing costs and the broader health of the bond market, even as his relatively guarded public communication style so far has left much of that policy direction still genuinely uncertain heading into his first major address in the role.

Advertisement
Continue Reading
Click to comment

You must be logged in to post a comment Login

Leave a Reply

Business

The Economics of On-Demand Production Compared With Traditional Retail Inventory

Published

on

The Economics of On-Demand Production Compared With Traditional Retail Inventory

Retailers now face renewed pressure to manage inventory costs amid unpredictable demand and rising financial constraints.

Shrinking margins and the need for operational agility have fuelled interest in alternatives to traditional stockholding. This article explains how on-demand production compares with longstanding inventory approaches at a financial and strategic level.

Inventory economics have become a focal point for retail decision makers due to volatile sales cycles and higher costs associated with stock holding. Modern retail strategies are increasingly weighing the flexibility of on-demand production against the risks and commitments linked to carrying large inventories. As customers expect broader product choices and prompt fulfilment, print on demand provides an option that changes traditional methods for managing stock. Understanding these competing models is essential for budgeting and achieving resilient business growth.

Changing retail dynamics rekindle focus on inventory

Fluctuating consumer demand and unforeseen market events make accurate sales forecasting more challenging. Rising expenses related to warehousing, insurance, and tied-up capital have placed inventory management at the centre of retail planning for business leaders. In an environment with less predictable revenue, access to working capital becomes even more important.

Retailers are also looking for increased flexibility to respond quickly to shifts in trends. The capability to reallocate operational resources and evolve product lines is now considered a strategic advantage in today’s unpredictable retail landscape. This flexibility is particularly important when product lifecycles are shorter or when developing new categories.

Advertisement

Key features and cost drivers of each model

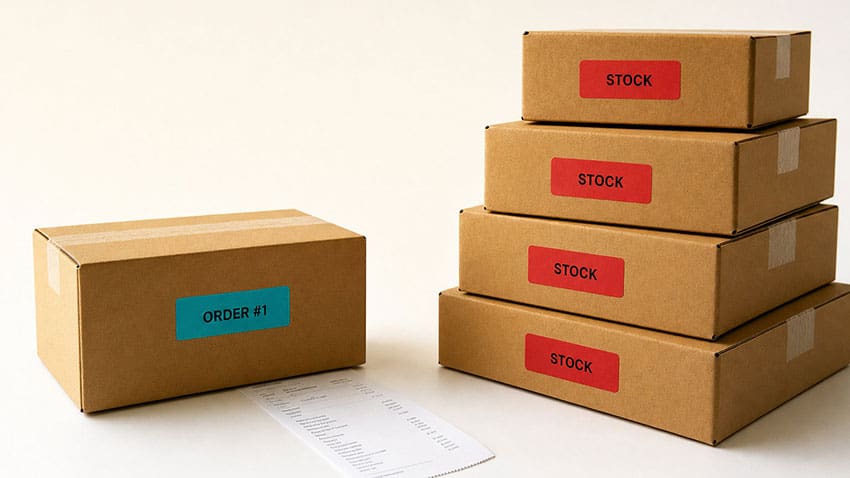
The traditional inventory approach means retailers must forecast demand in advance, purchase stock before sales occur, and manage inventory until products are sold. Costs include bulk purchasing, warehousing, and ongoing handling, as well as the possibility of losses from unsold or outdated products. While this model may reduce unit costs, it can increase the potential for markdowns or write-downs if sales forecasts are not met.

Conversely, the on-demand model only manufactures items once a customer has placed an order. Important cost factors here include higher production costs per unit, greater supply coordination needs, and possibly longer lead times for customers. This method can reduce or even eliminate warehousing needs and lower upfront risk, but depends on efficient systems and reliable suppliers to maintain consistency.

The most significant cash flow difference is in timing. Traditional inventory requires investment from the point of purchase until the final sale, restricting available capital for other areas. On-demand strategies typically use a pay-as-you-go arrangement, improving liquidity but placing emphasis on timely and dependable fulfilment.

Suppliers play a vital role in this equation, and as an example, print on demand demonstrates how supplier relationships and production capabilities can influence on-demand operations. Cooperating closely with partners helps enable transparency, which is valuable for retailers focused on maintaining customer experience and consistent quality.

Advertisement

Balancing risk, margin, and customer expectations

Inventory comes with the risk of unsold stock, often leading to discounting or product write-offs, which reduce overall profitability. Rapid product cycles can make goods obsolete sooner, highlighting challenges for traditional models. By employing on-demand systems, retailers may lessen potential losses if trends shift unexpectedly and avoid large commitments to uncertain products.

The economics of these methods also differ in terms of margin. While per unit costs are usually higher with on-demand, wastage from excess stock and forced markdowns can be reduced. With lower return rates due to fewer unsold products, net margins may be stronger even if gross margins appear lower for each individual sale.

Customer service expectations are another factor. With traditional inventory, orders can often be dispatched immediately, meeting demands for speed and certainty. On-demand production requires clear communication about expected lead times, making accuracy in delivery estimates essential to satisfy customers and manage expectations.

How to choose an inventory approach for your business

The preferred model will depend on your product, predictability of demand, and the presence of available capital. If there is strong data supporting reliable sales forecasts for key products, traditional inventory may provide economies of scale. For less certain demand or new product lines, the flexibility offered by on-demand might justify the higher per item cost.

Advertisement

Some retailers adopt hybrid methods, maintaining inventory for proven products while using on-demand production to launch new designs or grow their product range without excessive upfront investment. The key to success lies in thorough demand analysis, effective supplier management, and alignment of operational processes with business objectives and market demands.

Both inventory strategies require careful consideration of risks, cash flow, and customer service. By assessing your business’s needs and options, you can select the most appropriate model, or a combination, that strengthens resilience and supports sustainable results in a complex retail environment.

Advertisement
Continue Reading

Business

The Potential Impact of Driver Experience Distribution on Fleet Liability Exposure

Published

on

The Potential Impact of Driver Experience Distribution on Fleet Liability Exposure

Two trucking companies may carry similar claims histories and operate comparable fleets — yet differ significantly in how driver experience is distributed across their operations.

That distribution may influence how liability exposure develops across individual fleet segments, independently of overall experience levels or past claims activity.

Two trucking companies may operate similar fleets, serve similar clients, cover the same territory, and carry comparable claims histories. Yet the composition of their driver workforce may differ.

One company may employ a large share of long-tenured drivers who are familiar with its routes, clients, equipment, and procedures. The other may have a more varied driver population.

Driver experience does not directly determine liability exposure. The distribution of that experience across a fleet may, however, affect how different operational segments function.

Advertisement

STAR Mutual RRG is a member-owned risk retention group providing commercial auto liability coverage to a range of trucking and transportation operations—specialized haulers, last-mile delivery fleets, for-hire carriers, and owner-operators alike.

Experience Depends on the Operational Environment

Years spent in commercial trucking matter — but they are not the only meaningful measure of experience in transportation operations.

A driver with extensive experience in interstate operations may have limited familiarity with a company’s regional delivery network. A driver with fewer years in the industry may have substantial experience with a specific company’s clients, equipment, and facilities.

Driver experience develops through regular interaction with a specific operating environment — delivery locations, client procedures, equipment configuration, load procedures, dispatch, and other operational elements.

Advertisement

Driver experience is best understood as a function of the operational environment in which it was developed.

How Experience Distribution Creates Operational Differences

Beyond the number of experienced drivers a company employs, it matters how that experience is distributed across operations.

A company may have many experienced drivers but concentrate them in specialized assignments. As a result, the remainder of the fleet may operate with less operational familiarity.

Another company may maintain a more even distribution of experienced drivers across standard operations.

Advertisement

These two companies may differ meaningfully in terms of operational familiarity — despite having similar numbers of experienced drivers overall.

How Experience Profiles May Shift Gradually Within a Fleet

The experience profile of a fleet may shift without any major hiring event.

Experienced drivers may retire, change roles, or step back from regular driving. New drivers gradually join the workforce. The fleet may continue operating the same number of trucks on the same routes — but the distribution of experience across the driver population changes.

This gradual shift matters because the fleet’s physical structure may appear stable while the driver population evolves beneath it.

Advertisement

Why Industry Experience and Company Familiarity Are Not the Same

A newly hired driver is not necessarily inexperienced in commercial trucking.

Drivers who change employers may bring substantial industry experience — interstate operations, regional delivery, specialized equipment, specific cargo types, and more.

The adjustment process involves becoming familiar with a new company’s operating environment — client requirements, dispatch procedures, equipment assignments, documentation practices, and similar specifics.

The distinction is between industry experience and company familiarity. Both are useful — but they are not the same.

Advertisement

How Role Changes Affect Experience Distribution

Driver experience within a fleet may shift even when experienced employees remain with the company.

Long-tenured drivers may be reassigned to training roles, dedicated client accounts, supervisory functions, or other activities that limit their participation in standard route operations.

The experience is retained within the company — but its distribution across daily operations changes.

This may become relevant when regular driving activities shift toward less tenured personnel.

Advertisement

Why Claims History May Not Reflect Current Driver Experience

Claims history is a record of past events. Driver experience reflects the characteristics of the current workforce.

A fleet may maintain a stable claims record while experiencing meaningful change in its driver population. Conversely, an experienced workforce may operate under substantially different conditions when entering new territories or working with new clients.

Claims history may not fully reflect the current operational profile. Driver population is worth considering alongside it.

Why Average Experience Figures May Obscure Fleet-Level Differences

An average experience figure may obscure meaningful differences within the fleet.

Advertisement

A company may carry a high average tenure while showing significant variation among individual drivers and their assigned activities.

The relevant factor is not only the overall experience level of a fleet — it is how well that experience corresponds to the specific routes, equipment, clients, cargo, and procedures assigned to individual drivers.

Conclusion

Driver experience is one of the factors that may affect how liability exposure is distributed across a commercial trucking fleet.

Changes in hiring, retirement, reassignment, and driver roles may gradually shift experience distribution — even when fleet size and claims history remain relatively stable.

Advertisement

Considering driver experience alongside vehicles, routes, cargo, clients, and operating procedures supports a broader picture of how a transportation operation actually functions.

Advertisement
Continue Reading

Business

Rising costs leave small firms struggling to afford UK apprentice training schemes

Published

on

Business Live

One West Midlands manufacturer warns the investment can cost close to £100,000 before a trainee becomes productive

A worker at the Bowers & Jones factory in Bilston, Wolverhampton

A worker at the Bowers & Jones factory in Bilston(Image: City AM)

Small businesses across Britain are grappling with a mounting cost-of-doing-business crisis. Bowers & Jones, an award-winning manufacturing firm, has told

City AM that increases to the minimum wage have made it unviable for the company to take on apprentices.

When Jane Somerville spearheaded a management buyout of her manufacturing firm and relocated its entire factory across the West Midlands in the midst of the pandemic, she had hoped it would mark the end of a turbulent chapter for the business.

Bowers & Jones, a celebrated producer of precision equipment for the steel industry, had already been battered by Brexit and forced to navigate a labyrinth of regulations and tax legislation to reach its biggest market across the Channel. The cost of importing raw materials had soared, leaving the company with a cost base running “hundreds of thousands of pounds” higher than just a few years previously.

Advertisement

Yet six years later, Somerville’s outgoings have continued to spiral far beyond anything she could have anticipated. While some of that pressure has stemmed from trade barriers imposed by the US and the turbulence of global politics, decisions taken closer to home by the British government have played a significant role, she says.

“The variable cost of operating our factory has gone up from £36 an hour to nearly £56 an hour since we took the business over in 2020,” she tells City AM, as reported by City AM.

“And that’s energy costs doubled, that’s labour costs up because of minimum wages and inflation. The cost of transport significantly increased because of the fuel crisis and everything else around Iran at the minute.

“Everything has gone up,” she says.

Advertisement

Bowers & Jones is one of millions of small businesses that have witnessed their overheads soar in recent years, in what the British Chambers of Commerce has termed a “cost of business” crisis.

According to a newly launched calculator by the lobby group, which measures the financial impact of domestic policy decisions on businesses, the typical small firm has seen its cost base surge by approximately 70 per cent over the past decade as a direct result of UK government decisions – a quarter of which has accumulated since Rachel Reeves’ inaugural Budget in 2024.

Despite vowing to lead the most “pro-business government Britain has ever seen”, the former Chancellor dealt a severe blow to the private sector with a £25bn increase in employer national insurance contributions. Rises to the minimum wage alongside a raft of workers’ rights legislation further inflated the expense of hiring new staff.

While Somerville is keen to take on an apprentice and develop their skills on Bowers & Jones’s specialist machinery, she argues the financial burden has become simply too great to bear.

Advertisement

“[The rise in minimum wage] is a barrier for us to take someone on. That investment over the four years or five years of their apprenticeship, before they can actually be productive to me, is close to, if not over £100,000,” she says. “I’m just better off paying somebody that’s fully qualified.”

Somerville’s grievances highlight how policy choices taken by Keir Starmer and Reeves back in 2024 are now hampering the present government’s efforts to increase youth employment.

Andy Burnham has made tackling the growth of young people not in employment, education or training (Neets) a key mission of his premiership. Since taking office, he has committed to creating fresh technical education pathways for 14-year-olds and elevating apprenticeships to the same status as conventional academic routes.

For that to work, Somerville argues, ministers must help bear more of the financial burden of bringing young people into the workplace and apprenticeship schemes.

Advertisement

“How can [Burnham and Healey] fund training for engineering companies to take somebody out of school, to stop them becoming a Neet, and get them into a technical apprenticeship that doesn’t cost £100,000,” she said.

“That would help me take on at least one or two apprentices – and then I could train them to be ready.”

To find all the planning applications, traffic diversions, road layout changes, alcohol licence applications and more in your community, visit the Public Notices Portal.


Advertisement
Continue Reading

Business

SpaceX plans $100B Louisiana launch site for Starship rockets

Published

on

SpaceX plans $100B Louisiana launch site for Starship rockets

SpaceX announced Tuesday it plans to build its largest rocket launch site in southern Louisiana, investing $100 billion in a complex that could ultimately support thousands of Starship flights each year.

The 125,000-acre site on Pecan Island in Vermilion Parish, called Starbase Louisiana, would become SpaceX’s fourth U.S. launch location and its second Starbase campus, Reuters reported.

Advertisement

Construction is slated to begin in 2027, with the first Starship launch planned for 2029, according to SpaceX.

SpaceX expects the project to create more than 3,000 jobs. In a video, SpaceX CEO Elon Musk said the company could eventually bring “probably 10,000 really exciting jobs” to Louisiana.

HARVARD MAKES MASSIVE $2.2B SPACEX BET ON ELON MUSK’S ROCKET COMPANY

The Starship spacecraft and the Super Heavy v3 booster

SpaceX’s Starship spacecraft and Super Heavy V3 booster stand at Pad 2 at sunrise ahead of the rocket system’s 13th test flight in Starbase, Texas, July 24, 2026. (Reuters/Steve Nesius)

“A day for the history books! With [SpaceX’s] $100 billion investment in Louisiana, we are proving that Louisiana is open – open to new jobs, honest wages, and to those who dare to build something that lasts,” Louisiana Gov. Jeff Landry wrote on X. 

Advertisement

The complex would include launch pads and vehicle processing facilities, as well as systems to produce methane fuel and generate power. The tech company is also considering an airport and deep-water shipping capabilities to transport Starships from Texas, Reuters reported.

The project moved forward after Louisiana settled a lawsuit against ExxonMobil over allegations the oil company’s drilling and canal work contributed to wetland loss. The settlement cleared the way for SpaceX to develop the 18-mile coastal property, according to Reuters.

SPACEX AND TESLA CHOOSE TEXAS FOR AI CHIP MANUFACTURING PLANT THAT WILL BE WORLD’S LARGEST BUILDING

spacex in louisiana

SpaceX plans to invest $100 billion in its proposed Starbase Louisiana complex. (Thomas Fuller/SOPA Images/LightRocket via Getty Images)

Pecan Island is also a protected habitat for dozens of migratory bird species. SpaceX President Gwynne Shotwell said the company would help fund environmental protection efforts.

Advertisement

“In working with the state, we’re planning thousands of acres of marsh creation using beneficial-use placement of dredged material and offshore sediment sources,” the SpaceX website says.

Musk views Starship as key to expanding the company’s Starlink network. The rocket is also central to NASA’s Artemis mission to return astronauts to the moon, Reuters reported.

SPACEX ROCKET STAGE SLAMS INTO MOON AT 5,400 MPH

Tesla CEO Elon Musk

SpaceX CEO Elon Musk views Starship as key to expanding the company’s Starlink network.  (Chesnot/Getty Images)

SpaceX currently launches Starship from Texas and is building two additional Starship launch pads in Florida. The company also operates Falcon 9 launch sites in Florida and California.

Advertisement

GET FOX BUSINESS ON THE GO BY CLICKING HERE

FOX Business reached out to SpaceX for additional details.

Reuters contributed to this report.

Advertisement
Continue Reading

Business

UP Fintech Holding Limited (TIGR) Q2 2026 Earnings Call Transcript

Published

on

OneWater Marine Inc. (ONEW) Q1 2026 Earnings Call Transcript