

Crypto World
Market Analysis: Gold Sees Profit-Taking While WTI Crude Tests Key Support

Gold price started a downside correction from $5,115. WTI Crude oil is now attempting to recover after sliding toward $61.80.
Important Takeaways for Gold and WTI Crude Oil Prices Analysis Today
· Gold price climbed higher toward the $5,120 zone before there was a sharp decline against the US Dollar.
· A key bearish trend line is forming with resistance at $4,945 on the hourly chart of gold at FXOpen.
· WTI Crude oil prices extended losses below the $63.40 pivot zone.
· It dipped below a rising channel with support at $62.85 on the hourly chart of XTI/USD at FXOpen.
Gold Price Technical Analysis
On the hourly chart of Gold at FXOpen, the price climbed above $5,000. The price even spiked above $5,100 before the bears appeared.
A high was formed near $5,115 before there was a fresh decline. The last swing high was near $5,052 before the price settled below $5,000 and the 50-hour simple moving average. It tested the $4,850 zone.
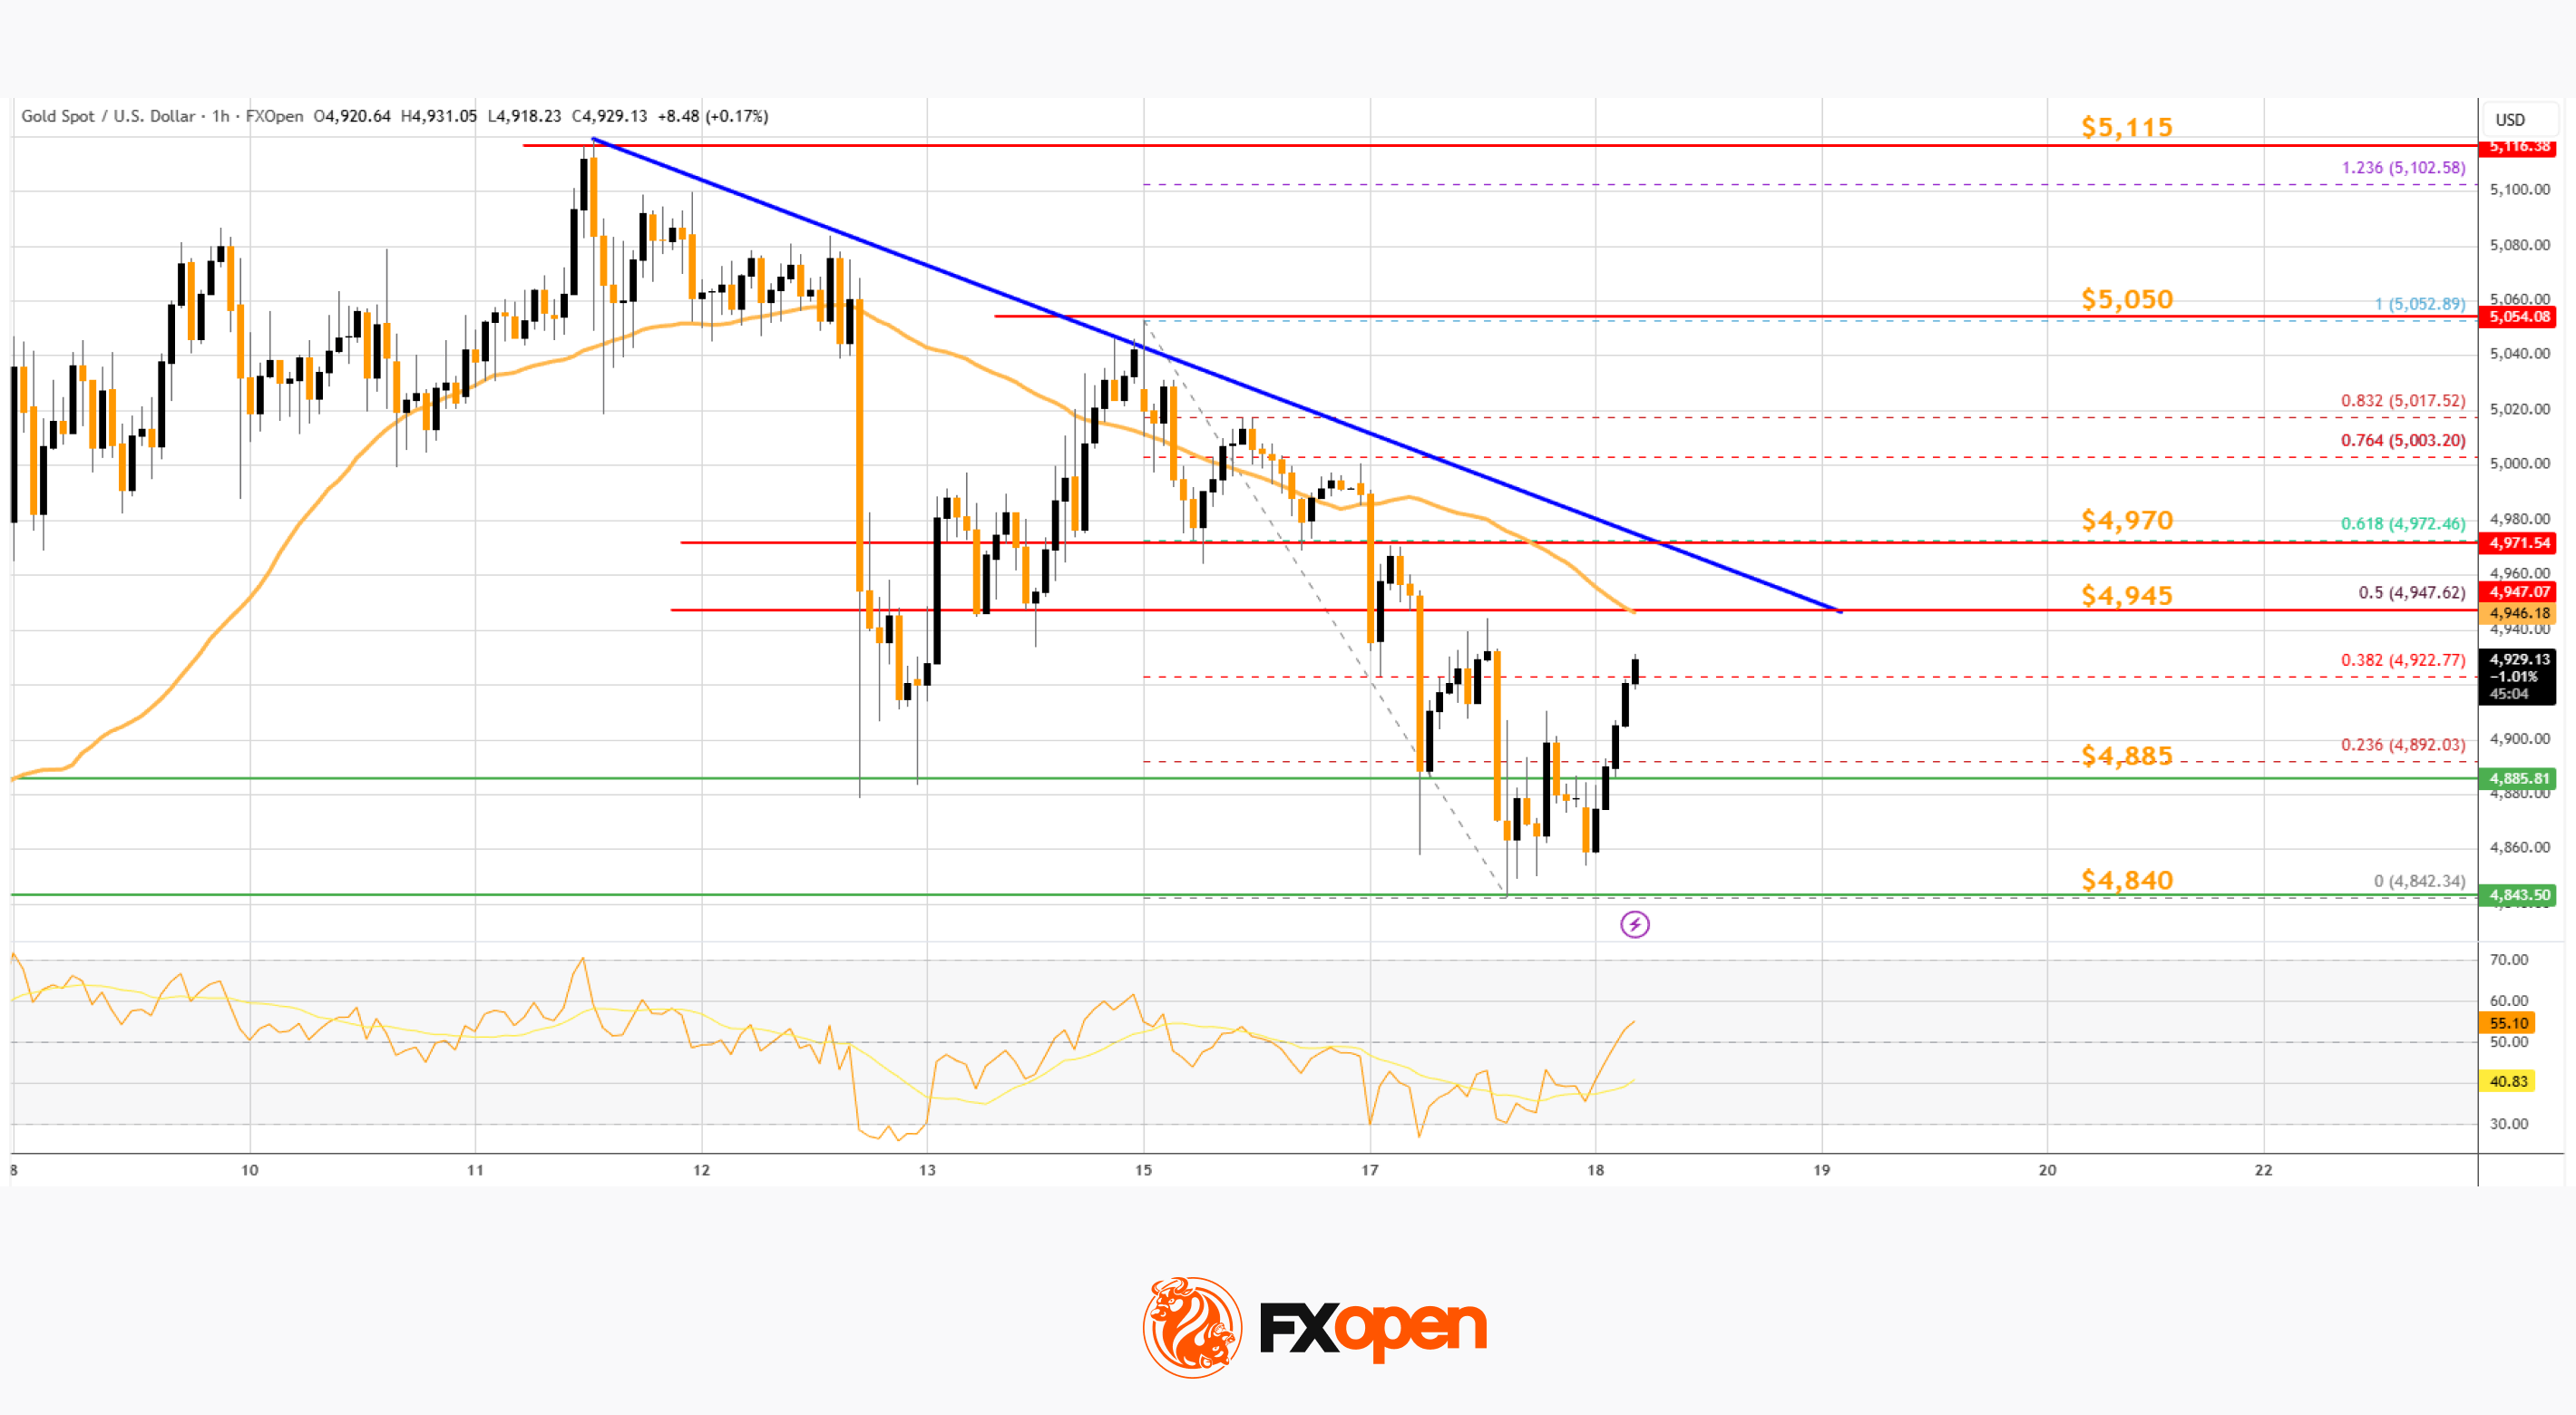
A low is formed near $4,842, and the price is now correcting losses. There was a minor move above the 23.6% Fib retracement level of the downward move from the $5,052 swing high to the $4,842 low.
Immediate barrier on the upside is $4,945, the 50-hour simple moving average, and the 50% Fib retracement. There is also a bearish trend line with resistance at $4,945. The first major hurdle for the bulls could be $4,970.
A close above $4,970 could send the price above $5,000. The next sell zone sits at $5,050, above which the price could test the $5,115 region. Any more gains might call for a move toward $5,200.
An upside break above $5,200 could send Gold price toward $5,285. Initial support on the downside is $4,885. The next key level is $4,840. If there is a downside break below $4,840, the price might decline further. In the stated case, the price might drop toward $4,750.
WTI Crude Oil Price Technical Analysis
On the hourly chart of WTI Crude Oil at FXOpen, the price struggled to continue higher above $65.00 against the US Dollar. The price formed a short-term top and started a fresh decline below $64.20.
There was a steady drop below the $63.40 pivot level. The bears even pushed the price below $62.50, a rising channel, and the 50-hour simple moving average. Finally, the price tested $61.80. The recent swing low was formed near $61.80, and the price is now correcting losses.
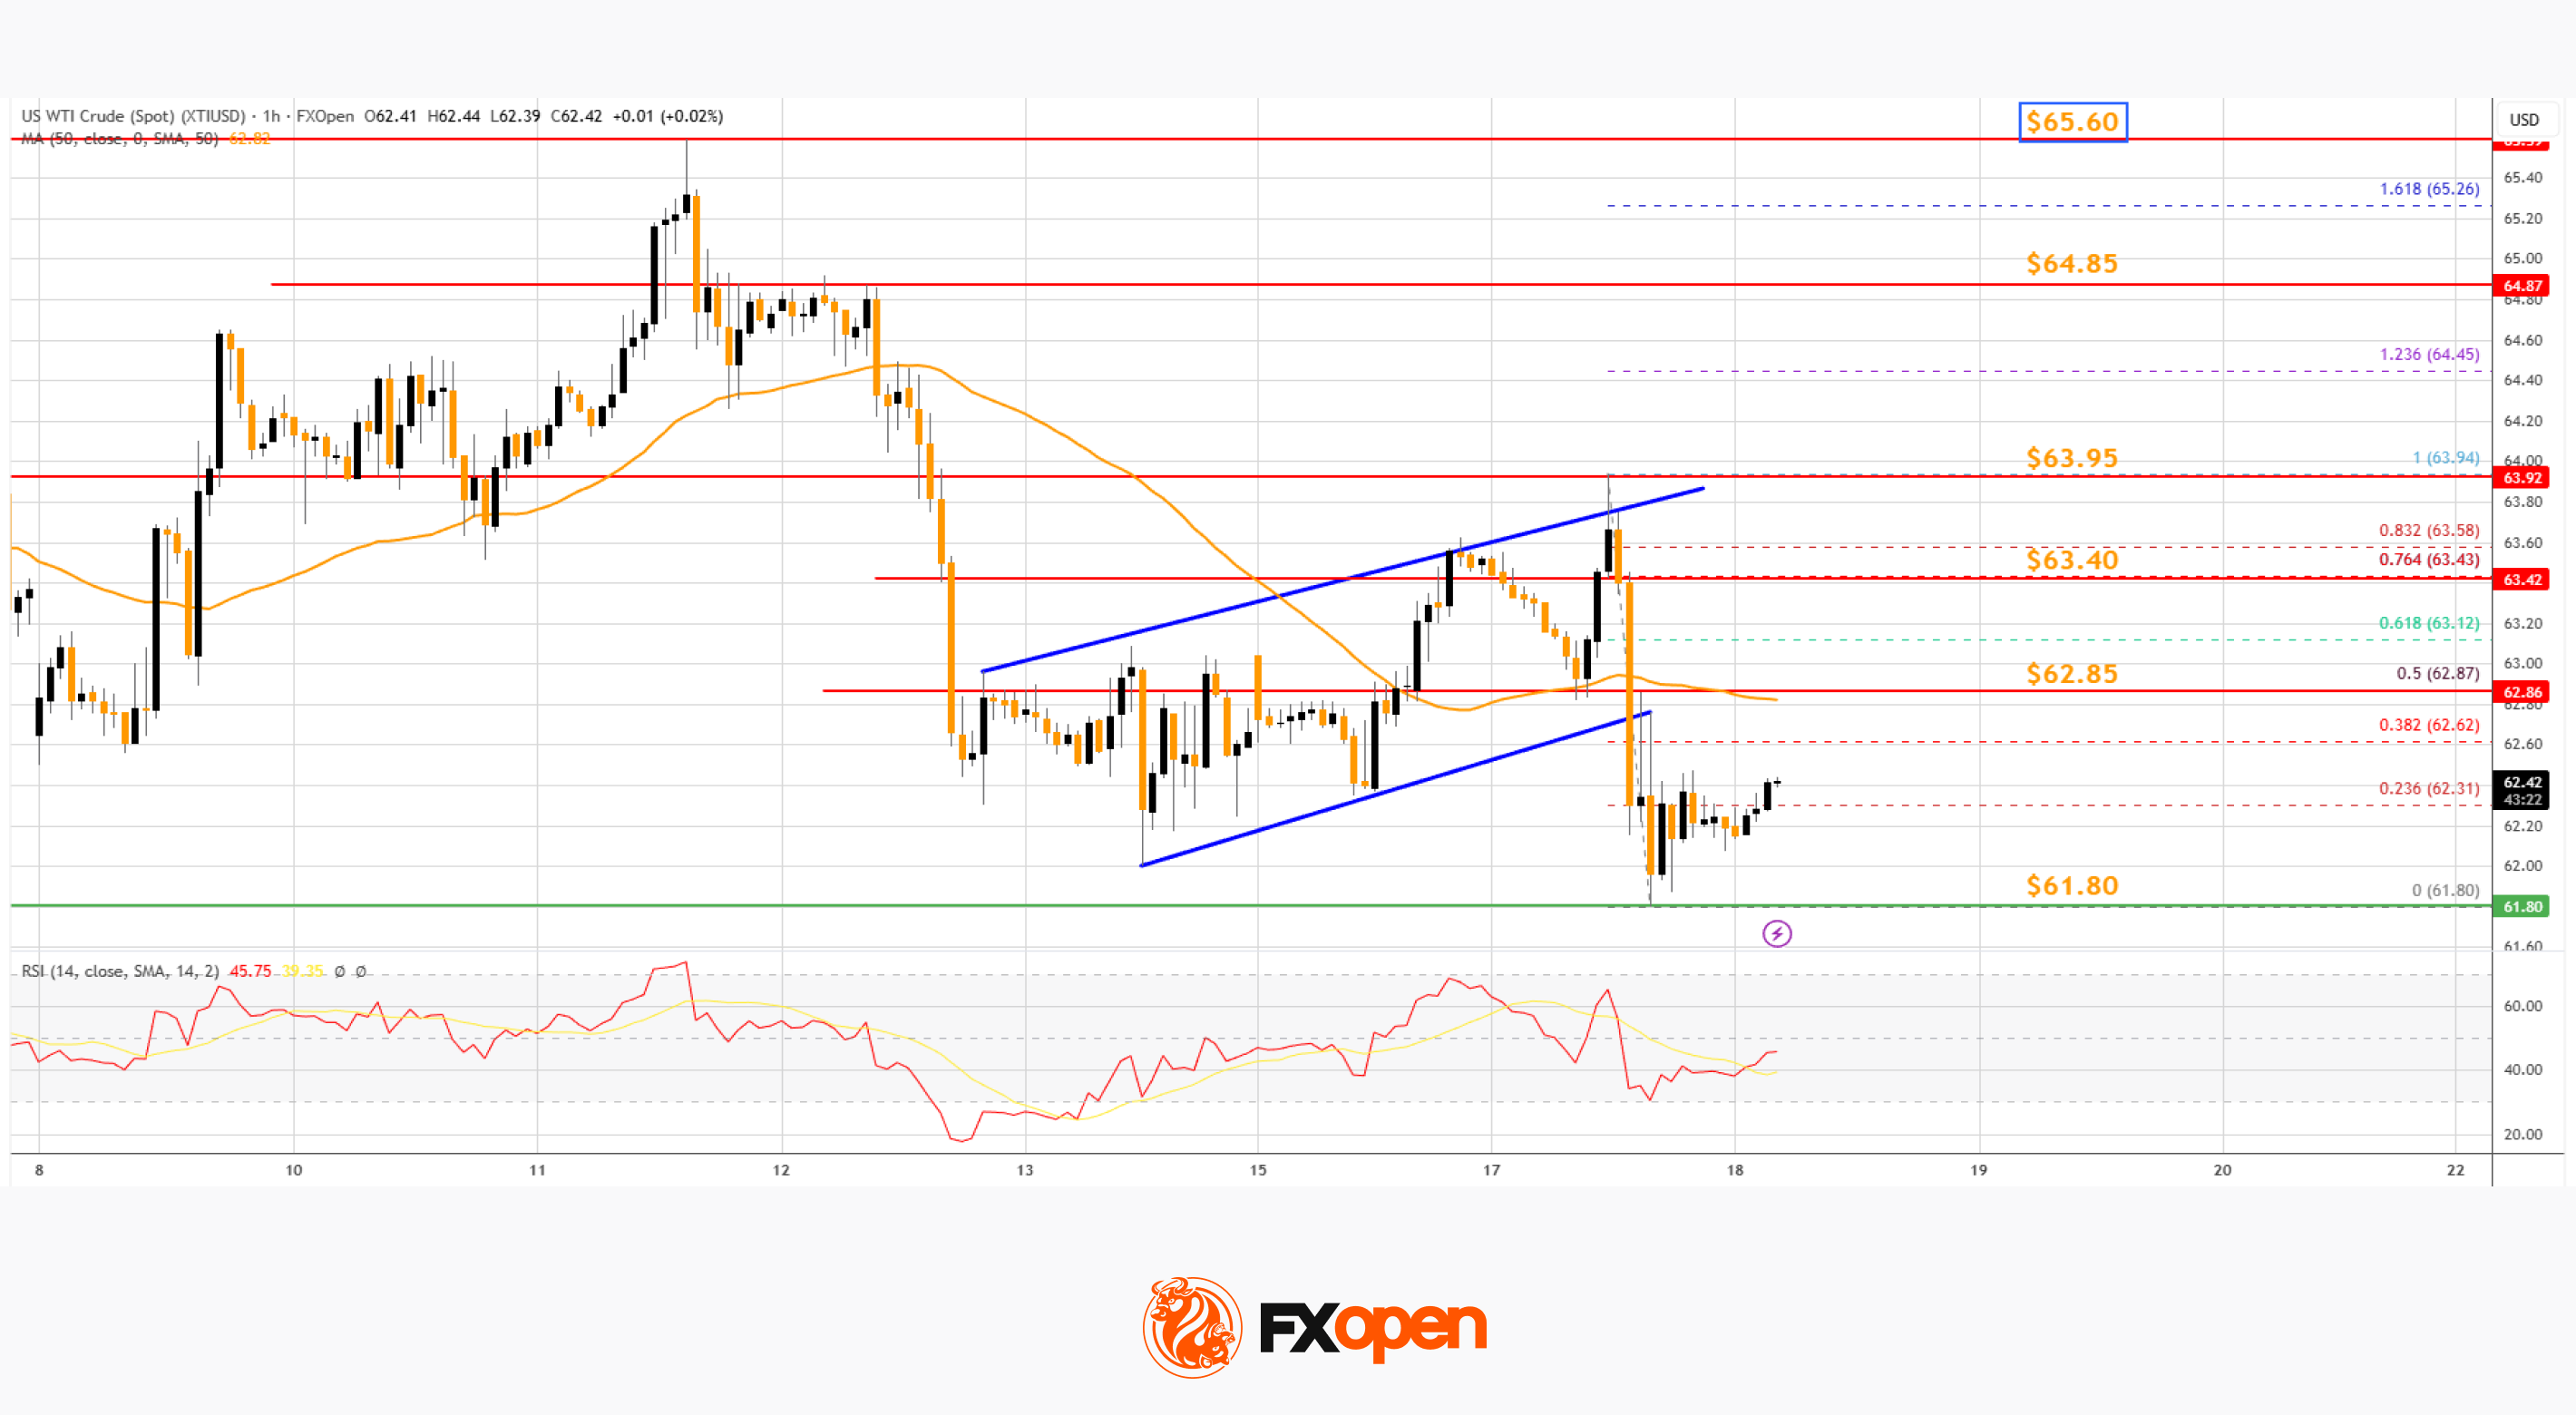
There was a move above the 23.6% Fib retracement level of the downward move from the $63.94 swing high to the $61.80 low. On the upside, immediate resistance is near the 50% Fib retracement at $62.85.
The main hurdle is $63.40. A clear move above $63.40 could send the price toward $63.95. The next stop for the bulls might be $64.85.
If the price climbs further, it could face sellers near $65.60. Immediate support is $61.80. The next major breakdown level on the WTI crude oil chartis $60.50. If there is a downside break, the price might decline toward $58.80. Any more losses may perhaps open the doors for a move toward $56.50.
Start trading commodity CFDs with tight spreads (additional fees may apply). Open your trading account now or learn more about trading commodity CFDs with FXOpen.
This article represents the opinion of the Companies operating under the FXOpen brand only. It is not to be construed as an offer, solicitation, or recommendation with respect to products and services provided by the Companies operating under the FXOpen brand, nor is it to be considered financial advice.


Bitcoin slips ~2% in 7d as MUFG touts stablecoins’ price-stable payments.
Summary
- TC trades near $68k, with a 7d move of about -2.25%, and a 24h range around $66.7k–$69.1k.
- MUFG’s Hardman says stablecoins better meet money’s role via price stability, fast settlement, and low-cost transfers versus BTC’s higher volatility.
- Stablecoins, often fiat-pegged, are gaining attention as digital cash and could see higher adoption in payments while BTC remains mainly a store-of-value asset.
An analyst at Mitsubishi UFJ Financial Group has stated that stablecoins represent a more suitable currency option than Bitcoin for payment purposes, according to recent commentary from the Japanese financial institution.
Lee Hardman, an analyst at MUFG, one of Japan’s three largest banks, said stablecoins have attracted increased attention compared to other digital assets due to their function as digital cash.
Hardman stated that stablecoins better fulfill the requirements of money by offering price stability and fast, low-cost payment services, according to the analyst’s assessment. The analyst noted that Bitcoin’s high price volatility limits its use as a daily payment method.
Stablecoins are pegged to fiat currencies and maintain stable value, making them more likely to be used as a medium of exchange and payment, Hardman said.
The comments come as interest in Bitcoin and cryptocurrencies continues to expand globally, with financial institutions increasingly evaluating various digital asset classes for potential use cases.
After the aggressive sell-off toward the $1.8K region, the market has transitioned into choppy consolidation, while lower timeframes are now approaching a decisive breakout point. The key question is whether this compression resolves to the upside or results in continuation within the dominant downtrend structure.
Ethereum Price Analysis: The Daily Chart
On the daily timeframe, Ethereum is exhibiting clear consolidation behaviour following its sharp decline. The price action has become increasingly choppy, reflecting equilibrium between buyers and sellers. Instead of impulsive continuation, the market is printing overlapping candles with limited directional commitment.
This consolidation is confined between the $1.8K static support base and the channel’s midline acting as dynamic resistance. The mid-boundary of the descending channel continues to cap bullish attempts, preventing a structural trend reversal. Meanwhile, the $1.8K zone remains a strong demand area that has repeatedly absorbed selling pressure.
As long as the price remains trapped between these two boundaries, the primary scenario is range-bound fluctuation. A confirmed breakout above the channel’s midline would open the path toward higher resistance zones, while a breakdown below $1.8K would invalidate the equilibrium and likely trigger another impulsive leg lower.
ETH/USDT 4-Hour Chart
Zooming into the 4-hour timeframe, the market structure becomes more compressed. Ethereum has formed a clear triangle pattern, with descending resistance and rising support squeezing the price into a narrow apex. This pattern reflects volatility contraction and typically precedes an expansion phase.
The asset is now approaching the final portion of the triangle, suggesting that a breakout is imminent. Given the recent higher lows inside the pattern and the improving short-term structure, the probability of an upside breakout is increasing. The targets are clearly defined on the chart, with the first resistance zone aligned with the previously marked supply region above the pattern at the $2.4K area.
However, failure to break upward and a decisive breakdown below the ascending support would shift momentum back in favour of sellers.

Sentiment Analysis
The Binance ETH/USDT liquidation heatmap reveals significant liquidity dynamics around the current range. A dense liquidity cluster is positioned above the current price, indicating a concentration of short liquidation levels. Such clusters often act as magnets, drawing the price upward to trigger liquidations before a potential reaction.
At the same time, a developing liquidity concentration below the market reflects the accumulation of long positions. This suggests that traders are increasingly positioning for upside continuation, building long exposure near the consolidation zone.
The interaction between these liquidity pools increases the likelihood of a volatility expansion. A breakout to the upside could trigger short liquidations above the price, accelerating the move. Conversely, a downside sweep could target the long liquidity cluster before a potential rebound.
Overall, Ethereum is in a compression phase. The daily chart reflects equilibrium within a broader downtrend, the 4-hour chart shows a triangle nearing resolution, and liquidity positioning suggests that a decisive breakout move is approaching.

SECRET PARTNERSHIP BONUS for CryptoPotato readers: Use this link to register and unlock $1,500 in exclusive BingX Exchange rewards (limited time offer).
Disclaimer: Information found on CryptoPotato is those of writers quoted. It does not represent the opinions of CryptoPotato on whether to buy, sell, or hold any investments. You are advised to conduct your own research before making any investment decisions. Use provided information at your own risk. See Disclaimer for more information.
About two-thirds of crypto incidents investigated by blockchain analytics company AMLBot in 2025 were driven by social engineering rather than technical exploits, according to a report based on the company’s internal casework.
AMLBot said 65% of the incidents it reviewed last year involved access and response failures, such as compromised devices, weak verification and delayed detection, instead of vulnerabilities in blockchains or smart contracts.
The company said its analysis drew on about 2,500 internal investigations and should not be read as an industry-wide measure of crypto crime, according to a Wednesday report shared with Cointelegraph.
Primary attack vectors included device compromises via chat scams, impersonation scams, and other investment and phishing scams involving social manipulation.
Crypto phishing attacks are social engineering schemes that don’t require hacking code. Instead, attackers share fraudulent links to steal victims’ sensitive information, such as the private keys to crypto wallets.
The findings suggest that security improvements at the protocol level may not be enough to protect users if scammers can bypass safeguards by targeting people directly.

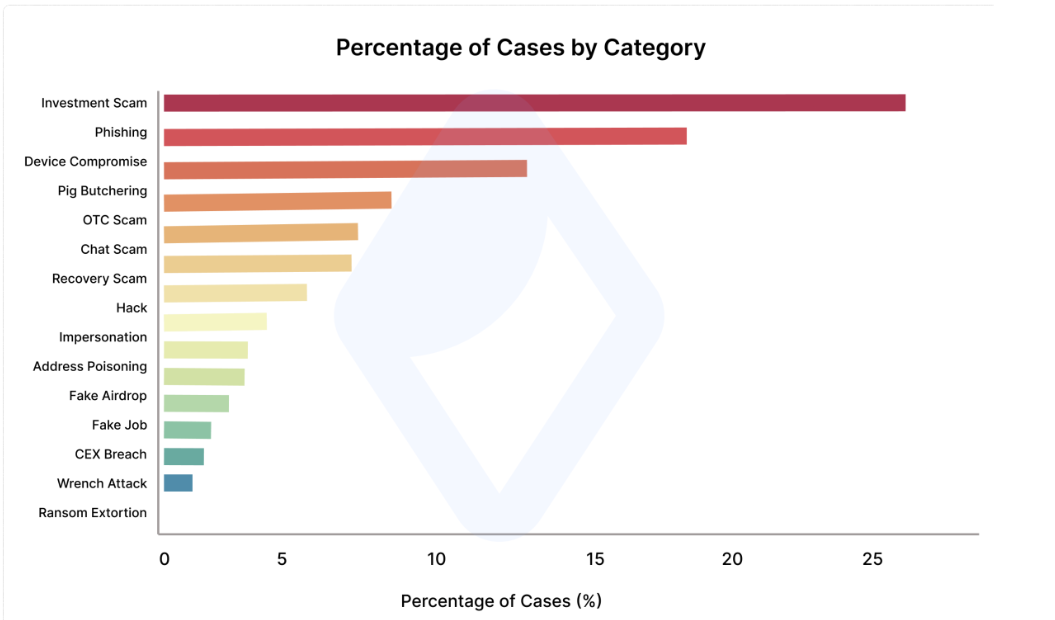
Investment scams and phishing lead by case count
Investment scams accounted for the largest share of cases (25%), followed by phishing attacks (18%) and device compromises (13%), as the most damaging categories in terms of case frequency.
Related: 22 Bitcoin worth $1.5M vanish from Seoul police custody
Pig-butchering scams accounted for 8%, over-the-counter (OTC) fraud for 8%, and chat-based impersonation represented 7%, collectively making up the second tier of the most frequent attacks.

Impersonation linked to $9 million in recent losses
AMLBot traced at least $9 million in stolen digital assets to impersonation-related attacks over the past three months.
Impersonation is the most damaging attack vector in terms of social engineering scams, Slava Demchuk, CEO of AMLBot, told Cointelegraph. “Attackers continue to exploit and trick victims with a ruthless game of charades, posing as trusted entities,” he said. “Sometimes they’re exchange support teams, investment partners, project managers or reps.”
Demchuk urged users not to share private keys or recovery phrases and to be wary of urgent requests involving fund transfers or wallet access, which he said are common entry points for social engineering scams.
Related: Binance confirms employee targeted as three arrested in France break-in
To protect against impersonation attacks, Demchuk urged crypto investors not to share their private keys and recovery phrases.
He also advised investors to ignore “urgent requests involving fund transfers of wallet access,” which are usually the first point of contact for social engineering scams.
CertiK reports January spike in crypto losses
Crypto scams saw an uptick in January, when scammers stole $370 million, the highest monthly figure in 11 months, according to crypto security company CertiK.

$311 million of the total value was attributed to phishing scams, with a particularly damaging social engineering scam costing one victim around $284 million.
Magazine: Meet the onchain crypto detectives fighting crime better than the cops

A pricing error that lasted only minutes has left DeFi lender Moonwell with nearly $1.8 million in bad debt after a software glitch caused the value of Coinbase Wrapped ETH (cbETH) to drop to $1, instead of roughly $2,200, on the platform.
The technical glitch happened because a system update caused the platform to value cbETH based only on its relationship to ETH (about 1.12), forgetting to factor in the actual USD price of ether.
As a result, the protocol interpreted cbETH as being worth around $1.12, per an incident summary.
The issue began when a governance proposal enabled new Chainlink oracle configurations across Moonwell markets on Base and Optimism networks. An oracle is a tool that fetches real-time data before it is added to a blockchain.
In lending protocols such as Moonwell, users deposit assets like cbETH as collateral and borrow other tokens against them. If collateral falls below required thresholds, positions are automatically liquidated by bots that repay debt and seize collateral at a discount.
Once cbETH appeared to collapse from over $2,000 to just above $1, liquidation bots moved quickly. Because the protocol believed the token was nearly worthless, liquidators were able to repay roughly $1 of debt to seize one cbETH.
Risk manager Anthias Labs said 1,096.317 cbETH ($2.44 million) was seized, wiping out borrower collateral while leaving the protocol with bad debt across several markets.
The distorted pricing also allowed a smaller group of users to deposit minimal collateral and borrow cbETH at the artificially low valuation, further increasing losses.
Moonwell reduced supply and borrow caps within minutes to contain damage. However, correcting the oracle required a governance vote and a five day timelock, preventing an immediate fix.
The episode is the latest reminder that price oracles are foundational infrastructure and a key point of failure for DeFi applications. When they misfire, the smart contracts do exactly what they are programmed to do, but the balance sheet absorbs the consequences.
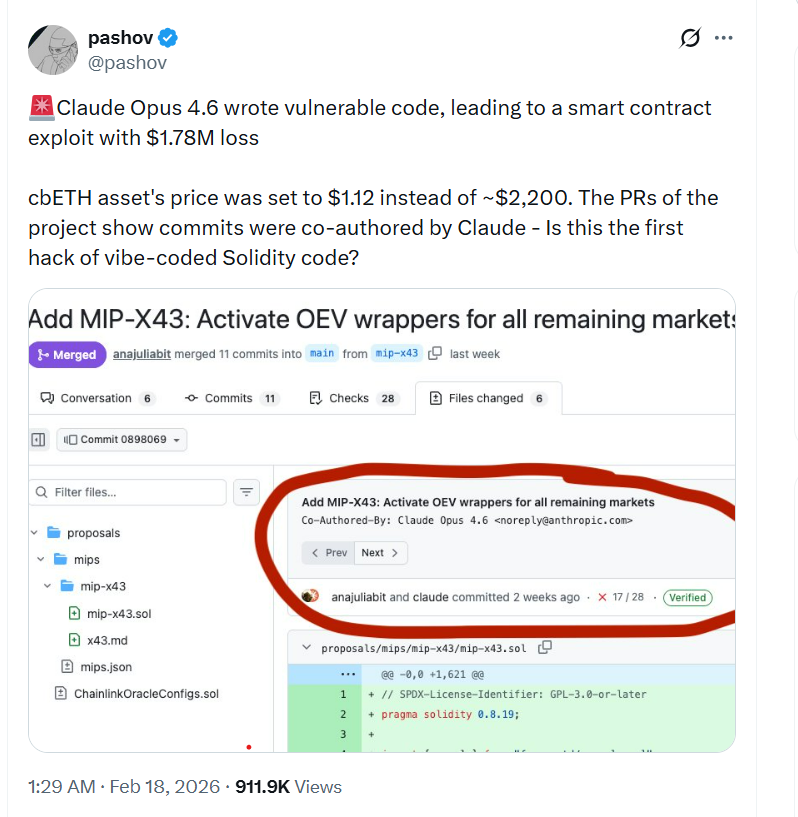
Meanwhile, security auditor Krum Pashov noted that GitHub commits tied to the proposal were co-authored by Claude Opus 4.6, an AI coding assistant, prompting debate over whether automated “vibe coding” contributed to the faulty oracle logic.
🚨Claude Opus 4.6 wrote vulnerable code, leading to a smart contract exploit with $1.78M loss
cbETH asset’s price was set to $1.12 instead of ~$2,200. The PRs of the project show commits were co-authored by Claude – Is this the first hack of vibe-coded Solidity code? pic.twitter.com/4p78ZZvd67
— pashov (@pashov) February 17, 2026
Moonwell, a decentralized finance (DeFi) lending protocol deployed on Base and Optimism, was exploited for about $1.78 million after a pricing oracle for Coinbase Wrapped Staked ETH (cbETH) returned a value of about $1.12 instead of $2,200, creating a mispricing that attackers were able to use for profit.
Moonwell said in an incident post-mortem that a governance proposal executed on Sunday misconfigured the cbETH oracle by using the cbETH/ETH exchange rate alone, causing the system to report cbETH at about $1.12. The protocol said liquidation bots and opportunistic borrowers exploited the mispricing, leaving roughly $1.78 million in bad debt.
The pull requests for the affected contracts show multiple commits co-authored by Anthropic’s Claude Opus 4.6, prompting security auditor Pashov to publicly flag the incident as an example of artificial intelligence-written or AI-assisted Solidity backfiring.
Speaking to Cointelegraph about the incident, he said that he had linked the case to Claude because there were multiple commits in the pull requests that were co-authored by Claude, meaning that “the developer was using Claude to write the code, and this has led to the vulnerability.”
Pashov cautioned, however, against treating the flaw as uniquely AI-driven. He described the oracle issue as the kind of mistake “even a senior Solidity developer could have made,” arguing that the real problem was a lack of sufficiently rigorous checks and end-to-end validation.

Initially, he said that he believed there had been no testing or audit at all, but later acknowledged that the team said it had unit and integration tests in a separate pull request and had commissioned an audit from Halborn.
In his view, the mispricing “could have been caught with an integration test, a proper one, integrating with the blockchain,” but he declined to criticise other security firms directly.
Related: How South Korea is using AI to detect crypto market manipulation
Small loss, big governance questions
The dollar amount of the exploit is small compared to some of DeFi’s largest incidents, such as the Ronin bridge exploit in March 2022, where attackers stole more than $600 million, or other nine-figure bridge and lending protocol hacks.
What makes Moonwell notable is the mix of AI co-authorship, a basic-seeming price configuration failure on a major asset, and existing audits and tests that failed to catch it.
Pashov said his own company would not fundamentally change its process, but if code appeared “vibe coded,” his team would “have a bit more wide open eyes” and expect a higher density of low-hanging issues, even though this particular oracle bug “was not that easy” to spot.
“Vibe coding” vs disciplined AI use
Fraser Edwards, co-founder and CEO of cheqd, a decentralized identity infrastructure provider, told Cointelegraph that the debate around vibe coding masks “two very different interpretations” of how AI is used.
Related: How AI crypto trading will make and break human roles
On one side, he said, are non-technical founders prompting AI to generate code they cannot independently review; on the other, experienced developers using AI to accelerate refactors, pattern exploration and testing inside a mature engineering process.
AI-assisted development “can be valuable, particularly at the MVP [minimal viable product] stage,” he noted, but “should not be treated as a shortcut to production-ready infrastructure,” especially in capital-intensive systems like DeFi.
Edwards argued that all AI-generated smart contract code should be treated as untrusted input, subject to strict version control, clear code ownership, multi-person peer review and advanced testing, especially around high-risk areas such as access controls, oracle and pricing logic, and upgrade mechanisms.
“Ultimately, responsible AI integration comes down to governance and discipline,” he said, with clear review gates, separation between code generation and validation, and an assumption that any contract deployed in an adversarial environment may contain latent risk.
Magazine: South Korea gets rich from crypto… North Korea gets weapons
Crypto World
American crypto investors are scared, confused about this year’s new IRS transaction reporting

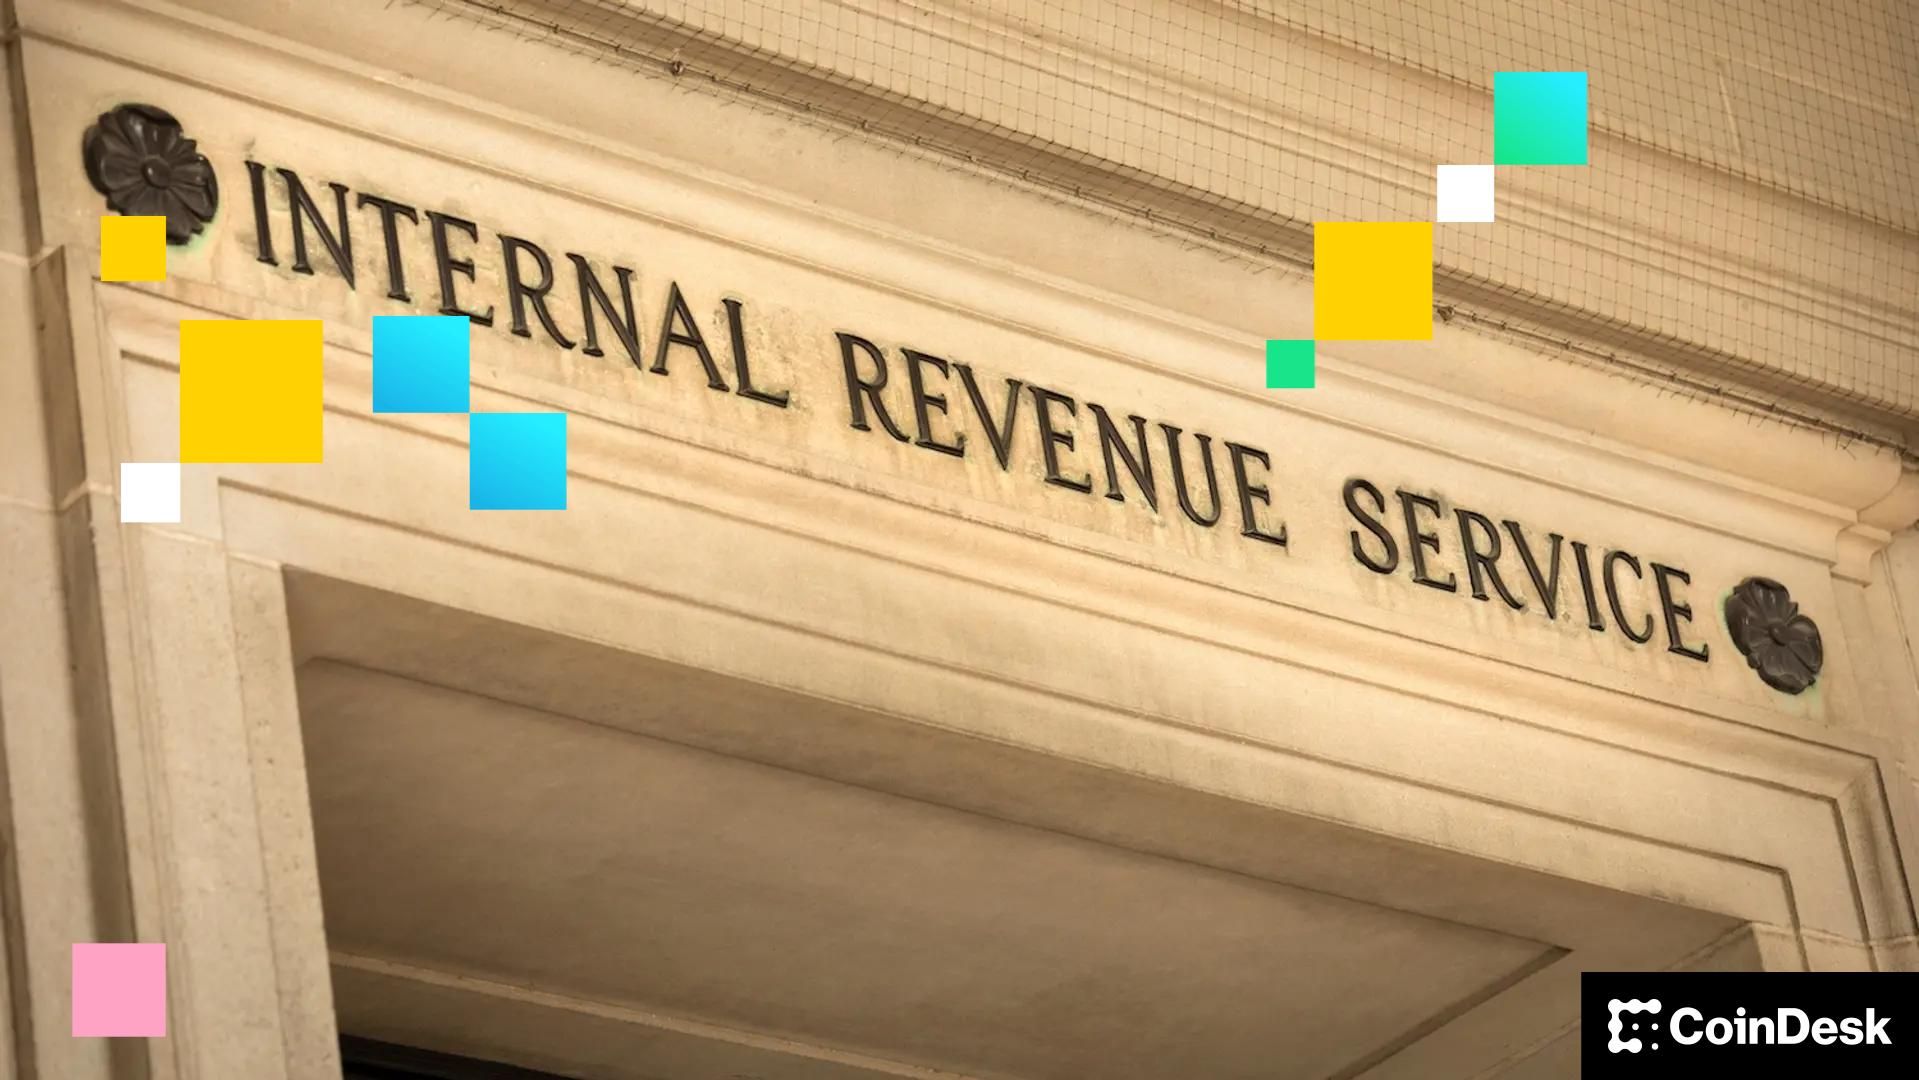
A recent poll of 1,000 American investors in digital assets found that over half are scared they’ll face an IRS tax penalty this year as new transparency rules governing crypto exchanges take effect.
The data collected at the end of January by crypto tax platform Awaken Tax canvassed U.S. holders’ concerns about a radical shift from self-disclosure to automatic reporting of transactions.
This has been enacted through the introduction of the “Digital Asset Proceeds From Broker Transactions,” or Form 1099-DA, which tens of millions of Americans will be made aware of over the next month or so.
The new rules are designed to clamp down on crypto tax evasion and compel brokers, such as crypto exchange Coinbase (COIN), to report all sales and exchanges of digital assets that took place during 2025 to the tax agency.
The aim is to give tax authorities a clear view of investor gains and losses by opening up customer data inside exchanges for the first time, allowing the IRS to compare what crypto brokers report with what taxpayers file.
While the goal is to remove any margin of error, the rules are a “blunt instrument,” created by legislators who know nothing about crypto, according to Awaken Tax founder Andrew Duca.
“It means crypto is being treated like stocks, but it doesn’t behave in that way. Real crypto users will move assets between multiple wallets and interact with decentralized finance (DeFi) protocols, using pretty complex trading strategies,” Duca said.
Companies like Coinbase can provide information only on the proceeds of sales of crypto and are unable to report tax basis for any given digital asset — typically the purchase price plus acquisition costs — which can then be used to calculate capital gains or losses upon its sale.
“Coinbase actually cannot send the right information, because you can imagine if someone has bitcoin in a cold storage wallet ledger, they send it to Coinbase to sell. Coinbase doesn’t know your acquisition price, what you bought it for. So Coinbase is sending incorrect forms to the IRS. The 1099-DA form reports proceeds, but it doesn’t report tax basis,” Duca said.
Coinbase is well aware of the confusion this will cause. The onus falls on the holder of crypto to “patch” what’s missing in terms of their crypto acquisition costs and actual tax basis via the IRS’s updated Form 8949, Duca said.
Duca acknowledges that crypto tax compliance is extremely low: Under 20% of crypto holders report what they ought to, he said.
“It’s really not been thought out well and is kind of horrible for crypto users. But it’s what they could do the quickest and the easiest,” Duca said. “They just added this super blunt instrument to try to get that 20% up to 80% in a year.”

The hyper casual gaming market moves faster than almost any other segment in the gaming industry. Trends emerge overnight, player attention shifts quickly, and the games that capture momentum early often dominate downloads and ad revenue. In this environment, speed is not just an advantage, it is a business strategy.
A Flappy Bird–style hyper casual game, built around a simple yet addictive core loop, remains one of the most powerful formats for rapid market entry. Its simplicity allows faster development, faster testing, and faster monetization validation.
However, here is the reality many enterprises tend to overlook. Building a hyper casual game in 2 weeks is not about rushing development. It is all about having the right development team, pipeline, and production discipline.
When executed correctly by a trusted hyper casual game development company, a 2-week MVP can help enterprises test concepts, validate monetization models, and enter the market before competitors react.
Why Flappy Bird–Style Games Are Ideal for Rapid Development
Flappy Bird–style games are often misunderstood as “easy to build.” In reality, they are simple in structure but demanding in execution. Their minimalism is precisely what enables speed but also what exposes poor quality quickly. When a game has only one mechanic, there is nowhere to hide flaws. These games succeed because they:
- Deliver instant engagement
- Require zero onboarding time
- Encourage repeated play
- Generate strong ad impressions per session
- Create addictive retry loops
However, for enterprises, the appeal is strategic rather than just creative. A Flappy Bird–style game allows businesses to:
- Validate a concept quickly
- Test a theme or brand engagement
- Trial monetization models
- Enter a new market with minimal delay
- Gather behavioral data rapidly
The short session design also aligns perfectly with ad-driven monetization, making them commercially viable testing tools. However, achieving this requires expert tuning, such as physics, input response, and difficulty curves must feel precise. Otherwise, players churn within minutes. This is exactly the reason why experienced hyper casual game developers matter.
What a Realistic 2-Week Development Timeline Looks Like
A credible 2-week timeline is structured, not chaotic. It follows a clear production plan.
Days 1–2: Concept Finalization & Scope Lock
The team defines:
- Core gameplay loop
- Visual direction
- Monetization approach
- Target platform
- Success KPIs
This stage prevents scope creep and keeps production focused. Enterprises that skip proper scoping often face delays later.
Days 3–6: Core Development
Developers build:
- Player controls
- Physics tuning
- Game loop logic
- UI framework
- Base art assets
At this stage, the goal is playability, not perfection. A professional hyper casual game development company uses reusable frameworks to accelerate this phase.
Days 7–10: Polish & Monetization Integration
This includes:
- Ad network integration
- Rewarded ad logic
- Basic analytics setup
- UI polish
- Sound and feedback tuning
Monetization is integrated early to validate revenue potential.
Days 11–14: Testing & Soft Launch Prep
The focus now shifts to:
- Bug fixes
- Performance optimization
- Device compatibility
- Soft launch build preparation
Testing ensures the game feels stable and smooth across devices.
Why the “Right Team” Matters More Than the Timeline
A 2-week build is only realistic when the hyper casual game development team has:
- Proper hyper casual game development experience & expertise
- Proven pipelines
- Reusable code frameworks
- Structured production workflows
- Clear communication loops
Without these, a 2-week target becomes unrealistic. The right team turns speed into a repeatable process rather than a risky gamble.
Planning to Build a Hyper Casual Game Like Flappy Bird in Quick Time?
Business Benefits of a 2-Week Hyper Casual MVP
A 2-week MVP is not about saving time alone. It is about creating a structured experimentation cycle. For enterprises, this becomes a business strategy.
1. Fast Market Validation
A rapid MVP allows enterprises to test hypotheses instead of relying on assumptions. Rather than debating whether an idea will work, companies can:
- Launch quickly
- Measure retention
- Track session lengths
- Analyze user behavior
- Evaluate monetization performance
This plays a significant role in replacing guesswork with real data. For decision-makers, this data-driven approach reduces strategic uncertainty and supports smarter investment decisions.
2. Lower Initial Investment Risk
Traditional game development often demands significant upfront budgets. Hyper casual MVPs allow staged investment. Enterprises can:
- Test multiple ideas simultaneously
- Scale only the winners
- Drop underperforming concepts early
- Optimize budget allocation
This portfolio-style strategy is widely used by successful publishers. Instead of betting big on one idea, enterprises run controlled experiments.
3. Competitive Speed Advantage
In hyper casual game development, timing influences success heavily. Launching early allows a company to:
- Capture user attention before trends peak
- Establish early app store presence
- Gain organic installs
- Collect data before competitors enter
Even a few weeks can determine whether a concept feels fresh or saturated. Speed becomes a competitive moat.
4. Data-Driven Scaling Decisions
A soft-launched MVP produces valuable metrics such as:
- Day 1 and Day 7 retention
- Ad engagement rates
- CPI vs LTV performance
- Drop-off points
This data, in turn, plays a crucial role in informing:
- Whether to invest further
- Which features to expand
- How to refine monetization
- Which markets to target
Enterprises that scale based on data outperform those relying on intuition.
Common Factors That Delay Hyper Casual Game Development
Hyper casual game development projects often slow down due to avoidable issues.
1. Changing Scope Midway
Scope creep is the biggest enemy of rapid development. Adding some features all of a sudden, like:
- Extra levels
- Complex UI
- Narrative elements
- Multiplayer modes
Quickly breaks the 2-week timeline. Successful teams lock scope early and treat the MVP as a test, not a final product.
2. Overcomplicating Mechanics
Hyper casual games thrive on simplicity. When teams add:
- Multiple controls
- Advanced progression
- Layered systems
The game loses clarity, and development slows. Enterprises must respect the “one core loop” philosophy.
3. Ignoring Analytics Setup
Without analytics, an MVP loses its purpose. Analytics track:
- Retention
- User behavior
- Monetization efficiency
Skipping this step means launching blind. Enterprises should view analytics as essential, not optional.
4. Skipping Early Testing
Unpolished physics or laggy controls ruin user experience. Even some of the simplest games need:
- Device testing
- Performance checks
- Input responsiveness tuning
Quality issues harm retention immediately.
5. Lack of Structured Pipeline
Ad-hoc development wastes time. A structured pipeline, on the other hand, includes:
- Pre-defined frameworks
- Asset templates
- Clear milestones
- Reusable systems
Experienced teams rely on repeatable processes.
Why Enterprises Partner with a Hyper Casual Game Development Company
Building internally may seem attractive, but it often slows execution. A specialized hyper casual game development company provides:
1. Speed-Ready Pipelines
They use proven frameworks, reducing setup time. This, in turn, allows faster prototyping and iteration.
2. Monetization Expertise
The revenue model of hyper casual games depends on ads and a retention balance. Experts optimize:
- Ad frequency
- Placement strategy
- Rewarded formats
Poor monetization design hurts revenue.
3. Analytics Integration
Professionals set up tracking from day one. This ensures every launch produces usable insights.
4. Performance Optimization
Players in the hyper casual gaming model expect instant load and smooth play. Developers therefore optimize for:
- Low memory usage
- Smooth FPS
- Fast loading times
5. Rapid Iteration Capability
Experienced teams iterate weekly or even faster. This allows constant improvement post-launch.
Conclusion
In hyper casual gaming, ideas alone do not win. Execution speed does. A Flappy Bird–style hyper casual game built in 2 weeks can become a powerful validation tool, revenue channel, or user acquisition engine when developed correctly.
However, the real question is not whether it can be built quickly. The ideal question is whether it is built by an experienced hyper casual game development team that knows how to make speed work in your favor.
Antier, a top-rated hyper casual game development company, works with enterprises and studios to deliver hyper casual games quickly without compromising quality. The support from the team includes:
- End-to-end hyper casual development
- Monetization-ready builds
- Analytics integration
- Rapid MVP pipelines
- Post-launch optimization
The focus is not just launching fast; it is launching smart. Get in touch with us today to build your next hyper casual hit.
Frequently Asked Questions
01. Why are Flappy Bird-style games considered ideal for rapid development in the hyper casual gaming market?
Flappy Bird-style games are ideal for rapid development because their simple structure allows for quick concept validation, minimal onboarding time, and strong ad impressions, making them effective tools for testing and monetization.
02. What is the significance of having the right development team for building a hyper casual game in 2 weeks?
The right development team is crucial for building a hyper casual game in 2 weeks as it ensures proper execution, structured production discipline, and the ability to deliver a high-quality MVP that can validate concepts and monetization models effectively.
03. What does a realistic 2-week development timeline for a hyper casual game involve?
A realistic 2-week development timeline involves a structured plan that includes days for concept finalization, scope locking, defining the core gameplay loop, visual direction, and monetization approach, ensuring a focused and efficient development process.

World Liberty Financial price, or the WLFI price, surged nearly 20% over the past 24 hours, triggering optimism across holders. But three separate metrics now reveal hidden risks beneath the surface strength.
Distribution happening across whale cohorts and mid-term holders preparing exits create consolidation pressure that could derail the pattern entirely. Or, is the WLFI price action planning a plot twist here?
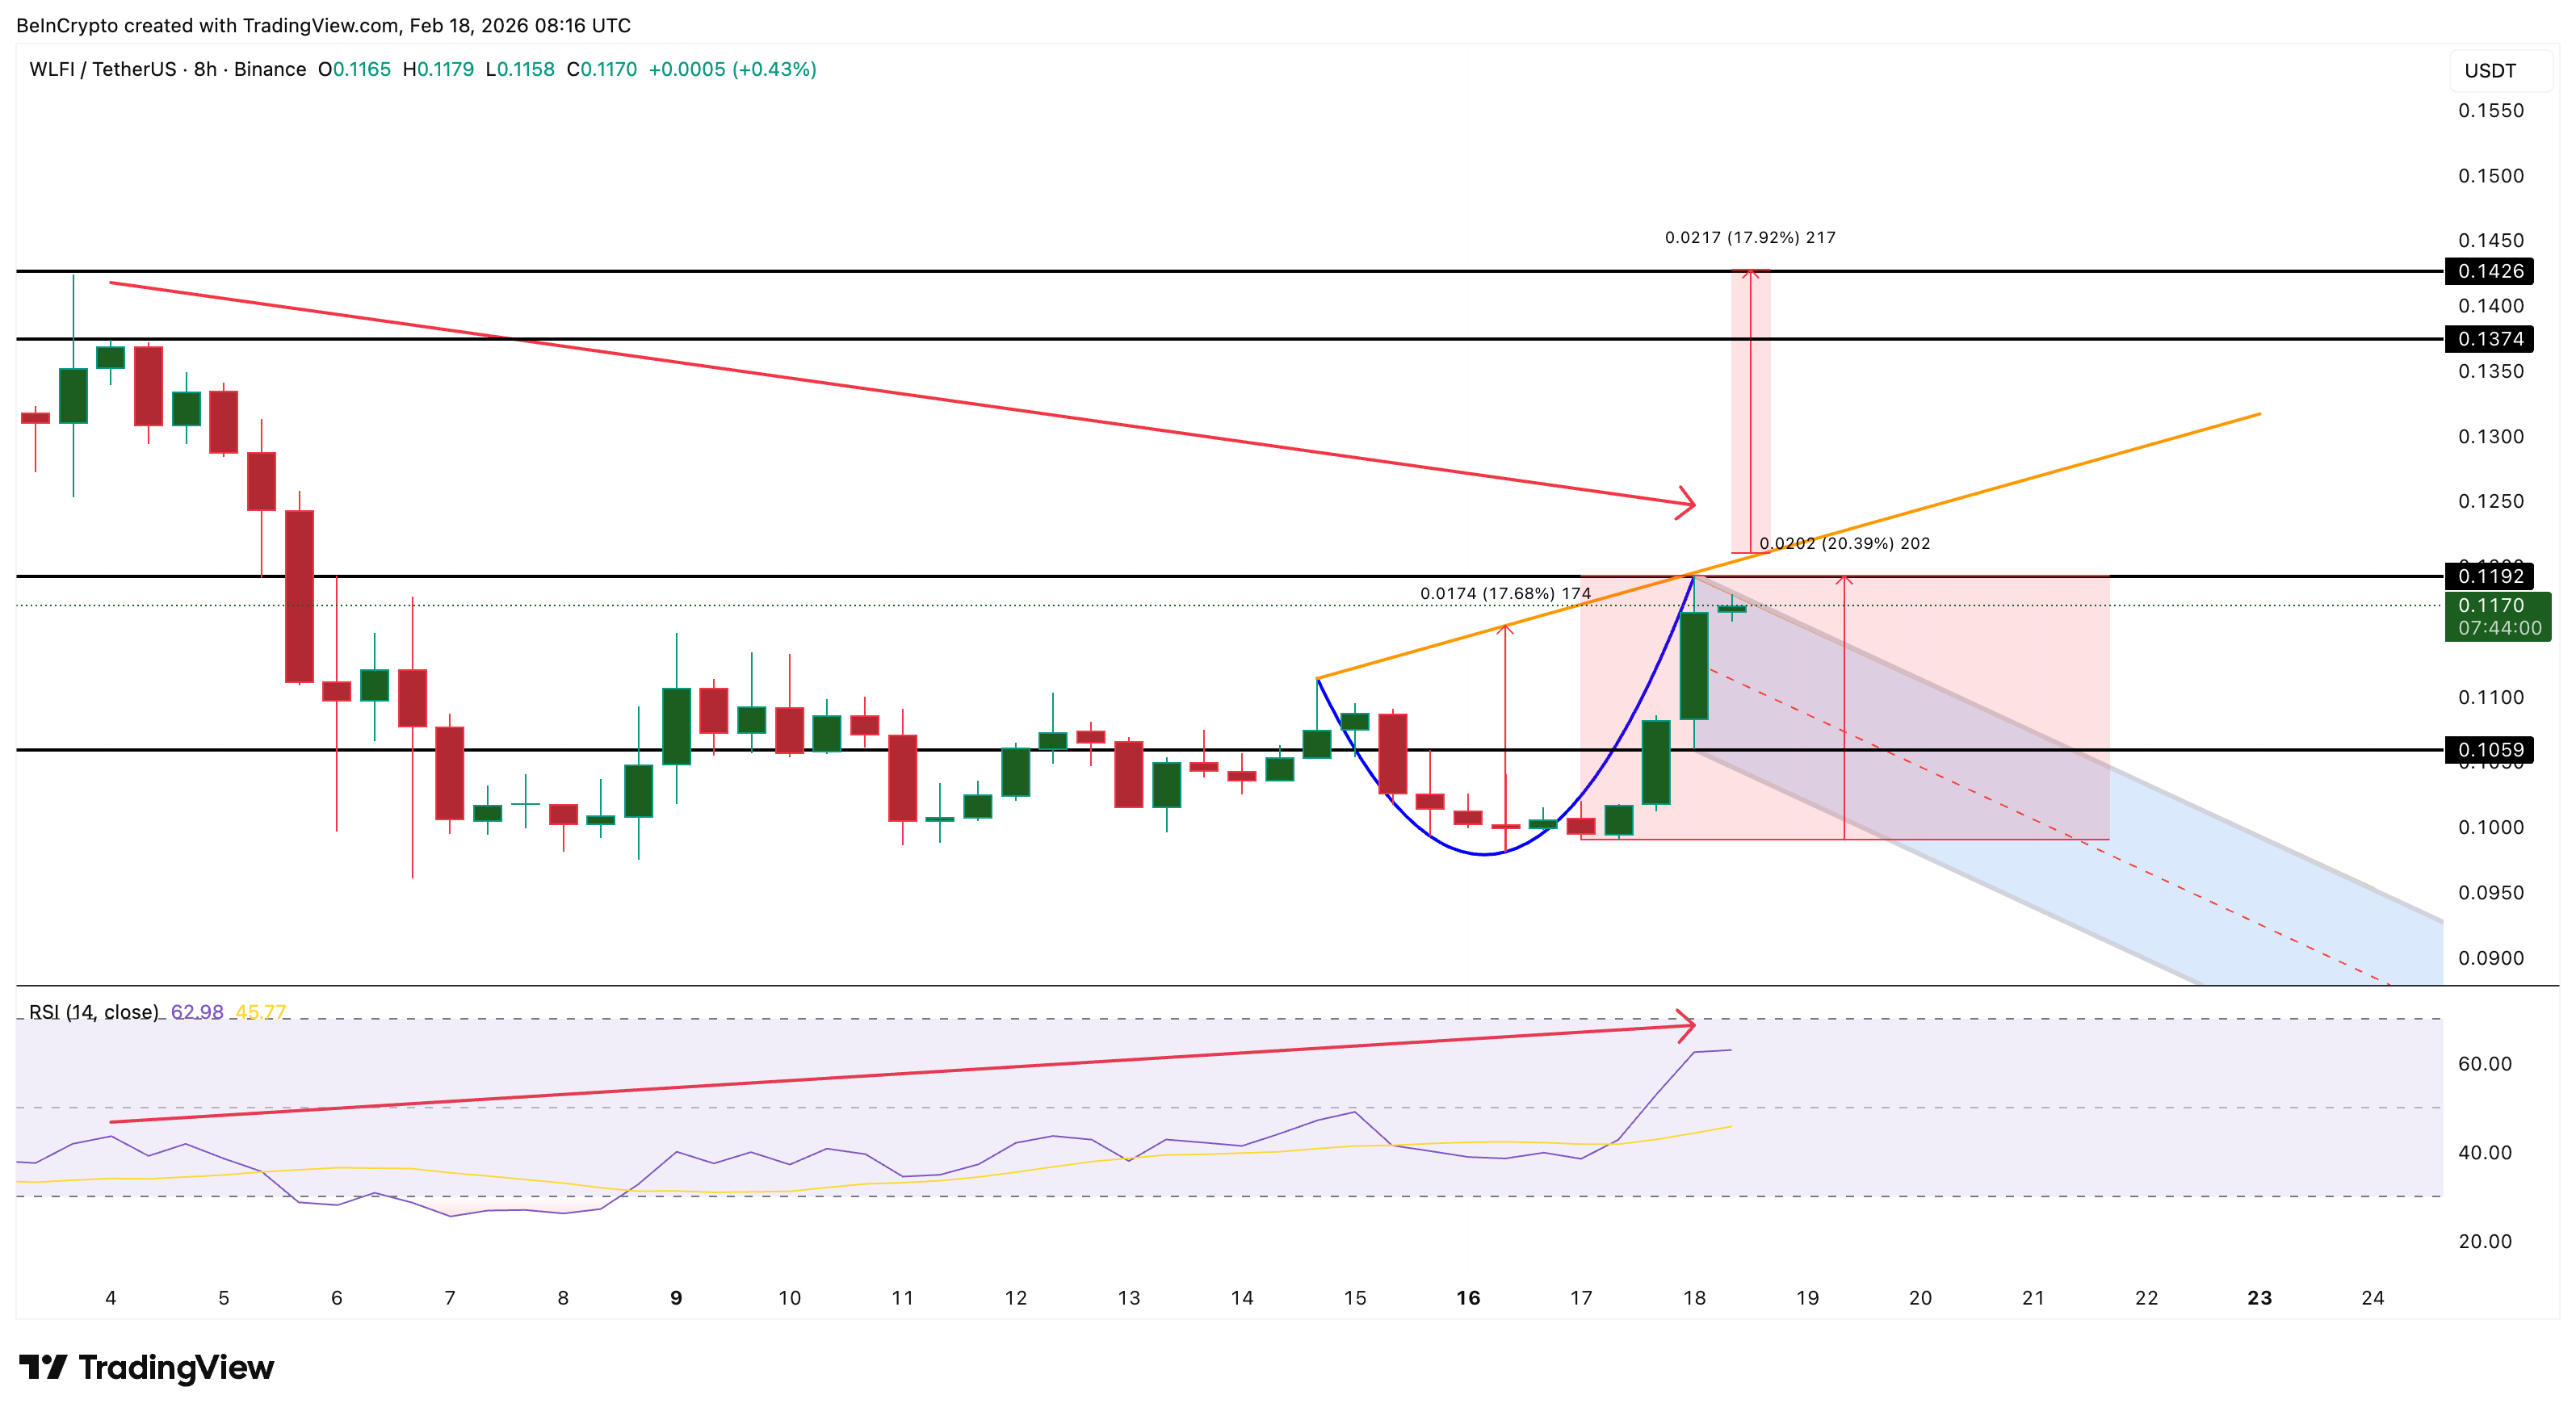
Cup Pattern Needs Controlled Consolidation Above $0.105
The 8-hour chart shows a rounded bottom structure resembling a cup. The cup itself has already completed, given the recent price recovery. Now WLFI needs to form the handle through controlled consolidation before attempting the next breakout.
Sponsored
Sponsored
The key detail is the upsloping neckline connecting the rim of the cup on both sides. The left rim formed at an earlier high while the right rim sits at a higher level. This upward slope indicates that buyers are willing to pay higher prices over time, creating structural strength. The neckline must be broken upward to complete the pattern and trigger the measured 17% move.
Between February 4 and February 18, a hidden bearish divergence formed on the 8-hour timeframe. WLFI price made a lower high after peaking at $0.119. During that same period, the Relative Strength Index made a higher high. RSI measures momentum strength by comparing the magnitude of recent gains to recent losses.
Want more token insights like this? Sign up for Editor Harsh Notariya’s Daily Crypto Newsletter here.
When price makes lower highs, but RSI makes higher highs, it signals that a pullback could be coming.
The divergence could actually be constructive for the pattern. Cup formations require a handle to complete properly. The handle forms through sideways or slight downward price movement that shakes out weak hands before the next explosive move.
The critical level is $0.105. As long as WLFI consolidates without breaking below this support, the pattern and breakout possibility remain intact. A measured move from the cup’s low to the neckline projects a breakout target of $0.142, representing approximately 17% additional upside from the possible breakout point.
Sponsored
Sponsored
Mega-Whales Sold 1.1 Billion Tokens as Long Positions Diverged
While new whale cohorts accumulated approximately 25 million WLFI tokens during the past 24 hours, the largest holders moved in the opposite direction.
Mega-whale addresses holding more than 1 billion tokens have been steadily reducing their positions since February 6. On February 17, during the price rally, they dropped holdings dramatically from 9.45 billion to 8.35 billion WLFI. That represents 1.1 billion tokens sold directly into the strength.
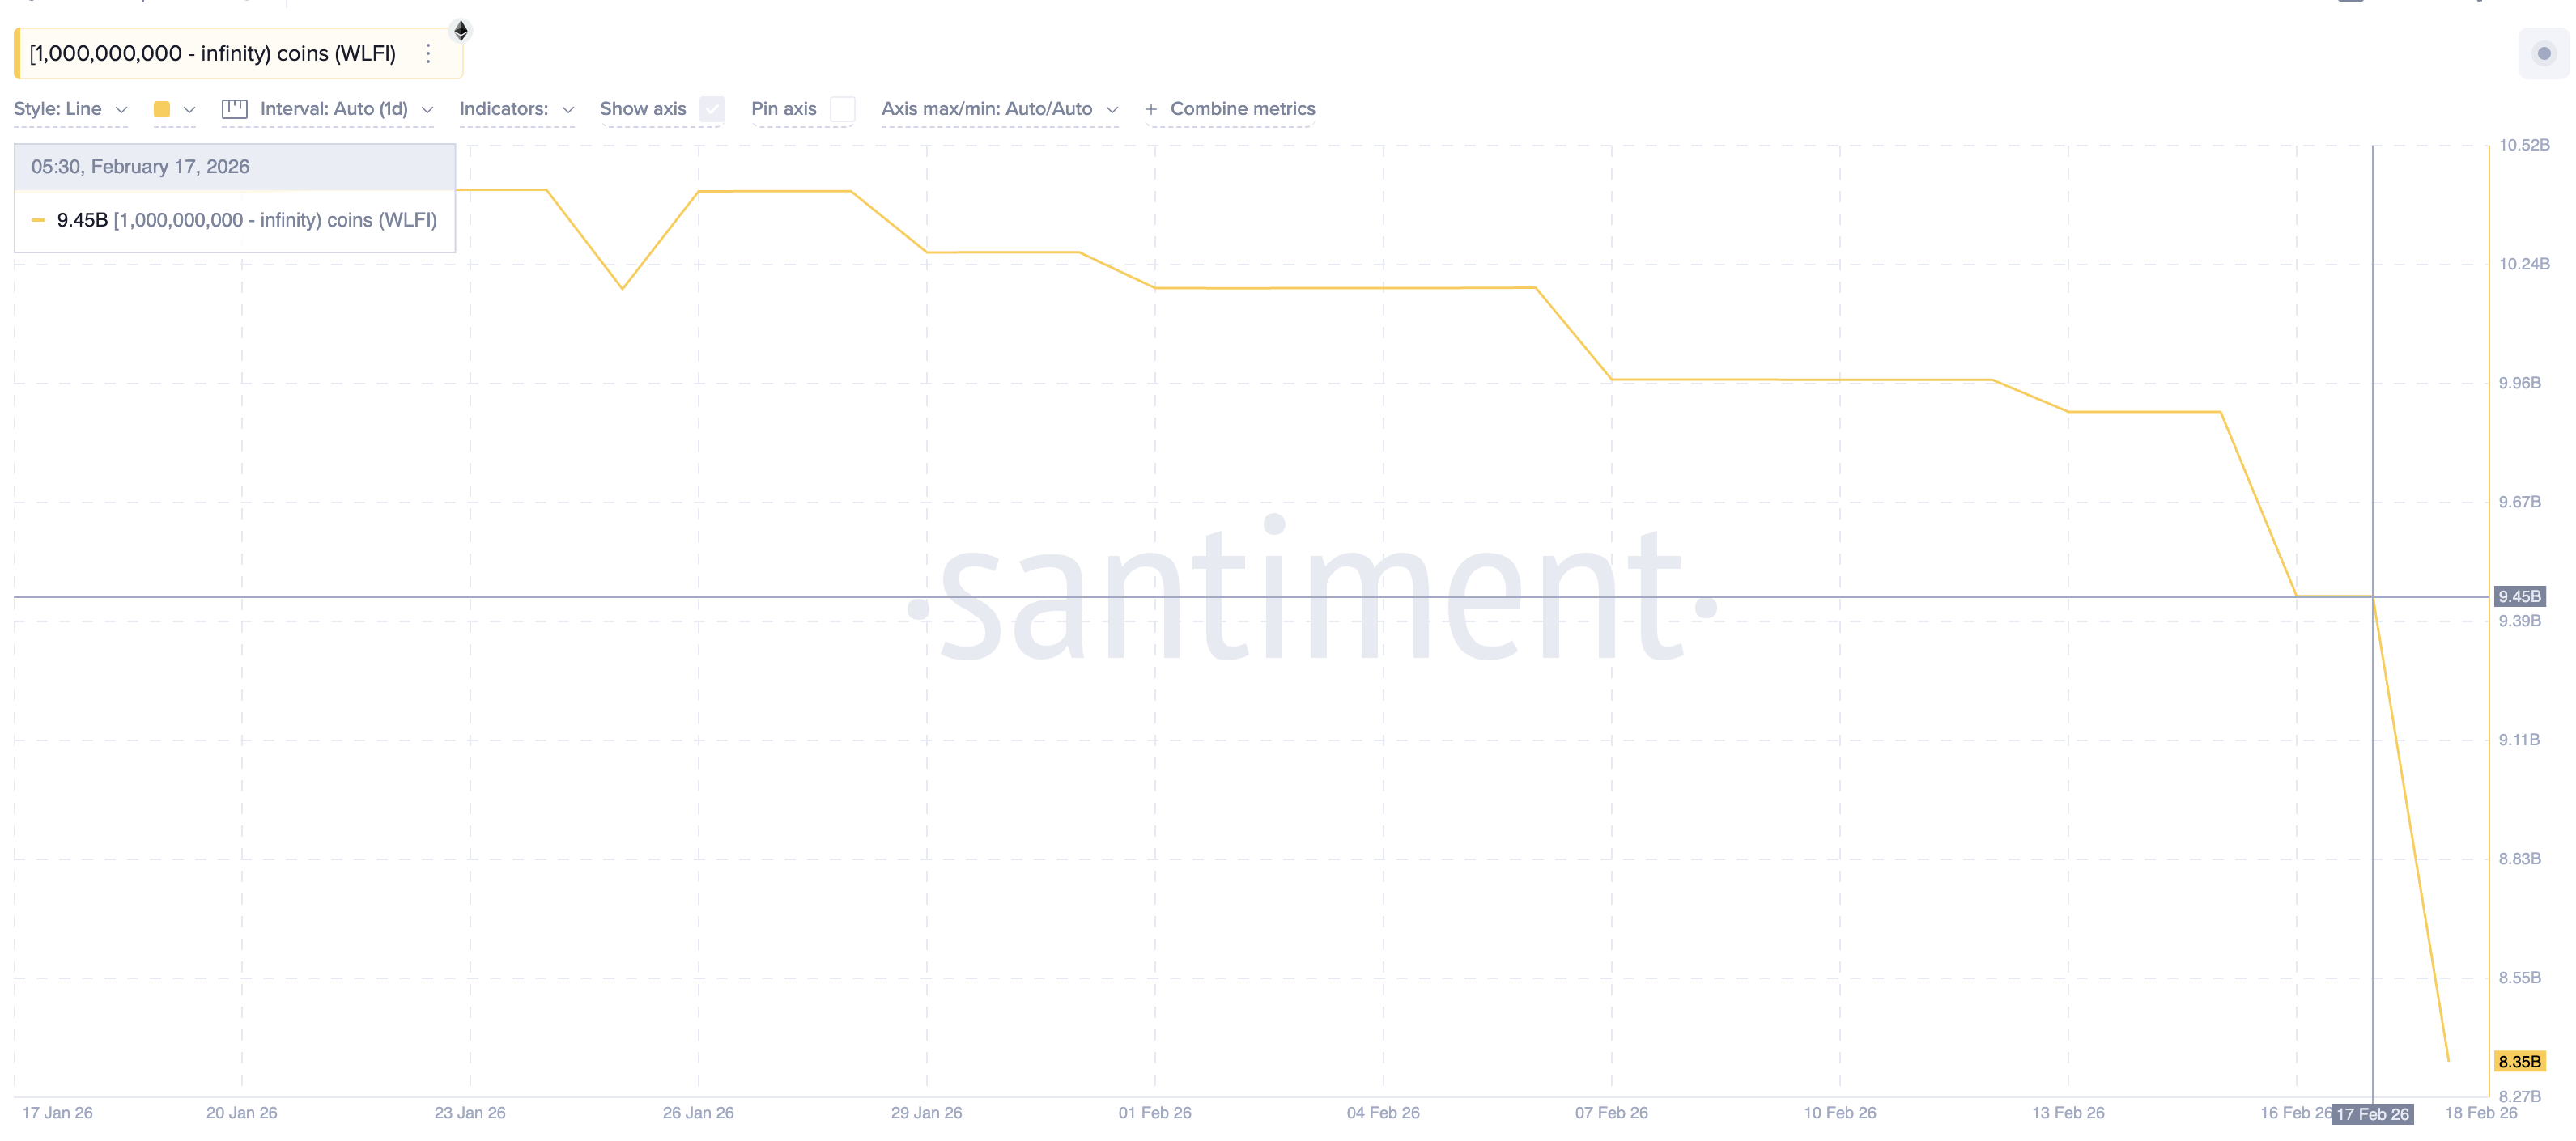
The price did not crash because smaller whales and leveraged long positions absorbed the selling.
But the distribution creates overhead pressure.
Data from Hyperliquid derivatives exchange shows diverging behavior across different WLFI trader cohorts over the past 24 hours. General whale addresses increased their long positions by 68%, showing continued optimism.
Sponsored
Sponsored
But the top 100 addresses (mega whales) by trading volume reduced long positions significantly.
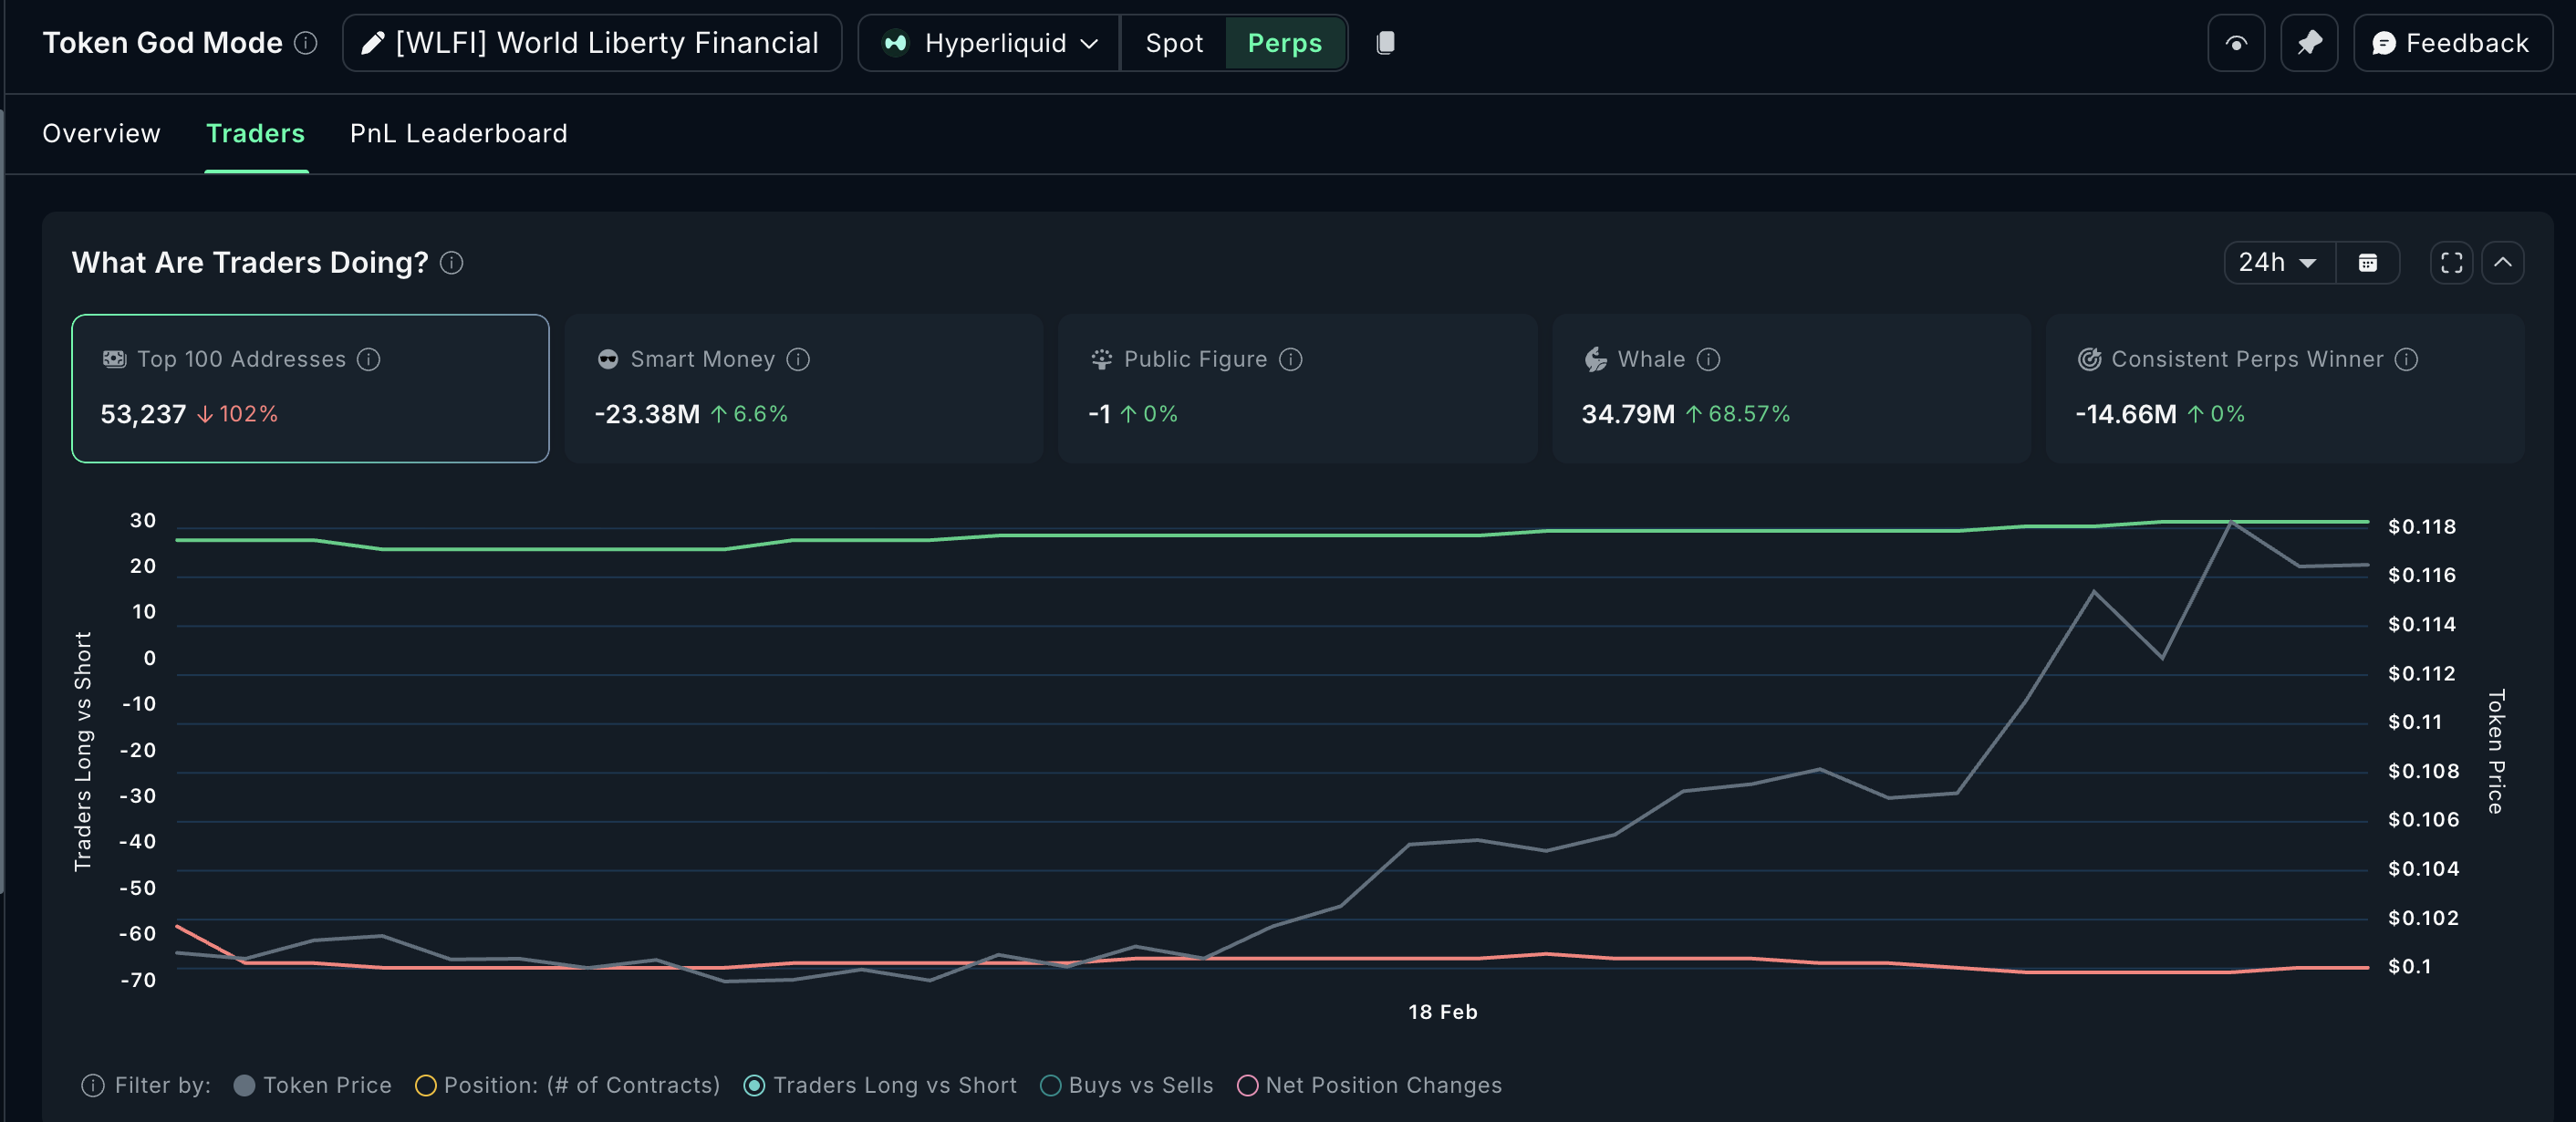
Smart Money, which tracks positioning by experienced traders, shows a net short position over the past 24 hours, hinting at caution.
This creates a dangerous setup where smaller participants are buying and adding leverage while the largest and most sophisticated players distribute and position defensively.
The rally relied on smaller whale buying and leverage rather than conviction from mega-whales. If consolidation turns into a long squeeze where leveraged longs get forced to sell, the pullback could accelerate beyond the healthy handle formation needed for pattern completion.
Sponsored
Sponsored
Mid-Term Holders Activate 500 Million Tokens for Exit, Could This Impact the WLFI Price?
The third warning comes from on-chain activity metrics. Spent Coins Age Band tracks coin movement from specific holder cohorts based on how long they held the tokens. The 90-day to 180-day age band represents mid-term holders who acquired WLFI between three and six months ago.
Before February 17, this cohort showed activity of approximately 949,000 tokens moving. Between February 17 and 18, that number exploded to over 500 million tokens.
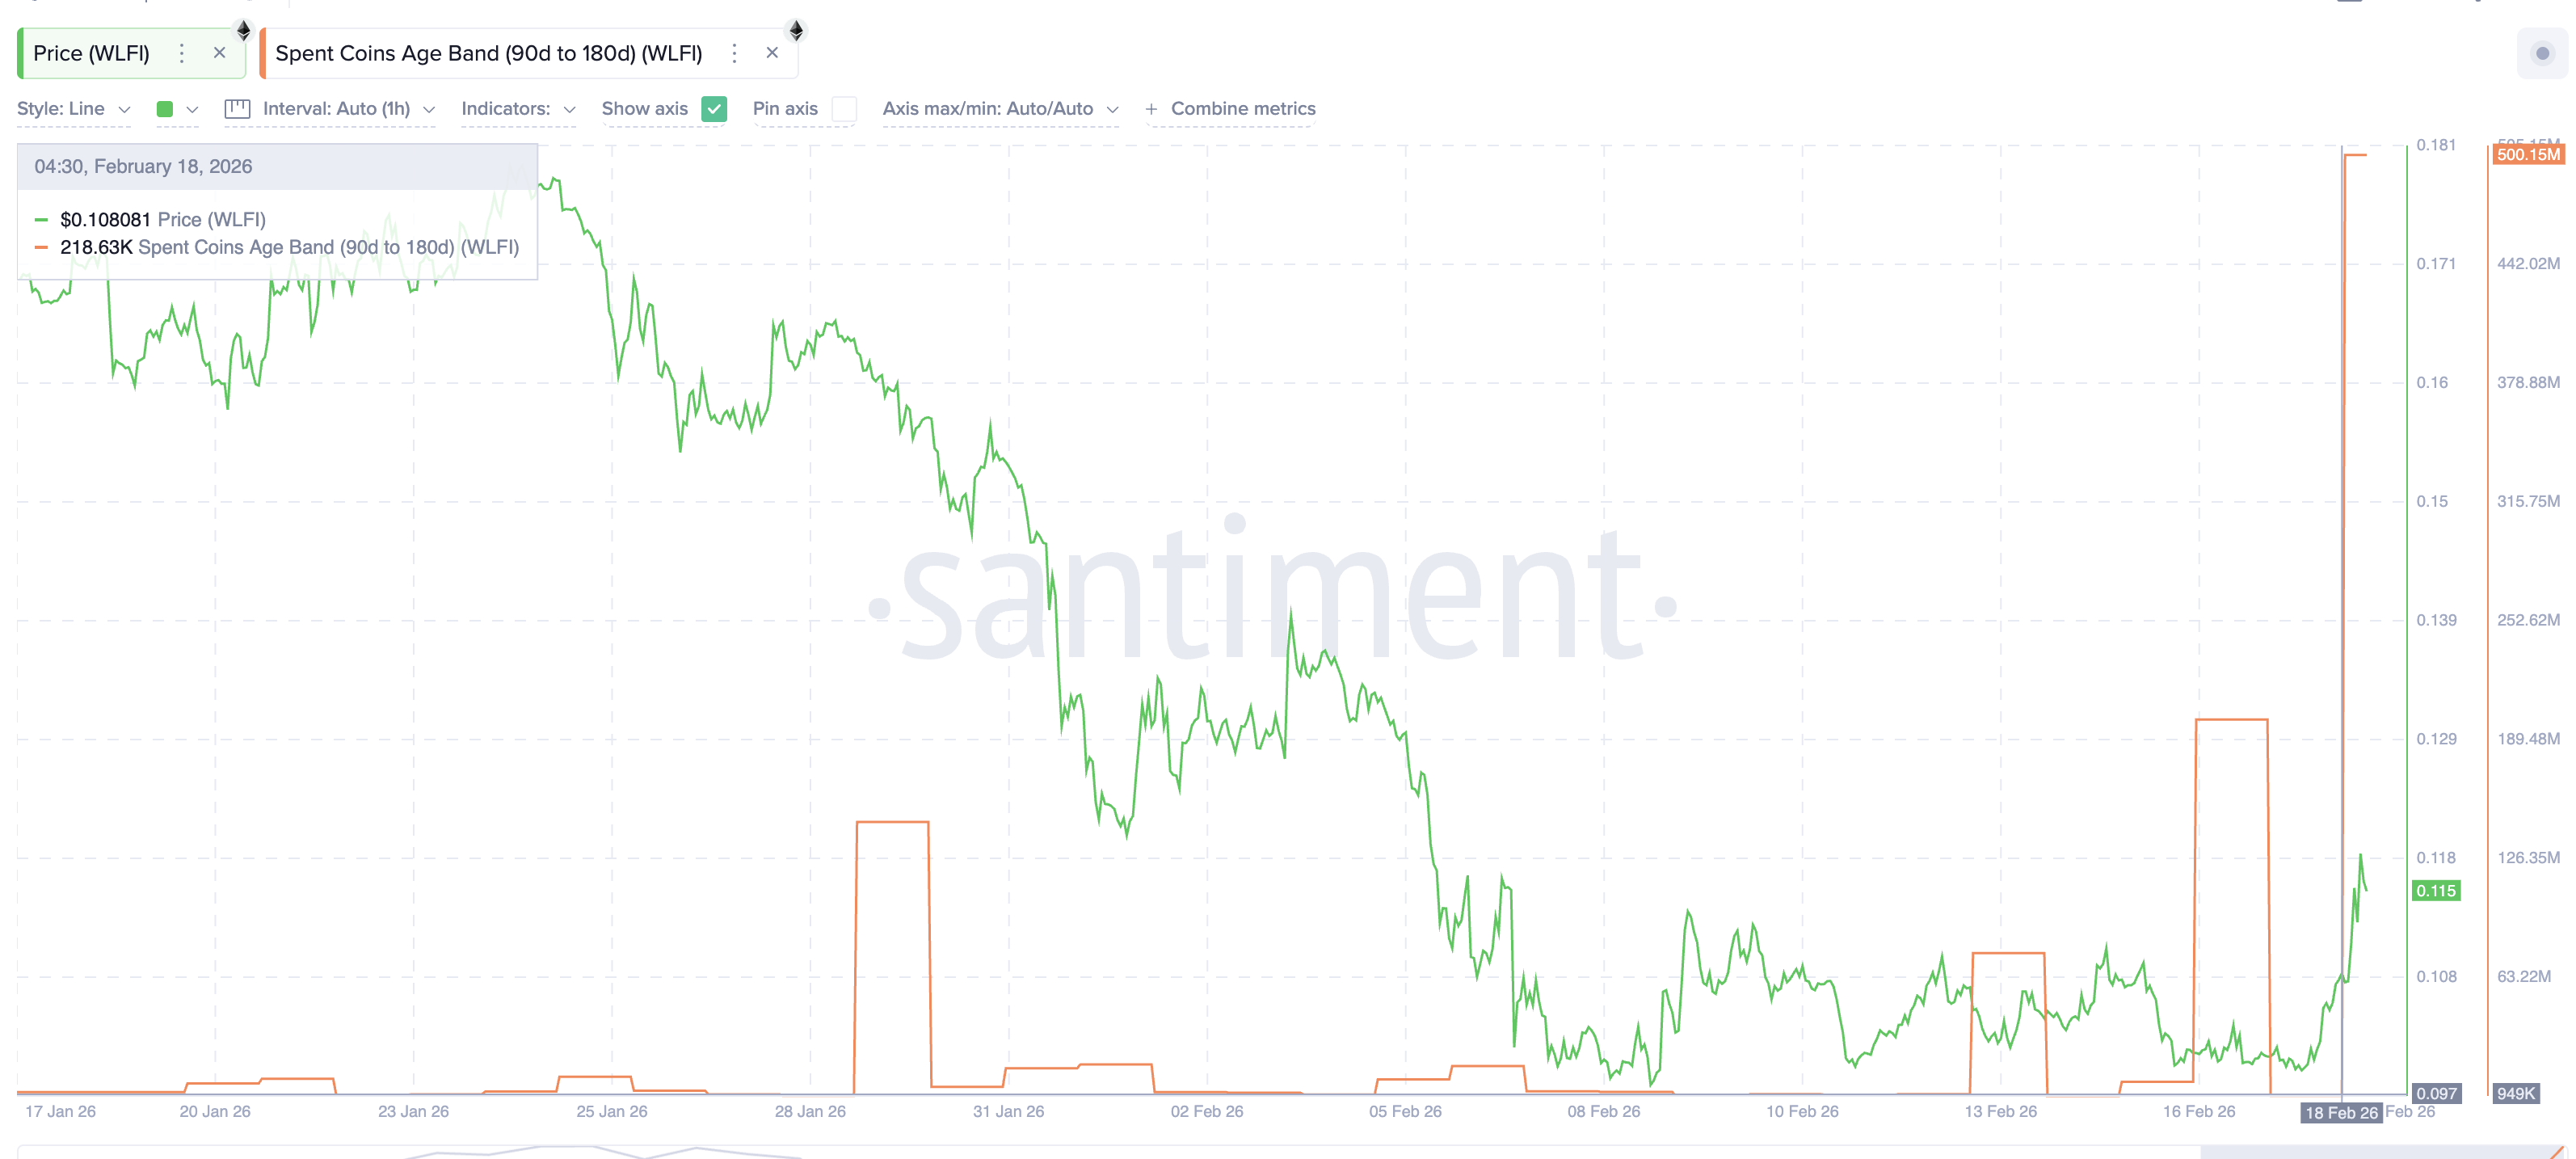
This represents a 500-times increase in coin activity from mid-term WLFI holders. When holders who sat through months of price action suddenly activate coins en masse, it typically means preparation for exit. They see the 20% rally as their opportunity to take profits after months of waiting. The 500 million tokens moving creates significant potential selling pressure on top of the 1.1 billion already sold by mega-whales and the cautious positioning by Smart Money.
All three risks point toward consolidation. The 8-hour chart RSI divergence predicts it. Mega-whales selling 1.1 billion confirms it. Mid-term holders activating 500 million validates it. The consolidation is healthy and necessary for handle formation if it stays controlled above $0.105 and respects the upsloping neckline. But the market remains weak broadly.
Fibonacci extension to the downside projects $0.090 or lower if the pattern breaks, invalidating the entire setup.
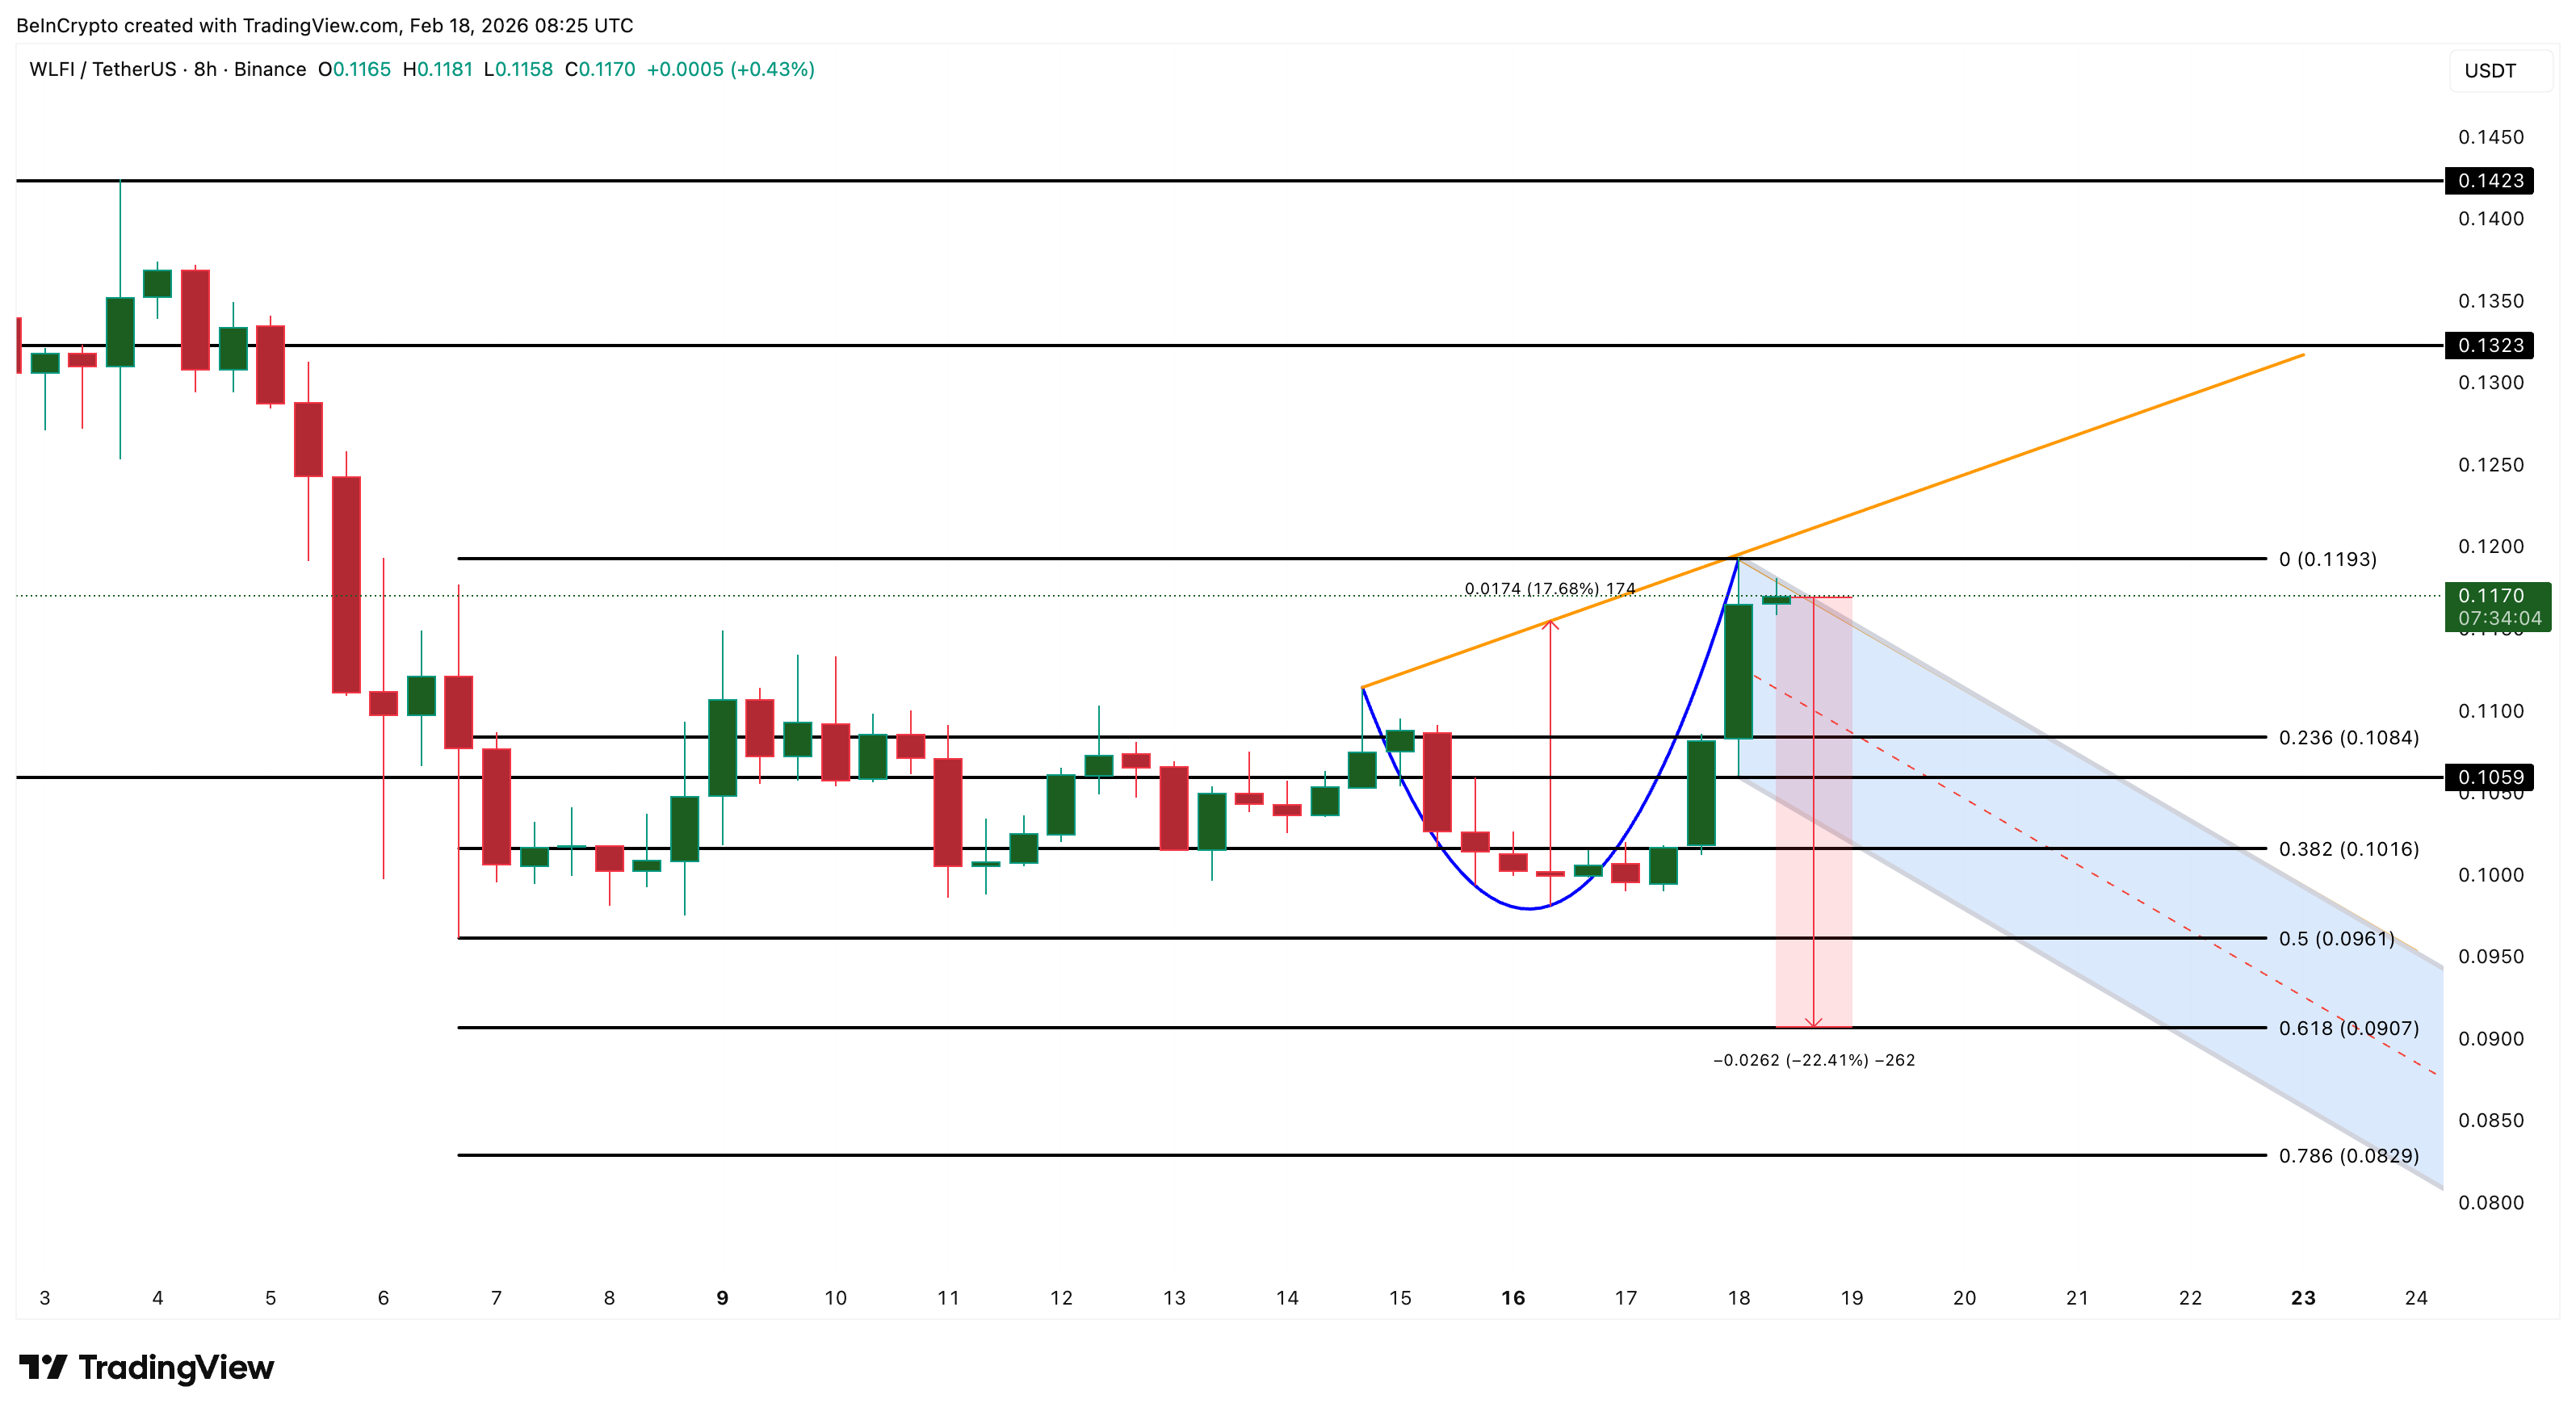
On the upside, breaking above $0.119 reactivates bullish momentum with first resistance at $0.132 before the main pattern target of $0.142. The $0.105 level decides everything. Controlled consolidation above it allows the cup to complete its handle. Breakdown below it turns the distribution into a cascade.


Cumulative spot selling pressure across altcoins, excluding Bitcoin and Ethereum, has reached a five-year extreme, according to data released by CryptoQuant, marking one of the most persistent distribution phases in recent market cycles.
Summary
- Cumulative altcoin buy-sell difference excluding BTC, ETH widened to about -$209b over 13 straight months, the most sell-dominant phase in 5 years.
- Indicator was near $0 in Jan 2025 before prolonged selling, signaling structural outflows, fading retail demand, and little visible institutional accumulation in altcoins.
- BTC trades well below its Oct 2025 ATH, while altcoin spot markets remain under pressure, with past cycle reversals only emerging after sustained net buying replaces directional sellin
The cumulative buy-sell difference for altcoins now stands at negative 209 billion, reflecting 13 consecutive months of net selling on centralized exchanges, the data showed.
In January 2025, cumulative buy and sell pressure across altcoins was roughly balanced, marking the last point where demand matched supply, according to the analysis. Since then, altcoins have recorded a cumulative negative 209 billion in net sell pressure over the following 13 months, with limited evidence of sustained buying activity.
Bitcoin currently trades well below its October 2025 all-time high. While Bitcoin has retraced from peak levels, altcoins have experienced stronger structural pressure, the data indicated. The absence of net positive inflows suggests retail participation has declined, with capital rotation toward major cryptocurrencies occurring earlier in the cycle, according to market observers. Institutional accumulation in altcoins remains limited, the data showed.
Bitcoin trading as alt-coin difference expands
A cumulative negative 209 billion reading signals that supply has consistently exceeded demand, though it does not automatically indicate a market bottom, analysts noted. Extended net selling phases can persist until liquidity conditions improve or new capital enters the market, according to historical patterns.
Durable market reversals have historically occurred only after sustained buying activity replaces directional selling, market data shows. Altcoin spot markets remain under pressure and demand recovery has not yet materialized, according to the CryptoQuant analysis.

In the summer of 2016, the Decentralized Autonomous Organization, known as the DAO, became the defining crisis of Ethereum’s early years. A smart contract exploit siphoned millions of dollars’ worth of ether (ETH) from that initial project, and the community’s response — a contentious hard fork to recover those funds, splintered the original chain from the current one, leaving the old chain behind, known as Ethereum Classic.
The DAO was once the largest crowdfunding effort in crypto’s history, but faded into a cautionary tale of governance, security, and the limits of “code is law.”
Now, nearly a decade later, that story has taken an unexpected turn. What was lost, or rather, left untouched, is being repurposed as a ~$150 million (at today’s prices) security endowment for the Ethereum ecosystem.
The endowment, known now as the DAO Security Fund, will stake some of the 75,000 dormant ether (ETH) and deploy the yield through community-driven funding rounds to support Ethereum security research, tooling and rapid-response efforts, while keeping claims open for any remaining eligible token holders.
At the center of this story is Griff Green, one of the original DAO curators and a veteran of Ethereum decentralized governance.
“When the DAO hack happened [in 2016], obviously, I jumped into action and basically led everything but the hard fork,” Green said of assembling the white hat group that rescued funds on the original Ethereum chain. “We hacked all these hackers. It was straight up DAO wars”.
That effort, alongside others, helped salvage funds that might otherwise have been lost forever.
At the time, the hard fork restored roughly 97% of the DAO’s funds to token holders, but left a small fraction, roughly 3%, in limbo. These “edge case” funds came from quirks of the original smart contracts: people who paid more than expected, those who burned tokens to form sub-DAOs, and other anomalies that didn’t cleanly map back.
Over time, that leftover balance, once only worth a few million, ballooned into something far more significant due to ether’s [ETH] appreciation. “The value of the funds we control has grown dramatically… well over 75,000 ETH,” a blog post for the new DAO fund states.
Green and his fellow curators have spent the last decade quietly helping people recover funds and managing these residual balances. But as he tells it, the landscape has shifted. “Six volunteers were securing $300 million with decade keys. It didn’t make sense,” he told CoinDesk in an interview. “With all these AI hacks and stuff, we just got kind of scared.” Their old security model simply is no longer fit to guard nine-figure sums, Green shared.
Rather than let these funds sit idle in perpetuity, the team has decided to stake the ETH and use the yield to fund Ethereum security initiatives, honor claims indefinitely, and professionalize governance and key management. “We can stake these funds, keep claims open forever, and use the staking rewards to fund Ethereum security projects,” Green explained.
The fund will distribute capital through decentralized mechanisms such as quadratic funding, retroactive public goods funding, and ranked-choice voting for proposals.
‘Financial backbone of the world’
For Green, the revival is also personal.
The DAO hack was Ethereum’s first existential test, exposing how experimental the ecosystem still was. Nearly a decade later, he argues, the industry remains vulnerable in different ways.
“MetaMask, hot wallet keys, just any kind of private keys on your daily driver computer is probably the main fuel for a whole cyber crime industry,” Green said. “The fact that we have hot keys with billions of dollars sitting on like 10,000 laptops spread out throughout the world has an industry of cybercrime.”
The persistence of hacks, phishing schemes and smart contract exploits frustrates him. “Not only amazes me, it disappoints me and frustrates me,” he said, describing the state of Ethereum security today.
That urgency is shaping how the new fund will operate. Unlike the Ethereum Foundation’s more top-down grantmaking process, the DAO Security Fund is designed as a bottom-up experiment, allowing participants in the DAO to decide how to distribute funds. Round operators will apply to distribute funds, security experts will help set eligibility standards, and staking rewards will provide a renewable pool of capital.
If Ethereum is to become what many believe it is, the core infrastructure for global finance, Green says security must come first.
“Ethereum is at the cusp of being the financial backbone of the world, if it fixes security,” he said.
The DAO Security Fund, in Green’s view, is therefore both a continuation of unfinished work and a forward-looking vehicle for safeguarding Ethereum as it scales.
Read more: Ethereum OGs revive the DAO with $220 million security fund, Unchained reports

General Mills reduces forecast for fiscal 2026

Bitcoin stays volatile while MUFG says stables work better as money

After SAFE: Consequences for EU-UK defence industrial cooperation and potential ways forward


-

 Sports7 days ago
Big Tech enters cricket ecosystem as ICC partners Google ahead of T20 WC | T20 World Cup 2026
-

 Video2 days ago
Bitcoin: We’re Entering The Most Dangerous Phase
-

 Tech3 days ago
Luxman Enters Its Second Century with the D-100 SACD Player and L-100 Integrated Amplifier
-

 Video5 days ago
The Final Warning: XRP Is Entering The Chaos Zone
-
 Tech1 day ago
The Music Industry Enters Its Less-Is-More Era
-

 Sports1 day ago
GB's semi-final hopes hang by thread after loss to Switzerland
-

 Crypto World1 day ago
Can XRP Price Successfully Register a 33% Breakout Past $2?
-

 Business14 hours ago
Infosys Limited (INFY) Discusses Tech Transitions and the Unique Aspects of the AI Era Transcript
-

 Video1 day ago
Financial Statement Analysis | Complete Chapter Revision in 10 Minutes | Class 12 Board exam 2026
-

 Tech5 hours ago
Retro Rover: LT6502 Laptop Packs 8-Bit Power On The Go
-
 Crypto World4 days ago
Bhutan’s Bitcoin sales enter third straight week with $6.7M BTC offload
-
 Crypto World7 days ago
Pippin (PIPPIN) Enters Crypto’s Top 100 Club After Soaring 30% in a Day: More Room for Growth?
-

 Video6 days ago
Prepare: We Are Entering Phase 3 Of The Investing Cycle
-
 NewsBeat3 days ago
The strange Cambridgeshire cemetery that forbade church rectors from entering
-

 Business6 days ago
Barbeques Galore Enters Voluntary Administration
-

 Business6 hours ago
Tesla avoids California suspension after ending ‘autopilot’ marketing
-
 Crypto World6 days ago
Ethereum Price Struggles Below $2,000 Despite Entering Buy Zone
-
 NewsBeat3 days ago
Man dies after entering floodwater during police pursuit
-

 Crypto World5 days ago
Kalshi enters $9B sports insurance market with new brokerage deal
-

 NewsBeat4 days ago
UK construction company enters administration, records show