

Crypto World
Crypto Long & Short: Crypto’s liquidity mirage
Welcome to our institutional newsletter, Crypto Long & Short. This week:
- Leo Mindyuk on how executable liquidity at scale is more fragmented and fragile than most institutions assume
- Top headlines institutions should pay attention to by Francisco Rodrigues
- Helium’s deflationary flip in Chart of the Week
Expert Insights
Crypto’s liquidity mirage: why headline volume doesn’t equal tradable depth
– By Leo Mindyuk, co-founder and CEO, ML Tech
Crypto looks liquid, until you try to trade large volumes. Especially during periods of market stress and even more so if you want to execute on coins outside of the top 10-20.
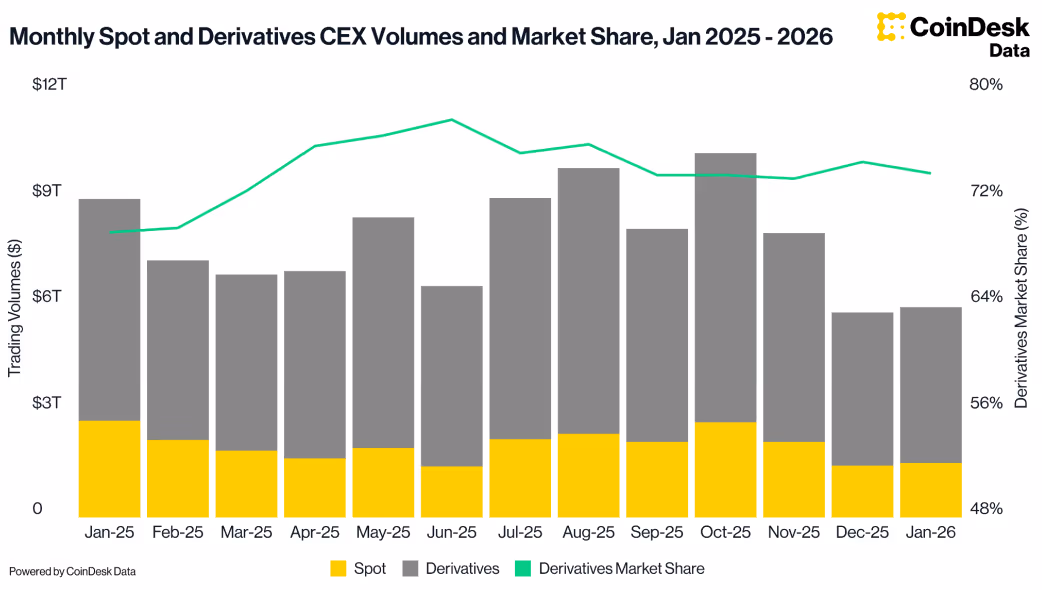
On paper, the numbers are impressive. Billions traded in daily volume and trillions traded in monthly volume. Tight spreads on bitcoin and ether (ETH). Dozens of exchanges competing for flow. It resembles a mature, highly efficient market. The beginning of the year saw around $9 trillion of monthly spot and derivatives volumes, then October 2025 saw around $10 trillion in monthly volume (including a lot of activity around the October 10th market bloodbath). Then in November, derivatives trading volumes decreased 26% to $5.61 trillion, recording the lowest monthly activity since June, followed by even larger declines in December and January, according to CoinDesk Data. Those are still some very impressive numbers, but let’s zoom in further.

At first glance there are a lot of crypto exchanges competing for flow, but in reality just a small group of exchanges dominate (see the graph below). If those have liquidity thinning out or connectivity issues preventing the execution of volume, the whole crypto market is impacted.

It’s not just that the volumes are concentrated on a few exchanges, they are also highly concentrated in BTC, ETH and a couple of other top coins.
The liquidity seems quite solid with a number of institutional market makers active in the space. However, the visible liquidity is not the same as executable liquidity. According to Amberdata (see the graph below), markets that showed $103.64 million in visible liquidity suddenly had just $0.17 million available, a 98%+ collapse. The bid-ask imbalance flipped from +0.0566 (bid-heavy, buyers waiting) to -0.2196 (ask-heavy, sellers overwhelming the market at a 78:22 ratio).

For institutions deploying meaningful capital, the distinction becomes obvious very quickly. The top of the book might show tight spreads and reasonable depth. Go a few levels down, and liquidity thins out fast. Market impact doesn’t increase gradually, it accelerates. What looks like a manageable order can move price far more than expected once it interacts with real depth.

The structural reason is simple. Crypto liquidity is fragmented. There is no single consolidated market. Depth is distributed across venues, each with different participants, latency profiles, API systems (that can break or have disruptions) and risk models (that can come under stress). Reported volume aggregates activity, but it does not aggregate liquidity in a way that makes it easily accessible for large execution. This is specifically apparent for smaller coins.
That fragmentation creates a false sense of comfort. In calm markets, spreads compress and books look stable. During volatility, liquidity providers reprice or pull entirely. They get unfavorable inventory and are unable to de-risk and pull out their quotes. Depth disappears faster than most models assume. The difference between quoted liquidity and durable liquidity becomes clear when conditions change.
What matters is not how the book looks at 10:00 a.m. on a quiet day. What matters is how it behaves during stress. Experienced quants know that but most of the market participants do not, as they struggle to close open positions gradually and then get liquidated during the stress events. We saw this in October, and a couple of times since.
In execution analysis, slippage does not scale linearly with order size; it compounds. Once an order crosses a certain depth threshold, impact increases disproportionately. In volatile conditions, that threshold shrinks. Suddenly, even modest trades can move prices more than historical norms would suggest.
For institutional allocators, this is not a technical nuance. It is a risk management issue. Liquidity risk is not only about entering a position, it is about exiting when liquidity is scarce and correlations rise. Want to execute a couple of millions of some smaller coins? Good luck! Want to exit losing positions in less liquid coins when the market is busy like during the October crash? It can become catastrophic!
As digital asset markets continue to mature, the conversation needs to move beyond headline volume metrics and top level liquidity snapshots during the calm markets. The real measure of market quality is resilience and how consistently liquidity holds up under pressure.
In crypto, liquidity isn’t defined by what’s visible during normal stable conditions. It’s defined by what’s left when the market gets tested. That’s when capacity assumptions break and risk management takes center stage.
Headlines of the Week
Wall Street giants have kept moving deeper into the cryptocurrency space over the past week, while new data has shed light on just how large the space is in Russia and how big it could become in Asia. Major market participants Binance and Strategy have meanwhile doubled down on their massive BTC reserves.
- Wall Street giants enter DeFi market with token investments: BlackRock has made its tokenized U.S. Treasury fund BUIDL tradable on decentralized exchange Uniswap, as part of a deal that saw it invest an undisclosed amount in UNI. Similarly, Apollo Global Management (APO) struck a cooperation agreement with Morpho.
- Russia’s daily crypto turnover exceeds $650 million, the Ministry of Finance says: The country’s government and central bank are pushing for legislation to regulate cryptocurrency activities, while the Moscow Exchange is looking to deepen its presence in the market.
- Binance converts its $1 billion safety net into 15,000 BTC: Leading cryptocurrency exchange Binance has finished converting the Secure Asset Fund for Users (SAFU) into bitcoin, turning about $1 billion into 15,000 BTC.
- BlackRock exec says 1% crypto allocation in Asia could unlock $2 trillion in new flows: BlackRock’s head of APAC iShares, Nicholas Peach, has said that even a modest portfolio allocation to crypto in Asia could unlock $2 trillion in new flows.
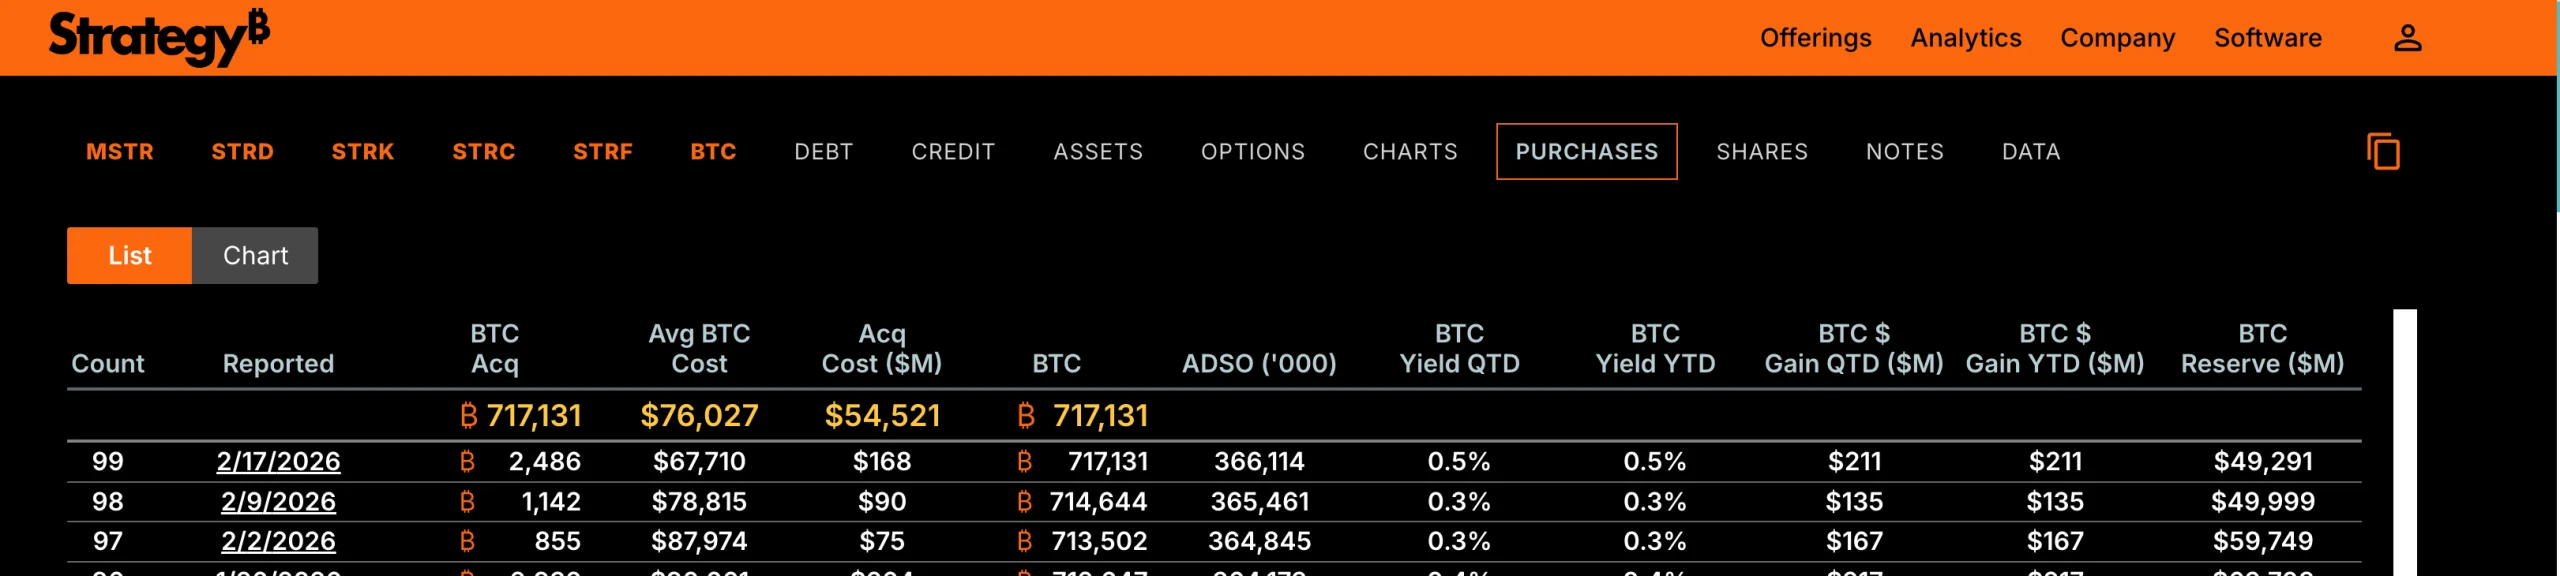
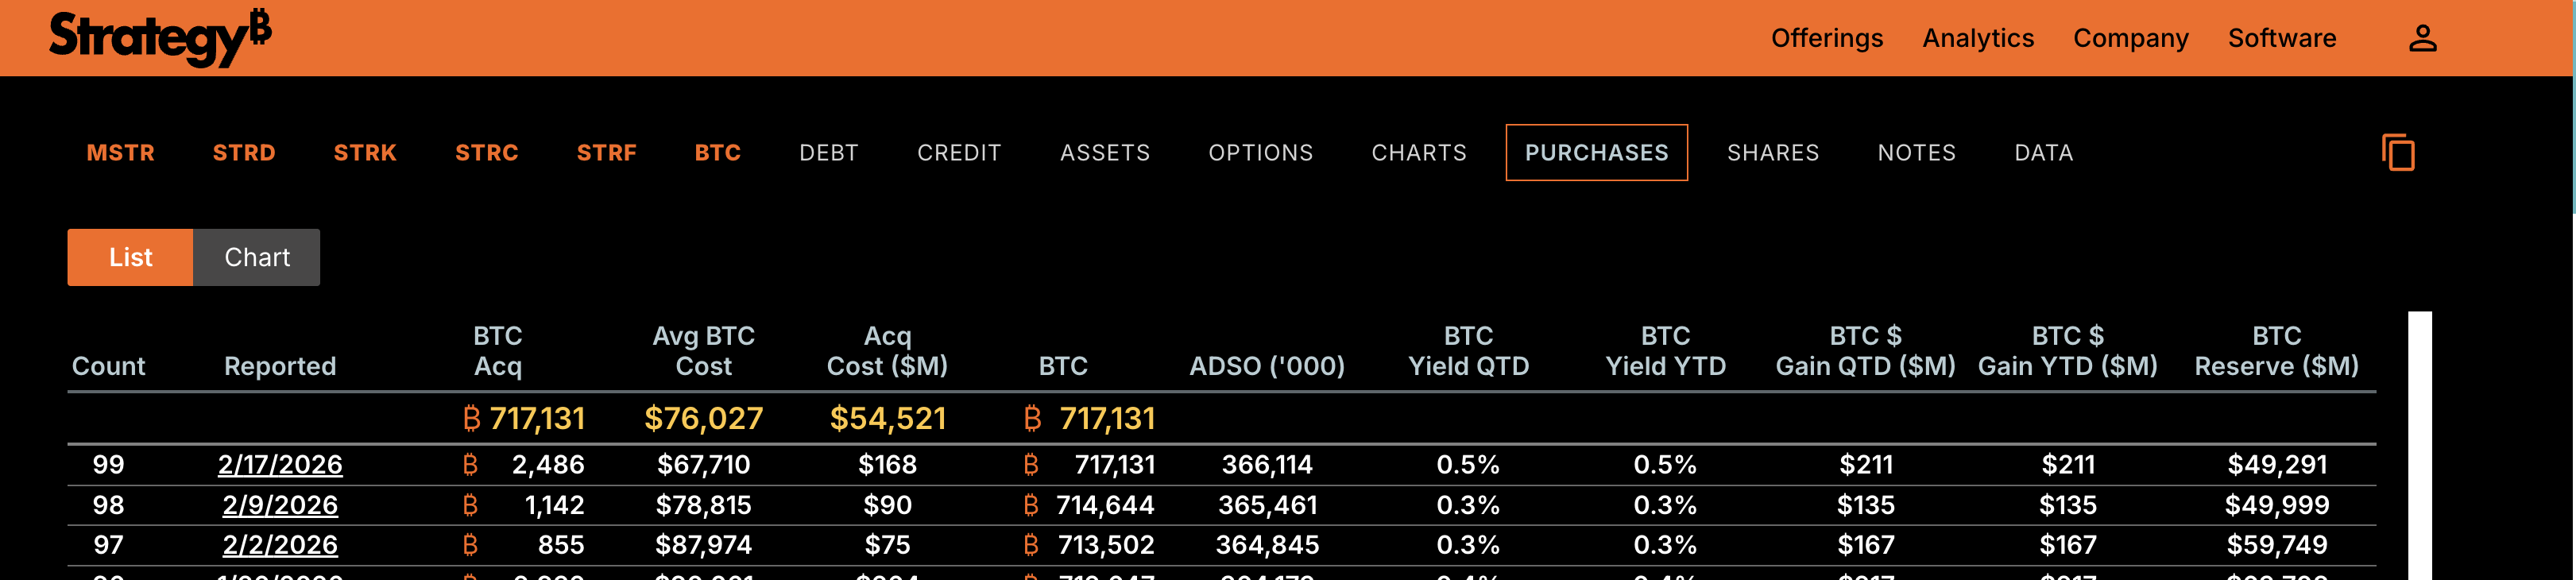
- Strategy says it can survive even if bitcoin drops to $8,000 and will ‘equitize’ debt: Strategy, the largest bitcoin treasury firm with 714,644 bitcoin on its balance sheet, said it can withstand a bitcoin price drop to $8,000 and still cover its roughly $6 billion in debt.
Chart of the Week
Helium’s deflationary flip
Helium has surged 37.5% month-to-date, decoupling from the broader market as its fundamentals shift toward a deflationary model. Since the start of 2026, the protocol’s net emissions have turned negative, effectively neutralizing long-standing sell pressure. This transition is fueled by a jump in network demand, with daily Data Credit burns climbing from $30,000 to over $50,000 since the beginning of the year, signaling that utility-driven token destruction is now outpacing new issuance.

Listen. Read. Watch. Engage.
Looking for more? Receive the latest crypto news from coindesk.com and explore our robust Data & Indices offerings by visiting coindesk.com/institutions.
Note: The views expressed in this column are those of the author and do not necessarily reflect those of CoinDesk, Inc., CoinDesk Indices or its owners and affiliates.

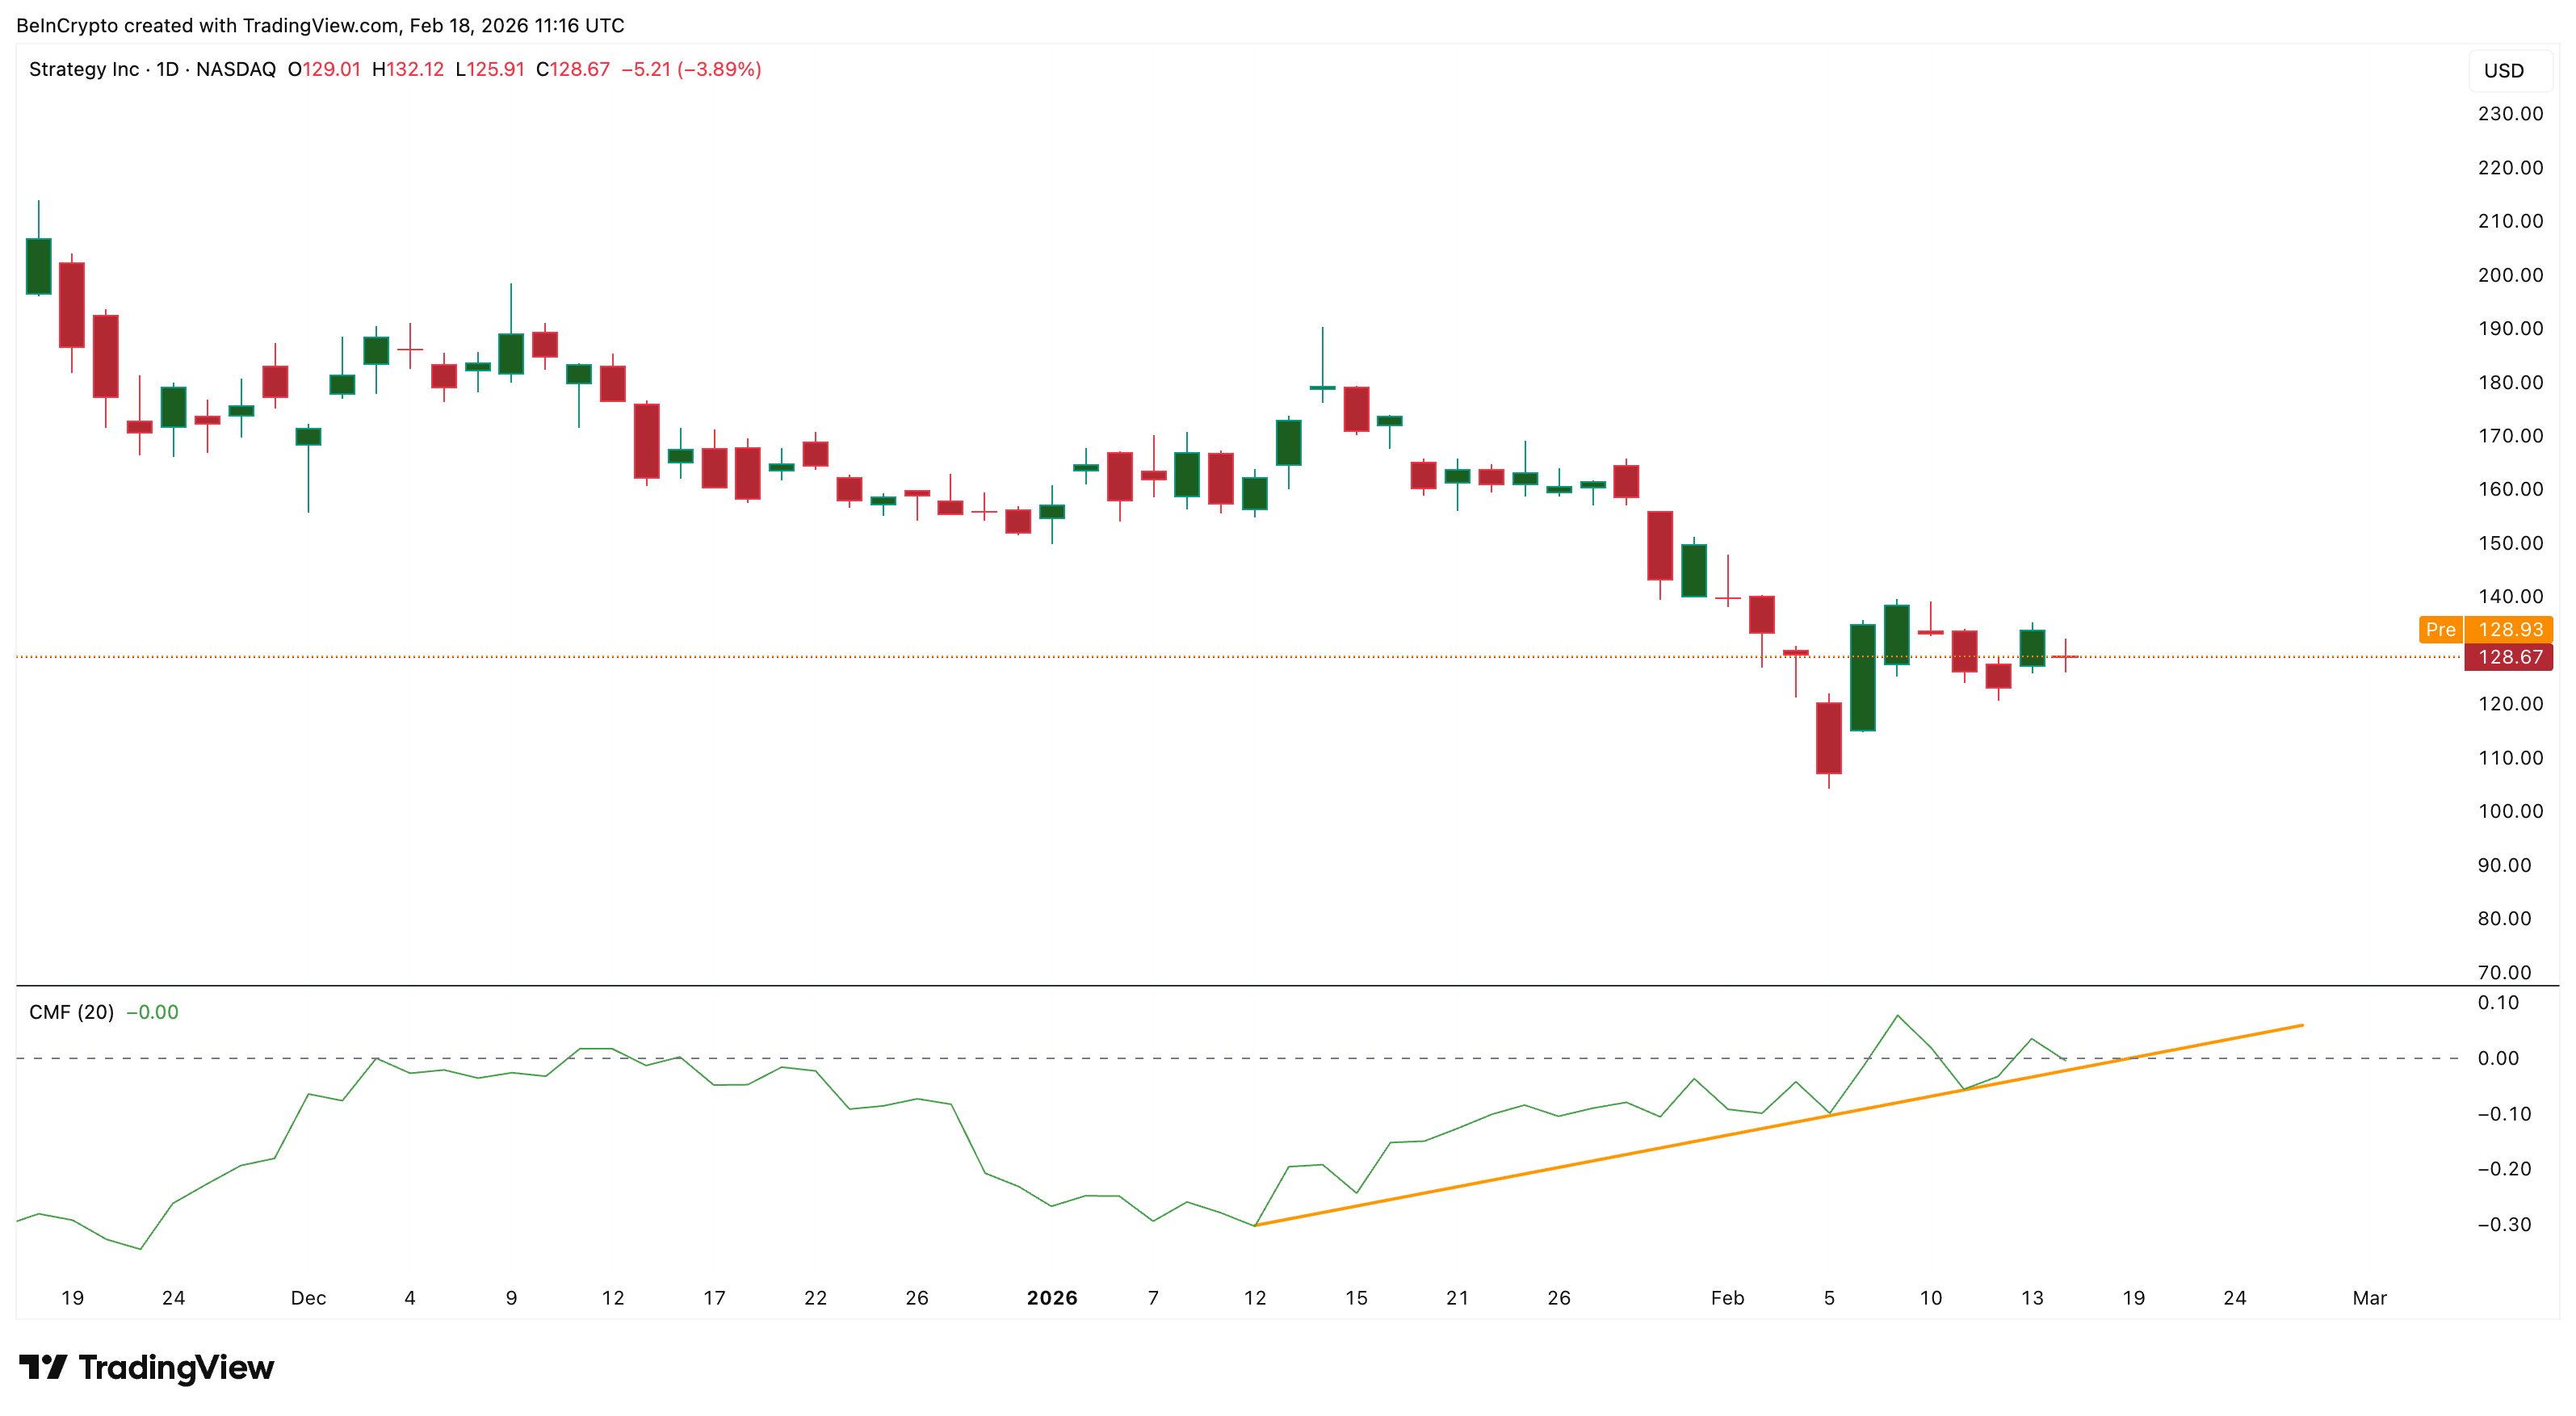
The MicroStrategy stock started the post-President’s Day session on a weak note. MSTR closed nearly 4% lower compared to its Feb. 13 (last Friday’s) close, reflecting renewed selling pressure despite positive corporate news.
This decline comes even after Strategy, previously MicroStrategy, added more Bitcoin, lowering its average purchase cost. However, charts now show that this latest BTC average drop didn’t mean much for the immediate fate of the MSTR. A much larger downside risk is forming beneath the surface.
Sponsored
Sponsored
MicroStrategy’s Latest Bitcoin Buy Lowers Average Cost Only Slightly
MicroStrategy recently purchased 2,486 Bitcoin at an average price of $67,710. This latest acquisition increased its total holdings from 714,644 BTC earlier this month to 717,131 BTC.
Because this purchase was made below MicroStrategy’s previous average cost, it helped lower the company’s overall Bitcoin cost basis. MicroStrategy’s average acquisition price dropped from $76,052 (early this month) to $76,027 (at press time). This represents a $25 average cost reduction.
Want more token insights like this? Sign up for Editor Harsh Notariya’s Daily Crypto Newsletter here.
While this technically improves MicroStrategy’s balance sheet, the impact remains small relative to its total position.
The company still holds Bitcoin at an average cost above $76,000, which remains significantly higher than many earlier cycle acquisitions. More importantly, market indicators show that big money investors are not reacting positively, even to this development.
Sponsored
Sponsored
Capital Flow Signals Strategy Investors Remain Cautious
One key indicator explaining investor behavior is the Chaikin Money Flow, or CMF. This metric measures whether large investors are putting money into a stock or pulling money out by combining price and volume data. When CMF stays above zero, it signals net buying pressure. When it falls toward zero or below, it shows capital inflows are weakening.
Strategy’s CMF has been trending lower and is now sitting close to the zero line, on the brink of breaking below. It is also approaching a critical ascending trendline support. This shows that despite the latest Bitcoin purchase, large investors are not aggressively accumulating the MSTR stock. Instead, capital inflows remain weak.
This lack of conviction becomes more concerning when combined with weakening momentum signals.
Sponsored
Sponsored
Hidden Bearish Divergence Warns of Potential Major MSTR Price Correction
Momentum analysis using the Relative Strength Index, or RSI, shows a hidden bearish divergence forming. RSI measures buying and selling strength on a scale from 0 to 100 and helps identify weakening trends.
Between Dec. 9 and Feb. 13, MicroStrategy’s stock price formed a lower high, meaning the price failed to reach its previous peak. However, during the same period, RSI formed a higher high. This pattern is called hidden bearish divergence. It signals that sellers remain in control, and the downtrend is expected to continue. The MSTR stock price is down over 60% on a 6-month timeframe, highlighting the said downtrend.
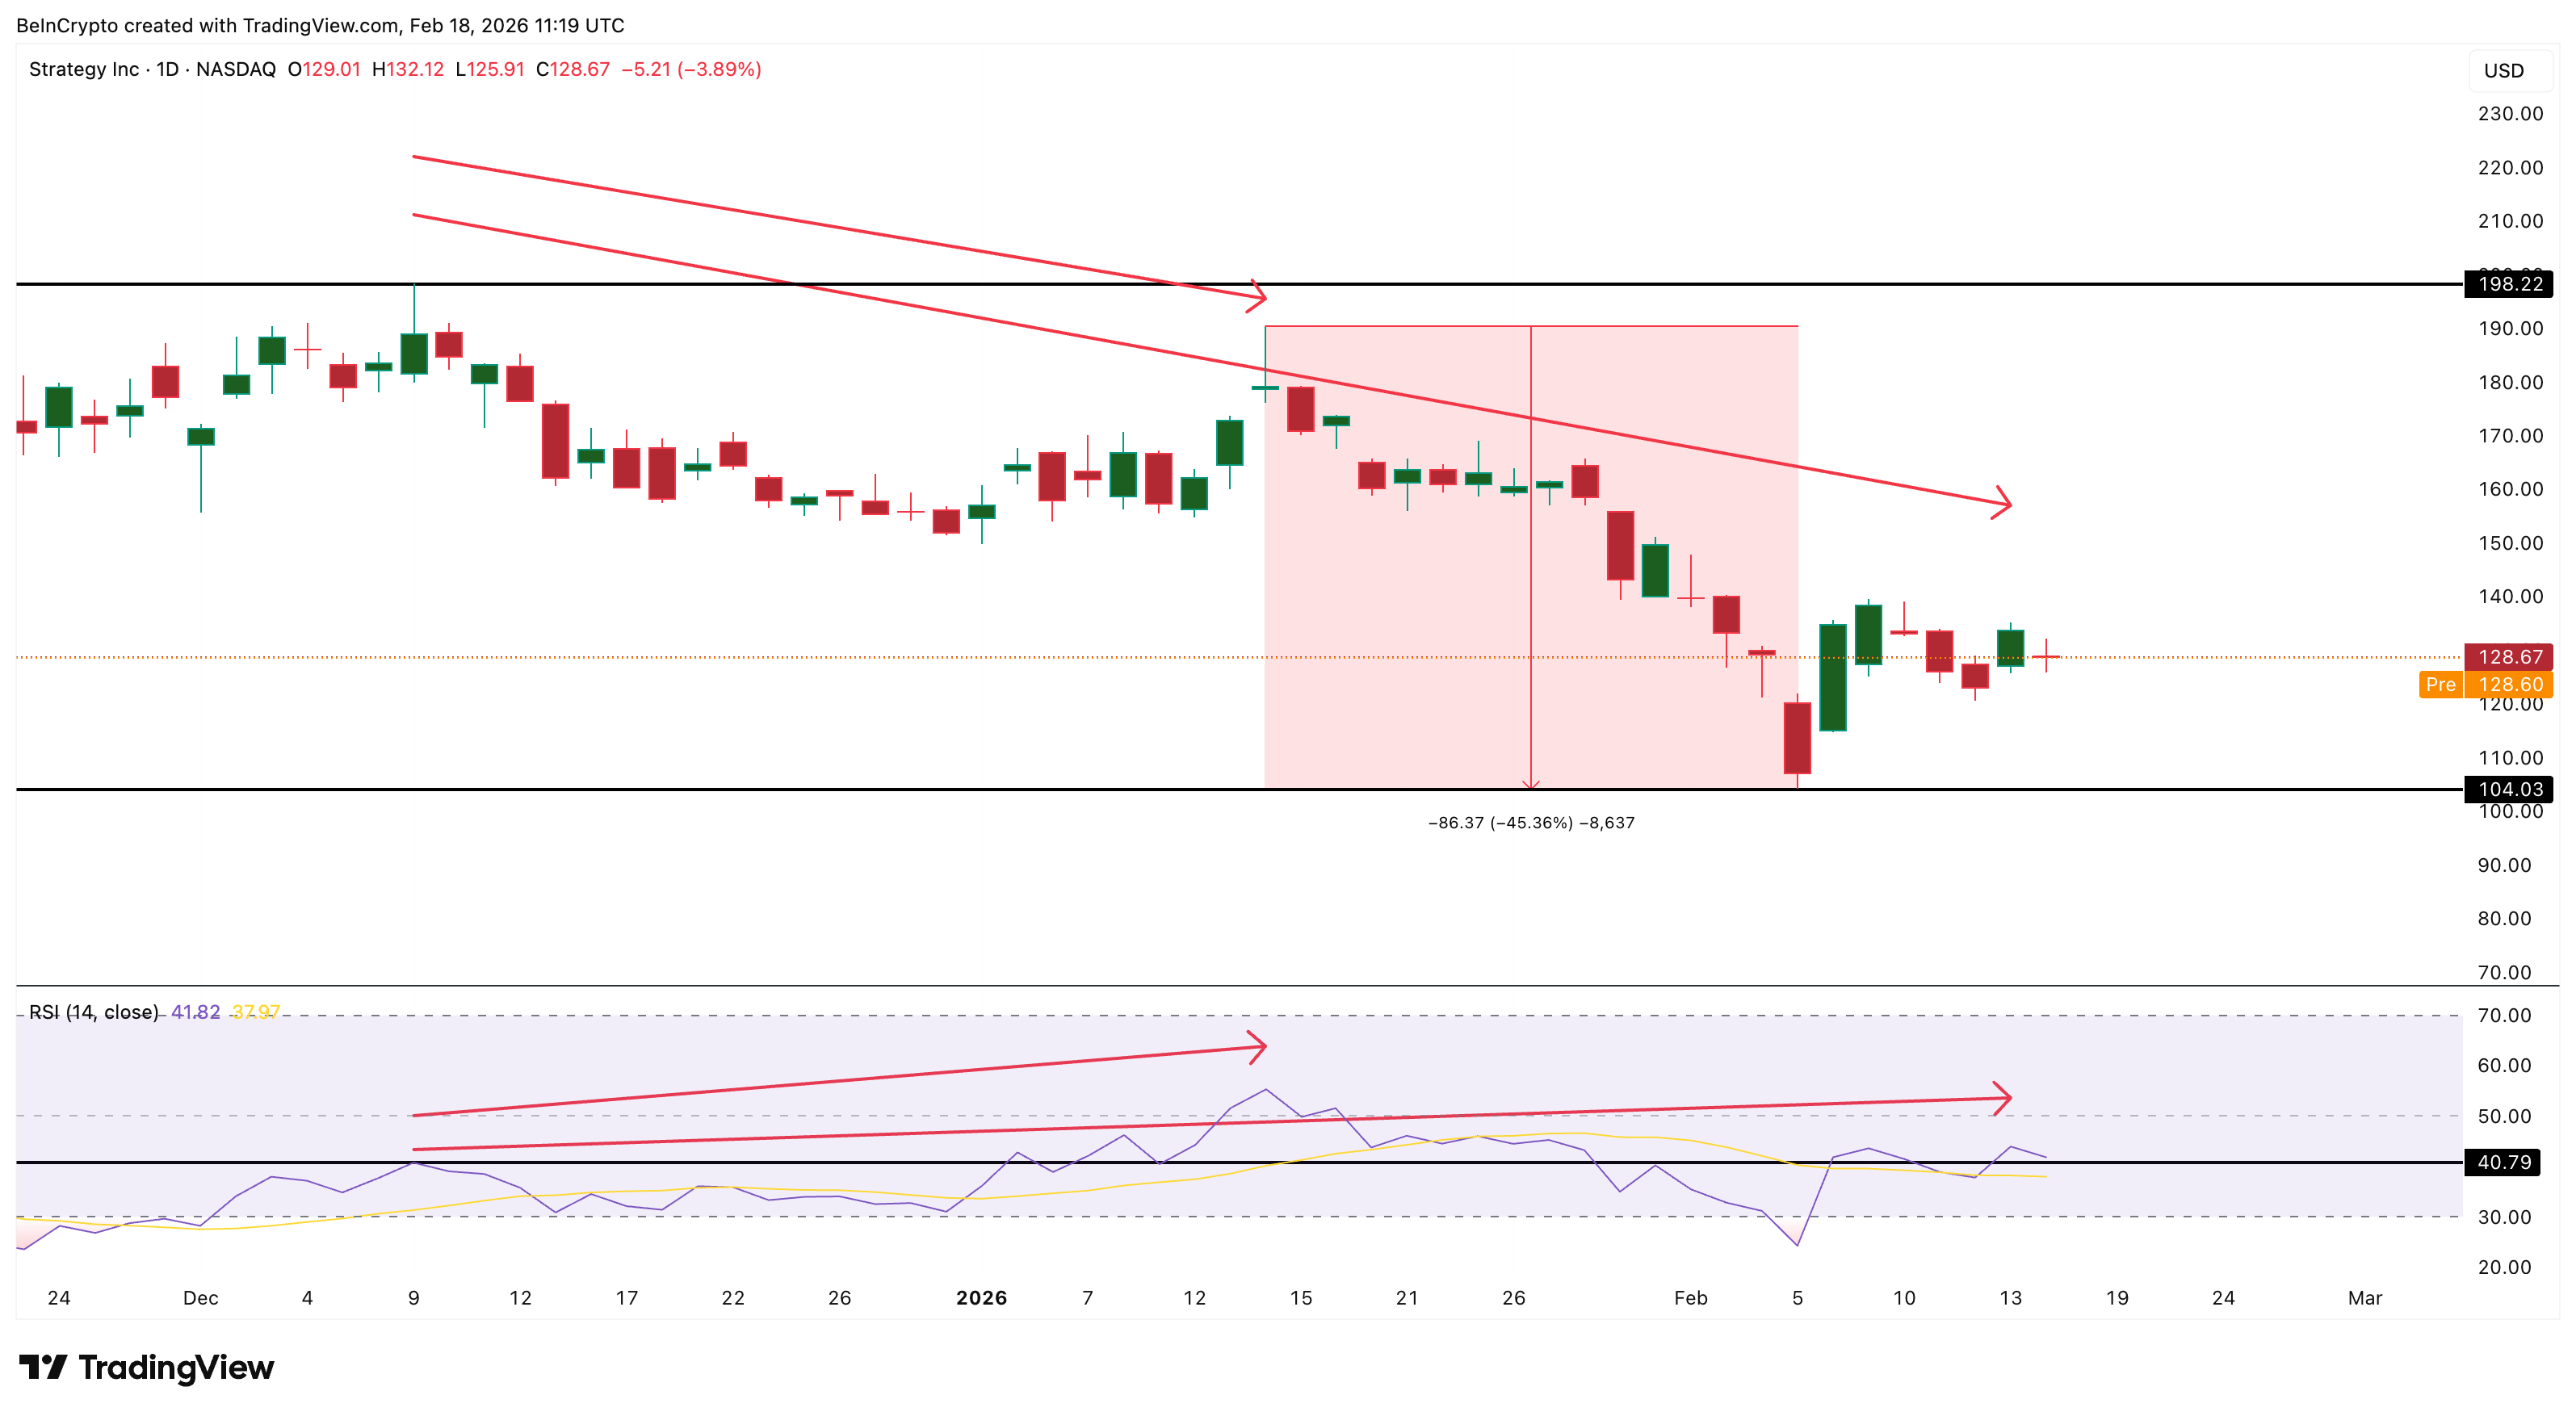
This same signal appeared earlier between Dec. 9 and Jan. 14. After that divergence formed, MicroStrategy stock dropped more than 45%, falling to its recent low near $104. The appearance of a similar structure now suggests another correction could develop if selling pressure continues. But this time the correction can have similar consequences.
Bear Flag Structure Shows MSTR Stock Could Fall Much Further
MicroStrategy’s price structure now shows a bear flag pattern forming. A bear flag is a bearish continuation pattern where the price temporarily moves upward before continuing its larger downtrend. After falling sharply earlier this February, the MSTR stock rebounded. However, this rebound has remained within a rising channel that forms the flag portion of the pattern.
Sponsored
Sponsored
MicroStrategy stock is currently trading near $128, very close to the lower boundary of this structure. If the price breaks below the $124 support level, the bear flag breakdown could begin.
Based on the height of the previous decline, this breakdown could push MicroStrategy stock toward $71, provided support levels at $104 and 86 break. This would represent a decline of more than 40% from current levels.
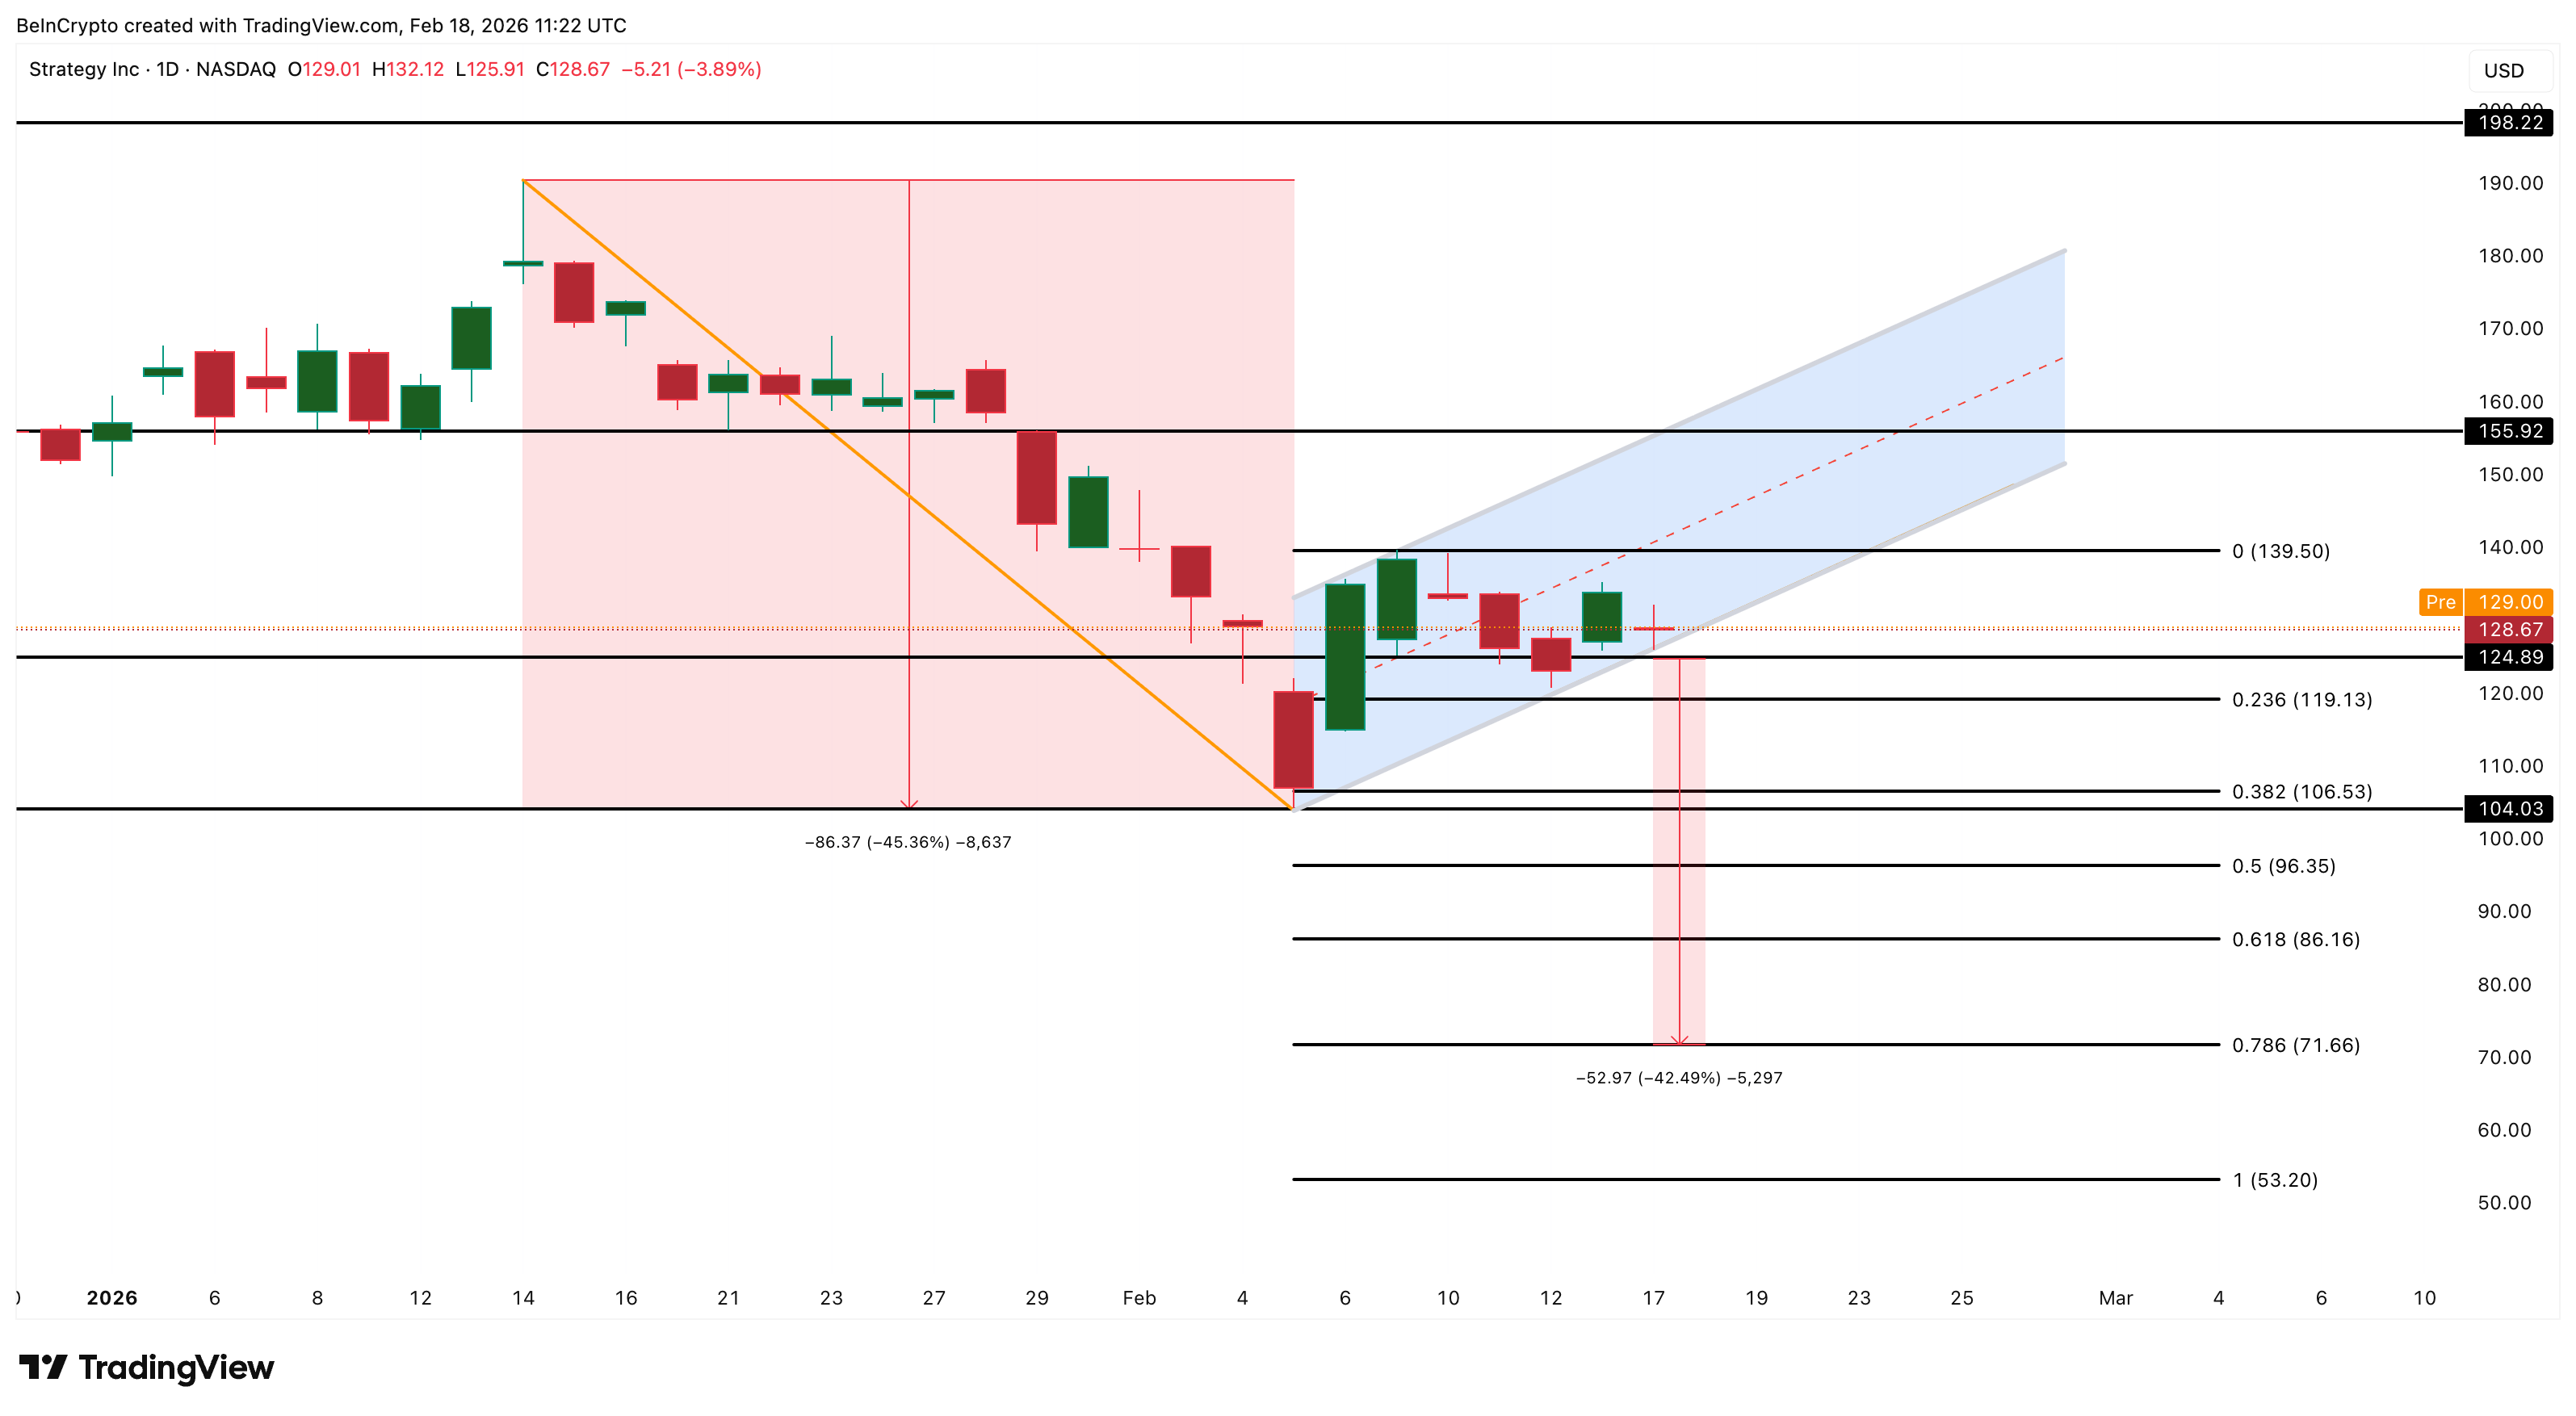
Recovery remains possible if buyers regain control. A move above $139 would weaken the bearish outlook, while a full recovery above $155 would invalidate the bearish structure entirely.
However, the bearish setup could also invalidate even without a sharp breakout. If the price continues rising slowly and the current channel extends beyond half of the original pole’s height, the bear flag would lose its validity. In that case, the structure would shift from a bearish continuation pattern into a broader recovery channel, reducing the immediate downside risk.
For now, MicroStrategy has successfully lowered its Bitcoin cost basis slightly. But capital flow weakness, bearish divergence, and fragile price structure all suggest that this small improvement may not be enough to prevent a larger stock correction.

Retail brokerage Robinhood announced plans to launch a fund that would give individual investors access to a basket of private companies. The initiative is positioned as an effort to address persistent imbalances in access to capital markets.
However, the structure has drawn comparisons to the initial coin offering (ICO) era. Though the fund will be regulated, it carries several material risks.
Opening Private Markets To Retail
Robinhood formally announced its Robinhood Ventures Fund I (RVI) on Tuesday, anticipating that it would go public on the New York Stock Exchange (NYSE) in the coming weeks under the symbol RVI.
Sponsored
Sponsored
The fund is set to offer exposure to a range of private companies, including Revolut, Oura, Ramp, Databricks, Airwallex, Mercor, and Boom. Robinhood also plans to broaden the portfolio over time, adding more private firms, including Stripe.
According to the press release, customers can request initial public offering (IPO) shares of RVI through Robinhood at $25 per share.
Unlike many traditional private market vehicles, RVI is structured to be available to a broad range of investors without accreditation requirements or minimum investment thresholds. The fund charges a management fee but does not impose performance fees. Its shares are expected to provide daily trading liquidity, subject to market conditions.
“Opening up private markets will resolve one of the greatest longstanding inequities in capital markets today, and we’re excited to bring these opportunities to all with Robinhood Ventures Fund I,” said Robinhood CEO Vlad Tenev.
However, the move has generated skepticism about the underlying risks of indirectly investing in private companies. For crypto veterans, the structure echoes a familiar dynamic seen during the ICO boom.
Sponsored
Sponsored
Lessons From The ICO Collapse
RVI provides retail investors with exposure to private growth companies, a segment of the market historically dominated by institutional capital. The fund is an SEC-registered, exchange-listed vehicle operating within established securities laws.
However, its underlying holdings are private companies whose valuations are based on infrequent funding rounds rather than being constantly priced by the public market. The companies’ reported value may not fully reflect changing market conditions until a new funding event forces a reassessment.
RVI is also a closed-end fund, meaning investors cannot sell their shares back at a guaranteed price. Instead, shares trade on the stock exchange, where the price can rise above or fall below the actual value of the companies the fund owns.
As a result, investors face two layers of uncertainty: the underlying private-company valuations and the market price of the fund. The use of leverage could amplify gains but also magnify losses during market stress.
Structural risks of this nature were most visible between 2017 and 2021, during the rapid expansion of ICOs.
During that boom, retail investors gained direct access to early-stage ventures, often driven by forward-looking narratives despite uncertain valuation frameworks and liquidity timelines.
By 2018, many ICO-funded projects failed to deliver viable products or sustainable revenue models. Token prices collapsed as speculative demand faded and regulators intensified scrutiny, wiping out billions and leaving retail investors with losses.
Sponsored
Sponsored
The episode exposed weaknesses, including limited disclosure, information asymmetry, and heavy reliance on optimistic growth assumptions. While some projects evolved into legitimate networks, the broader ICO cycle became associated with valuation excesses and uneven risk distribution.
This structure does not make RVI equivalent to an ICO, but it helps explain why comparisons have emerged.
When High Valuations Limit Upside
In both cases, retail investors can access high-growth opportunities that were once largely restricted to institutions, even as transparency around valuations and exit timelines remains limited.
The key concern raised by critics is not regulatory oversight, but risk distribution.
Sponsored
Sponsored
When access expands without continuous price discovery or guaranteed liquidity events, investors may face prolonged capital lock-up, sudden valuation adjustments, or exposure to elevated entry prices.
Some skeptics have also pointed to the fund’s specific composition. Several of RVI’s highlighted holdings, including Stripe, Databricks, and Revolut, have recently raised capital at valuations of $140 billion, $134 billion, and $75 billion, respectively.
Focusing on companies already valued very highly may leave less room for strong future gains. It could also increase the risk of price declines if private-market conditions weaken.
Others contend that traditional venture capital strategies often seek earlier-stage opportunities, where valuations are lower, but growth asymmetry is higher.
In that framing, critics shift the debate from access to timing, arguing that retail investors are entering private markets after valuations have already climbed rather than before major growth takes places.
Key points:
-
Bitcoin remains under pressure, and the downside might accelerate if the $65,118 level is breached.
-
Several major altcoins are attempting a recovery, but the bears remain sellers on rallies.
Bitcoin (BTC) bulls are attempting to hold the price above $67,000, but the bears have continued to exert pressure. A positive sign for the bulls is that select analysts believe BTC may be bottoming out.
Analyst Jelle said in a post on X that all but one of BTC’s major bottoms had formed between the 200-week simple moving average ($58,371) and the 200-week exponential moving average ($68,065). BTC trading near the 200-week EMA suggests that the bottom formation process may have begun.
Similarly, Matrixport said in a post on X that BTC may be making a durable bottom. Matrixport said that when the 21-day moving average of its daily sentiment indicator dips below zero and starts to turn up, it suggests that the selling pressure is getting exhausted. Although that doesn’t rule out a decline in the near term, the readings indicate that BTC could be approaching another inflection point.

Another positive projection for BTC came from Wells Fargo analyst Ohsung Kwon. In a note seen by CNBC, Kwon said additional savings from tax refunds, mostly from high-income consumers, could flow into equities and BTC, bringing back the “YOLO” trade.
Could BTC and the major altcoins overcome the overhead resistance levels? Let’s analyze the charts of the top 10 cryptocurrencies to find out.
Bitcoin price prediction
BTC has been making higher lows in the short term, but the bulls have failed to push the price above the breakdown level of $74,508.

Buyers are likely to make another attempt to pierce the overhead resistance at the 20-day EMA ($72,282) and the $74,508 level. If they can pull it off, the BTC/USDT pair may rally to the 50-day SMA ($83,129).
Sellers are likely to have other plans. They will attempt to defend the 20-day EMA and pull the Bitcoin price below the immediate support at $65,118. If they manage to do that, the pair might tumble to solid support at $60,000.
Ether price prediction
The bulls have maintained Ether (ETH) above the immediate support at $1,897, indicating buying on dips.

Buyers will again attempt to clear the overhead hurdle at the 20-day EMA ($2,183). If they succeed, the ETH/USDT pair may start a stronger recovery toward the 50-day SMA ($2,707).
Contrarily, if the Ether price turns down and breaks below $1,897, it suggests that the bears are attempting to take charge. The pair may then drop to the critical support at $1,750. Buyers are expected to protect the $1,750 level with all their might, as a close below it may sink the pair to $1,537.
XRP price prediction
XRP (XRP) has been trading just below the 20-day EMA ($1.52), indicating that the bulls continue to exert pressure.

That improves the prospects of a break above the 20-day EMA and the breakdown level of $1.61. The XRP price may then climb to the 50-day SMA ($1.80), signaling the XRP/USDT pair may remain inside the channel for some more time.
Buyers will have to thrust the price above the downtrend line to indicate a potential short-term trend change. On the contrary, a deeper fall might begin if the price turns down and plunges below the support line.
BNB price prediction
BNB (BNB) has been trading in a narrow range for the past few days, signaling indecision between the bulls and the bears.

If the BNB price turns down and plummets below the $570 support, it indicates the resumption of the downtrend. The BNB/USDT pair may then extend the decline to the psychological level at $500.
Buyers will have to push and maintain the price above the 20-day EMA ($676) to suggest that the selling pressure is reducing. The pair may then rally to $730 and subsequently to $790.
Solana price prediction
Solana (SOL) is facing resistance near the breakdown level of $95, indicating that the bears are active at higher levels.

The bears will attempt to strengthen their position by pulling the Solana price below the $76 support. If they manage to do that, it suggests that the bears have flipped the $95 level into resistance. The pair may then retest the Feb. 6 low of $67.
Buyers will have to overcome the $95 overhead hurdle to signal a comeback. If they can pull it off, the SOL/USDT pair may ascend to the 50-day SMA ($116), where the sellers are expected to mount a strong defense.
Dogecoin price prediction
Dogecoin (DOGE) has been trading just below the 20-day EMA ($0.10), indicating a lack of selling at lower levels.

That increases the likelihood of a rally above the 20-day EMA. The DOGE/USDT pair may then climb to the 50-day SMA ($0.12). Sellers will attempt to halt the recovery at the $0.12 level, but if the bulls overcome the resistance, the Dogecoin price may soar to the $0.16 level.
Instead, if the price turns down from the $0.12 resistance, it suggests a possible range formation in the near term. The pair might swing between $0.08 and $0.12 for a few days.
Bitcoin Cash price prediction
Bitcoin Cash (BCH) has been stuck between the moving averages, indicating uncertainty about the next directional move.

The upsloping 20-day EMA ($547) and the RSI just above the midpoint suggest a possible upside breakout. If that happens, the Bitcoin Cash price might rally to $600 and, after that, to $630.
Contrary to this assumption, if the price turns down and breaks below the 20-day EMA, it signals that the bears have overpowered the bulls. That might start a correction toward the next support at $500.
Related: 4 data points suggest XRP price bottomed at $1.12: Are bulls ready to take over?
Hyperliquid price prediction
Hyperliquid (HYPE) closed below the 20-day EMA ($30.26) on Tuesday, indicating selling at higher levels.

Buyers will attempt to maintain the Hyperliquid price above the 50-day SMA ($27.74), but if the bears prevail, the HYPE/USDT pair may tumble toward the solid support at $20.82. The flattish 20-day EMA and the RSI just below the midpoint suggest a range-bound action between $20.82 and $35.50 for some time.
The first sign of strength for the bulls is a close above the $32.50 level. That opens the doors for a rally to the $35.50 to $38.42 resistance zone.
Cardano price prediction
Cardano (ADA) has been clinging to the 20-day EMA ($0.29), indicating that the bulls have kept up the pressure.

The possibility of a break above the 20-day EMA remains high. If that happens, the ADA/USDT pair may climb toward the downtrend line, which is expected to act as a stiff resistance. If buyers pierce the downtrend line, the Cardano price may rally to $0.44 and then to $0.50.
Sellers will have to tug the price below the support line to regain control. If they manage to do that, the pair might slump toward $0.15.
Monero price prediction
Monero (XMR) remains below the breakdown level of $360, but a positive sign is that the bulls have not allowed the price to slip below the immediate support at $309.

Buyers will have to thrust the Monero price above the 20-day EMA ($366) to gain the upper hand. The XMR/USDT pair may then climb to the 50-day SMA ($449), where the bears are expected to step in.
On the downside, a break and close below the $309 level indicates that the bears remain in control. The pair may then retest the crucial $276 support. A strong rebound off the $276 level might result in a range-bound action for a few days.
This article does not contain investment advice or recommendations. Every investment and trading move involves risk, and readers should conduct their own research when making a decision. While we strive to provide accurate and timely information, Cointelegraph does not guarantee the accuracy, completeness, or reliability of any information in this article. This article may contain forward-looking statements that are subject to risks and uncertainties. Cointelegraph will not be liable for any loss or damage arising from your reliance on this information.

Arthur Hayes just switched gears. The BitMEX co founder is now calling for a major crypto rally, and he is tying it to a $572 billion liquidity wave coming from Washington.
The trigger? A Treasury shift involving the TGA and heavier buybacks. In simple terms, more cash flowing back into the system.
Hayes calls it monetary morphine. And in his view, that shot of liquidity means the worst of the downturn is already behind us.
- The Thesis: A synchronized drawdown of the Treasury General Account and debt buybacks will flood markets with cash.
- The Numbers: Hayes calculates roughly $572 billion in net liquidity hitting the financial system before year-end.
- The Timeline: This injection creates a high-probability environment for a Bitcoin surge starting now.
Why Is Hayes Calling This a Liquidity Event?
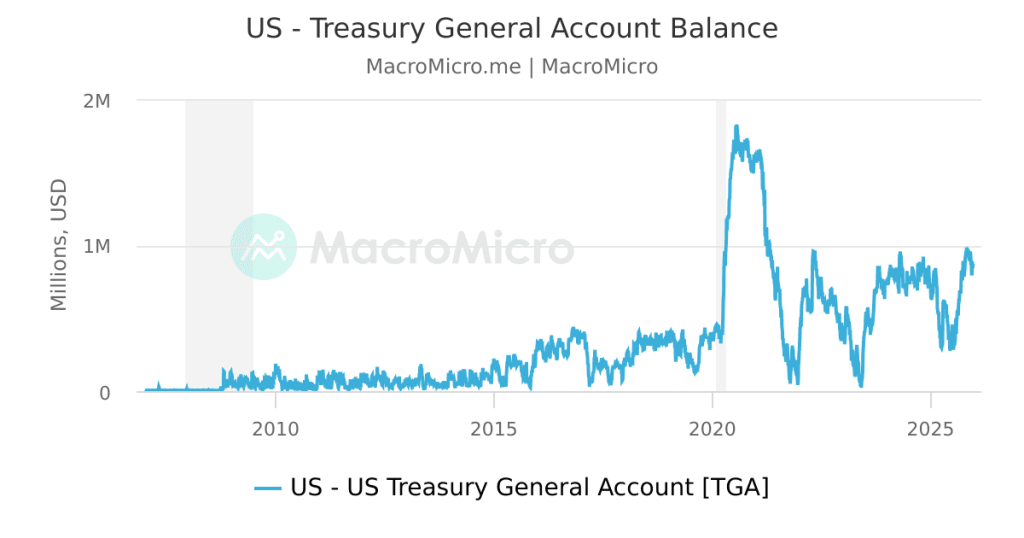
To get Hayes point, you have to look at how the Treasury actually works. The Treasury General Account is basically the government checking account at the Fed. When that balance is high, cash just sits there. When it gets spent down, that money flows into the banking system and boosts overall liquidity.
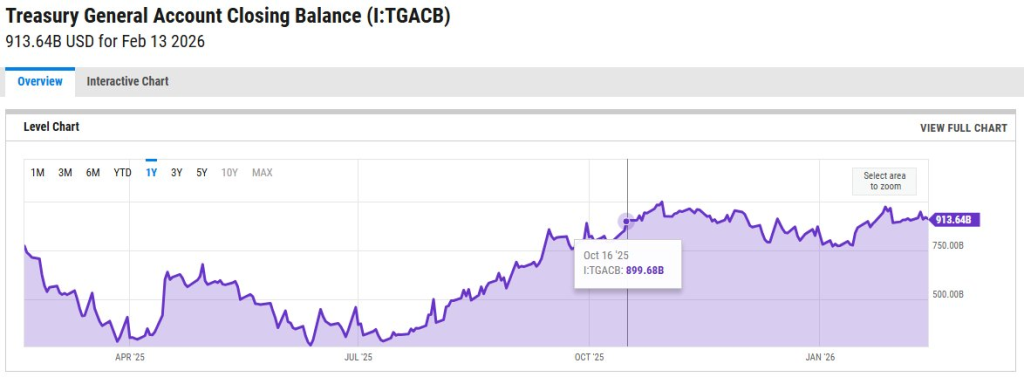
Hayes says this is stealth stimulus. While the Fed keeps talking tough about tightening, the Treasury is quietly pushing cash back into circulation to stabilize the debt market. That gap between messaging and action is where he sees opportunity.
In simple terms, liquidity is being injected even if it is not labeled as easing. And in markets driven by flows, that matters more than headlines. If the faucet is open, risk assets like Bitcoin tend to respond.
Breaking Down the Numbers: The $1 Trillion Question
Hayes is not being subtle about the scale. The TGA balance is sitting near $750 billion, while Treasury guidance points to a target closer to $450 billion. That difference alone implies roughly $301 billion flowing back into the system as the balance gets drawn down.
Then add the buybacks. The Treasury has started repurchasing older bonds to support market functioning. Hayes estimates that program could inject another $271 billion per year at the current pace. Put together, that is about $572 billion in liquidity.
From his perspective, that kind of flow offsets much of the Federal Reserve quantitative tightening. It is not labeled as easing, but the effect can feel similar. And when liquidity rises, risk assets usually do not stay quiet for long.
What Does This Mean for Bitcoin Price?
Hayes is calling it plainly. In his view, the bad phase for crypto is behind us. Bitcoin has historically moved with global liquidity, and if dollars are expanding again, that shifts the balance in BTC favor.
More supply of USD often means stronger upside pressure on scarce assets.
The setup is already tilted bullish. Funding rates have been extreme, hinting at a crowded short trade. If fresh Treasury liquidity starts flowing while shorts are leaning the wrong way, that combination can turn into a fast squeeze. Hayes thinks that opens the door to a run back toward all time highs, even $100,000.
He is not alone in that stance. Big players are quietly stepping back in, adding exposure during dips. The message from Hayes is simple. When liquidity turns, markets move. And this time, he believes the move is up, not down.
Discover: Here are the crypto likely to explode!
The post Arthur Hayes Shares Two Scenarios for Bitcoin Price, Calling for a Major Crypto Rally appeared first on Cryptonews.
The token’s surge highlights how headlines and political visibility continue to drive sentiment.
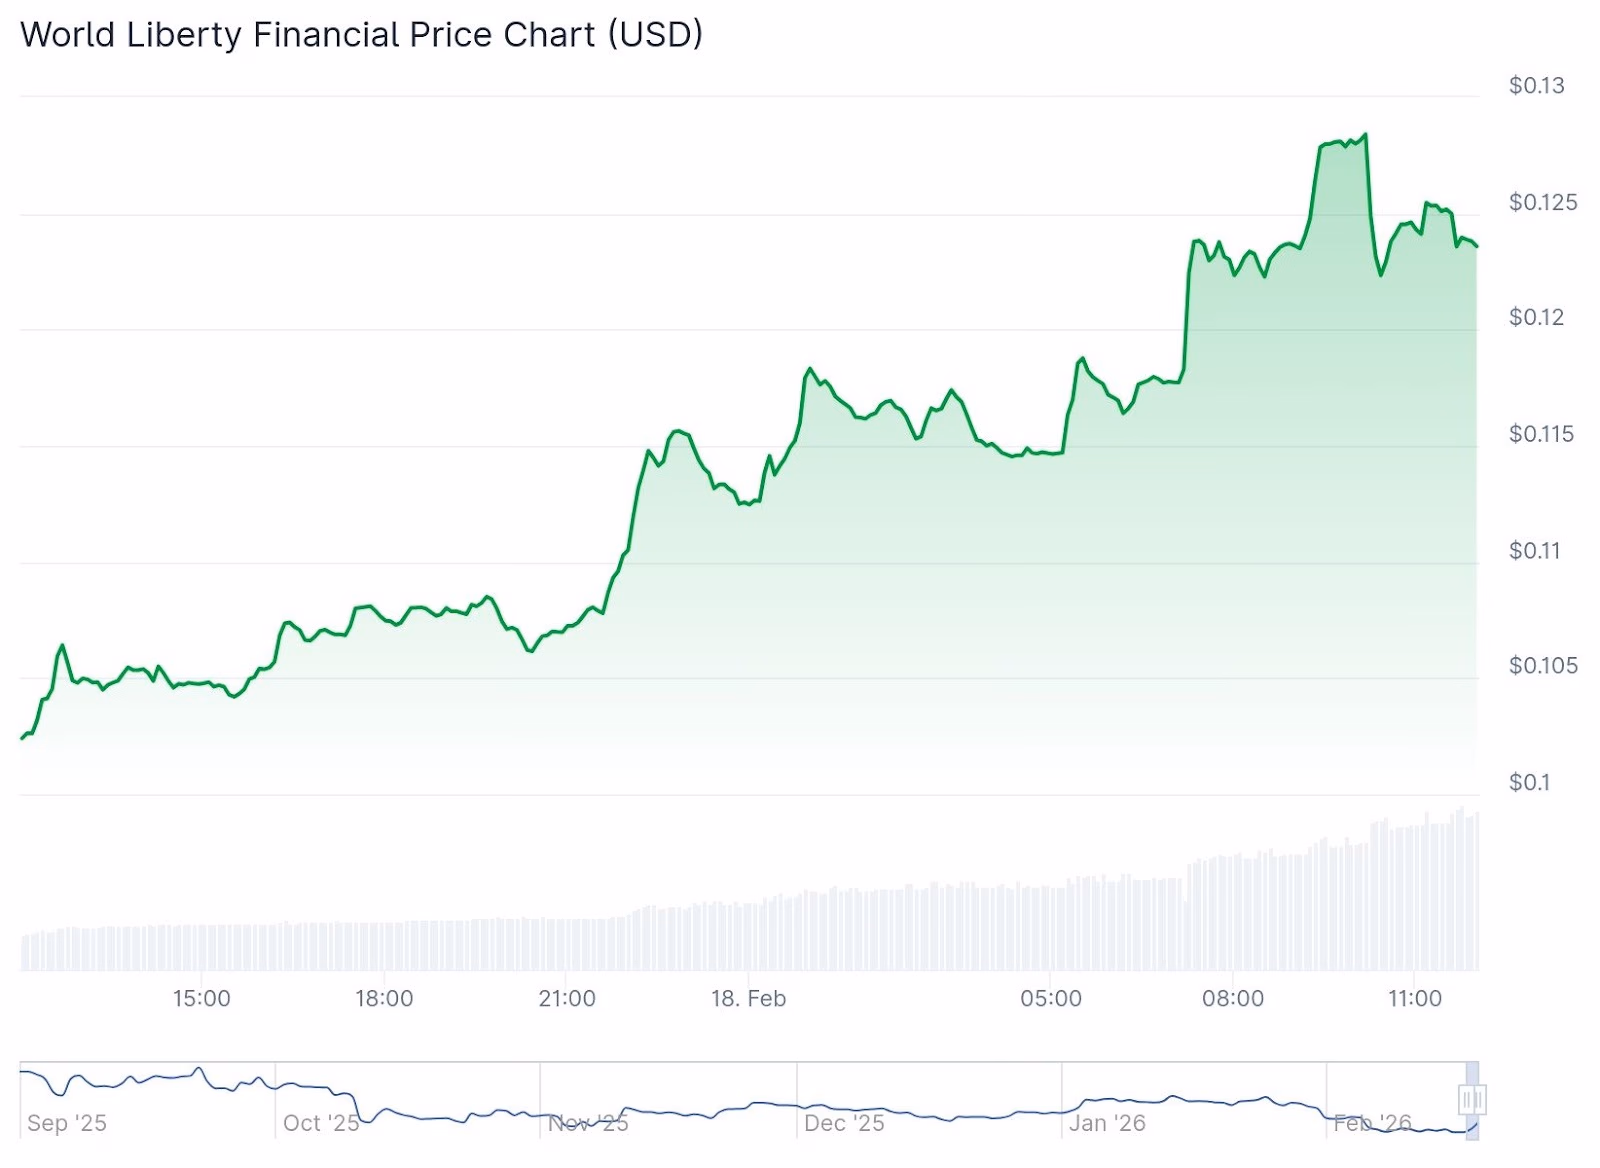
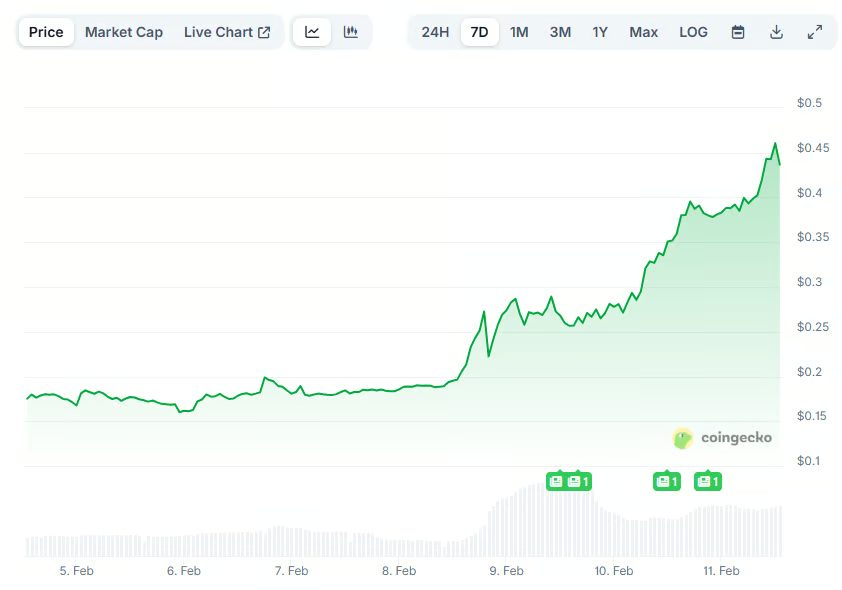
World Liberty Financial’s WLFI token surged as much as 30% over the past 24 hours as top Wall Street CEOs prepare to headline a crypto forum at President Donald Trump’s Mar-a-Lago resort.
The token climbed to a high of $0.128 this morning before retracing to around $0.123, still up 21% on the day. The move raised 24-hour trading volume to about $450 million and pushed the Trump-backed decentralized finance (DeFi) project’s market capitalization to $3.3 billion, according to CoinGecko.

WLFI’s surge highlights how investor sentiment around WLFI remains strongly driven by attention-grabbing headlines and high-profile events. It also underscores the rapidly growing convergence between politics and cryptocurrency.
The World Liberty Forum, organized by World Liberty Financial, aims to bring together leading financial leaders and policymakers to discuss cryptocurrency, finance, and technology.
Some scheduled speakers include the CEOs of Goldman Sachs, Franklin Templeton and Nasdaq, along with the president of the New York Stock Exchange (NYSE). The event is hosted by Donald Trump Jr. and Eric Trump, both co-founders of World Liberty Financial. However, President Trump is not expected to attend, Reuters reported.
The rally comes after the company faced scrutiny earlier this month when it was revealed that a member of the Abu Dhabi royal family acquired a 49% stake in the company shortly before Trump’s 2025 inauguration.
Despite the controversy, World Liberty Financial has become a major part of the Trump family’s business interests. Its USD1 stablecoin now has about $5.1 billion in circulation, up from $3 billion just weeks ago, making it the fifth-largest stablecoin by market capitalization, according to DeFiLlama.
President Trump’s other crypto ventures include the official TRUMP and MELANIA memecoins, which were trading around $3.45 and $0.12, respectively, over the past day, per CoinGecko. The tokens have market capitalizations of around $800 million for TRUMP and $115 million for MELANIA.

Recently published accounts from FTX-backed charity Effective Ventures confirm that the company sold a £17 million ($23 million) stately manor at a £10.7 million ($14.5 million) loss as it continues to wind down its UK operations.
Effective Ventures’ UK arm bought the manor in 2022 as part of a plan to host educational events for the effective altruism movement, a set of beliefs that involves wealthy donors directing funds to specific causes that they deem will do the most good most efficiently.
FTX donated over $26 million to the Effective Ventures Foundation, which was later paid back during the exchange’s bankruptcy proceedings. The charity told UK government regulators that it had received funds from FTX, and after an inquiry, was found to have acted “diligently” in response to FTX’s collapse.
In its accounts for the year up to June 2025, published last Friday, it confirmed that the manor was sold for £5.95 million ($8 million) and that it had incurred an impairment loss of £8.6 million ($11.6 million).


Read more: FTX funded this UK charity, now it’s under investigation
Local outlets reported that the manor’s price was initially set at £15 million ($20.3 million) before being slashed to £12 million ($16.3 million) a year later, and eventually to just under £6 million ($8 million).
The charity says property valuation experts recommended that it cut the asking price due to “reductions in market sentiment.”
Effective Ventures UK CEO says funds will be donated
Effective Ventures CEO Rob Gledhill had already revealed in the Effective Altruism forum that the manor was officially sold on November 11, 2025.
He reiterated that “market conditions for country estates” led to the drop in value and added that the proceeds from the sale, “will be allocated to high-impact charities, including EV’s operations.”
Within the accounts, the charity says that it’s made “significant progress” spinning out projects into new independent entities as it winds down the firm.
The charity said that it doesn’t expect to sponsor any new projects and that it should wind down in “2026 or beyond.”
Read more: FTX-funded charity Effective Ventures agrees to return donations
It also revealed that the charity made £12 million ($16.3 million) during the 2025 fiscal year, of which £11.2 million ($15.2 million) was made up of donations and grants.
It’s less than half of the £31.6 million ($42.8 million) it made in 2024.
Its expenditure has also gone up by over £2 million ($2.7 million) from 2024 to 2025, as the firm spent £37.5 million ($51 million) in the 2025 fiscal year.
Got a tip? Send us an email securely via Protos Leaks. For more informed news and investigations, follow us on X, Bluesky, and Google News, or subscribe to our YouTube channel.


Network News
ZORA MOVES FROM BASE TO SOLANA: On-chain social platform and decentralized protocol Zora is making a decisive shift beyond its non-fungible tokens (NFT) and creator roots with the launch of “attention markets” on Solana, a product that allows users to trade tokens tied to internet trends, memes and cultural moments. The feature, unveiled Feb. 17, lets anyone create a new market for 1 SOL. Once live, users can buy and sell positions on whether a topic will gain or lose traction across social media. Instead of wagering on elections or macro data, traders speculate on buzz itself — such as hashtags, viral narratives, even broad themes like “AI girlfriend” or “bitcoin.” The design leans heavily into Solana’s strengths. Fast block times and low transaction costs make it easier to support rapid price updates and frequent trading, which are essential for markets built around fleeting online momentum. Initial activity was limited, however. The primary “attentionmarkets” token briefly touched roughly $70,000 in market capitalization, with around $200,000 in trading volume. Most other trend markets struggled to attract meaningful liquidity, with few crossing the $10,000 mark on their first day. Percentage swings were sharp, though largely driven by thin order books rather than sustained demand. Zora was among the breakout applications on Coinbase’s Layer 2 Base network in the past few years. It launched its ZORA token there in April and helped roll out Creator Coins tied to Base profiles in July, a push that briefly helped Base overtake Solana in daily token creation. Creator coins are tokens tied to an individual creator’s online profile, brand or community. Think of them as tradable “shares” in a person’s internet presence. On platforms like Zora and Base, a creator coin could be automatically generated from a user’s profile. Fans could buy the coin to signal support, gain social clout, or speculate that the creator’s popularity would grow. As more people bought in, the price could rise, and interest faded, it could fall. As such, some in the Base community saw the new “attention markets” product as a pivot away from that momentum. — Shaurya Malwa Read more.
EF EXECUTIVE-DIRECTOR TO LEAVE: Tomasz Stańczak, co-executive director of the Ethereum Foundation (EF), announced he will step down from his leadership role at the end of February 2026, marking a notable shift in the organization’s executive team. Stańczak, who has co-led the foundation alongside Hsiao-Wei Wang since early 2025, said in a blog post that he believes the foundation and the broader Ethereum ecosystem are “in a healthy state” as he prepares to hand over the reins to Bastian Aue, who will take the co-executive director role alongside Wang. Stańczak’s tenure began at a turbulent time for the EF. He was brought aboard following the transition of long-time executive director Aya Miyaguchi into a new leadership position amid mounting community criticism that the foundation wasn’t doing enough to aggressively push the Ethereum ecosystem forward. At the time, detractors pointed to a perceived disconnect between the EF and developers, including conflicts of interest, clashes over strategic direction and frustrations about ETH’s price performance. Such criticisms helped spur a broader leadership restructuring. While Stańczak stressed his confidence in the team’s ability to carry forward the EF’s mission, he also signaled his intention to remain involved in the ecosystem. — Margaux Nijkerk Read more.
XRP LEDGER RELEASES MEMBER-ONLY DEX: The XRP Ledger has activated a new “Permissioned DEX” amendment, a technical upgrade designed to let regulated institutions trade on XRPL without opening markets to everyone. The change, known as XLS-81, allows the creation of permissioned decentralized exchanges that work like XRPL’s existing built-in DEX, but with a key difference. A permissioned domain can restrict who can place offers and who can accept them, creating a gated trading venue where participation is tied to compliance requirements such as KYC and AML checks. Think of it as a ‘members only’ marketplace, while still keeping the trading mechanics native to the ledger. The feature is aimed at banks, brokers and other firms that may want onchain settlement and liquidity but cannot interact with fully open DeFi markets. For these players, the ability to control access is not optional; it is a minimum requirement. The activation also adds to a growing set of “institutional DeFi” primitives XRPL has been rolling out this month. Token Escrow, or XLS-85, went live last week, extending XRPL’s native escrow system beyond XRP to all trustline-based tokens and Multi-Purpose Tokens, including stablecoins such as RLUSD and tokenized real-world assets. — Shaurya Malwa Read more.
ETHEREUM MEMBERS REVIVE NEW VERSION OF THE DAO: In the summer of 2016, the Decentralized Autonomous Organization, known as the DAO, became the defining crisis of Ethereum’s early years. A smart contract exploit siphoned millions of dollars’ worth of ether (ETH) from that initial project, and the community’s response — a contentious hard fork to recover those funds, splintered the original chain from the current one, leaving the old chain behind, known as Ethereum Classic. The DAO was once the greatest crowdfunding effort in crypto’s history, but faded into a cautionary tale of governance, security, and the limits of “code is law.” Now, nearly a decade later, that story has taken an unexpected turn. What was lost, or rather, left untouched, is being repurposed as a ~$150 million (at today’s prices) security endowment for the Ethereum ecosystem. The endowment, now known as TheDAO Security Fund, will stake some of the 75,000 dormant ether (ETH) and deploy the yield through community-driven funding rounds to support Ethereum security research, tooling and rapid-response efforts, while keeping claims open for any remaining eligible token holders. At the center of this story is Griff Green, one of the original DAO curators and a veteran of Ethereum decentralized governance. “When the DAO hack happened [in 2016], obviously, I jumped into action and basically led everything but the hard fork,” Green said of assembling the white hat group that rescued funds on the original Ethereum chain. “We hacked all these hackers. It was straight up DAO wars”. That effort, alongside others, helped salvage funds that might otherwise have been lost forever. At the time, the hard fork restored roughly 97% of the DAO’s funds to token holders, but left a small fraction, roughly 3%, in limbo. These “edge case” funds came from quirks of the original smart contracts: people who paid more than expected, those who burned tokens to form sub-DAOs, and other anomalies that didn’t cleanly map back. Over time, that leftover balance, once only worth a few million, ballooned into something far more significant due to ether’s appreciation. “The value of the funds we control has grown dramatically… well over 75,000 ETH,” a blog post for the new DAO fund states. — Margaux Nijkerk Read more.
In Other News
- A recent poll of 1,000 American investors in digital assets found that over half are scared they’ll face an IRS tax penalty this year as new transparency rules governing crypto exchanges take effect. The data collected at the end of January by crypto tax platform Awaken Tax canvassed U.S. holders’ concerns about a radical shift from self-disclosure to automatic reporting of transactions. This has been enacted through the introduction of the “Digital Asset Proceeds From Broker Transactions,” or Form 1099-DA, which tens of millions of Americans will be made aware of over the next month or so. The new rules are designed to clamp down on crypto tax evasion and compel brokers, such as crypto exchange Coinbase (COIN), to report all sales and exchanges of digital assets that occurred in 2025 to the tax agency. The aim is to give tax authorities a clear view of investor gains and losses by opening up customer data inside exchanges for the first time, allowing the IRS to compare what crypto brokers report with what taxpayers file. While the goal is to remove any margin of error, the rules are a “blunt instrument,” created by legislators who know nothing about crypto, according to Awaken Tax founder Andrew Duca. “It means crypto is being treated like stocks, but it doesn’t behave in that way. Real crypto users will move assets between multiple wallets and interact with decentralized finance (DeFi) protocols, using pretty complex trading strategies,” Duca said. — Ian Allison Read more.
- Crypto venture firm Dragonfly Capital completed a $650 million fourth fund, marking one of the largest raises in the sector at a time when many blockchain-focused VCs are struggling, Managing Partner Haseeb Qureshi said. “It’s a weird time to celebrate,” Qureshi wrote on a social media post, describing low spirits and “the gloom of a bear market” for crypto. However, he noted that Dragonfly has historically raised capital during downturns, including the 2018 ICO crash and just before the 2022 Terra collapse, ‘vintages,’ he said, ultimately became the firm’s best performers. In September, the firm said it aimed to raise $500 million for its fourth fund, targeting early-stage projects. It has not yet identified any of them. In May 2023, Dragonfly Capital raised $650 million for its third crypto fund for later-stage companies. — Olivier Acuna Read more.
Regulatory and Policy
- Hyperliquid (HYPE), a blockchain-based exchange that processed more than $250 billion in perpetual futures trading last month, has launched a U.S. lobbying and research arm to shape how lawmakers regulate decentralized finance (DeFi). The Hyperliquid Policy Center, a Washington, D.C.-based nonprofit, will focus on regulatory frameworks for decentralized exchanges, perpetual futures and blockchain-based market infrastructure, according to a press release. Jake Chervinsky, a prominent crypto lawyer and former policy head at the Blockchain Association, will serve as founder and CEO. The launch comes as Congress and federal agencies debate how to oversee crypto trading platforms and derivatives markets. Perpetual futures, which allow traders to hold leveraged positions without an expiration date, are widely used on offshore venues but remain a gray area under U.S. law. The arrival of a new group also represents just the latest entrant into a Washington crypto-policy scene that’s jammed with similar organizations, including the DeFi Education Fund and Solana Policy Institute, in addition to the broader groups such as the Digital Chamber, Blockchain Association and Crypto Council for Innovation. And the new organization lands as negotiation is well underway on Senate legislation that may set U.S. DeFi policy. — Kristzian Sandor Read more.
- The legal challenges from state governments against certain aspects of prediction markets such as Polymarket and Kalshi received a sharp rebuke from U.S. Commodity Futures Trading Commission Chairman Mike Selig, who is arguing that his federal agency has jurisdiction, not the states. “To those who seek to challenge our authority in this space, let me be clear: we will see you in court,” Selig said in a video statement posted on social media site X. He said his agency filed a legal brief in court to back up the federal role as the leading regulator over this corner of the derivatives markets. “The CFTC has regulated these markets for over two decades,” he said. “They provide useful functions for society by allowing everyday Americans to hedge commercial risks like increases in temperature and energy price spikes; they also serve as an important check on our news media and our information streams.” — Jesse Hamilton Read more.
Calendar
- Feb. 18-21, 2026: EthDenver, Denver
- Feb. 23-24, 2026: NearCon, San Francisco
- Mar. 24-26, 2026: Digital Asset Summit, New York City
- Mar. 30-Apr. 2, 2026: EthCC, Cannes
- Apr.15-16, 2026: Paris Blockchain Week, Paris
- Apr. 29-30, 2026: Token2049, Dubai
- May 5-7, 2026: Consensus, Miami
- Sept. 29-Oct.1, 2026: Korea Blockchain Week, Seoul
- Oct. 7-8, 2026: Token2049, Singapore
- Nov. 3-6, 2026: Devcon, Mumbai
- Nov. 15-17, 2026: Solana Breakpoint, London
Two-year Bitcoin hodlers “absorbed” seller pressure in recent weeks, according to new research, but most analysts still expect new macro BTC price lows.
New analysis suggests that Bitcoin (BTC) is “relying” on early 2024 buyers as its price action stalls below $70,000.
Key points:
-
Bitcoin buyers from early 2024 are in focus as a giant potential safety net for BTC price.
-
Their cost basis extends down to $60,000, and a major capitulation has not yet happened.
-
New macro BTC price lows remain a popular near-term bet.
2024 Bitcoin hodlers have “absorbed” new sellers
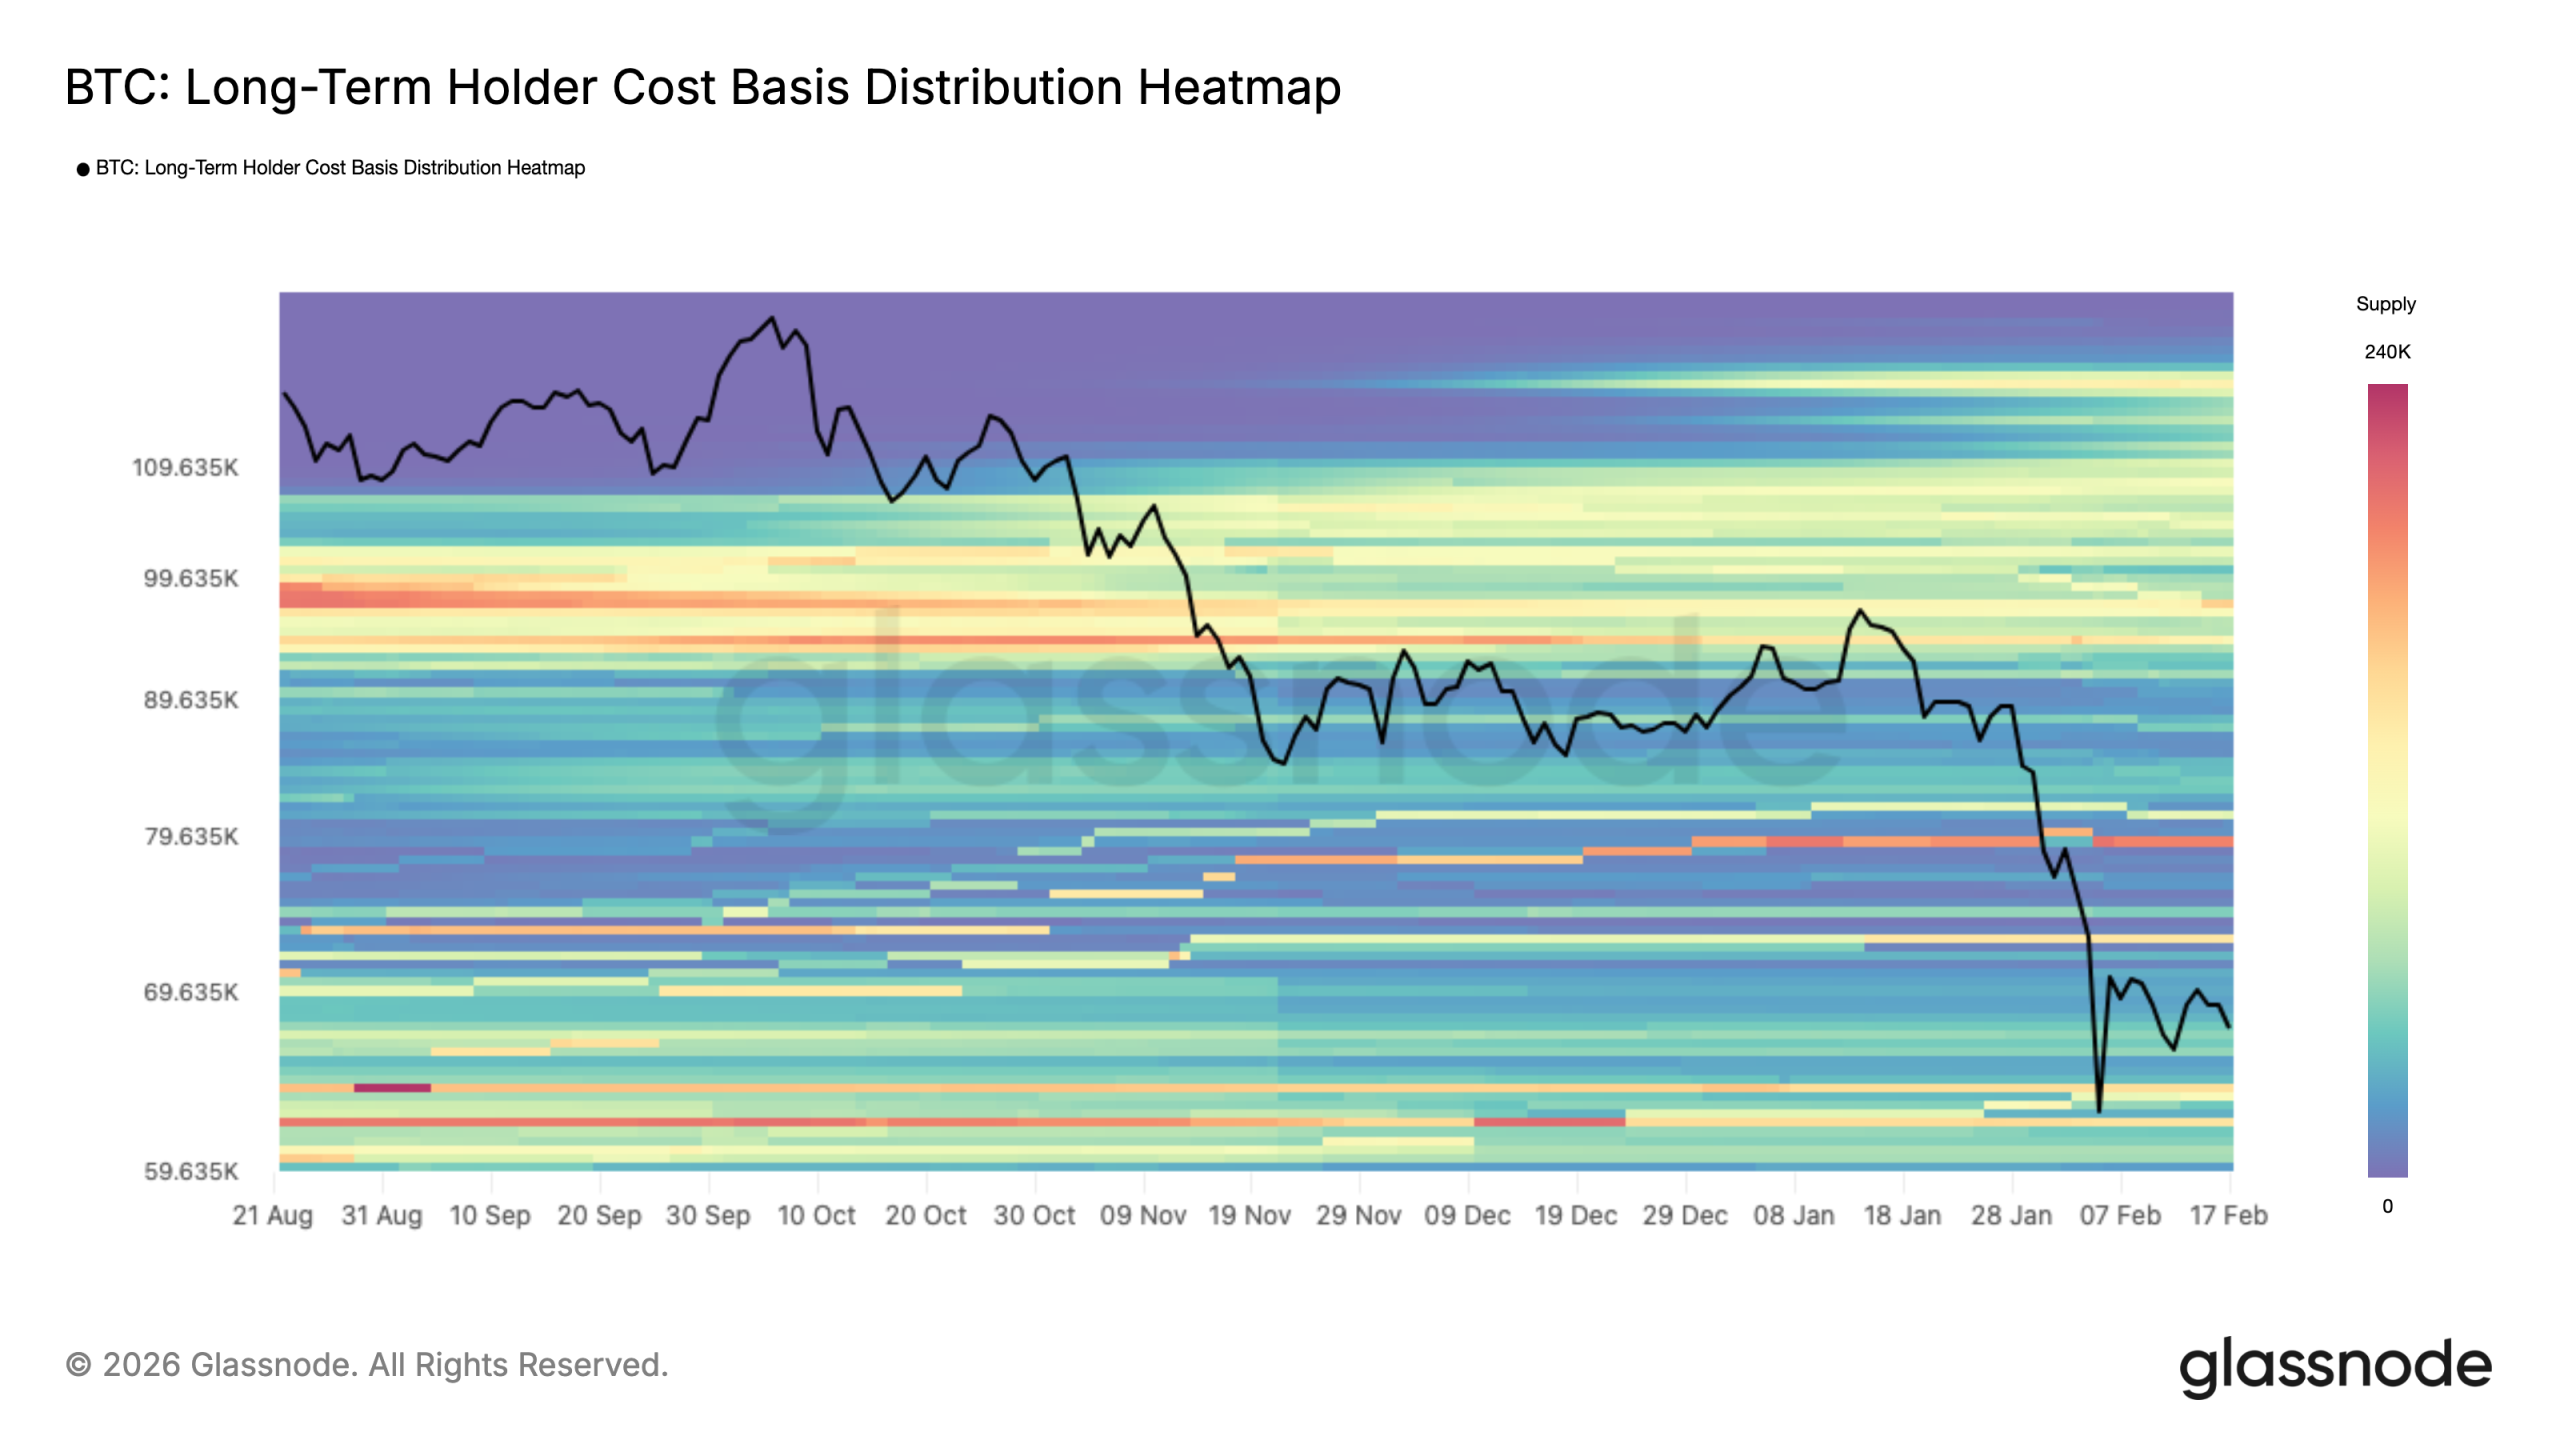
In the latest edition of its weekly newsletter, “The Week Onchain,” crypto analytics platform Glassnode said that BTC price was in a “dense demand zone.”
As BTC/USD treads water around 45% below its October 2025 all-time highs, buyers from long before that event are holding up the market.
Their importance has become much more noticeable since Bitcoin dropped below its true market mean price near $80,000.
“A closer inspection of price behavior since the breakdown below the True Market Mean indicates that downside pressure has largely been absorbed within a dense demand zone between $60k and $69k,” Glassnode summarized.
“This cluster was primarily established during the H1 2024 consolidation phase, where investors accumulated within a prolonged range and have since held their positions for over a year.”

Researchers referenced the seven-month consolidation structure that characterized much of 2024, and which itself placed old all-time highs of $69,000 from late 2021 in focus.
Now, those buyers face falling into unrealized loss, but are so far avoiding capitulation.
“The positioning of this cohort near breakeven levels appears to have moderated incremental sell pressure, contributing to the development of another sideways structure since late January 2026,” “The Week Onchain” continued.
“The defense of the $60k–$69k range suggests that medium-term holders remain resilient, allowing the market to transition from impulsive decline into range-bound absorption.”

New BTC price lows in “next week or so?”
The presence of hodler resilience comes at a crucial time as market participants still expect new macro lows to come next.
Related: Bitcoin price ignores $168M Strategy BTC purchase as Iran tensions escalate
As Cointelegraph reported, Bitcoin traders have little faith in the current range holding as support, with $50,000 now a popular target.
“Expected a quick bounce to reset indicators then straight back down. I still believe 52-53k is coming in the next week or so,” one such forecast from trader Roman stated this week.

An accompanying chart suggested that the indicator “reset” would affect the relative strength index (RSI) and moving average convergence/divergence (MACD) on four-hour time frames.
Earlier, Cointelegraph noted rare lows for weekly RSI, with analysis hinting that such levels were a once-per-cycle phenomenon.
This article does not contain investment advice or recommendations. Every investment and trading move involves risk, and readers should conduct their own research when making a decision. While we strive to provide accurate and timely information, Cointelegraph does not guarantee the accuracy, completeness, or reliability of any information in this article. This article may contain forward-looking statements that are subject to risks and uncertainties. Cointelegraph will not be liable for any loss or damage arising from your reliance on this information.

Trust Wallet, the world’s leading self-custody web3 wallet with over 220 million users, today announced the launch of Cash Deposits in the United States, a new feature that allows users to load physical cash and convert it into digital assets directly inside their Trust Wallet – without a bank account, debit card, or custodial balance.
Powered by Coinme, a leading enterprise crypto infrastructure platform, Cash Deposits enables users to load cash into a digital wallet at over 15,000 retail locations nationwide and receive stablecoins and other digital assets (BTC, SOL etc) directly into their self-custodial wallet.
With this launch, Trust Wallet removes one of the biggest barriers to participating in the digital economy: access to traditional banking.
“Millions of people in the U.S. earn and live on cash, yet most digital financial tools still assume all have a bank account or card,” said Felix Fan, CEO of Trust Wallet.
“Cash Deposits is about meeting these users where they are. If you have cash, you now have a fast, direct way to turn it into digital assets that you fully control – no intermediaries holding your funds, and no reliance on traditional banks.”
Across the United States, millions of people are paid fully or partially in cash, such as gig workers, service workers, and individuals in cash-heavy local economies. For many, opening or maintaining a bank account can be difficult, cards may not be available, and existing cash services can be slow, expensive, or require giving up control of funds.
Cash Deposits removes those barriers. With Trust Wallet, users can now load cash and convert their money to digital assets, enabling them to receive directly into a self-custody wallet they control – unlocking faster payments, easier remittances, and broader access to decentralised and digital finance.
Unlike traditional cash services that rely on banks, cards, or custodial accounts, Cash Deposits enables a direct path from physical cash to a user’s self-custody wallet. Through Coinme’s nationwide retail network, cash is converted into digital assets and delivered straight to the user’s Trust Wallet – without intermediaries holding funds after the transaction is completed.
The supported retail locations are displayed in the Trust Wallet app before users begin, allowing them to view nearby deposit options available through Coinme’s retail network.
“At Coinme, our focus has always been building compliant, nationwide infrastructure that bridges physical cash with digital assets,” said Neil Bergquist, CEO and co-founder of Coinme.
“By powering Trust Wallet’s Cash Deposits feature, we’re enabling that infrastructure to operate seamlessly within a leading self-custody experience, making it simple for users to move from cash to crypto at scale.”
Funds typically arrive within minutes rather than days, giving users faster access to their money while maintaining full control over their assets. Available across 48 U.S. states*, the feature brings national scale to a cash-to-digital experience that has historically been fragmented or inaccessible.
By combining Coinme’s established cash onramp infrastructure with Trust Wallet’s self-custody wallet, the partnership delivers one of the first mainstream, nationwide cash-to-stablecoin experiences within a single app – making digital finance more practical and accessible for everyday users.
*The cash on-ramp is currently available in the U.S. and Puerto Rico, excluding New York and Vermont. Stablecoin purchases are available in supported states, excluding Texas.
About Trust Wallet
Trust Wallet is the secure, self-custody Web3 wallet and gateway for people who want to fully own, control, and leverage the power of their digital assets. From beginners to experienced users, Trust Wallet makes it easier, safer, and convenient for millions of people around the world to experience Web3, access dApps securely, store and manage their crypto and NFTs, as well as buy, sell, and stake crypto to earn rewards — all in one place and without limits.
About Coinme Crypto-as-a-Service
Founded in 2014, Coinme is a leading licensed and regulated provider of an enterprise stablecoin and crypto payments platform. Coinme enables a fully native and seamless stablecoin and crypto payment experience within partners’ web or mobile apps. By integrating with Coinme’s simple API suite, SDKs, and widget, partners can quickly deploy crypto and stablecoin products and services natively while leveraging Coinme’s robust exchange and compliance infrastructure. For more information, please visit https://coinme.com.

TLDR
- Société Générale Forge has launched EUR CoinVertible on the XRP Ledger, expanding its stablecoin to a new Layer-1 network.
- The deployment follows previous integrations on Ethereum and Solana, strengthening the firm’s multi-chain strategy.
- Ripple supports the launch by providing institutional-grade custody and infrastructure services to ensure security.
- The integration on XRP Ledger enhances scalability, reduces transaction costs, and offers a secure decentralized architecture.
- SG-FORGE aims to increase the adoption of its euro-backed stablecoin for trading, payments, and collateral use cases.
Société Générale Forge has launched its euro-backed stablecoin, EUR CoinVertible, on the XRP Ledger. This move expands the stablecoin’s presence, following previous deployments on Ethereum and Solana. The integration into the XRP Ledger strengthens the firm’s multi-chain strategy and enhances the adoption of compliant digital assets across various blockchain networks.
EUR CoinVertible Expands to XRP Ledger
Société Générale Forge has successfully deployed EUR CoinVertible on the XRP Ledger. This launch adds another Layer-1 network to the stablecoin’s ecosystem, which already includes Ethereum and Solana. According to SG-FORGE, the decision to use the XRP Ledger stems from its high-performance capabilities, which can provide faster transactions, lower fees, and a secure decentralized architecture.
Ripple has supported the launch by providing its institutional-grade custody and infrastructure services. This partnership aims to ensure the stablecoin’s seamless integration while maintaining high security standards. Ripple’s technology enables SG-FORGE to enhance the operational and security standards for the stablecoin’s use cases.
SG-FORGE highlighted several key advantages of integrating EUR CoinVertible into the XRP Ledger. The platform’s scalability and low transaction costs are central to its appeal. XRP Ledger’s decentralized infrastructure also ensures a high level of security for institutional users of the stablecoin.
Jean-Marc Stenger, CEO of SG-FORGE, emphasized the firm’s focus on delivering transparent and secure digital assets. “The launch of EUR CoinVertible on XRP is a milestone in our effort to advance regulated digital assets that are compliant and scalable,” Stenger stated. The integration on XRP reinforces SG-FORGE’s commitment to expanding its offering of euro-backed stablecoins for trading, payments, and collateral use.
Ripple’s Role in Expanding EUR CoinVertible Use Cases
Ripple’s involvement in the launch is crucial, as it provides both infrastructure and custody services for EUR CoinVertible. The partnership with Ripple supports SG-FORGE’s strategy of driving the adoption of the stablecoin across various financial and crypto markets.
Cassie Craddock, Ripple’s Managing Director for UK and Europe, remarked that SG-FORGE is at the forefront of creating structured crypto-asset offerings in Europe. “Ripple’s infrastructure has been integral to supporting the launch and ongoing expansion of regulated stablecoins like EUR CoinVertible,” Craddock added. The move to integrate with XRP’s robust platform is expected to unlock new use cases for the stablecoin, such as trading collateral and further integration into Ripple’s product suite.


How to Deal with an Unreasonable Workload

Netflix Has The Only Space Franchise That Hasn’t Been Ruined, Binge It Now
Using AI responsibly means knowing when not to use it


-

 Sports7 days ago
Big Tech enters cricket ecosystem as ICC partners Google ahead of T20 WC | T20 World Cup 2026
-

 Video2 days ago
Bitcoin: We’re Entering The Most Dangerous Phase
-

 Tech4 days ago
Luxman Enters Its Second Century with the D-100 SACD Player and L-100 Integrated Amplifier
-

 Video5 days ago
The Final Warning: XRP Is Entering The Chaos Zone
-

 Sports2 days ago
GB's semi-final hopes hang by thread after loss to Switzerland
-
 Tech2 days ago
The Music Industry Enters Its Less-Is-More Era
-

 Crypto World1 day ago
Can XRP Price Successfully Register a 33% Breakout Past $2?
-

 Business19 hours ago
Infosys Limited (INFY) Discusses Tech Transitions and the Unique Aspects of the AI Era Transcript
-

 Entertainment5 hours ago
Kunal Nayyar’s Secret Acts Of Kindness Sparks Online Discussion
-

 Video1 day ago
Financial Statement Analysis | Complete Chapter Revision in 10 Minutes | Class 12 Board exam 2026
-
 Crypto World7 days ago
Pippin (PIPPIN) Enters Crypto’s Top 100 Club After Soaring 30% in a Day: More Room for Growth?
-
 Crypto World5 days ago
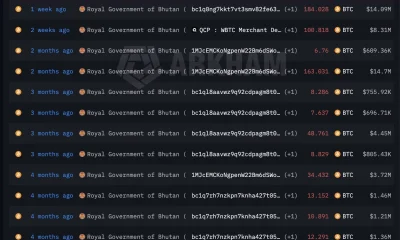
Bhutan’s Bitcoin sales enter third straight week with $6.7M BTC offload
-

 Tech10 hours ago
Retro Rover: LT6502 Laptop Packs 8-Bit Power On The Go
-

 Video7 days ago
Prepare: We Are Entering Phase 3 Of The Investing Cycle
-
 NewsBeat3 days ago
The strange Cambridgeshire cemetery that forbade church rectors from entering
-

 Business6 days ago
Barbeques Galore Enters Voluntary Administration
-

 Business11 hours ago
Tesla avoids California suspension after ending ‘autopilot’ marketing
-
 Crypto World6 days ago
Ethereum Price Struggles Below $2,000 Despite Entering Buy Zone
-
 NewsBeat3 days ago
Man dies after entering floodwater during police pursuit
-

 Crypto World5 days ago
Kalshi enters $9B sports insurance market with new brokerage deal