

Crypto World
Sam Altman’s OpenAI unveils ‘EVMbench’ to test whether AI can keep crypto’s smart contracts safe


OpenAI is stepping deeper into crypto security with the launch of EVMbench, a new testing framework designed to measure how well artificial intelligence can understand and potentially secure smart contracts on Ethereum and similar blockchains.
Smart contracts, self-executing code deployed on blockchains like Ethereum, underpin decentralized exchanges, lending protocols and a wide range of onchain financial applications. Because these contracts are typically immutable once deployed, vulnerabilities can be serious.
EVMbench is OpenAI’s attempt to see whether modern AI systems are up to the task of helping prevent those issues. Built in collaboration with crypto investment firm Paradigm, the benchmark draws on real-world smart contract vulnerabilities previously uncovered through audits and security competitions.
The system measures performance across three core abilities: identifying security bugs, exploiting those bugs in a controlled environment and fixing the vulnerable code without breaking the contracts.
OpenAI says the goal is to establish a clear standard for evaluating AI systems in blockchain security, especially as decentralized finance continues to secure billions of dollars in user funds. The stakes for smart contracts are only rising.
“Smart contracts routinely secure $100B+ in open-source crypto assets. As AI agents improve at reading, writing, and executing code, it becomes increasingly important to measure their capabilities in economically meaningful environments, and to encourage the use of AI systems defensively to audit and strengthen deployed contracts,” OpenAI wrote in a blog post.
Read more: Most Influential: Sam Altman


Pepe Coin price retreated this week, moving from the weekend high of $0.000005030 to the current $0.000004325.
Summary
- Pepe Coin price has formed a giant double-bottom pattern on the daily chart.
- This pattern points to a 150% surge to $0.00001080.
- Pepe’s futures open interest and volume have held steady this week.
The Pepe (PEPE) token remains well above its year-to-date low of $0.0000031, giving it a market capitalization of over $1.78 billion.
The ongoing consolidation is due to the crypto market’s price action, with Bitcoin and most altcoins remaining in a tight range.
However, on the positive side, there are signs that Pepe may be on the cusp of a strong bullish breakout, potentially to the year-to-date high of $0.000072.
Data compiled by CoinGlass show that futures open interest has continued to rise over the past few days, a sign of increased demand among traders betting on a potential rebound.
The futures open interest rose to $262 million, well above the year-to-date low of $200 million. Similarly, Pepe’s daily volume has bounced back from its lowest level this month. It stood at $435 million on Wednesday, much higher than the year-to-date low of $436 million.
Pepe’s volume was much higher than that of other top meme coins. For example, Shiba Inu had a daily volume of $114 million, while Official Trump had $152 million. The elevated volume is also a sign of demand among whale investors.
Pepe Coin price has formed a double-bottom pattern
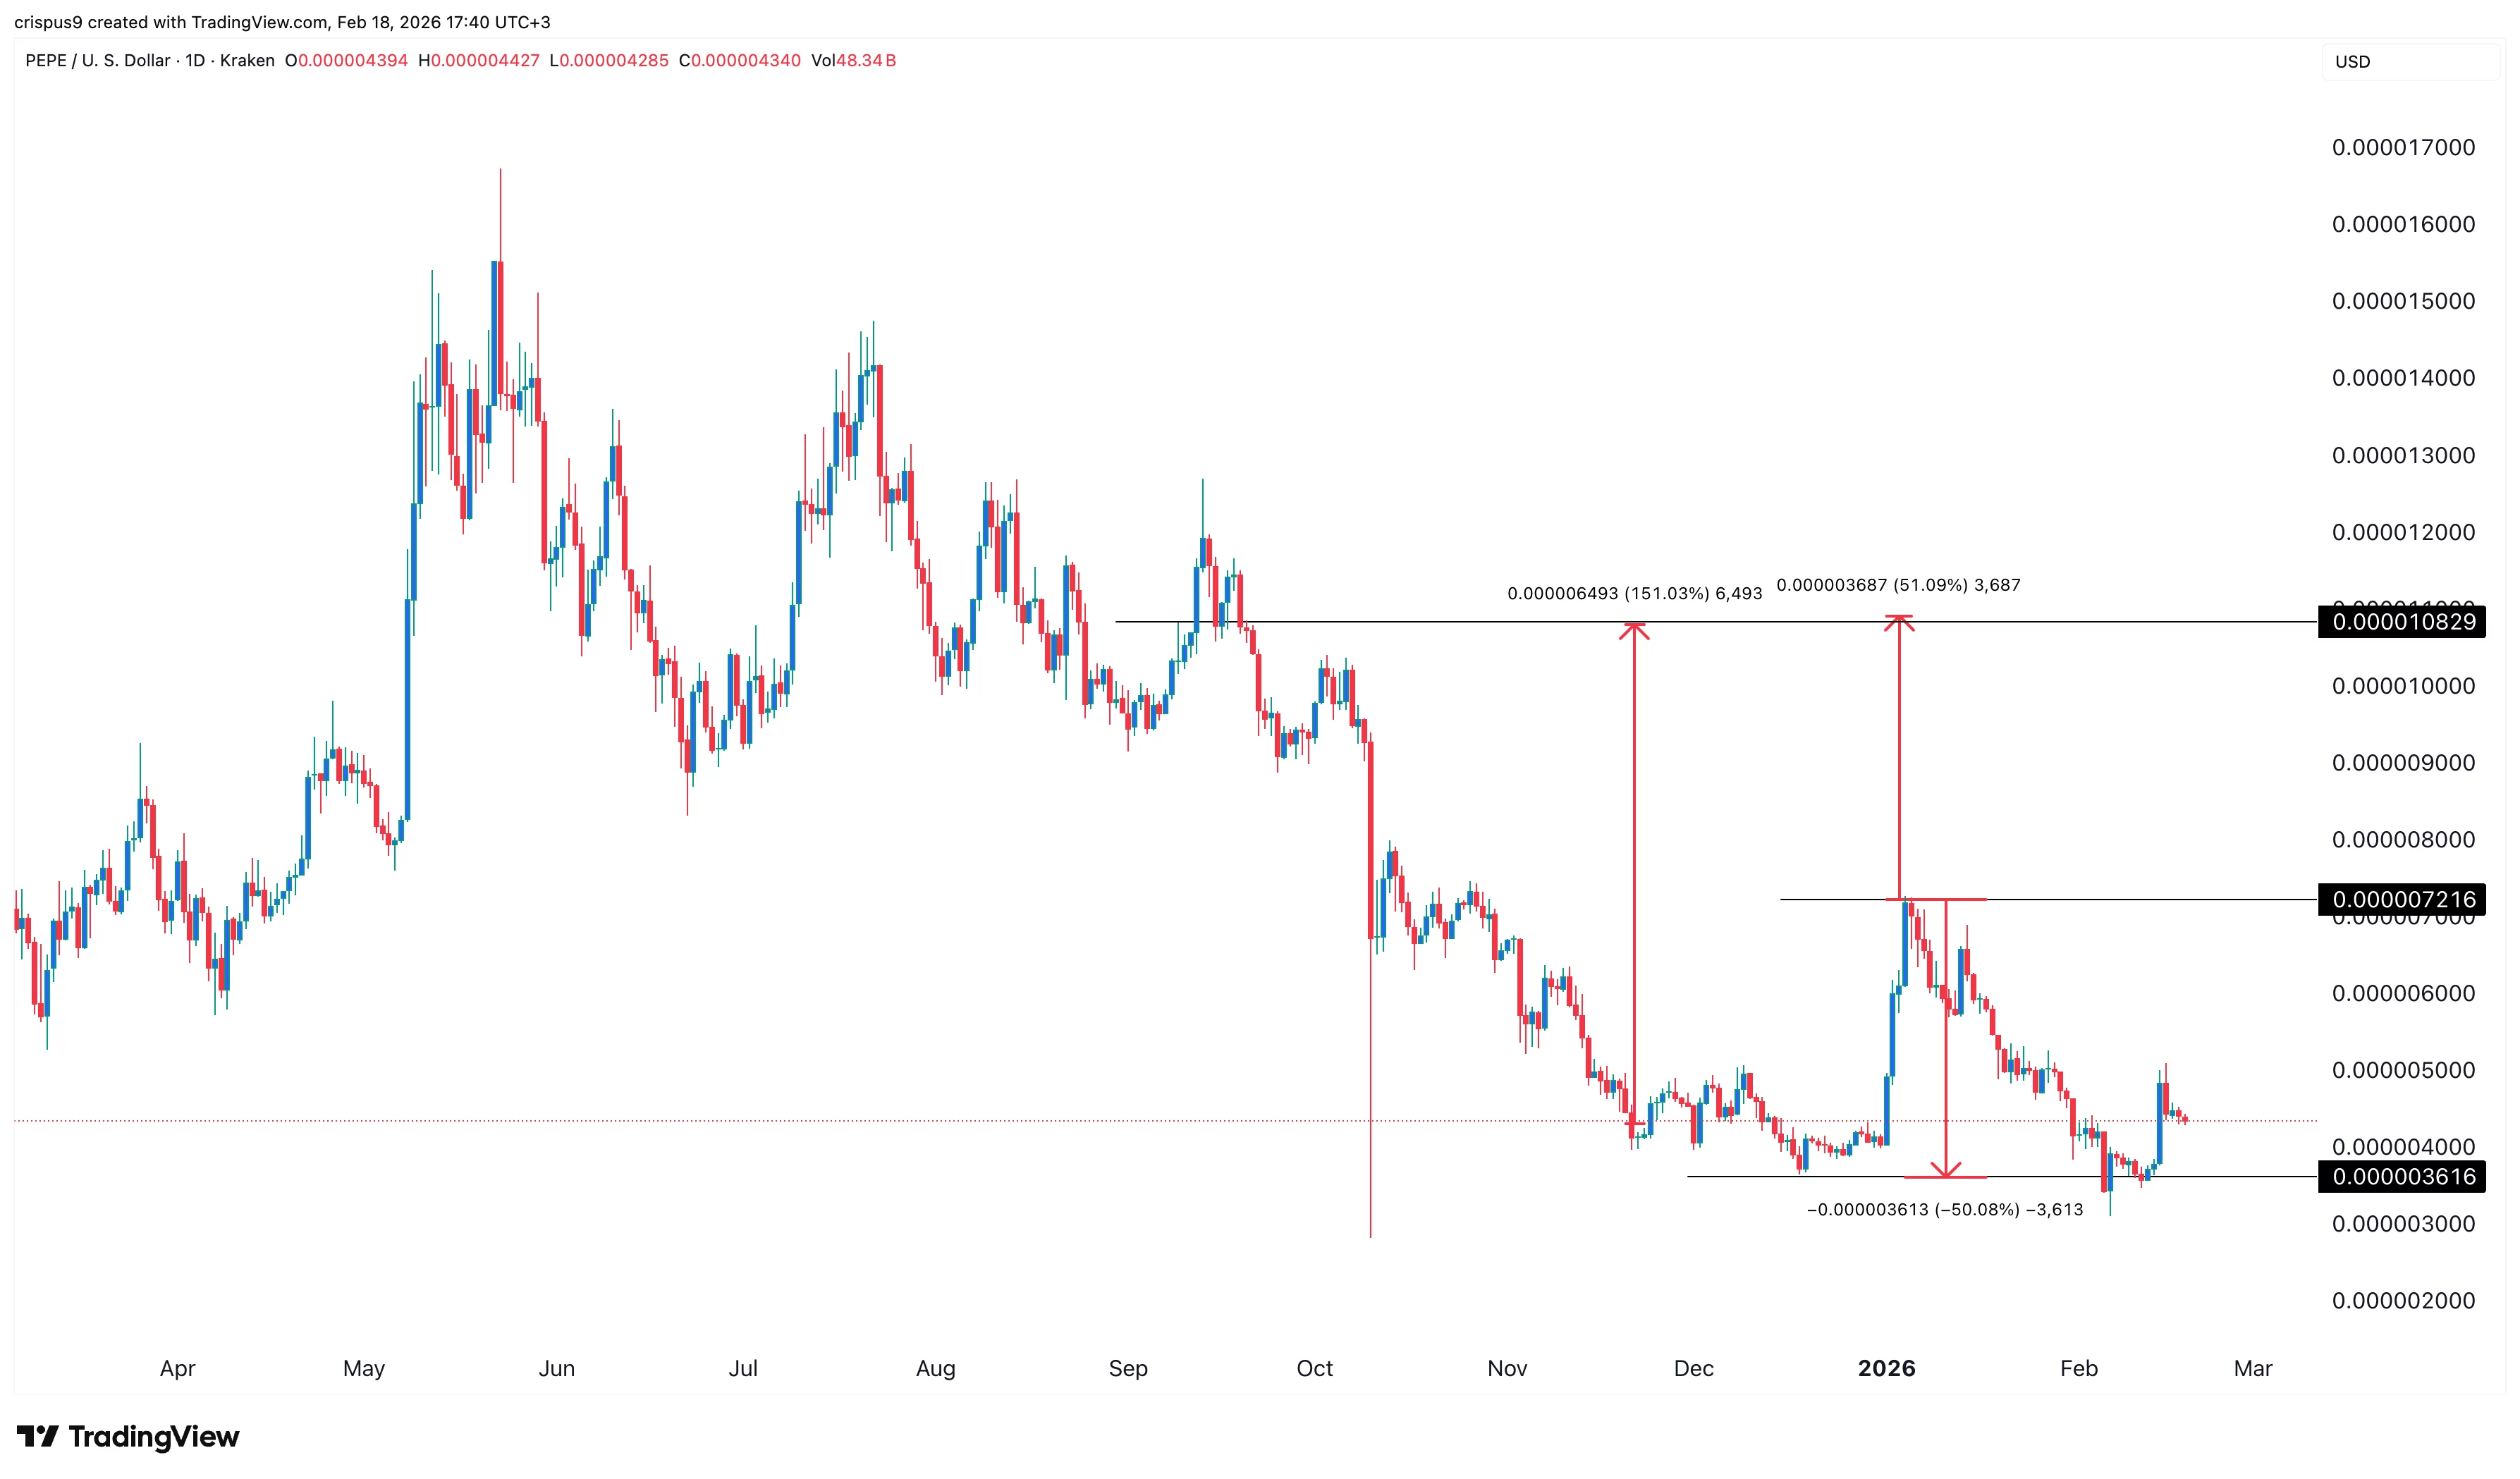
The daily chart shows that Pepe has been in a strong downward trend since 2025 as demand for meme coins waned and most altcoins tumbled.
On the positive side, it has formed a large double-bottom pattern at $0.0000036, its lowest level in December last year and this month.
A double-bottom pattern consists of two low swings and a neckline, which in this case is at $0.0000072. The profit target is determined by first measuring the distance between the neckline and the lower side.
After that, one measures the same distance from the neckline. In this case, Pepe will likely rally to $0.000p1082, up 150% from the current level.
The bullish Pepe Coin price forecast will become invalid if it drops below the double-bottom level at $0.0000036.
Altcoins have endured a pronounced stretch of selling pressure, with net selling totaling about $209 billion since January 2025, underscoring one of the steepest declines in speculative demand this cycle. On major exchanges, activity in the altcoin space has cooled markedly; data indicates a roughly 50% drop in altcoin trading volumes on Binance since late 2025, even as Bitcoin’s presence in the order book has grown. In this environment, market participants appear to be prioritizing the flagship asset, with capital gravitating toward Bitcoin during a sustained downtrend. The shift aligns with broader trends in the crypto market, including rising reliance on dollar-denominated assets as macro headwinds persist.
Key takeaways
- Altcoin net demand, excluding the leading crypto assets, shows a cumulative delta of -$209 billion since January 2025, signaling a persistent withdrawal of spot buyers and highlighting that this metric, while informative about demand balance, does not by itself mark a market bottom.
- On Binance, altcoin spot volumes have collapsed by about 50% since November 2025, while Bitcoin’s share of total exchange volume rose to 36.8% on February 7, with altcoins slipping to 33.6% by mid-February from a peak of 59.2% in November.
- Analysts point to repeated rotations into Bitcoin during corrective phases, with Darkfost noting similar patterns in April 2025, August 2024, and October 2022, when investor capital consolidated into BTC amid drawdowns for risk assets.
- Tether dominance has climbed to an all-time-like level on a weekly basis, hovering near 8% (USDT), a condition historically associated with capital shifting into dollar-pegged assets rather than tokens like BTC or ETH. Prior cycles show that declines in this metric have sometimes preceded renewed upside for Bitcoin.
- The combination of waning altcoin demand and rising stablecoin dominance suggests a risk-off environment where traders favor BTC and stablecoins as macro uncertainties persist and the market absorbs potential regulatory and macro signals.
Tickers mentioned: $BTC, $ETH, $USDT
Sentiment: Bearish
Market context: The current environment shows a clear preference for liquidity and safety over speculative bets on altcoins. With altcoin demand contracting and stablecoin dominance rising, the market signals a reduction in risk appetite as Bitcoin consolidates amid macro headwinds and evolving regulatory considerations. The shift mirrors past cycles where capital moved toward the flagship cryptocurrency as risk-off conditions intensified.
Why it matters
The observed rotation away from altcoins toward Bitcoin and stablecoins has meaningful implications for investors, developers, and market structure. For traders, the data underscores the importance of monitoring liquidity flows and the relative strength of Bitcoin during downturns, rather than simply chasing uncorrelated altcoin narratives. For ecosystem builders, sustained declines in altcoin demand could influence funding dynamics, token performance, and the pace of new project launches, as capital allocations recalibrate in a more risk-off posture. For the broader market, a prolonged shift toward BTC and dollar-pegged assets may affect liquidity distribution, derivatives pricing, and the timing of potential recoveries, making risk controls and diversification more critical in volatile environments.
The trend also emphasizes the value of watching market signals rather than price action alone. While Bitcoin’s price movements remain central to risk sentiment, the degree to which altcoins capitulate or stabilize can shape the pace and breadth of any eventual recovery. In this context, market participants are paying close attention to on-chain and exchange-level indicators, seeking any early signs that a shift in appetite could re-emerge as macro conditions evolve.
What to watch next
- Monitor the pace of altcoin net selling versus BTC-driven inflows to determine whether the current distribution begins to reverse or persists through the next leg of the cycle.
- Track USDT dominance around the 8% level and any moves away from this regime, as shifts could foreshadow changes in risk sentiment and liquidity allocation.
- Observe Bitcoin’s price and volume dynamics for signs of renewed strength or further consolidation near bear-market levels, particularly in relation to market-wide risk-off moves.
- Watch Binance and other major exchanges for changes in altcoin and BTC share of total volume, which can reveal evolving trader preferences during downturns.
- Stay alert for macro or regulatory catalysts that could alter the flow of capital between BTC, ETH, and dollar-pegged assets, potentially reshaping the near-term trajectory for altcoins.
Sources & verification
- CryptoQuant, Altcoin sell-pressure just hit a 5-year extreme — https://cryptoquant.com/insights/quicktake/6994dc07312550148f4ebe22-Altcoin-sell-pressure-just-hit-a-5-year-extreme
- CryptoQuant, Altcoin volumes shrink by 50% as capital rotates back to Bitcoin — https://cryptoquant.com/insights/quicktake/69958a88c876a02133a047bb-Altcoin-volumes-shrink-by-50-as-capital-rotates-back-to-Bitcoin
- TradingView, USDT.D chart data — https://in.tradingview.com/symbols/USDT.D/
- Cointelegraph, New Bitcoin whales are trapped underwater, but for how long? — https://cointelegraph.com/news/new-bitcoin-whales-are-trapped-underwater-but-for-how-long
- Cointelegraph, Wells Fargo tax refunds YOLO trade driving Bitcoin and risk assets — https://cointelegraph.com/news/wells-fargo-tax-refunds-yolo-trade-bitcoin-stocks-150b
Altcoin demand wanes as capital rotates back to Bitcoin and stablecoins rise
Bitcoin (CRYPTO: BTC) activity began to draw a larger slice of total exchange volume as altcoins retrenched, a trend reinforced by the wider market’s risk-off posture. While the market previously witnessed heightened attention to altcoins during bullish phases, the latest data show a clear tilt away from the broader altcoin complex toward the flagship asset. The shifts in volume and demand are not only a reflection of price moves but a signal of how market participants are prioritizing liquidity and safety in uncertain times.
Ether (CRYPTO: ETH) and other altcoins have experienced a decline in both trading interest and net demand, with the combined effect being a tight supply of buyers in the spot market. This is not a simple bottom indicator; rather, it reflects a fundamental reallocation of capital, where risk-on bets in lesser-known tokens give way to a more conservative stance. The data from centralized exchanges shows a persistent exodus from altcoin markets over the past year, with the most pronounced outflows occurring in the current downcycle, as traders reassess risk and position for potential macro triggers.
At the same time, the dominance of dollar-pegged assets remains elevated. USDT, a primary stablecoin, has reached levels reminiscent of prior multi-month highs, a condition that typically accompanies a preference for liquidity and ready-to-deploy capital in times of uncertainty. The dynamic has historically been associated with a cautious stance among traders, as they seek to preserve value while awaiting clearer directional cues from macro data, regulatory updates, or shifts in market sentiment.
In this context, the market has shown a pattern of capital rotations: investors move money into Bitcoin amid broad market weakness, then re-evaluate altcoin exposure as conditions stabilize. While such rotations do not guarantee a resumption of altcoin strength, they set the stage for potential re-entry if liquidity returns and risk appetite improves. The ongoing narrative emphasizes the intertwined nature of liquidity, risk sentiment, and asset selection within the crypto market, with Bitcoin acting as a focal point for funding during downturns and stablecoins serving as a practical store of value and liquidity during periods of uncertainty.

Bitwise exec said that Aave’s governance proposal stands out as a positive development for DeFi during the crypto downturn.
Even after four months since the massive slump from a record price above $126,000, sentiment surrounding Bitcoin remains fragile. Its failure to bounce back has intensified fears about another crypto winter.
But Matt Hougan, Chief Investment Officer at Bitwise, believes that decentralized finance could play a central role in leading the market out of the current bear phase, as investors increasingly focus on fundamentals such as real users, revenues, and sustainable value.
Aave at the Center
In a recent post, Hougan spoke about a governance proposal published by Aave Labs, the team behind the Aave lending protocol, titled “Aave Will Win,” as an example of why DeFi may be entering a new phase. According to Hougan, DeFi protocols like Uniswap and Aave already function as serious businesses. Uniswap, at times, handles more spot trading volume than Coinbase, while Aave generates more than $100 million annually in revenue.
Despite this, DeFi-related tokens have underperformed, largely because most were designed as governance tokens that offer voting rights but no direct claim on protocol revenues. Hougan explained that this structure emerged as a defensive response to regulatory pressure, particularly from the US Securities and Exchange Commission (SEC), which used the Howey test to assess whether tokens could be classified as securities.
The Bitwise exec noted that Aave attempted to address this issue through its “Aavenomics” upgrades in 2024 and 2025, which introduced token buybacks funded by protocol fees. But tensions continued because Aave Labs could still direct some revenues to itself, a point that drew attention in December 2025 when it allocated $10 million in swap fees to the company.
The new “Aave Will Win” proposal seeks to resolve this by committing Aave Labs to route 100% of revenue from all Aave-branded products, including its website, mobile app, card, and institutional services, directly to the DAO treasury controlled by token holders. In return, Aave Labs would receive a funding package of stablecoins, Aave tokens, and milestone-based grants of around $50 million to cover development of Aave V4 and the transfer of intellectual property to the community, while a new foundation would hold the Aave brand and trademarks.
This would effectively transform the Aave token from a governance-only role toward an asset with a direct claim on revenues, while positioning the founding team as a service provider accountable to token holders, Hougan said.
You may also like:
Pushback
The proposal has drawn criticism from some community members who view the funding request as excessive or argue that certain elements are bundled together. Others also point to unresolved questions around how revenue will be defined and controlled.
While deeming those concerns “legitimate,” Hougan said that Aave’s move may result in other assets following suit.
SECRET PARTNERSHIP BONUS for CryptoPotato readers: Use this link to register and unlock $1,500 in exclusive BingX Exchange rewards (limited time offer).
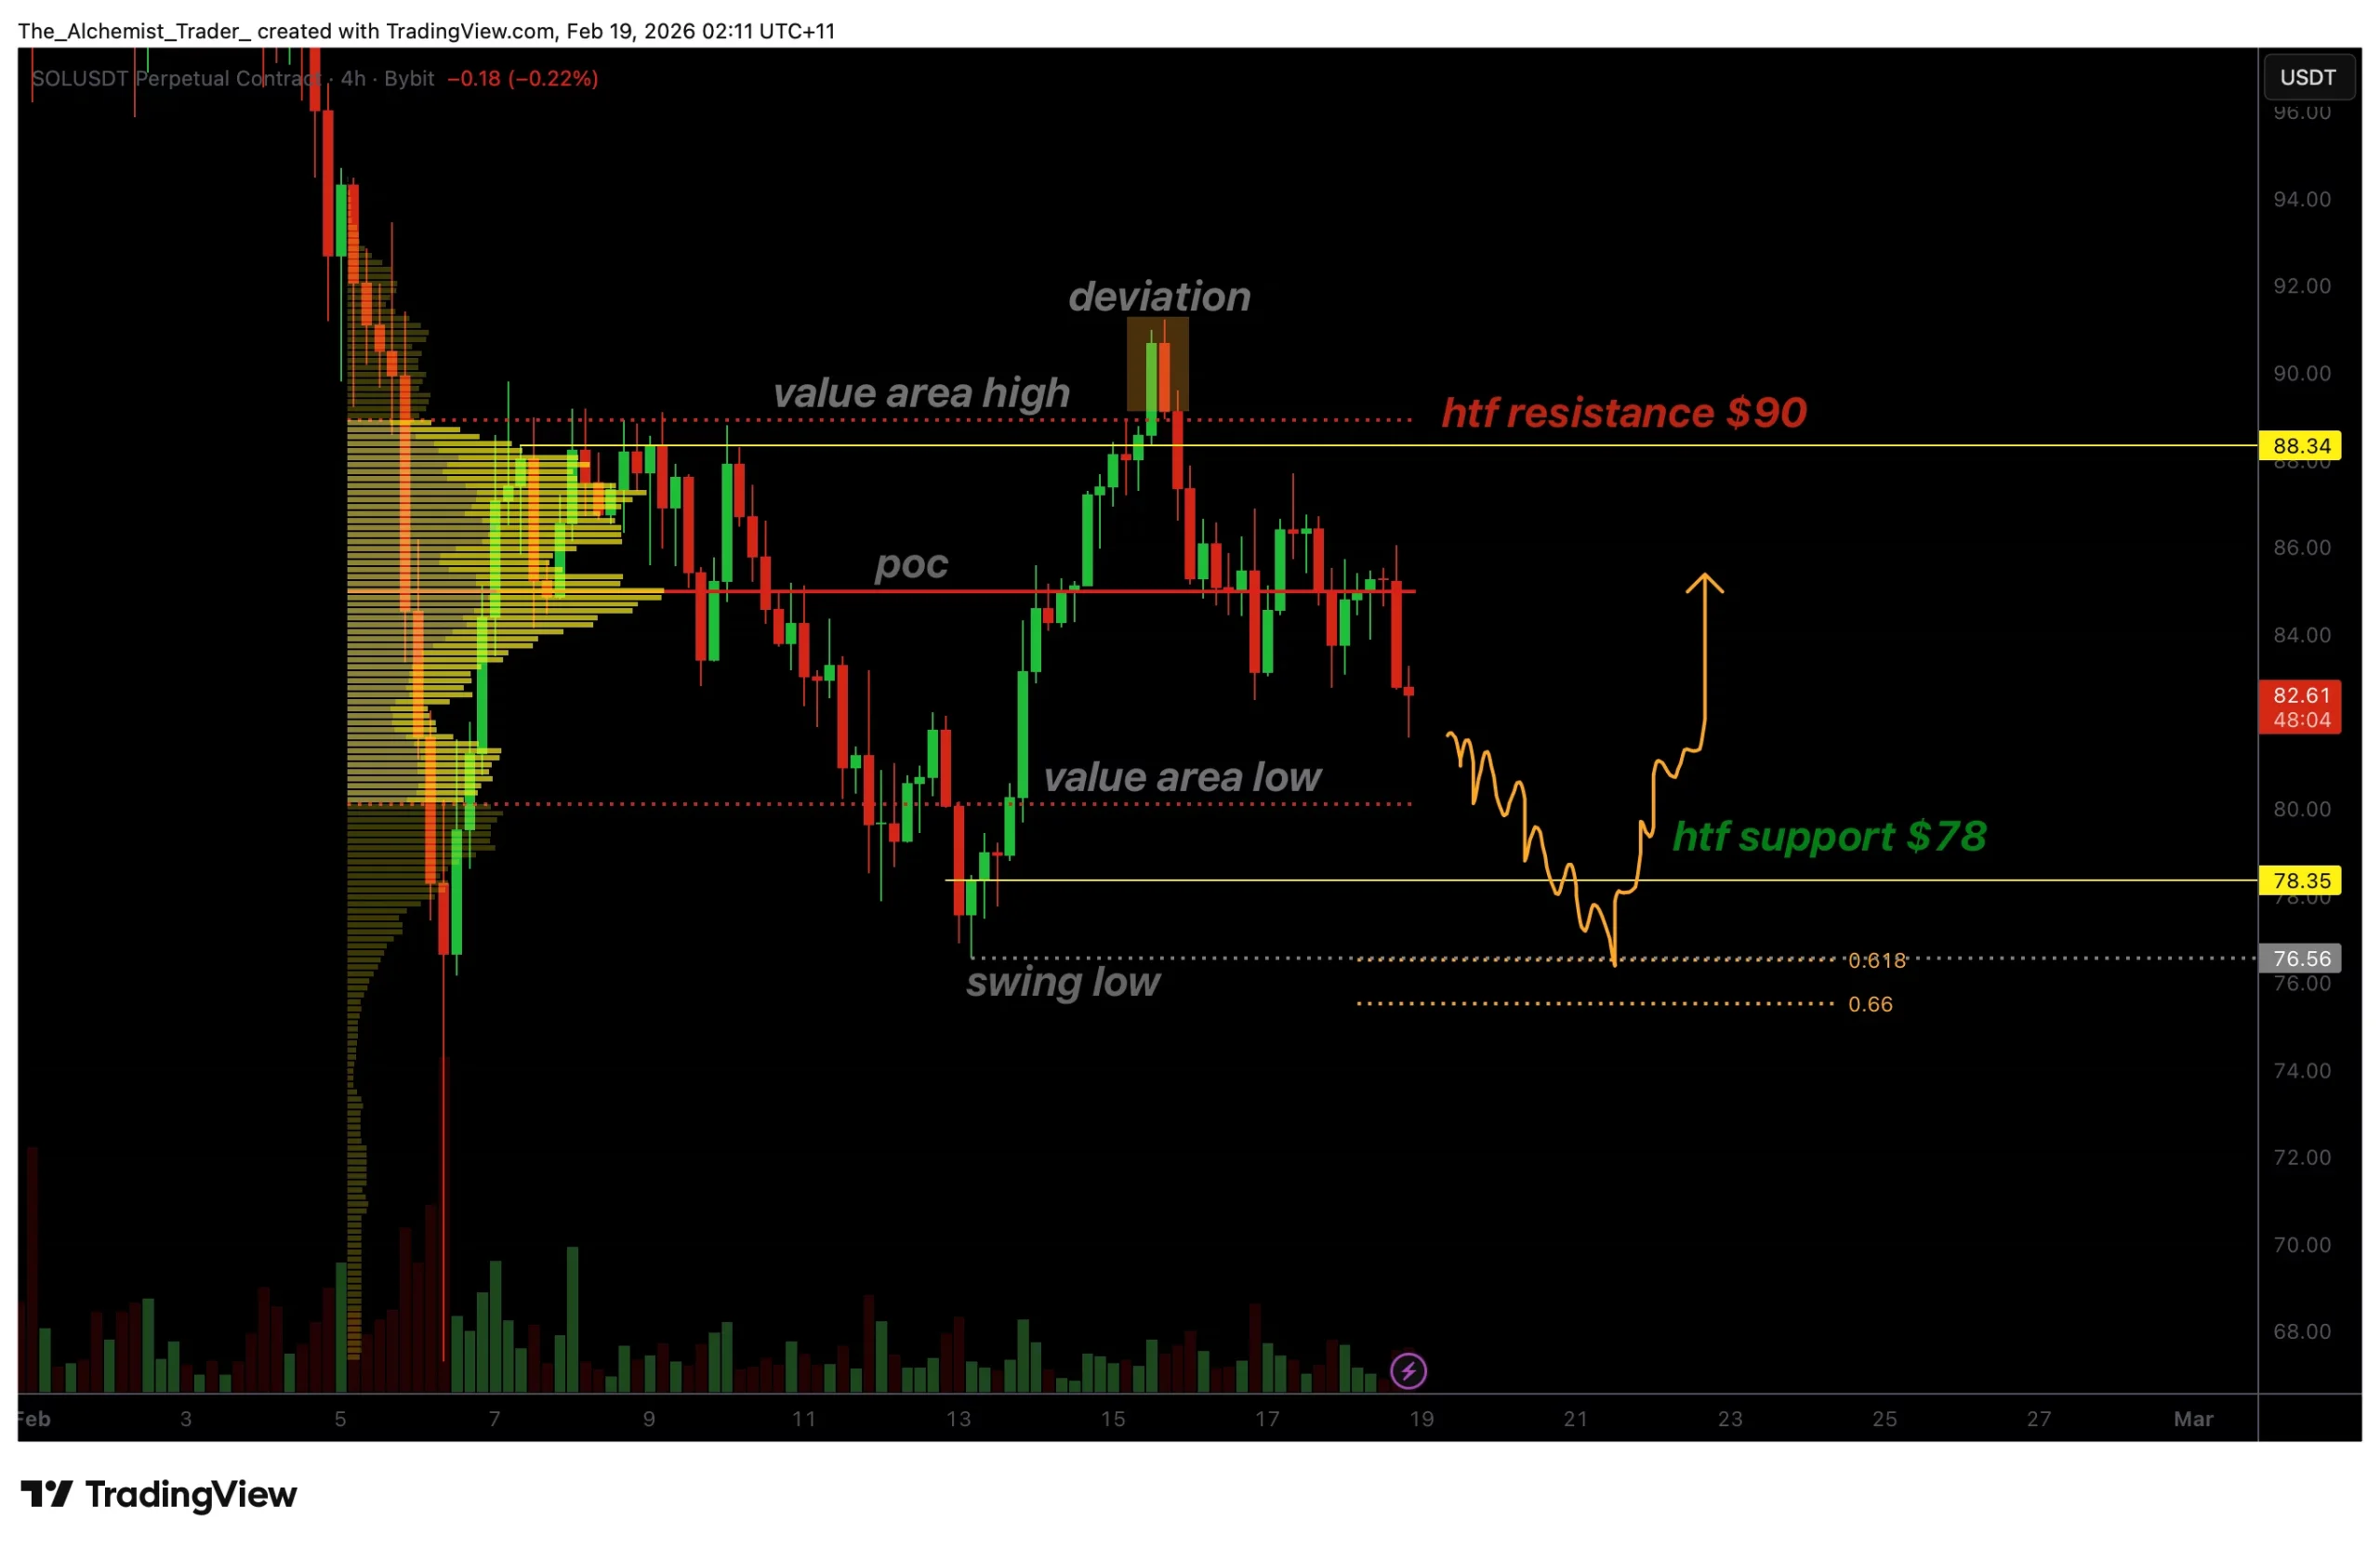
Solana’s price is showing renewed downside risk after bearish engulfing candles rejected key resistance, with weakening market structure increasing the likelihood of testing sub-$80 support levels.
Summary
- Bearish engulfing candles confirm rejection at the key $90 resistance
- Loss of the point of control signals weakness, favoring further downside
- $78–$80 support is the critical zone, with Fibonacci and liquidity confluence
Solana (SOL) price action has shifted back into a vulnerable technical position after a failed attempt to reclaim higher resistance. What initially looked like a potential stabilization has now turned into renewed weakness, as sellers regain control after a rejection at a key resistance zone. The broader structure remains corrective, and recent candlestick behavior suggests that downside continuation is becoming increasingly likely.
As price trades back below important value levels, attention is now turning to high-timeframe support zones that could come into play in the near term. Whether these levels hold or fail will determine if Solana can stage a meaningful bounce or if the correction deepens further.
Solana price key technical points
- Bearish engulfing candles rejected $90 resistance, reinforcing seller control
- Loss of the point of control signals weakness, favoring rotation lower
- $78–$80 support zone aligns with Fibonacci confluence, acting as a key downside target

Solana recently attempted to push above the $90 resistance level, but the move failed to gain traction. Price quickly closed back below resistance, forming bearish engulfing candles that invalidated the breakout attempt. These engulfing structures are significant because they often reflect aggressive selling pressure entering the market when buyers lose control.
The rejection from resistance is further reinforced by Solana’s inability to hold above the point of control (POC). Multiple counter-trend closes below this level indicate that the market has shifted away from balance and back into bearish momentum. When price loses the POC after a failed breakout, it often signals the start of a deeper corrective rotation.
Loss of value opens path toward $78 support
With price now trading below the point of control, the next logical downside magnet is the value area low. This level defines the lower boundary of fair value within the current range and frequently acts as a target during corrective phases.
Below the value area low sits high-timeframe support around $78, which also marks the lower edge of the broader trading structure. A move into this region would place Solana below the $80 psychological level, increasing volatility as traders reassess risk.
From a technical perspective, the $78 area carries additional significance due to its alignment with the 0.618 Fibonacci retracement. Fibonacci confluence often attracts price during corrective moves, particularly when paired with visible resting liquidity.
Liquidity sweep or deeper breakdown?
The swing low near $78 indicates an area with likely resting liquidity. Markets often dip into such zones to trigger stop-loss orders before deciding on the next directional move. If Solana quickly trades into this region and then reclaims it with strong buying interest, the move could resemble a liquidity sweep, setting the stage for a reactive bounce.
However, timing and structure will be critical. A slow grind lower, or prolonged acceptance below $78, would weaken the bounce thesis and suggest that a deeper corrective phase is unfolding. In that scenario, the market would be signaling that buyers are not yet ready to defend key support.
Broader market structure remains corrective
From a market structure standpoint, Solana has not yet invalidated its bearish bias. Lower highs remain intact, and recent attempts to reclaim resistance have failed. Without a decisive reclaim of value and strong bullish volume, rallies should continue to be treated as corrective rather than trend-changing.
The presence of bearish engulfing candles at resistance adds further weight to this view, as such patterns often precede continuation lower rather than immediate reversal.
What to expect in the coming price action
From a technical, price-action, and market-structure perspective, Solana is likely to continue rotating lower in the short term. As long as the price remains below the resistance and the point of control, the probability favors a move toward the value area, low and high-timeframe support near $78.
Traders should closely monitor price behavior around this zone. A sharp reaction and reclaim could trigger a short-term relief bounce, while sustained trading below $80 would increase the risk of a deeper correction.
Until bullish acceptance returns above key value levels, downside risks remain elevated, and Solana’s next meaningful move is likely to be defined by how the price reacts at sub-$80 support.


Short-term Bitcoin buyers are becoming cautious, and accumulation is slowing even as net positions stay positive.
Bitcoin climbed above $126,000 in early October and recently crashed to $60,000 before a modest recovery near $68,000. Despite the brutal swing, many entities are still buying the asset, betting on a much-anticipated price appreciation.
But a certain cohort of BTC holders has reduced this pace.
Demand Deceleration
Data shared by Alphractal revealed that the Short-Term Holder Net Position Change over 90 days is declining, despite remaining in positive territory. This means that while short-term holders are still accumulating Bitcoin, the pace of accumulation has slowed sharply in recent days.
According to the analytics platform, this deceleration points to weakening short-term demand momentum and has historically preceded periods of market consolidation, increased volatility, or broader regime transitions.
Against this backdrop, Alphractal founder Joao Wedson said that recent institutional buying has not translated into stronger short-term holder demand.
“Even with the news of Strategy accumulating and other institutional entities increasing their positions, Short-Term Holders are not accumulating at the same pace as they were 90 days ago. Analyzing a few isolated entities is not enough. The correct approach is to evaluate the entire Bitcoin blockchain to understand the true underlying demand”
Whale Holdings Differ
Separate analysis from CryptoQuant points to a contrasting trend among large Bitcoin holders. It found that whale accumulation has increased by more than 200,000 BTC.
Although whale inflows to exchanges have risen recently, which is often associated with short-term selling activity, their overall holdings have continued to grow. To capture a more medium-term perspective, the analysis tracks whale-held supply using monthly averages rather than short-term flows. After this metric fell sharply to nearly -7% on December 15, whale behavior appears to have changed over the past month, as evidenced by holdings increasing by 3.4%.
You may also like:
During this period, the amount of Bitcoin held by whales rose from around 2.9 million BTC to over 3.1 million BTC. The last time an accumulation of this scale occurred was during the April 2025 market correction, when whale buying helped absorb selling pressure and Bitcoin’s advance from $76,000 to $126,000. CryptoQuant explained that the crypto asset is currently consolidating almost 46% below its most recent all-time high. Hence, some whales may be taking advantage of this opportunity.
SECRET PARTNERSHIP BONUS for CryptoPotato readers: Use this link to register and unlock $1,500 in exclusive BingX Exchange rewards (limited time offer).
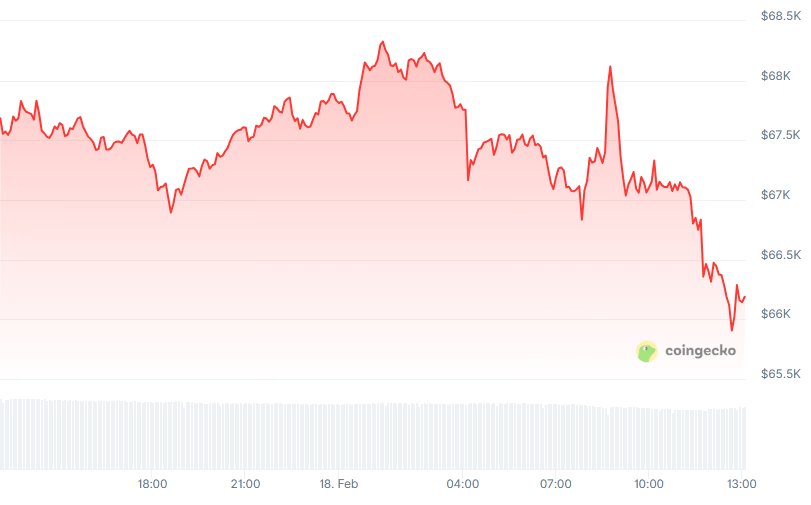
Hedera has posted a muted recovery in recent sessions. HBAR price remains constrained by cautious sentiment across the broader cryptocurrency market. Uncertainty in Bitcoin and macro conditions continues to cap upside attempts.
However, bearish traders may need to monitor changing signals. Derivatives positioning and capital flow indicators suggest the current balance could shift.
Sponsored
Hedera Traders Could Be In Trouble
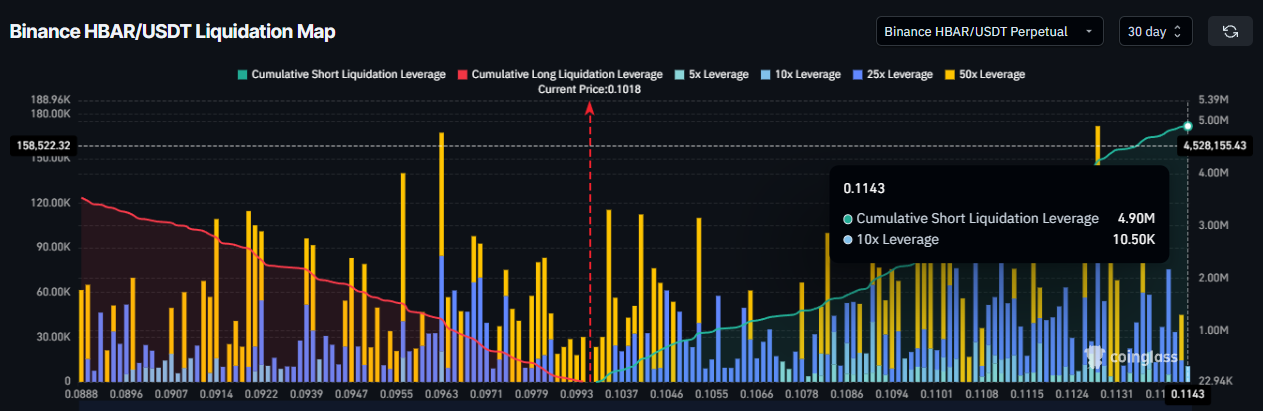
HBAR is currently experiencing strong bearish positioning in the futures market. Traders have opened a notable number of short contracts, reflecting expectations of further downside. The liquidation map highlights that positions are skewed toward bears at current levels.
Data shows that HBAR bears could face approximately $4.9 million in liquidations if the price crosses the $0.1143 mark. Such forced liquidations can trigger rapid upside volatility. When short positions unwind, buying pressure increases as traders close contracts.
Want more token insights like this? Sign up for Editor Harsh Notariya’s Daily Crypto Newsletter here.

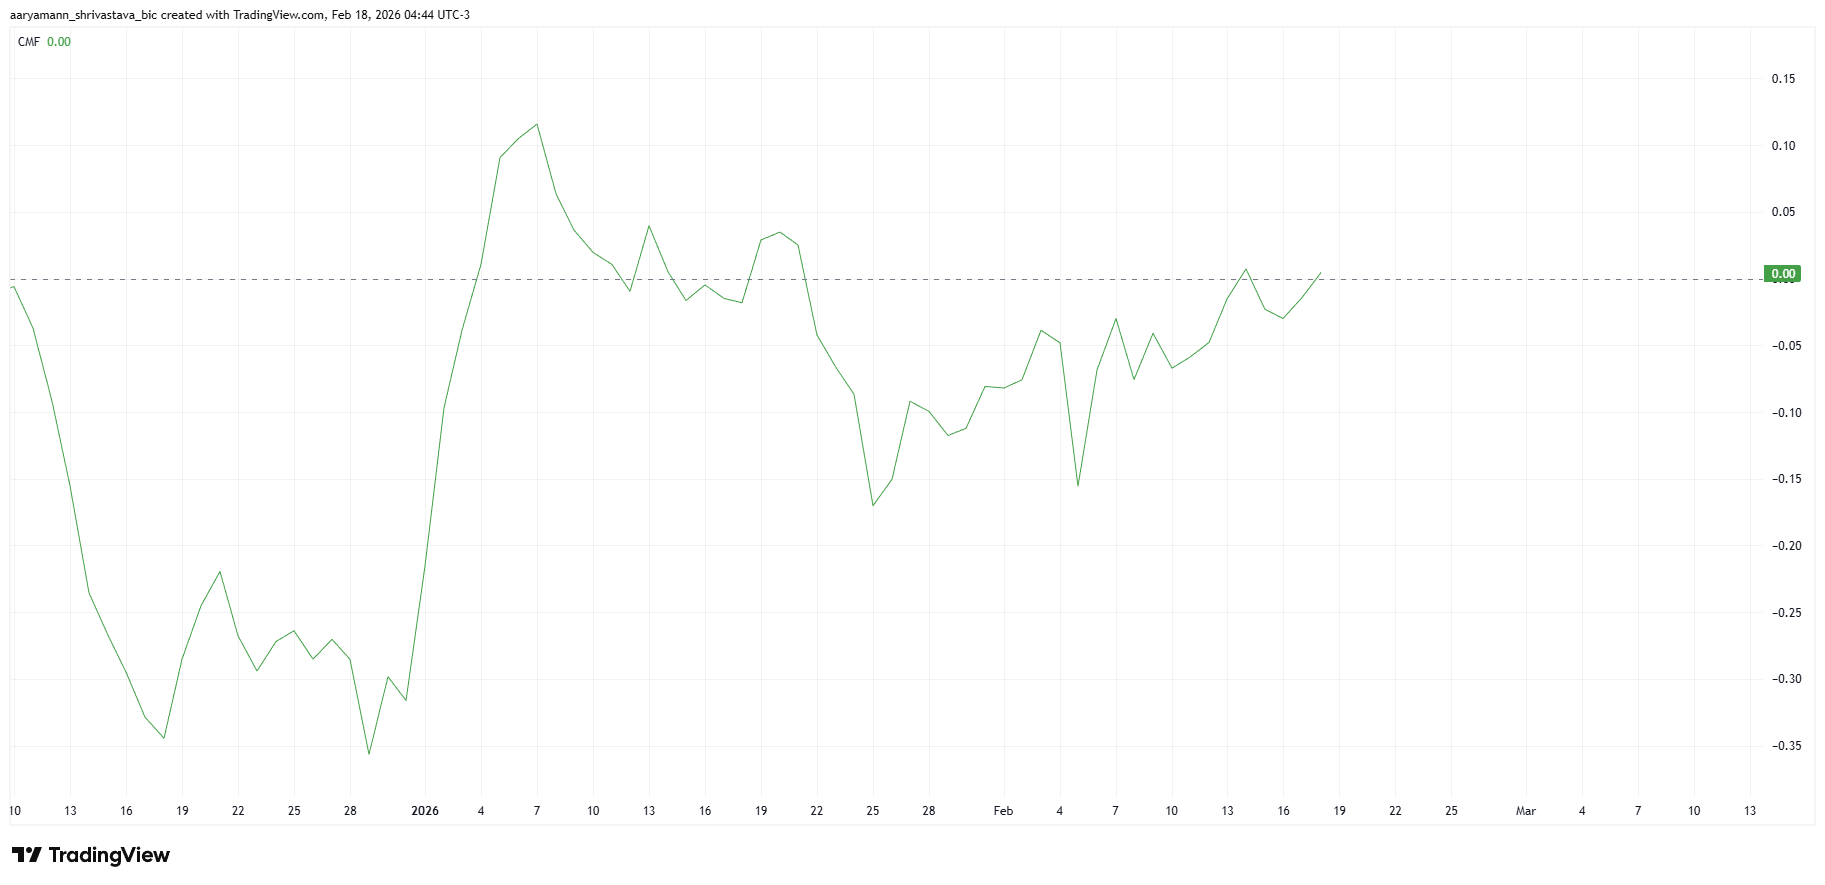
The Chaikin Money Flow indicator offers additional insight into capital movement. CMF measures inflows and outflows to assess whether buyers or sellers dominate. The indicator is currently rising, although it remains at the zero line.
Sponsored
An upward slope at zero suggests that outflows are at par with the inflows. However, the gap will likely diminish as inflows rise. Declining outflows often precede a shift toward net inflows. If this transition occurs, HBAR could gain the support needed for a short-term recovery.
Bitcoin Is Unhelpful
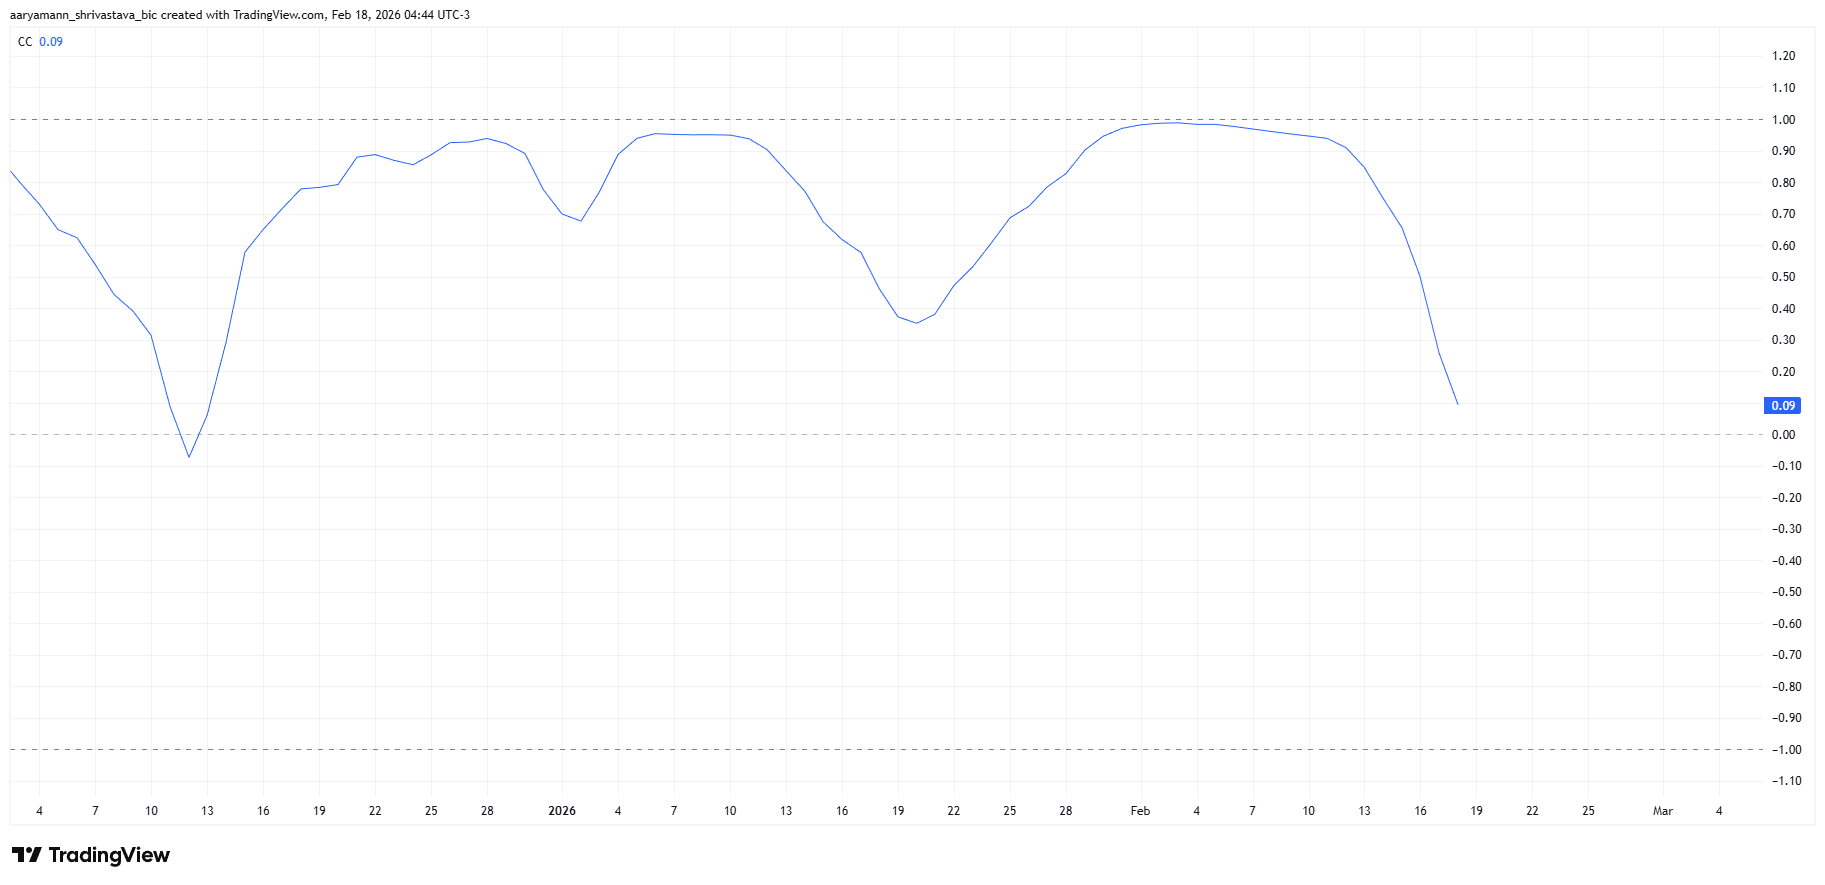
Correlation trends also support a potential shift. HBAR’s correlation with Bitcoin has declined in recent weeks. The current coefficient has dropped to 0.09, signaling weaker alignment with the crypto market leader, inching closer to completely dissociating with Bitcoin.
Sponsored
Reduced correlation can benefit altcoins during periods of Bitcoin uncertainty. If HBAR decouples further, price action may reflect investor-specific demand rather than broader market weakness. This flexibility could allow HBAR to chart an independent recovery path.
HBAR Price Has a Few Barriers To Breach
HBAR is trading at $0.1019 at the time of writing. The altcoin remains above the key $0.0961 support level at the 38.2% Fib line. However, it faces resistance at $0.1035, which aligns with the 50% Fibonacci retracement. This level currently caps upward momentum.
Sponsored
Flipping $0.1035 into support would mark a short-term breakthrough. Combined with declining outflows, this shift could fuel a recovery rally. HBAR would then target $0.1109 at the 61.8% Fibonacci.
This level is considered a critical support for an asset, and flipping it would likely trigger stronger buying among the investors, pushing the HBAR price higher.
This would bring HBAR past $0.1143, a level that threatens $4.9 million in shorts liquidations. Sustained strength could extend gains toward $0.1215 and $0.1349 eventually, helping recover year-to-date losses.

If bullish signals fail to materialize, consolidation may continue. Persistent outflows would limit breakout attempts. A breakdown below $0.0961support could expose HBAR to further downside near $0.0870. Such a move would invalidate the near-term bullish outlook and reinforce bearish control.


Payward, the parent company of cryptocurrency exchange Kraken, has acquired tokenization platform Magna, expanding the company’s infrastructure.
Kraken said Wednesday the acquisition would allow Magna to operate “as a standalone platform, powered by” the crypto exchange. The company’s announcement said Kraken would use the platform for “onchain and offchain vesting, white-label token claims, custody and escrow workflows, specialized staking functionality” and other functions.
“Joining Kraken gives us the resources to support existing and new clients with institutional-grade infrastructure, deeper liquidity, and global distribution,” said Magna CEO Bruno Faviero.
According to Kraken, Magna serves more than 160 clients with a peak total value locked of $60 billion in 2025. The acquisition is the latest move by the exchange this month, following an integration with ICE Chat, and its move to sponsor “Trump Accounts” under an initiative pushed by US President Donald Trump.
Related: Kraken parent Payward revenues jump 33% as crypto traders pile in
Kraken submitted a confidential initial public offering filing with the US Securities and Exchange Commission in November, signaling a potential IPO in the future. The company reported $2.2 billion in adjusted revenue for 2025.
In 2025, Payward acquired crypto native prop company Breakout, futures trading platform NinjaTrader, derivatives trading platform Small Exchange and software company Capitalise.
Other crypto companies mulling US IPOs in 2026
Crypto hardware wallet provider Ledger, headquartered in France, was reportedly discussing a potential public offering in the United States, with a valuation of $4 billion. Digital asset custodian Copper, based in London, was also reportedly considering a similar move into the US markets, while Securitize, a tokenization platform, reported in January that the company’s revenues were up over 840%, in an SEC filing ahead of plans to go public.
Magazine: IronClaw rivals OpenClaw, Olas launches bots for Polymarket — AI Eye

TLDR:
- SUI is trading near $0.95, sitting just below Weekly Hypertrend resistance positioned around the $1.00 level.
- The weekly RSI has entered oversold territory, with approximately 50% of the October 10 liquidation wick now filled.
- Past weekly oversold signals for SUI led to expansions of 503% in October 2023 and 837% in August 2024 respectively.
- The Genesis AVWAP near $2.00 defines long-term macro positioning, while reclaim and volume confirmation remain the key requirements.
SUI is drawing renewed attention from analysts as the asset trades near $0.95. The token sits just below a key Weekly Hypertrend level around $1.00.
Market observers note that the RSI has entered oversold territory on the weekly chart. Early momentum divergence signals are beginning to appear.
The broader macro structure remains upward sloping since genesis. Traders are now watching for confirmation before positioning.
Technical Levels Point to a Compressed Setup
SUI is currently trading just below the Weekly Hypertrend resistance near $1.00. This level has acted as a structural ceiling in recent price action.
The RSI entering oversold territory on the weekly timeframe adds weight to the current setup. Analysts are watching whether momentum divergence will develop into a confirmed reversal signal.
According to market commentary from eye zen hour, approximately 50% of the October 10 liquidation wick has now been filled. This kind of wick fill often reflects a controlled recovery in price structure.
On-balance volume, or OBV, remains a key indicator to monitor at this stage. A curl back above its moving average could support the case for trend continuation.
The Genesis AVWAP sits near the $2.00 level and continues to define long-term positioning for SUI. This anchored volume-weighted average price from genesis serves as a macro reference point.
Price remains well below that level, meaning there is room for expansion if structure confirms. Traders are treating the $2.00 area as a longer-term target, not an immediate one.
Eye zen hour noted in a recent post that the current phase is “setup phase, not breakout phase.” That framing keeps expectations grounded without dismissing the structure building beneath price.
Until a Weekly Hypertrend reclaim occurs with participation, the setup remains unconfirmed. This distinction is important for risk management at current levels.
Historical Oversold Signals Offer Raw Data for Context
SUI has produced weekly oversold readings before, and the outcomes were notable both times. The October 2023 oversold signal was followed by a price expansion of 503%.
The August 2024 signal led to an 837% move higher from the oversold condition. These figures are cited as raw historical data, not as forward projections.
Eye zen hour was clear in stating these are “not predictions, just raw data.” That framing separates observation from speculation, which matters in volatile markets.
Still, the historical context gives traders a framework for understanding how the asset has behaved. Pattern recognition remains one tool among many in technical analysis.
The macro structure for SUI since genesis continues to slope upward, according to the analysis. Momentum is currently stretched to the downside, and structure appears compressed.
These two conditions together often precede volatility expansion in either direction. Confirmation through reclaim and volume participation remains the key requirement before any directional bias is established.


- Dogecoin struggles below key moving averages, signaling weak short-term trend.
- A cup and handle pattern is forming, hinting at a potential breakout if the resistance breaks.
- Support lies near $0.08, with higher volume needed for a sustained upward move.
Dogecoin is hovering around the $0.10 mark after a shaky month that saw the price dip over 20%.
The popular meme coin has struggled to hold momentum, with trading volumes showing signs of weakness.
Even so, there are hints in the charts that a rebound could be forming.
Technical analysis
Looking at the moving averages, DOGE is currently below the 5-day, 10 and 20-day averages.

This typically signals that the short-term trend is weak.
Traders often watch for the price to climb above these averages as an early sign of bullish momentum.
Right now, resistance is in the $0.105–$0.107 range.
A break above this level would be an important signal for those hoping for a recovery. The MACD indicator is also showing mixed signals.
The MACD line has moved above the signal line despite both being in the negative, and the histogram has turned positive, suggesting that buyers are beginning to step in after a period of inactivity.
However, volume is still modest. A strong breakout would require significantly more trading activity than the roughly $33 million seen recently.
Support remains solid at around $0.08, which has already acted as a bounce point.
This level has prevented further sharp declines and could continue to anchor the price if bearish pressure returns.
Cup and handle pattern points to possible upside
On the daily chart, Dogecoin is forming a classic Cup and Handle pattern.
The Cup bottomed near $0.08 and then rallied toward $0.11.
The Handle is now forming near the top of the Cup, consolidating just below resistance.

This formation often precedes a breakout when the price moves above the Handle.
If Dogecoin can clear this resistance, it could push toward higher levels, reigniting optimism among traders.
Chart patterns like this are watched closely because they combine both support and momentum signals.
They show where traders are willing to buy and where sellers may step in.
In Dogecoin’s case, the pattern suggests that there is still potential for upside, but it won’t happen without stronger buying interest.
Volume and momentum will be key to confirming the breakout. Traders are likely waiting for both to pick up before committing heavily.
Even with these early bullish signs, caution is warranted.
The market has been volatile, and DOGE has lost significant value over the past year. Short-term gains are possible, but the overall trend remains fragile.
The selloff continues as tensions in the Middle East rise and the Department of Homeland Security remains partially shut down.
Crypto markets slipped further on Wednesday, Feb. 18, as political and macroeconomic uncertainty continued to weigh on sentiment.
Bitcoin (BTC) is trading at $66,344, down 2.5% over the past 24 hours, while Ethereum (ETH) is at $1,953, down 2.3%. Separately, Founders Fund, a venture firm tied to billionaire Peter Thiel, disclosed it had exited its entire 7.5% stake in Ethereum treasury company ETHZilla Corp. last year, according to a recent SEC filing.

Other large-cap tokens were also lower, with BNB down 2% near $610, XRP down 3% to $1.44, and Solana (SOL) down 4.5% to $81.
Meanwhile, the total cryptocurrency market capitalization stood near $2.37 trillion, down 2% over the past 24 hours. Daily trading volume was around $88.5 billion, according to CoinGecko.
Among top gainers, World Liberty Financial (WLFI) rose 15.7%, following news of top Wall Street CEOs preparing to headline at the World Liberty Forum.
Cosmos Hub (ATOM) also climbed 6.2%, while Provenance Blockchain (HASH) rose about 5%. HASH’s rally comes shortly after Figure announced that pricing has officially closed for FGRD, the first public equity trading natively on the Provenance blockchain.
On the downside, pumpfun (PUMP) fell around 11%, MemeCore (M) dropped roughly 7%, and Bittensor (TAO) slipped about 6.3%.
Liquidations and ETF Flows
Around $192 million in leveraged crypto positions were liquidated over the past 24 hours, according to CoinGlass. Long liquidations accounted for about $134.6 million, while shorts made up $57.4 million.
Bitcoin led liquidations at about $66.7 million, followed by Ethereum at roughly $53.7 million. More than 84,000 traders were liquidated during the period.
In the ETF market, Bitcoin spot ETFs recorded $104.87 million in net outflows, while Ethereum spot ETFs recorded $48.63 million in inflows. XRP spot ETF flows were flat on the day, while Solana spot ETFs recorded $2.19 million in inflows.
Elsewhere
In other markets, precious metals moved higher on the day, with gold trading around $5,000, up 2% and silver rising 4.3% to $77.49. Platinum gained 3.3% to $2,098, while palladium added nearly 2% to $1,742.
Political uncertainty also remained in focus as the White House did not give a clear timeline for talks with Iran amid rising tensions in the Middle East.
Meanwhile, negotiations between Ukraine and Russia concluded, with further discussions expected. In Washington, conflict over reopening the Department of Homeland Security, which is partially shut down, persists, CNN reported.

Palantir relocates headquarters to Miami from Colorado in major business move

Pepe Coin price rare pattern points to a 150% jump as key metric rises
Manchester United have a secret weapon in their FA Youth Cup bid – and it’s not JJ Gabriel


-

 Sports7 days ago
Big Tech enters cricket ecosystem as ICC partners Google ahead of T20 WC | T20 World Cup 2026
-

 Video2 days ago
Bitcoin: We’re Entering The Most Dangerous Phase
-

 Tech4 days ago
Luxman Enters Its Second Century with the D-100 SACD Player and L-100 Integrated Amplifier
-

 Sports2 days ago
GB's semi-final hopes hang by thread after loss to Switzerland
-

 Video5 days ago
The Final Warning: XRP Is Entering The Chaos Zone
-

 Crypto World2 days ago
Can XRP Price Successfully Register a 33% Breakout Past $2?
-
 Tech2 days ago
The Music Industry Enters Its Less-Is-More Era
-

 Business22 hours ago
Infosys Limited (INFY) Discusses Tech Transitions and the Unique Aspects of the AI Era Transcript
-

 Video2 days ago
Financial Statement Analysis | Complete Chapter Revision in 10 Minutes | Class 12 Board exam 2026
-

 Entertainment9 hours ago
Kunal Nayyar’s Secret Acts Of Kindness Sparks Online Discussion
-
 Crypto World7 days ago
Pippin (PIPPIN) Enters Crypto’s Top 100 Club After Soaring 30% in a Day: More Room for Growth?
-
 Crypto World5 days ago
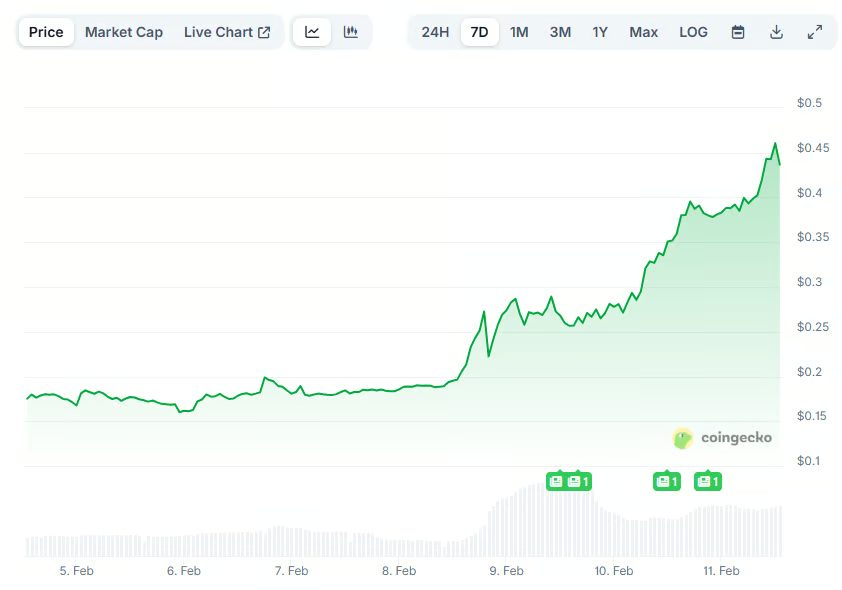
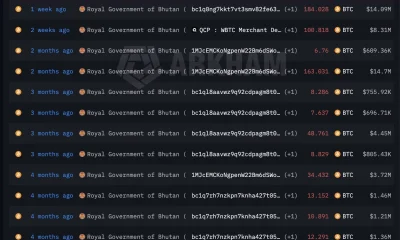
Bhutan’s Bitcoin sales enter third straight week with $6.7M BTC offload
-

 Tech13 hours ago
Retro Rover: LT6502 Laptop Packs 8-Bit Power On The Go
-
 Video7 days ago
Prepare: We Are Entering Phase 3 Of The Investing Cycle
-
 NewsBeat3 days ago
The strange Cambridgeshire cemetery that forbade church rectors from entering
-

 Business6 days ago
Barbeques Galore Enters Voluntary Administration
-

 Business15 hours ago
Tesla avoids California suspension after ending ‘autopilot’ marketing
-

 Crypto World3 hours ago
WLFI Crypto Surges Toward $0.12 as Whale Buys $2.75M Before Trump-Linked Forum
-
 Crypto World6 days ago
Ethereum Price Struggles Below $2,000 Despite Entering Buy Zone
-

 Crypto World5 days ago
Kalshi enters $9B sports insurance market with new brokerage deal