

Crypto World
Core Scientific turns lower after Q4 results disappoint


Core Scientific (CORZ), a bitcoin mining and digital infrastructure company, reported fourth-quarter revenue of $79.8 million for the period ended Dec. 31, compared with $94.93 million a year earlier. Consensus forecasts were for revenue of $122.08 million, according to LSEG data.
The company posted a loss of $0.42 per share, versus expectations for a loss of $0.08 per share.
The weaker results come as bitcoin miners continue to adjust to the April 2024 halving, which cut block rewards in half and squeezed margins across the industry. A higher network hash rate and rising energy and infrastructure costs have pressured profitability, particularly for operators still scaling new capacity.
Core has been repositioning itself beyond pure self-mining and toward hosting and colocation services for high-performance computing clients, including AI workloads. CEO Adam Sullivan said the company is leaning into that strategy.
“We’re now past the halfway point on our existing builds and scaling our colocation platform into a 1.5 gigawatt pipeline of leasable capacity,” Core Scientific CEO Adam Sullivan, said in a statement. “With a multi-geography footprint and proven execution, we’re accelerating RFS timelines across multiple sites to position the company for durable growth.”
As part of this plan, the company announced that it is expanding into Texas, adding about 430 mega watts of gross power capacity. It also increased capacity across other regions by about 300 mega watts.
CORZ shares were lower by 4.5% in after hours trading.
Meanwhile, Riot Platforms (RIOT), a bitcoin mining and data center development company, reported fourth-quarter revenue of $647.4 million, up from $376.7 million a year earlier. Analysts had expected revenue of $157.4 million, including $136 million from bitcoin mining and $21.3 million from engineering.
RIOT shares were flat after hours.


TLDR
- Riot stock increased on Monday as the crypto market strengthened and traders prepared for earnings.
- The share price reached $16.50 after recovering from an intraday low of $15.45.
- Analysts expected Riot’s quarterly revenue to rise by 10 percent to $158 million.
- The company previously reported $180 million in third-quarter revenue driven by mining operations.
- Riot expanded into data colocation as Bitcoin remained in a technical bear trend.
Riot stock moved higher on Monday as the crypto market gained strength, and the move came as traders prepared for new earnings results. The action pointed to growing interest in the company.
Riot Stock Advances With Market Optimism Growing
Riot Platforms traded higher during Monday’s session, and the move lifted the share price to $16.50. The stock also bounced from an intraday low of $15.45, and it stayed 40% above its February floor.
The company kept a market capitalization near $6.14 billion, and the rally aligned with a wider jump in Bitcoin and altcoins. The crypto market showed steady demand on Monday, and traders watched the stock closely for new signals.
Wall Street projected stronger results for the firm, and analysts expected quarterly revenue to rise by 10% to $158 million. Forecasts also placed annual revenue at $658 million, and the increase suggested steady demand for mining output.
The company posted $180 million in revenue in the previous quarter, and it reported $84 million during the same period in 2024. Mining revenue climbed from $67 million to $160 million, and engineering revenue rose from $12 million to $19 million.
Riot Accelerates Data Shift Under Rising Pressure
The firm faced pressure as Bitcoin held a technical bear trend after a drop of over 40% from its peak. The crypto pullback influenced miners broadly, and the company worked to navigate a shifting environment.
The group expanded into data colocation to support new growth, and the sector saw rising investment from enterprise clients. This move created another income stream, and it aligned with the broader shift toward high-density compute facilities.
The company secured 200 acres in Texas for future sites, and the expansion supported long-term mining plans. The firm also signed a data center leasing agreement with AMD for 25 MW of IT capacity, and the partnership created new revenue options.
Pressure also increased from Starboard Value, and the group pushed for a faster transition toward data center operations. It urged the company to roll out more sites, and the approach targeted a stronger appeal to hyperscale clients.
Peer firms such as IREN secured deals worth over $10 billion, and these agreements reflected growing demand for high-capacity compute services. Likewise, CoreWeave reported a backlog above $50 billion, and the scale showed how the sector continued to expand.
The company’s recent activity positioned it for future contracts, and traders monitored the pace of new developments. Riot stock continued to react to crypto prices, and Monday’s move reflected the latest market shift.


Bitcoin price holds near $68,000 as short-term holders show restraint despite US-Iran war tensions.
Summary
- Bitcoin price is trading near the top of its weekly range between $62,900 and $69,300.
- Short-term holder exchange inflows remain muted despite geopolitical escalation.
- A daily close above $70,000 could shift short-term momentum.
Bitcoin (BTC) trades at $68,308 at press time, up 1.3% over the past 24 hours. The asset is positioned near the top of its seven-day range between $62,905 and $69,340, recovering from a sharp dip earlier in the week.
The larger trend, however, is still corrective. After reaching an all-time high of $126,080 in October 2025, Bitcoin has dropped about 45% from that peak. So far in 2026, it is down roughly 20%, reflecting continued pressure following last year’s rally.
Derivatives activity has increased over the past day. CoinGlass data shows trading volume rising 8.7% to $72.3 billion, while open interest has edged up 1.6% to $44.9 billion. When open interest climbs alongside price, it often suggests that new positions are being opened rather than closed.
Short-term holders are not rushing to sell
A March 1 analysis from a CryptoQuant contributor examined Bitcoin’s Short-Term Holder P&L to Exchanges metric. This indicator tracks whether recent buyers are sending coins to exchanges at a profit or a loss. Short-term holders tend to react quickly to fear-driven events and can amplify volatility.
According to the report, on Feb. 5–6, during a sharp market drop, roughly 89,000 BTC were sent to exchanges at a loss within 24 hours. That episode marked a clear capitulation from newer market participants. Since then, those loss-driven inflows have steadily declined.
The recent geopolitical escalation involving U.S. and Iran provided another stress test. Bitcoin briefly dipped toward the $63,000–$64,000 area, yet exchange inflows from short-term holders did not spike.
There was no surge in panic selling or aggressive profit-taking from this typically reactive group.
That shift is notable. Markets often stabilize once forced sellers have exited. The current data suggests much of the recent liquidation pressure may already have played out.
Selling from recent buyers has slowed, and weak hands seem to be less active. Whether or not this calm continues will be crucial going forward.
Seller fatigue would be evident if exchange inflows from short-term holders continued to be low. A sharp increase in realized losses would indicate a resurgence of stress.
Bitcoin price technical analysis
Since January, Bitcoin has continued to move within a downward structure marked by lower highs and lower lows. The recent rebound comes after a sharp decline, and the price is currently consolidating rather than showing a strong trend in either direction.
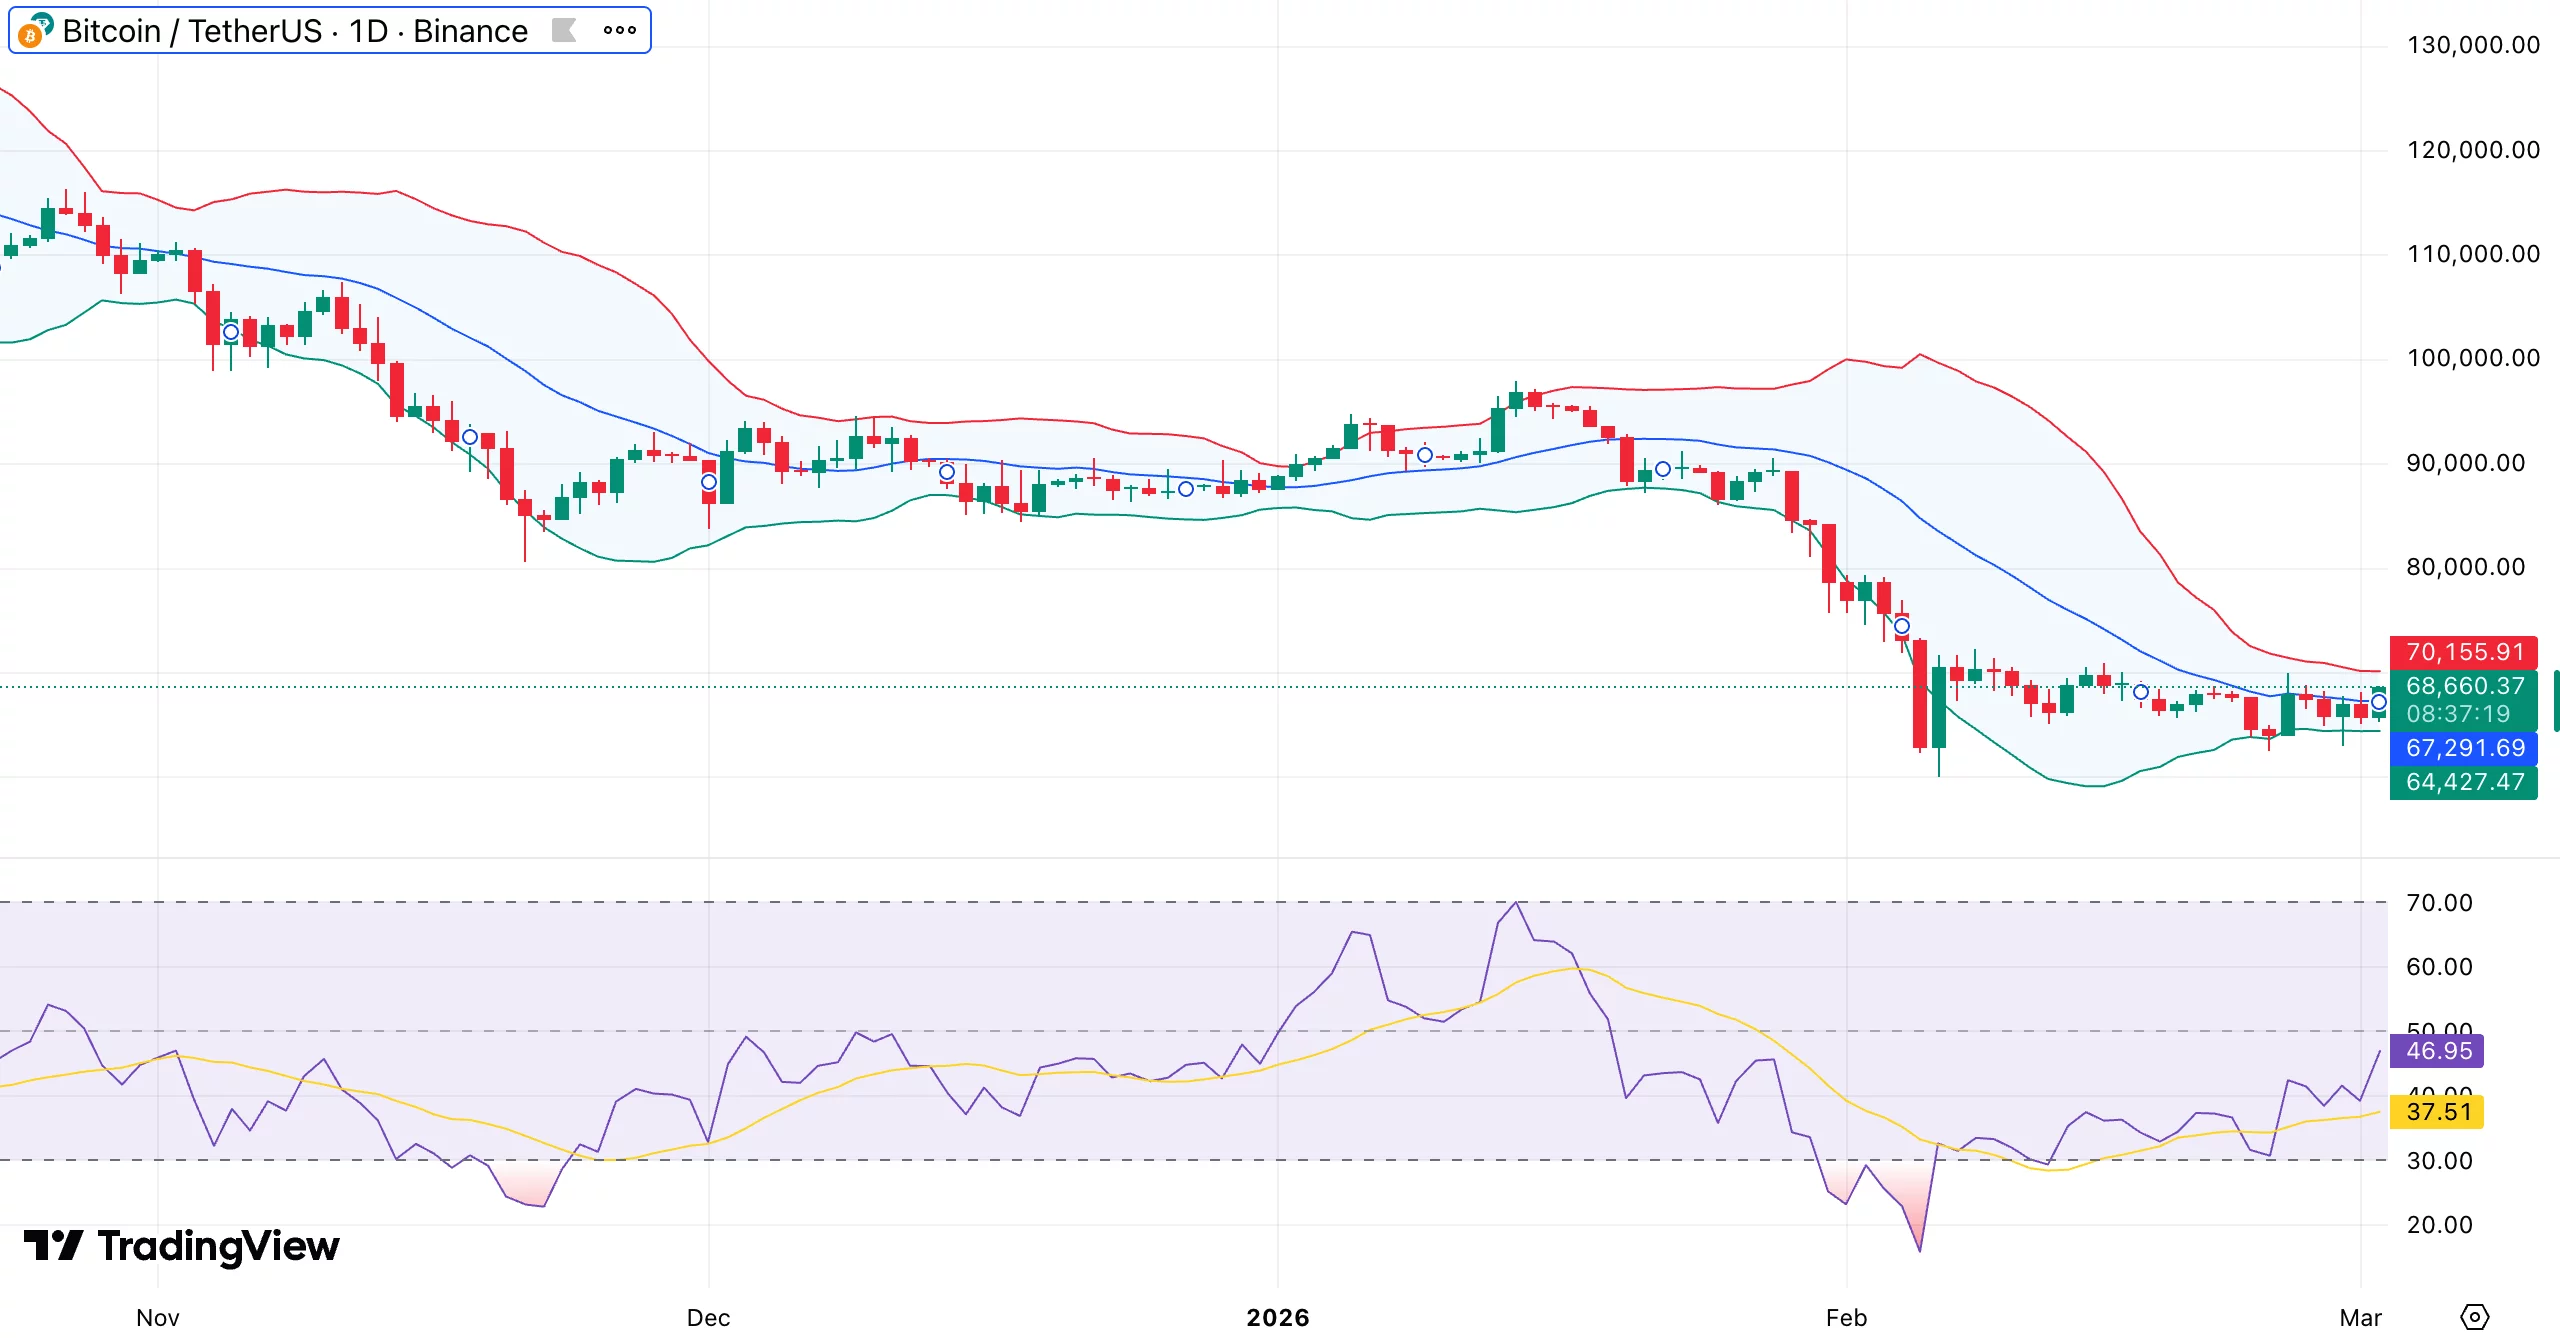
Bollinger Bands show that before rising, Bitcoin touched the lower band around $64,400. At $67,300, it currently trades near the middle band. The upper band, near $70,100, marks immediate resistance.
A rejection in the $70,000–$71,000 zone would keep pressure on the upside, while a strong daily close above that area could shift short-term momentum.
The relative strength index has climbed from oversold levels in the low 20s to around 47. Momentum is improving, though it has not crossed above 50, a level often associated with stronger buyer control.
The current structure resembles a sharp impulse lower followed by sideways compression, which can develop into a bear flag. If that pattern resolves downward, a return to the low $60,000s becomes plausible.
Support sits between $64,000 and $65,000. If that area fails, the next psychological level near $60,000 could come into focus.

Hyperliquid price has rallied into a major resistance cluster near $32 but shows signs of exhaustion as volume declines. Failure to reclaim this zone increases the probability of a corrective move toward lower support.
Summary
- Rejection at $32–$35 resistance confluence zone
- Declining volume suggests corrective rally
- $21 value area low becomes next downside target
Hyperliquid’s (HYPE) recent recovery attempt has brought price back into a critical technical region that previously acted as support but has now flipped into resistance. While the rally initially suggested momentum recovery, weakening volume and structural rejection signals indicate that the move may lack sustainability.
The market now sits at a decisive level where continuation requires a structural shift, otherwise downside rotation remains the higher-probability outcome.
Hyperliquid price key technical points
- Key Resistance: $32–$35 zone aligns with 0.618 Fibonacci and VWAP resistance.
- Market Structure: Former support has flipped into high timeframe resistance.
- Downside Risk: Exposed value area low increases probability of move toward $21.
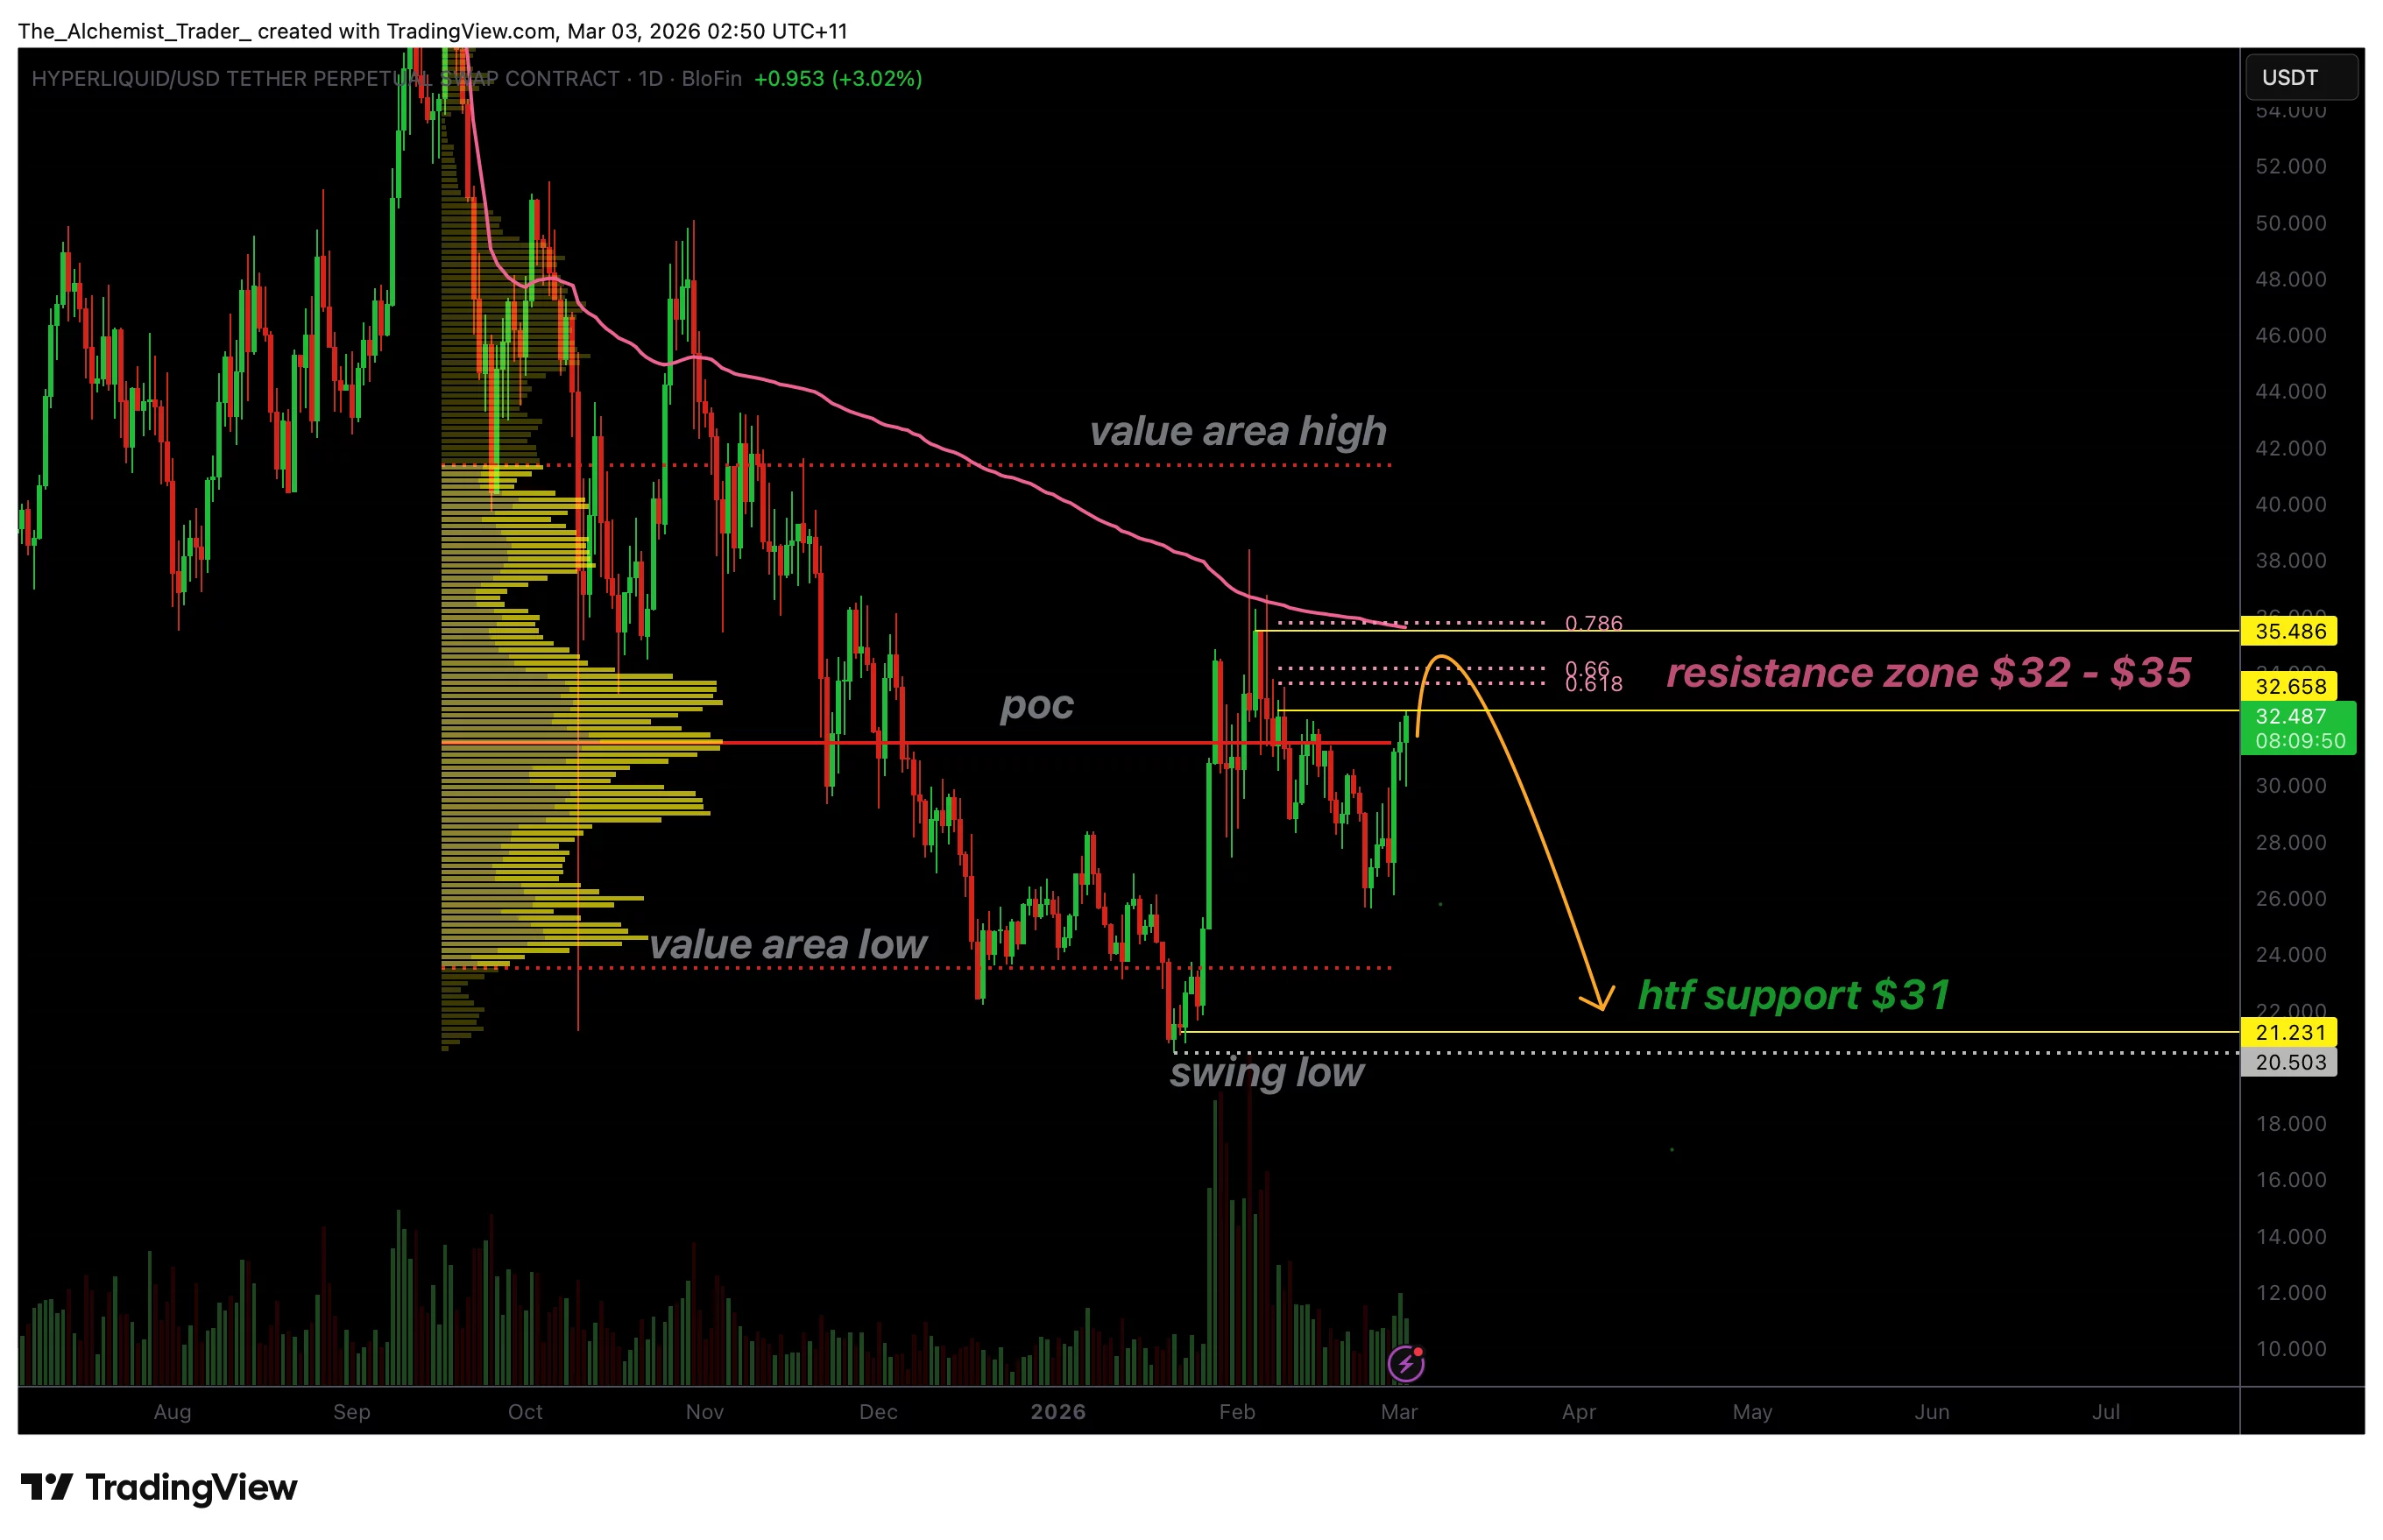
Hyperliquid has returned to a major technical inflection point around $32, an area that previously served as support before breaking down. In market structure analysis, former support zones frequently transform into resistance once lost, and the current price reaction confirms this behavior. The rejection occurring at this level suggests that sellers continue to defend higher prices aggressively.
The resistance zone extends between $32 and $35, where multiple technical indicators converge. The 0.618 Fibonacci retracement, combined with an overhead VWAP resistance, creates a strong confluence region. Such clusters often represent decision zones where markets either transition into trend reversals or resume the prevailing direction. For Hyperliquid, price has yet to demonstrate sufficient strength to invalidate the bearish structure.
A notable concern accompanying the rally is the decline in trading volume. Healthy bullish continuation typically requires expanding participation as price approaches resistance. Instead, diminishing volume indicates weakening demand, suggesting that the rally may be corrective rather than impulsive.
This type of behavior frequently precedes rejection scenarios where markets rotate back toward lower liquidity zones, even as Hyperliquid launches a Washington-based advocacy group to push for clearer congressional rules around decentralized finance.
From a volume profile perspective, price tends to rotate between the Value Area High (VAH), Point of Control (POC), and Value Area Low (VAL). In the current structure, the value area low remains technically untested following the recent move higher. When one side of the range remains exposed, markets often seek balance by revisiting that region. This dynamic increases the probability that Hyperliquid reverses near resistance and rotates back toward lower support.
The next major support level sits near $21, representing the value area low and a key demand zone. A move toward this region would complete a full rotational cycle within the broader range structure. While such a decline may appear bearish in the short term, it would remain consistent with range dynamics rather than signaling immediate long-term collapse.
Market structure analysis reinforces the corrective outlook. Hyperliquid continues to trade below high timeframe resistance without establishing higher highs. Until price can reclaim the $32–$35 zone on a closing basis, bullish continuation remains unlikely.
Instead, the prevailing structure favors rejection and gradual downside rotation, even as traders increasingly view assets like BCH, XMR, HYPE, and BlockDAG as leading crypto opportunities driven by utility and momentum.
Additionally, the failure to break resistance after multiple attempts can weaken buyer confidence. Traders often interpret repeated rejections as confirmation of supply dominance, encouraging defensive positioning and short-term selling pressure. Without a decisive reclaim supported by strong volume expansion, upside attempts are likely to fade.
What to expect in the coming price action
Hyperliquid’s short-term outlook remains vulnerable while price trades below the $32–$35 resistance cluster. Continued weakness and declining volume increase the probability of a reversal toward $21 support. Only a confirmed breakout above resistance would invalidate the bearish scenario and shift momentum back toward bullish continuation.

TLDR
- xAI plans to repay $3 billion in high-yield bonds earlier than expected to reduce debt before major corporate steps.
- The company will redeem the bonds at $117 on the, which reflects recent price movement.
- Early repayment may trigger penalty costs because the bonds were expected to remain outstanding for two years.
- Musk merged xAI and X under one structure while working to simplify debt across his companies.
- Lenders were informed that both X and xAI debt will be repaid, although funding sources were not disclosed.
xAI will retire $3 billion of bonds early as the company reshapes its debt, and SpaceX prepares for a public listing, and lenders track rapid changes across Musk’s merged businesses.
Early Bond Repayment by xAI
xAI will repay the bonds at 117 cents as pricing data shows the debt rising toward that level. The move follows June’s bond sale that featured a coupon of 12.5 percent.
The redemption comes even though the structure suggested a longer timeline before repayment. The step underlines efforts to simplify obligations before further corporate actions.
Bank sources say early repayment usually triggers charges tied to make-whole terms, and xAI may incur such costs. They also state, “The process continues without disclosure of funding sources.”
Trace data shows the bonds climbed about three points on Monday to near 117 cents. The shift reflects rising expectations of an early call.
Debt Strategy and Business Consolidation
Musk merged xAI with SpaceX under a single holding entity last year. The group now carries about $18 billion of combined obligations.
Lenders say repayment plans also cover debt tied to X, formerly Twitter. They add that Morgan Stanley told them repayment will proceed as arranged.
X borrowed about $12.5 billion during Musk’s takeover, while xAI raised $5 billion through loans and bonds. Both moved under xAI Holdings after restructuring.
xAI revised its debt documents to restrict asset transfers and set a ceiling for future secured borrowing. Those provisions protect collateral for lenders.
SpaceX Prepares for IPO Filing
SpaceX may file confidentially for an IPO this month, according to sources. They say valuation targets exceed $1.75 trillion.
The company has not accessed bond markets, unlike X and xAI, which faced heavy servicing costs. X paid large monthly interest amounts, while xAI used cash rapidly.
SpaceX bought xAI last month and intends to expand data center capacity. The combined business holds a valuation of about $1.25 trillion.
People familiar with the matter say Musk plans to advance the offering timeline. They also report ongoing financing work tied to debt reduction.
Morgan Stanley declined to comment when contacted. Representatives for X and xAI did not respond to requests for comment.
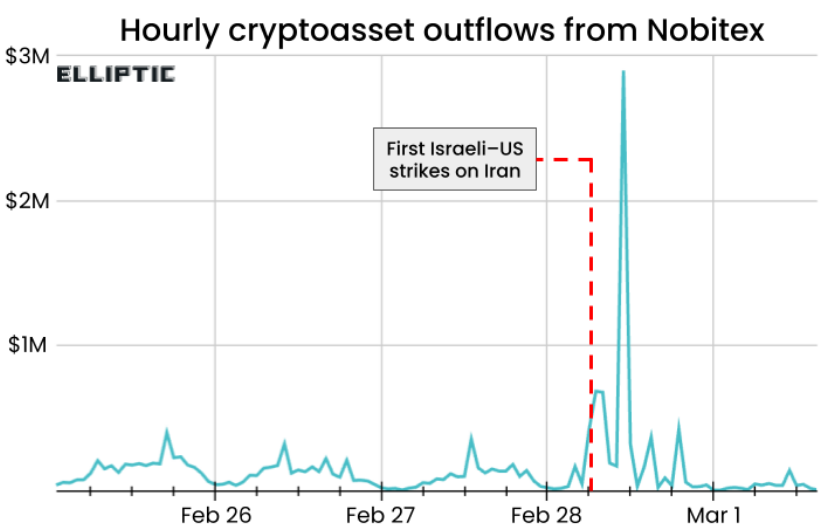
Iran’s top crypto exchange saw a significant spike in crypto withdrawals within minutes of the US and Israel launching strikes in Tehran on Saturday. However, a widespread internet outage curbed additional outflows.
In a post on Monday, Elliptic said crypto outflows from the Nobitex exchange surged by more than 700% to over $500,000 within minutes of the first airstrikes, with a chart showing that outflows reached nearly $3 million in a single hour later that day.

Elliptic said the sharp rise in outflows “potentially represents capital flight from Iran,” with its initial tracing showing that many of those funds were sent to foreign crypto exchanges.
“This allows funds to be moved out of Iran while avoiding some of the scrutiny of the global banking system,” Elliptic said.
However, crypto outflows from Nobitex fell sharply after Saturday, which fellow crypto forensics platform TRM Labs attributed to the Iranian regime enforcing strict internet blackouts.
Iran’s internet connectivity reportedly fell by approximately 99% shortly after the conflict unfolded, TRM noted.
TRM also opposed Elliptic’s conclusion that capital flight is leaving Iran, stating:
“It appears that the country’s crypto ecosystem is not showing signs of acceleration or capital flight, but instead experiencing a downturn in both transactions and volume as the regime enforces strict internet blackouts.”
The crypto outflows come as the US and Israel seek to topple the current Iranian regime and wipe out its nuclear and missile programs. Iran responded with airstrikes of its own on neighboring countries, creating further instability in the region.
Nobitex is Iran’s largest crypto exchange, handling roughly 87% of the country’s crypto transaction volume. In 2025, it processed about $7.2 billion in trades for more than 11 million users.
Millions of Iranians impacted by recent banking collapse
Iranians continue to rely on crypto to store and move funds as a solution to navigate Iran’s fragile banking system and the widespread sanctions imposed on the country.
Related: Will Bitcoin crash if oil prices hit $100 per barrel?
In October, one of Iran’s largest private banks, Ayandeh Bank, went bankrupt after accumulating $5.1 billion in losses and nearly $3 billion in debt, impacting more than 42 million customers.
Iran’s central bank warned last year that eight other local banks were at risk of dissolution unless they implement reforms.
Iranian crypto exchanges haven’t been without problems either, as Nobitex suffered an $81 million hack in June.
Magazine: South Korea gets rich from crypto… North Korea gets weapons
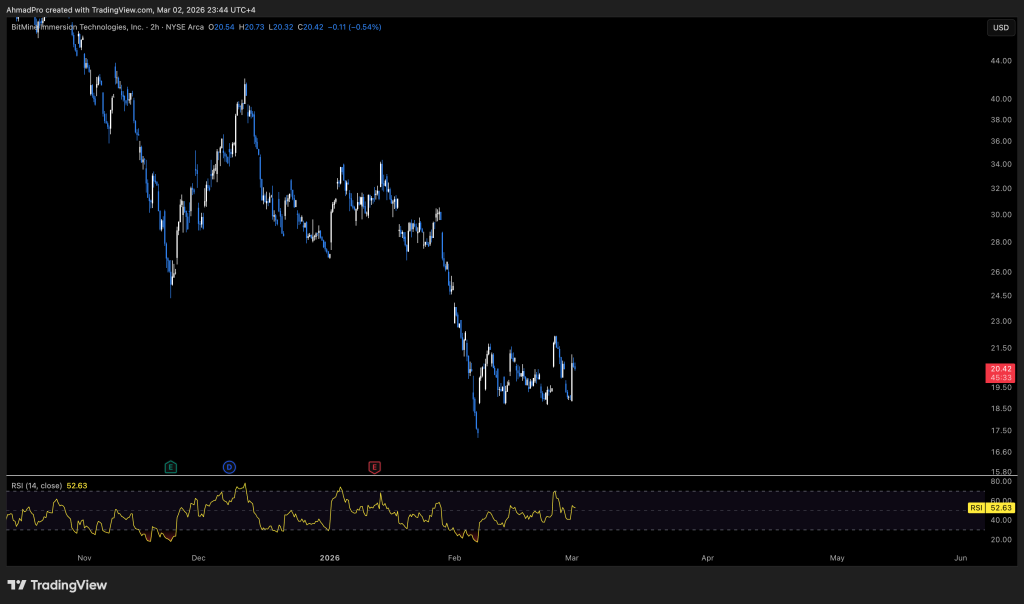
BitMine Immersion Technologies (BMNR) just doubled down on Ethereum, fueling bullish price predictions.
The publicly traded treasury added 50,928 ETH last week, spending about $103 million. The move sparked a 9% jump in BMNR shares and lined up with a strong bounce in Ethereum’s spot price.
With this buy, BitMine now holds 4,473,587 ETH, roughly 3.71% of the total circulating supply. That is not passive exposure. It is an aggressive accumulation strategy, even with market conditions still shaky.
- BitMine added 50,928 ETH to its balance sheet, raising total holdings to roughly $9 billion.
- BMNR shares surged over 9% following the disclosure, outperforming broader market indices.
- The firm is now staking over 3 million ETH, projecting estimated annualized revenues of up to $172 million.
BitMine Pursues ‘Alchemy of 5%’ Despite Paper Losses
BitMine’s latest buy is part of a bigger mission. The company wants control of 5% of Ethereum’s total supply, which Chairman Tom Lee calls the “alchemy of 5%.”
Lee framed the recent dip as an opportunity, arguing that ETH fundamentals are stronger than price suggests. Even with roughly $7.7 billion in unrealized losses on paper, leadership is not backing off. They see Ethereum as core financial infrastructure, not just a speculative asset.

The difference is strategy. BitMine is not just holding ETH. It is staking aggressively. The firm claims to have staked more ETH than any other entity and expects an annual yield of more than $253 million once its Made in America Validator Network goes fully live in 2026.
That active yield model separates it from passive treasury plays. It turns ETH into a productive balance sheet asset rather than idle reserves.
This push mirrors broader institutional moves into crypto infrastructure. While retail remains cautious, corporate players are building quietly.
For traders, $2,100 is the key level. If Ethereum reclaims it and BitMine keeps buying weekly, that steady demand could act as a structural floor heading into the next cycle.
BMNR Shares Break Out as ETH Holds $2,000
The market reacted fast.
BitMine shares (NYSE: BMNR) jumped more than 9% after the disclosure, as investors leaned into the company’s heavier exposure to a potential Ethereum rebound. At the same time, ETH bounced to around $2,037, trying to stabilize after a roughly 22% monthly slide.
Traders read the treasury purchase as a high-conviction signal. Volume picked up across both the stock and ETH, tightening the correlation between BMNR and spot prices.
At this point, BMNR is effectively trading as a leveraged proxy for Ethereum. When ETH moves, the stock is likely to amplify that move in either direction.
Discover: The best new crypto in the world
The post Ethereum Price and BitMine Shares Jump 10% After Latest Treasury Buy appeared first on Cryptonews.

News feeds may be rocked by war news, but markets are weathering it; ChatGPT even predicts a strong year ahead for XRP, SOL and SHIB HODLers.
It seems the market already priced in war news during the downturns following Trump’s previous threats of US military escalation on Greenland and Iran earlier in the year.
Given all the uncertainties, however, just how likely are ChatGPT’s forecasts?
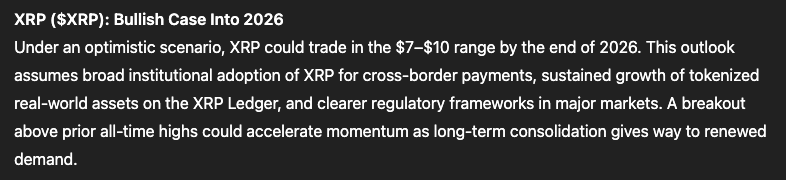
XRP ($XRP): ChatGPT Predicts a Clean 7x Surge by Christmas
In a recent update, Ripple reiterated that XRP ($XRP) remains fundamental to its vision to transform the XRP Ledger (XRPL) into a global, enterprise-grade payments network.
Powered by elite infrastructure, instant settlement and minimal fees, XRPL is likely to capitalise greatly on two of crypto’s fastest-expanding niches: stablecoins and tokenised real-world assets.
With XRP currently trading around $1.41, ChatGPT projects a potential rally toward $10 in 2026, a move that would represent 7x for current holders.
Technical indicators also support upward movement. XRP’s relative strength index (RSI) hovers near 44, while price action has stabilised around the 30-day moving average, hinting the prolonged consolidation phase may be over
Additional bullish catalysts could include growing institutional participation following the rollout of U.S.-listed XRP ETFs, Ripple’s expanding global partnership network, and improved regulatory clarity if the CLARITY bill passes in the U.S. this year.
Solana (SOL): Will Solana Double ATH Soon?
Solana ($SOL) hosts $6.5 billion in total value locked (TVL) and carries a market capitalisation of $51 billion.
Institutional demand grew after the recent launch of Solana exchange-traded funds from major asset managers, including Bitwise and Grayscale.
Even so, SOL suffered a deep correction in late 2025 and spent much of February trading below the $100 level.
Under ChatGPT’s most optimistic scenario, Solana could climb from its current price near $89 to roughly $600 by Christmas. Such a move would deliver close 7x upside and double Solana’s all-time high (ATH) of $293, recorded in January 2025.
Further reinforcing Solana’s outlook, asset management giants such as Franklin Templeton and BlackRock are actively issuing tokenised assets on the network, underscoring the network’s headstart as a scalable, institution-friendly blockchain.
Shiba Inu (SHIB): ChatGPT AI Predicts a Possible 2,000% Rally
Launched in 2020 as a playful parody of Dogecoin, Shiba Inu ($SHIB) has since evolved into a multi-faceted ecosystem with a market capitalisation around $3.4 billion.
At its current price near $0.0000057, ChatGPT’s analysis indicates that a decisive breakout above the $0.000025–$0.00003 resistance zone could ignite strong bullish momentum, potentially driving SHIB toward $0.00012 before year-end.
That scenario would imply eye watering gains of around 21x (+2,000%), placing SHIB above its October 2021 ATH of $0.00008616.
Beyond meme coin hype, the project offers real utility. Shiba Inu’s Ethereum Layer-2 solution, Shibarium, offers faster transactions, lower fees, enhanced privacy and a more developer-friendly environment.
Maxi Doge: Early-Stage Meme Coin Targets Explosive Growth
According to ChatGPT, Shiba Inu’s likelihood of a 21x run indicates strong conviction that a bull market could usher the start of meme season. However, newer stage meme coins offer more room for growth
One such buzzy new project is Maxi Doge ($MAXI). It has already raised $4.7 million during its ongoing presale, as early investors stack what some are calling the next Dogecoin.
Maxi Doge is Dogecoin’s louder, more aggressive gym-bro cousin, driven by envy and fuelled by a viral degen marketing strategy that taps into the chaotic energy of the 2021 meme coin cycle.
MAXI is an ERC-20 token on Ethereum’s proof-of-stake network, offering a significantly lower environmental footprint compared to Dogecoin’s proof-of-work architecture.
Early presale buyers can currently stake MAXI for yields of up to 67% APY, with rewards gradually decreasing as the staking pool expands.
The token is $0.0002806 in the current presale stage, with automatic price increases programmed at each funding milestone. Purchases are supported via wallets such as MetaMask and Best Wallet.
Stay updated through Maxi Doge’s official X and Telegram pages.
Visit the Official Website Here.
The post New ChatGPT Predicts the Price of XRP, Solana and Shiba Inu By the End of 2026 appeared first on Cryptonews.

Bitcoin, and eventually broader crypto, was steered away from being a decentralized alternative to the state and toward integration into the very financial system it was meant to replace.
In an interview, Aaron Day, co-founder of Daylight Freedom, a foundation dedicated to financial sovereignty and individual liberty, reached this conclusion based on his personal experiences with Bitcoin.
Questioning Bitcoin’s Original Mission
Nowadays, Bitcoin is best known for its non-sovereign, censorship-resistant characteristics. For several years now, the crypto community has touted the asset as akin to gold, albeit digital.
Day, an outspoken critic of cryptocurrencies and a libertarian thinker, once thought this too.
That’s why he started using Bitcoin as early as 2012. However, he soon started to realize that its narrative was in a constant state of transformation– one that parted ways with its self-proclaimed decentralized nature.
His persistent remarks on social media and sharp criticisms of some of the industry’s most powerful companies have inevitably made some paint him as a conspiracy theorist.
However, his long trajectory as a crypto user in the space, paired with the research he conducts as a fellow at the Brownstone Institute, provides a perspective that’s hard to dismiss, especially amid Bitcoin’s broader mainstream adoption.
New Hampshire as a Bitcoin Testing Ground
When Day, a New Hampshire resident, started using Bitcoin 15 years ago, many restaurants and shops accepted it directly. It already functioned as a spendable digital currency.
In many ways, the state was a breeding ground for this type of activity.
Known as the “Live Free or Die” region, New Hampshire also became the home of the Free State Project, a nonprofit political migration movement founded in 2001 that successfully relocated roughly 20,000 free thinkers to the area, aiming to concentrate them in a low-population state.
Day was the Chairman of that project, and by virtue of his beliefs, he became attracted to Bitcoin’s potential.
“Back [in 2012], mostly conferences were about how Bitcoin was going to be used as an alternative to central banks, how it was going to be something that solved the problem of the 2008 financial crisis, [and] how it was going to be a tool that didn’t require intermediaries or third parties. This is how I got introduced to it,” Day told BeInCrypto during a podcast episode.
However, despite its early adoption in his city, the narrative began to shift by 2017. According to him, it soon became unusable.
“All of a sudden, the fees went through the roof. We went from transactions being finalized in seconds to days. It lost its fundamental utility, which is to be something that anyone anywhere in the world could engage in voluntary transactions without third parties,” he added.
Though that was Day’s original frustration with the currency, it soon only represented the tip of the iceberg.
A Narrative Shift From Cash to Store of Value
When Day started using Bitcoin, it was seen as just another form of currency for everyday transactions with decentralized advantages. It was never perceived as anything else.
“People weren’t talking about primarily as being digital gold. It’s something you just hold and save and don’t spend. It’s not in the title of the whitepaper, this is not the behavior and function of Bitcoin,” he explained.
These changes coincided with the rise of Layer 2 solutions in crypto. These secondary protocols, built on top of the primary blockchain, are designed to significantly increase transaction speeds and reduce fees. Protocols like Segregated Witness (SegWit) and Lightning Network became particularly popular at the time.
While many developers argued these upgrades were necessary technical trade-offs, Day interpreted them differently.
In his view, the technical debate around scaling was inseparable from a broader structural shift happening behind the scenes — one related to who was funding Bitcoin’s development.
From Non-Profit Backing to Institutional Influence
In 2012, the Bitcoin Foundation, a non-profit organization, was established in the United States to promote Bitcoin use and protect the integrity of the project. It also supported Bitcoin’s earliest core developers.
Three years later, however, the organization collapsed amid internal turmoil and financial difficulties.
Shortly afterward, the Massachusetts Institute of Technology (MIT) Media Lab, through its Digital Currency Initiative —directed by Jeffrey Epstein-linked Joi Ito— began funding several Bitcoin core developers.

To many in the ecosystem, this was a practical solution. Bitcoin was an open-source protocol without a formal corporate sponsor. Developers needed funding to continue their work.
But for Day, the timing raised questions.
“MIT took over, and then some of the same developers that were working on things like SegWit and Lightning Network, essentially hobbling Bitcoin as peer-to-peer cash and moving to this Bitcoin is digital gold narrative.”
As Bitcoin’s scalability issues became more apparent and the network’s future development was increasingly steered by well-funded institutional interests, the project’s decentralized nature began to erode.
Fast forward to today, and Bitcoin has become extensively integrated in infrastructure directly tied to traditional, centralized banking. Exchange-traded funds tied to the asset, institutional custody, and nation-state reserves have since entered the conversation.
Day questioned whether this trajectory was inevitable or the result of structural forces that redirected Bitcoin’s original mission.
“I think at the end of this, the longer it goes on, the more it’s pretty clear that all of crypto has been hijacked,” he concluded.
Further decline or a revival: what’s next for the self-proclaimed Dogecoin killer?
The situation for the second-largest meme coin has worsened recently, following a double-digit slide over the past 14 days.
Some worrying factors suggest Shiba Inu (SHIB) could experience a further collapse in the near future, while one popular analyst predicted it might crash to a five-year low.
The Free Fall is Yet to Happen?
While Shiba Inu enjoyed some notable surges last year, 2026 has been nothing but painful. As of this writing, it trades at around $0.000005467 (per CoinGecko’s data), representing a whopping 60% plunge on a yearly scale.
Its market cap has tumbled to roughly $3.2 billion, further widening the gap with niche frontrunner Dogecoin (DOGE), which maintains a capitalization of more than $15 billion.
According to Ali Martinez, SHIB might be on the verge of a crash to as low as $0.00000138. This is not the first time the analyst has warned about such a scenario. Last month, he noted that the meme coin dropped below the important level of $0.00000667, claiming this could have opened the door to a meltdown to the aforementioned zone.
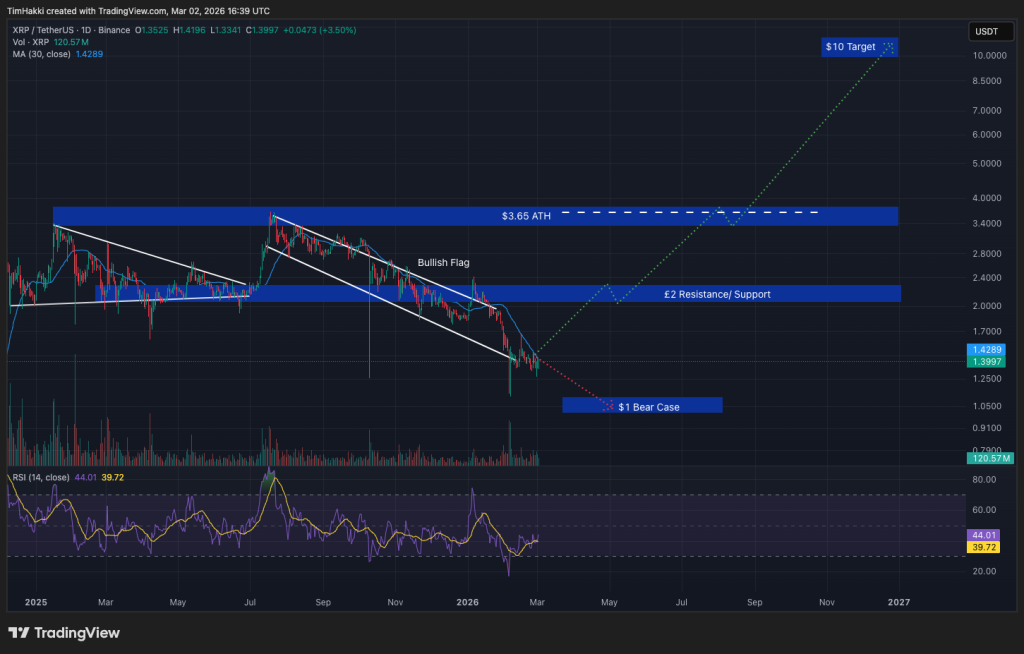
Shiba Inu’s burning mechanism also signals that a further pullback may be on the way. Over the past 24 hours, the burn rate has decreased by approximately 99% after only 20,176 SHIB were sent to a null address.
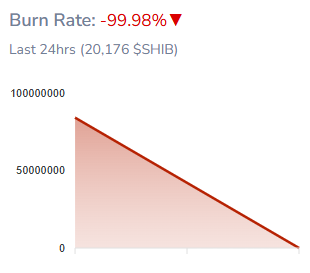
The program’s ultimate goal is to reduce the meme coin’s overall supply, potentially making it more valuable in time (assuming demand remains constant or heads north). It was adopted in 2022, and since then, the team and community have destroyed more than 410.7 trillion tokens, leaving 585.47 trillion in circulation.
You may also like:

The stalled progress of Shibarium is also a bearish factor. Shiba Inu’s layer-2 scaling solution saw the light of day in the summer of 2023 and aims to foster the project’s development by lowering transaction fees, improving speed, and enhancing scalability. It suffered an exploit in September last year, which shook investor trust and caused widespread damage across the Shiba Inu ecosystem. Prior to the incident, daily transactions processed on Shibarium were in the millions, while after that, they plummeted to mere thousands.

The Bullish Signals
Even as the meme coin struggles and the broader crypto market is under pressure, SHIB’s supply on centralized exchanges keeps shrinking. According to CryptoQuant’s data, those reserves fell below 81 trillion tokens, the lowest point since May 2021.
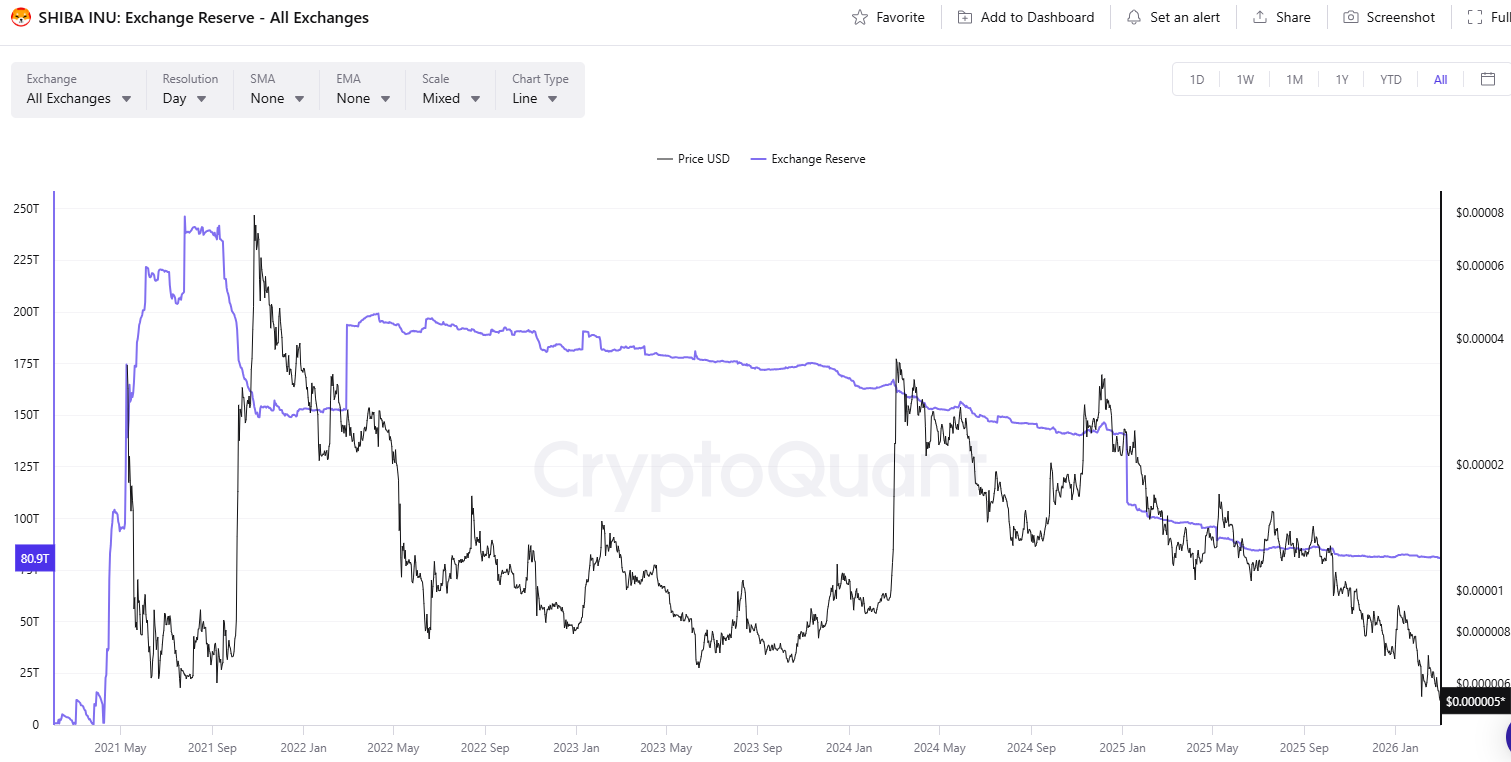
The development could be interpreted as a positive sign because it suggests that investors are in no rush to move their holdings to such platforms: a move often seen as a pre-sale step.
Meanwhile, Shiba Inu’s Relative Strength Index (RSI) briefly plunged below 30, indicating the asset has entered oversold territory and could be due for a resurgence. The technical analysis tool runs from 0 to 100, and conversely, ratios above 70 suggest SHIB could be overbought and gearing up for a possible correction. As of this writing, the RSI stands at roughly 36, or much closer to the bullish zone.

Binance Free $600 (CryptoPotato Exclusive): Use this link to register a new account and receive $600 exclusive welcome offer on Binance (full details).
LIMITED OFFER for CryptoPotato readers at Bybit: Use this link to register and open a $500 FREE position on any coin!
TLDR
- South Korea launched a nationwide audit to strengthen controls over seized crypto assets.
- The Finance Ministry and financial regulators reviewed storage methods and internal access procedures.
- Officials aimed to identify weak practices and introduce stronger technical safeguards.
- Police in Gangnam lost 22 BTC after giving custody to an external firm without private key control.
- The National Tax Service apologized after exposing recovery phrases that led to a major theft.
South Korea moved fast to reinforce digital asset controls as officials addressed recent security failures, and the government ordered urgent checks across agencies, and leaders demanded strict oversight to prevent further losses.
Audit of Seized Crypto Holdings
South Korea launched a nationwide audit after new directives reshaped digital asset management practices. Authorities examined seized coins across agencies and reviewed storage controls. The Finance Ministry coordinated the process with the Financial Services Commission and the Financial Supervisory Service. Officials targeted holdings gained through tax and criminal cases.
Officials reviewed hardware wallets and custodial accounts and assessed access controls. They said the audit aimed to expose weak procedures and guide new protections. Leaders stated that agencies must “fix system gaps fast” to stop unauthorized transfers. They also confirmed that operational reports will go directly to senior oversight teams.
Police losses in Gangnam triggered stronger demands for new custody rules. Investigators confirmed that officers lost 22 BTC after handing assets to an outside firm. Officials said the officers never controlled private keys, which raised concerns about current arrangements. Regulators asked agencies to track crypto flows better.
A separate error at the National Tax Service pushed the government to act. The agency disclosed recovery phrases in a public release. Thieves drained most of a $5.6 million holding, and leaders called the failure preventable. The agency apologized and began internal checks.
Legal and Structural Shifts in South Korea
The Supreme Court of Korea ruled in January that exchange-held Bitcoin qualifies as property. This decision cleared earlier confusion over enforcement powers. Officials said the ruling eased asset seizure procedures. They added that agencies can pursue digital holdings more quickly under clear rules.
The government continued updating its Digital Asset Basic Act. Phase two will impose rules for stablecoin reserves and investor protection. Officials said the updates will strengthen oversight for market players. They also confirmed that agencies will publish final provisions soon.
Regulators ended a nine-year block on corporate crypto trading in February. They allowed listed firms and professional traders to reenter markets. Authorities said new compliance rules will govern trading activities. They will also monitor corporate flows under updated reporting systems.

Tech Moves: HP director departs; AWS leader leaves; Truveta adds new leaders
Call the Midwife boss addresses BBC show’s future ahead of end of series

US stocks erase sharp losses, while oil prices leap on worries about Iran war


-

 Fashion3 days ago
Weekend Open Thread: Iris Top
-

 Politics4 days ago
ITV enters Gaza with IDF amid ongoing genocide
-

 Business6 days ago
True Citrus debuts functional drink mix collection
-

 Tech2 days ago
Unihertz’s Titan 2 Elite Arrives Just as Physical Keyboards Refuse to Fade Away
-
Sports3 days ago
The Vikings Need a Duck
-

 Crypto World7 days ago
XRP price enters “dead zone” as Binance leverage hits lows
-
 NewsBeat2 days ago
Dubai flights cancelled as Brit told airspace closed ’10 minutes after boarding’
-

 NewsBeat5 days ago
Cuba says its forces have killed four on US-registered speedboat | World News
-

 Tech6 days ago
Unsurprisingly, Apple's board gets what it wants in 2026 shareholder meeting
-
 NewsBeat3 days ago
The empty pub on busy Cambridge road that has been boarded up for years
-
 NewsBeat5 days ago
Manchester Central Mosque issues statement as it imposes new measures ‘with immediate effect’ after armed men enter
-

 NewsBeat1 day ago
‘Significant’ damage to boarded-up Horden house after fire
-

 NewsBeat2 days ago
Abusive parents will now be treated like sex offenders and placed on a ‘child cruelty register’ | News UK
-
 NewsBeat6 days ago
Police latest as search for missing woman enters day nine
-

 Entertainment17 hours ago
Baby Gear Guide: Strollers, Car Seats
-

 Business5 days ago
Discord Pushes Implementation of Global Age Checks to Second Half of 2026
-

 Business4 days ago
Only 4% of women globally reside in countries that offer almost complete legal equality
-
 Tech4 days ago
NASA Reveals Identity of Astronaut Who Suffered Medical Incident Aboard ISS
-

 Crypto World6 days ago
Entering new markets without increasing payment costs
-
Politics2 days ago
FIFA hypocrisy after Israel murder over 400 Palestinian footballers