
Crypto World
Japanese payments firm PayPay, partial owner of Binance Japan, seeks $1.1 billion IPO


PayPay, a SoftBank Corp-backed payments company that owns a 40% stake in Binance Japan, is seeking to raise as much as $1.1 billion in a U.S. initial public offering, Reuters reported Monday.
The Tokyo-based company and a selling shareholder plan to offer 55 million American depositary shares priced between $17 and $20 each, according to the report. At the top end of that range, the offering would value PayPay at more than $10 billion.
PayPay is Japan’s largest cashless payments provider, with more than 70 million registered users. The company’s app allows consumers to make mobile payments at stores, transfer money and manage digital balances, as Japan steadily shifts away from cash.
The shares are expected to trade on the Nasdaq under the symbol “PAYP.” The listing was initially slated to launch before markets opened on Monday but was postponed after global markets were rattled by this weekend’s attack on Iran, Reuters reported earlier.
The IPO comes as fintech firms test investor appetite for new listings amid volatile equity markets and rising geopolitical risk. A successful debut would mark one of the larger Japanese listings in the U.S. in recent years and provide SoftBank with another publicly traded asset tied to its broader digital finance strategy.
PayPay moved deeper into crypto through a capital and business alliance with Binance Japan in October. The partnership aimed to link digital payments with crypto, letting Binance Japan users fund purchases and withdraw proceeds through PayPay Money. A representative for Binance did not respond to a request for comment in time for publication.


TLDR:
- Nike stock has fallen 76% from its 2021 all-time high of $179.10, now trading between $42 and $46 per share.
- China sales are projected to drop 20% as local brands like Li-Ning capture the mid-to-high-tier footwear market.
- Converse recorded a 35% revenue plunge, reflecting Nike’s broader loss of relevance in lifestyle and streetwear segments.
- Tim Cook and Director Bob Swan purchased a combined $3.5M in Nike shares, signaling boardroom confidence at decade lows.
Nike stock has fallen to its lowest level in over a decade, trading between $42 and $46 following an April 2026 earnings shock.
The decline represents a 76% drop from its 2021 all-time high of $179.10, erasing 12 years of gains for long-term shareholders.
Meanwhile, board members are purchasing shares at these levels, creating a split between public sentiment and insider conviction.
Overseas Pressure and Brand Challenges Drive Nike’s Decline
Nike faces a projected 20% sales drop in China, one of its highest-margin markets. The shift stems from Guochao, a cultural movement among Chinese millennials and Gen Z embracing domestic brands and national identity.
Local competitor Li-Ning sold over 26 million pairs of professional running shoes last year, moving firmly into the mid-to-high-tier segment.
As Li-Ning and similar brands gain ground, Nike’s premium positioning in China is becoming harder to defend. Analyst Ali Charts observed on X, noting that Nike is “currently weathering its most significant structural challenge since 2014,” with the stock retreating to a decade-low and erasing 12 years of gains for long-term holders.
The pressure is not limited to performance footwear. Converse, Nike’s lifestyle subsidiary, recorded a 35% revenue plunge, pointing to a broader loss of cultural relevance in the casual and streetwear segments.
This decline serves as a clear signal that the market is moving away from the classic aesthetics Nike has long relied on.
In response, CEO Elliott Hill has moved to rebuild wholesale partnerships with retailers like Foot Locker and Dick’s Sporting Goods.
This shift reverses the Direct-to-Consumer strategy that previously supported Nike’s higher profit margins. While it helps clear inventory, it marks a structural retreat for the brand.
Board Members Buy Shares as Stock Hits Oversold Territory
On the technical side, Nike’s monthly RSI has reached its most oversold reading since the company went public. Historically, Nike’s corrections have ranged from 24% to 73%. The current 76.5% drawdown from its all-time high is the steepest in company history.
Ali Charts further noted that the stock appears to be in the “Anger Phase” of the market cycle. This is the period when negative news feels heaviest, often just as a price floor begins forming. The zone between $35 and $42 is being watched as a potential long-term support area.
Against this backdrop, two Nike board members made notable open-market purchases. Tim Cook, Apple’s CEO and a Nike director, bought approximately $3 million in Nike shares. Director Bob Swan added $500,000 to his position at similar price levels.
Insider purchases of this size, made during a period of broad pessimism, tend to attract attention from value-oriented investors. They suggest that those closest to the company view current challenges as correctable rather than permanent.

LayerZero has attributed the Kelp DAO exploit to North Korea’s Lazarus Group, identifying a single-point-of-failure in the protocol’s verifier setup as the technical root cause that made the attack possible.
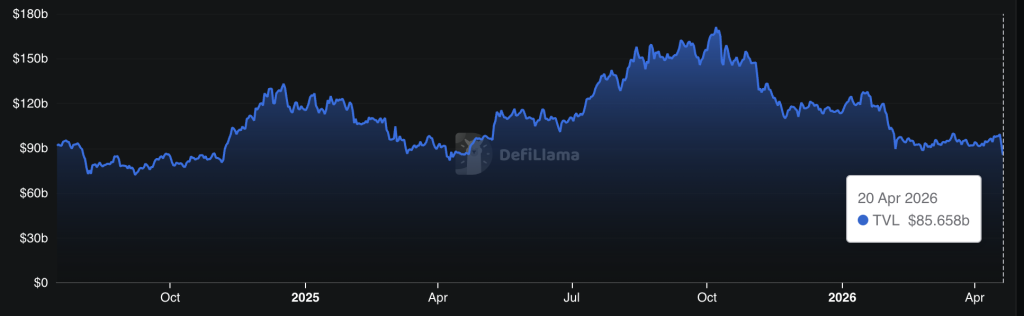
The breach drained an estimated $292 million from Kelp DAO’s rsETH pool on April 18, marking the largest DeFi hack of 2026 to date – and sent total value locked across the DeFi sector down 7% in 24 hours to $85 billion, according to DefiLlama.

The attribution lands not as a closed finding but as a probabilistic claim: LayerZero says Lazarus is the likely perpetrator, not a confirmed one. What that distinction means for the protocol, its users, and the cross-chain security model is the question this story answers.
- Attribution source: LayerZero conducted the post-incident investigation and named North Korea’s Lazarus Group – specifically the TraderTraitor subgroup – as the likely perpetrator.
- Technical root cause: Kelp DAO operated a 1-of-1 DVN (single decentralized verifier node) setup, ignoring LayerZero’s repeated recommendations for multi-verifier redundancy.
- Exploit amount: Approximately $292 million drained from Kelp DAO’s rsETH pool; no LayerZero protocol code or private keys were compromised.
- Market impact: DeFi TVL fell 7% in 24 hours to $86 billion following the incident.
- Response: LayerZero decommissioned affected RPC nodes and restored full DVN operations; law enforcement collaboration is ongoing for fund tracing.
- Watch: Whether Kelp DAO announces a compensation mechanism and whether additional cross-chain protocols operating single-DVN configurations move to remediate before the next attack.
Discover: The best pre-launch token sales
LayerZero’s Kelp DAO Lazarus Findings: What a Single-Point Failure Actually Means in Cross-Chain Architecture
The exploit’s mechanism was multi-step and precise. Attackers poisoned the RPC infrastructure feeding LayerZero’s decentralized verifier network, then launched a DDoS attack designed to force failover to compromised backup nodes.
With the verifier network redirected, the system validated fictitious cross-chain transactions, and $292 million in rsETH exited Kelp DAO’s pool before the fraud was detected.
The critical enabler: Kelp DAO ran a 1-of-1 DVN configuration, meaning a single verifier node stood between the protocol and catastrophic failure. LayerZero had flagged this architecture as inadequate – multiple times, according to the investigation – and recommended a multi-DVN setup consistent with industry best practices for redundancy. Kelp DAO did not act on those recommendations.
A multi-DVN setup would have required attackers to compromise several independent verification nodes simultaneously, a substantially harder technical lift. The 1-of-1 setup collapsed that barrier entirely. As Ripple CTO David Schwartz put it on X: “The attack was way more sophisticated than I expected and aimed at LayerZero infrastructure taking advantage of KelpDAO laziness.”
LayerZero’s response was surgical: the team decommissioned all affected RPC nodes post-incident and fully restored DVN operations without broader contagion to other protocols using the same infrastructure. No LayerZero protocol code was compromised. No private keys were exposed. The failure was architectural, not foundational – a distinction that matters enormously for the protocol’s credibility but does nothing to recover the $292 million.
Why North Korea Attribution Changes the Threat Model for All of DeFi
LayerZero’s Lazarus Kelp DAO attribution, framed as likely, not confirmed, is consistent with an established and accelerating pattern.
The TraderTraitor subgroup, a known Lazarus operational unit, was preliminarily identified in the forensic analysis. LayerZero is actively collaborating with global law enforcement on fund tracing, suggesting the attribution carries enough evidentiary weight to involve state-level investigative resources.
Lazarus has been tied to some of the largest crypto thefts on record, including the $625 million Ronin Network hack in 2022 and a string of DeFi protocol exploits that have collectively funneled billions into DPRK’s weapons programs, according to U.S. Treasury and UN assessments.
North Korea’s crypto operations extend well beyond direct exploits – the regime has also embedded operatives inside Web3 companies under fabricated identities, a parallel track that widens the attack surface beyond infrastructure alone.
Cross-chain protocols are structurally attractive targets for this class of actor. They sit at high-value junctions between multiple chains, often carrying pooled liquidity that dwarfs any single application’s balance, and their security depends on verifier networks that can become single points of failure when misconfigured. RPC poisoning as a tactic against verifier networks represents a novel escalation – one that security researchers say is now documented and replicable.
Discover: The best crypto to diversify your portfolio with
The post LayerZero Says Lazarus Group Likely Behind Kelp DAO Exploit appeared first on Cryptonews.


Tangem Pay lets users spend USDC directly from their self-custodial Tangem wallets, settling all transactions on Polygon.
Switzerland-headquartered hardware wallet company Tangem today announced the global rollout of its retail payments product, Tangem Pay, per a press release shared exclusively with The Defiant.
The new feature lets Tangem wallet users spend stablecoin USDC anywhere where Visa is accepted, using virtual Visa cards that can be added to Apple Pay and Google Pay.
The wallet manufacturer also announced today that it is partnering with Polygon for the new product, with the blockchain providing on-chain settlement for all transactions.
As of today, Tangem Pay is available to users in the U.S. (excluding some states), Latin America, and select countries in the Asia-Pacific region. The global rollout follows an early-access phase for waitlisted users that began in November, the press release notes.
Tangem is a self-custodial hardware wallet founded in 2017. Unlike crypto hardware wallet giants Trezor and Ledger, Tangem only offers NFC-powered devices for crypto storage, which come in two forms: a card that’s about the size and shape of a bank card, as well as a wearable ring.
How It Works
To pay with Tangem Pay, users need to convert funds they want to spend into USDC first, before transacting, the firm clarifed to The Defiant. “Over time, we will expand supported assets and settlement options,” Tangem Pay CEO Marcos Nunes told The Defiant.
Currently, the wallet only lets users create virtual Visa cards that they can add to payment services like Apple Pay. But the firm plans to launch physical cards as well.
“A large part of the world still relies on physical cards, and we want to support that fully,” said Nunes. Tangem Pay’s CEO told The Defiant that the physical Visa card launch is expected this year.
Why Polygon?
Tangem said that the firm selected Polygon for its transaction speed, predictable fees, and ability to handle the high transaction volumes required for global payments. “Payments are a scale game, not a theory exercise,” Nunes told The Defiant, continuing, “You need near-zero fees, fast finality, and reliability under load. Polygon delivers that today in a way that supports real daily spending.”
Nunes also added, “We are not dogmatic about chains. This is an infrastructure decision. If something better emerges, we will adapt.”
Per the press release, Polygon will cover gas fees for users, at least for the initial rollout period. There are no fees from Tangem’s side, Nunes clarified to The Defiant. “It should feel like using money in a regular account.”
Aishwary Gupta, head of global business development at Polygon Labs, said in a statement: “With Polygon as the settlement layer, Tangem Pay makes self-custody practical for real-world spending, combining the transparency of blockchain with the speed and reliability users expect.”
Polygon is an Ethereum sidechain with $1.27 billion in total value locked in DeFi across 775 protocols, per DefiLlama. That makes it the 11th-largest chain in DeFi by TVL, while it’s currently the 4th-largest chain by 24-hour active addresses.
In January, Polygon Labs announced its acquisition of two U.S. regulated crypto companies, Coinme and Sequence, adopting their licenses and enabling Polygon’s operations as a regulated payments platform across 48 U.S. states.

Spot Bitcoin ETFs logged nearly $1 billion in weekly net inflows last week, their strongest seven-day stretch since mid-January, per CoinGlass flow data.
BlackRock’s IBIT alone absorbed $612 million of that total, confirming institutional concentration in the dominant fund. The core question now: does this flow momentum translate into durable price support, or does tactical resistance cap the rally again?
Year-to-date Bitcoin product inflows have turned positive for the first time since January, a threshold Bloomberg ETF analyst Eric Balchunas flagged as signaling “extraordinary institutional acceptance” of Bitcoin as an asset class.
Total net assets across all U.S. spot Bitcoin ETFs surpassed $101 billion by Friday’s close, with daily trading volumes approaching $4.8 billion.
- Weekly inflows: Nearly $1 billion – highest since mid-January
- IBIT dominance: BlackRock captured $612 million of total flows
- Total net assets: Surpassed $101 billion by end of week
- YTD flows: Turned positive for first time since January per Bloomberg’s Balchunas
- Global share: U.S. institutions captured 96.4% of $1.1 billion in global crypto product inflows
- ETH ETFs: $275 million net inflows; XRP ETFs added $11.75 million; Solana lost $5.6 million
Discover: The best crypto to diversify your portfolio with
What $1 Billion in Weekly Bitcoin ETFs Inflows Actually Signals
The weekly flow breakdown reveals a Friday-heavy pattern: $663.9 million hit on Friday alone, roughly two-thirds of the total, with Tuesday contributing $411.5 million and Wednesday adding $186 million. Thursday brought just $26 million, and Monday registered a $291 million outflow. That volatility in daily flows suggests opportunistic accumulation rather than a steady institutional drip.
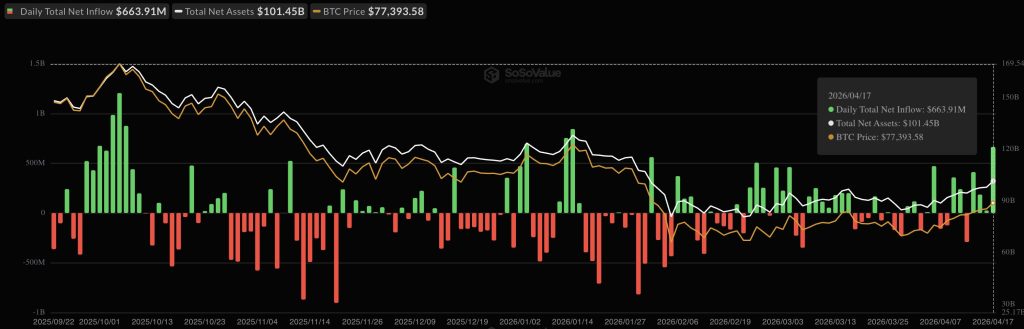
IBIT’s $612 million weekly haul pushed its market cap to $159.22 billion, placing it among the world’s largest ETFs by assets. Fidelity’s FBTC also contributed meaningfully to inflows, while Grayscale’s GBTC continued to bleed – a split that reflects sustained conviction in lower-fee products and residual exit pressure from legacy holders.
U.S. institutions captured 96.4% of global crypto product inflows last week, absorbing $1.06 billion of a $1.1 billion global total. That concentration matters: it signals that Bitcoin demand is increasingly centralized in regulated U.S. vehicles, making ETF flow data the most reliable leading indicator for near-term BTC price direction.
If weekly inflows sustain above $750 million, BTC’s support floor around current levels strengthens materially. If flows revert toward the $200–$300 million range seen during January’s plateau, the bid thins out fast.
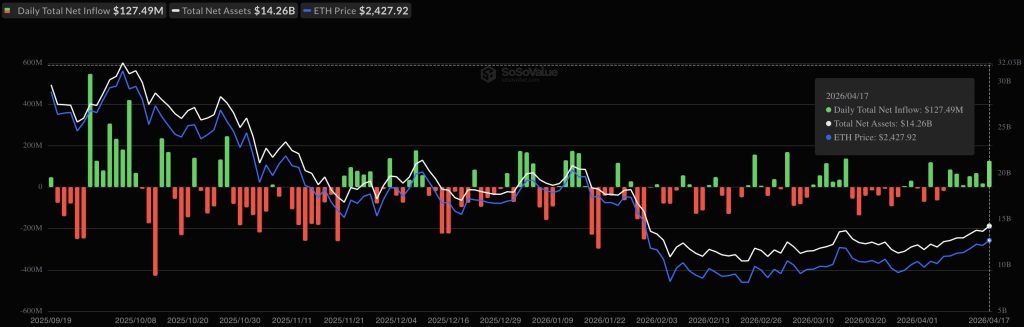
Ethereum spot ETFs pulled in $275 million net last week, XRP ETFs added $11.75 million, and Solana shed $5.6 million; this was selective altcoin rotation, not a broad risk-on flush.
Discover: The best pre-launch token sales
The post Spot Bitcoin ETFs Near $1 Billion in Weekly Inflows, Best Stretch Since Mid-January appeared first on Cryptonews.


BitMine Immersion Technologies (BMNR), the largest Ethereum-focused digital asset treasury firm, sped up its crypto purchase pace as chairman Tom Lee sees growing signs of the crypto “mini-winter” ending.
The firm reported Monday it acquired 101,627 ether (ETH) last week, its largest weekly haul since December 15. The purchase, worth roughly over $230 million at current ETH prices, lifted BitMine’s total holdings to 4.97 million ETH.
The move comes as most digital asset treasuries — except Michael Saylor’s bitcoin-focused Strategy (MSTR) — have slowed or halted buying in recent months. BitMine remains among the last large-scale buyers of ether-focused treasuries, continuing to provide a steady source of demand for ETH.
BitMine’s total crypto and cash holdings stand at $12.9 billion. In addition to its ETH treasury, the firm holds 199 bitcoin, $1.12 billion in cash and equity stakes including investments in Beast Industries and Eightco Holdings.
Chairman Thomas Lee said the firm sees signs that the recent downturn is nearing an end, pointing to ETH’s rebound and broader market dynamics.
“Bitmine has maintained the increased pace of ETH buys in each of the past four weeks, as our base case ETH is in the final stages of the ‘mini-crypto winter,’” Lee said.
He added that ether has risen sharply from its early February lows and has outperformed equities since the start of the Iran conflict, supported by demand tied to tokenization and AI-related use cases.
BitMine has also continued expanding its staking operations. The firm has staked more than 3.3 million ETH, or about two-third of its holdings, generating roughly $221 million in annualized revenue.


Michael Saylor’s Strategy (MSTR) added 34,164 bitcoin to its treasury over the past week at an average price of about $74,395 per coin, for a total cost of roughly $2.54 billion, according to a Monday filing.
The purchase brings the company’s total holdings to 815,061 BTC, acquired for approximately $61.56 billion at an average cost basis of $75,527. With BTC currently trading at around $75,000, Strategy’s stash is currently break even. Strategy is the world’s largest publicly-listed bitcoin holder. It began acquiring BTC as a balance sheet asset in 2020.
Last week’s acquisitions were funded by $2.2 million raised through sales of the company’s preferred stock, Stretch (STRC), and $366 million from common stock offerings.
MSTR shares are down more than 2.5% in pre-market trading.


Users have been advised to stop interacting with any DeFi application for a few days after Vercel, the creator of Next.js and cloud provider for a large number of crypto’s user-facing platforms, admitted that attackers breached its internal systems.
According to Vercel CEO Guillermo Rauch, the attack happened when one of its employees “got compromised via the breach of an AI platform customer called Context.ai that he was using.”
The attackers, who Rauch says were “significantly accelerated by AI,” apparently escalated through the employee’s Google Workspace account into Vercel’s corporate environment.
A BreachForums seller claiming to be extortion crew ShinyHunters is demanding a $2 million ransom via a listing that allegedly includes GitHub tokens.
For DeFi, the incident is a nightmare. A user interacting with a poisoned Next.js package via a website can sign a transaction straight into an attacker’s wallet.
Vercel disclosed the incident in a Sunday security bulletin, saying that it had found “unauthorized access to certain internal Vercel systems” and had already engaged law enforcement.
Following the disclosure, X user and Cork Protocol CTO “Pybast,” who is also former CTO of DeFi cybersecurity company Nefture, warned users to stop interacting with “any DeFi application,” adding that “a lot of DeFi is hosted on Vercel and crypto users are a prime target for such attack.”
Comically, he suggested eth.limo, which also had its own security incident on the same day, as a safer alternative.
Next.js cleared 520 million downloads in 2025, according to Rauch. DeFi dashboards, crypto wallet connectors, and token launchpads use it.
Members of the crypto community were concerned that the hacker could use Vercel credentials to push malicious code to dependencies pulled by thousands of downstream projects.
Rauch has named Mandiant, Google’s incident-response arm, as the firm assisting with incident response.
Only a “limited subset of customers” was affected, Rauch claimed, and services remained operational.
Read more: ‘Decentralized’ apps suffer after Ledger Connect Kit attack
DeFi terrified after Vercel breach
A screenshot of the ransom notice, published by BleepingComputer, advertises multiple employee accounts, internal deployments, API keys, and GitHub tokens.
The vendor attached hundreds of employee records, a screenshot of Vercel’s internal Linear instance, and what appears to be an internal enterprise dashboard.
BleepingComputer couldn’t verify their authenticity.
Curiously, threat actors tied to the actual ShinyHunters extortion crew told BleepingComputer that they had nothing to do with this particular caper.
Got a tip? Send us an email securely via Protos Leaks. For more informed news, follow us on X, Bluesky, and Google News, or subscribe to our YouTube channel.

Si vous cherchez un site de pari sportif fiable et sécurisé, vous êtes au bon endroit. Dans cet article, nous allons vous présenter les avantages de l’application Melbet APK Maroc et les mesures de sécurité mises en place pour protéger vos informations personnelles.
Télécharger Melbet est un choix populaire parmi les fans de sport et les passionnés de jeu. Cependant, il est important de choisir une version APK fiable et sécurisée pour éviter les problèmes de sécurité. Dans ce contexte, l’application Melbet APK Maroc est une excellente option.
La sécurité est un des principaux objectifs de Melbet. L’application utilise des protocoles de sécurité de pointe pour protéger vos informations personnelles et vos transactions. De plus, Melbet dispose d’une équipe de sécurité expérimentée qui travaille en permanence pour détecter et prévenir les menaces potentielles.
En téléchargeant Melbet APK Maroc, vous bénéficiez d’une expérience de jeu sécurisée et fiable. L’application est disponible pour téléchargement sur le site officiel de Melbet et peut être installée sur votre appareil mobile ou ordinateur.
En résumé, l’application Melbet melbet app APK Maroc est une excellente option pour les fans de sport et les passionnés de jeu qui cherchent une expérience de jeu sécurisée et fiable. Avec ses mesures de sécurité mises en place et son équipe de sécurité expérimentée, Melbet est un choix sûr pour vos paris sportifs.
Il est important de noter que la sécurité est un effort continu et que Melbet travaille en permanence pour améliorer ses mesures de sécurité.
Melbet APK Maroc est disponible pour téléchargement sur le site officiel de Melbet.
Melbet APK Maroc : Sécurité et protection des utilisateurs
Pour garantir une expérience de jeu sécurisée et protégée, il est essentiel de télécharger l’application Melbet APK Maroc. Cette application offre une variété de fonctionnalités pour protéger vos informations personnelles et votre argent.
En téléchargeant l’application Melbet APK Maroc, vous pouvez être sûr que vos données sont cryptées et protégées par des mesures de sécurité robustes. De plus, l’application offre une fonction de verrouillage pour empêcher les accès non autorisés à votre compte.
Il est également important de noter que l’application Melbet APK Maroc est régulièrement mise à jour pour garantir la sécurité et la stabilité de l’application. Cela signifie que vous pouvez être sûr que vous bénéficiez de la dernière version de l’application, avec les meilleures fonctionnalités de sécurité et de protection.
En outre, l’application Melbet APK Maroc offre une fonction de réinitialisation de mot de passe pour vous aider à récupérer votre compte en cas de problème. Cela signifie que vous pouvez être sûr de récupérer votre compte rapidement et facilement, sans avoir à vous soucier de la sécurité de vos informations.
En résumé, télécharger l’application Melbet APK Maroc est la meilleure façon de garantir une expérience de jeu sécurisée et protégée. Avec ses fonctionnalités de sécurité et de protection, vous pouvez être sûr de jouer en toute sécurité et de protéger vos informations personnelles.
Il est donc recommandé de télécharger l’application Melbet APK Maroc pour bénéficier de ces fonctionnalités de sécurité et de protection. Vous pouvez télécharger l’application en cliquant sur le lien suivant : [télécharger l’application Melbet APK Maroc](https://www.melbet.com/maroc/download).
En résumé, l’application Melbet APK Maroc est la meilleure façon de garantir une expérience de jeu sécurisée et protégée. Avec ses fonctionnalités de sécurité et de protection, vous pouvez être sûr de jouer en toute sécurité et de protéger vos informations personnelles.
La nécessité d’une application sécurisé
Il est essentiel de disposer d’une application sécurisée pour protéger vos informations personnelles et vos transactions en ligne. La mélbet app est une application sécurisée qui garantit la confidentialité de vos informations et la protection de vos transactions.
En téléchargeant la mélbet app, vous pouvez être sûr que vos informations sont protégées et que vos transactions sont sécurisées. La mélbet app utilise des méthodes de cryptage avancées pour protéger vos informations et vos transactions.
Il est important de noter que la mélbet app est disponible pour téléchargement sur les appareils mobiles et les ordinateurs de bureau. Vous pouvez télécharger la mélbet app sur votre appareil mobile ou votre ordinateur de bureau pour accéder à vos informations et vos transactions en ligne.
En utilisant la mélbet app, vous pouvez être sûr que vos informations sont protégées et que vos transactions sont sécurisées. La mélbet app est une application sécurisée qui garantit la confidentialité de vos informations et la protection de vos transactions.
Il est important de noter que la mélbet app est disponible en plusieurs langues, y compris le français. Vous pouvez télécharger la mélbet app sur votre appareil mobile ou votre ordinateur de bureau pour accéder à vos informations et vos transactions en ligne.
En résumé, la mélbet app est une application sécurisée qui garantit la confidentialité de vos informations et la protection de vos transactions. Il est essentiel de disposer d’une application sécurisée pour protéger vos informations personnelles et vos transactions en ligne.

A Blue Origin New Glenn rocket carrying an AST SpaceMobile Bluebird 7 satellite launches from pad 36 at Cape Canaveral Space Force Station on April 19, 2026 in Cape Canaveral, Florida.
Paul Hennesy | Anadolu | Getty Images
A failed satellite launch sent of AST SpaceMobile down sharply on Monday.
The stock fell nearly 12% in premarket trading after a rocket designed by Jeff Bezos’ space technology company Blue Origin placed the satellite in a lower-than-planned orbit on Sunday.
AST SpaceMobile’s BlueBird 7 satellite would have been the company’s eighth launched into low-earth orbit, the company said in a Sunday press release. It was launched on Blue Origin’s third New Glenn rocket.
Blue Origin acknowledged in a post on X that the satellite was placed into the wrong orbit, but only added it was assessing the situation and would provide further updates. The company hasn’t made a statement since the satellite was officially deemed lost.
The cost of the satellite loss is expected to be covered by an insurance policy, AST said in the release. It also still expects to launch a satellite on average once every one to two months in 2026, and said BlueBird satellites 8, 9 and 10 should be ready to ship in 30 days.

ASTS year-to-date chart.
William Blair analyst Louie DiPalma thinks that AST’s goal of 45 satellites in orbit by year-end will likely be hard to hit now. However, he didn’t see Sunday’s events as a total loss for the company.
“AST gained experience integrating its satellite with New Glenn and working with the Blue Origin team,” DiPalma wrote in a Monday note. “This experience will be integral for future missions. The silver lining is that there was only one satellite on board, whereas future New Glenn launches may have as many as eight of AST’s BlueBirds.”
While Clear Street analyst Greg Pendy was still bullish on the stock, reiterating a buy rating after the news, he cut his price target to $115 from $137. That’s still a 34% gain from Friday’s close, but much less than his previously forecasted 60% jump in shares.
UBS analyst Christopher Schoell said in a note the financial impact on AST will be limited, but added that AST and its share price performance are now linked with Bezos’ Blue Origin.
“We believe the success of Blue Origin’s New Glenn vehicle … is key to meeting year-end deployment targets/ management’s 2027 revenue goal, and expect the uncertainty to weigh on investor sentiment initially pending greater clarity,” Schoell wrote.
Markets shift and headlines fade, but the core principles of building long-term wealth remain constant. Join us for our third CNBC Pro LIVE, where investors of all backgrounds – from financial professionals to everyday individuals – come together to cut through the noise and gain actionable strategies for smarter, more disciplined investing. No matter where you’re starting from, you’ll leave with clearer thinking, stronger strategies. Enter your email here to get a discount code

Key Takeaways
- Fermi (FRMI) shares plummeted 20% to $5.27 during premarket hours Monday following executive departures
- CEO Toby Neugebauer resigned; CFO Miles Everson simultaneously exited his role
- Board members had been evaluating potential CEO replacement for a minimum of three months
- Company unveiled “Fermi 2.0” initiative, representing a comprehensive overhaul of governance and strategy
- Evercore analysts reaffirmed Outperform rating with $20 price target for FRMI
Shares of Fermi (FRMI) tumbled 20% on Monday following the data-center company’s announcement that both its chief executive and chief financial officer would be exiting, prompting a comprehensive leadership transformation the firm has branded “Fermi 2.0.”
Co-founder and CEO Toby Neugebauer, who established the company with former Texas Governor and U.S. Energy Secretary Rick Perry, resigned with immediate effect. Neugebauer will continue serving as a board member.
According to reports, the board had been deliberating a potential CEO replacement for no less than three months. Several sell-side analysts verified this timeline after participating in a management conference call that followed the public disclosure.
CFO Miles Everson similarly departed from his executive position. Following his resignation, Everson was appointed to the board after a trust controlled by the Neugebauer family executed its board nomination privileges.
The board has initiated an active search for Neugebauer’s successor. Leadership recruitment firm Heidrick & Struggles has been retained, with a committee composed of independent board members overseeing the selection process.
Fermi has additionally established an Office of the CEO to maintain business continuity throughout the transition period. Jacobo Ortiz Blanes, the former COO, and Anna Bofa, previously serving as a Board Advisor, have been promoted to Co-Presidents and will answer to newly designated Chairman Marius Haas.
Haas, who formerly held the position of Lead Independent Board Director, assumed the role of Executive Chairman immediately.
Jeffrey S. Stein, co-founder of Breakpoint Advisory Partners, joined the board as a new member, increasing the board size from five to seven seats.
Executive Transition Linked to Tenant Acquisition Struggles
The management upheaval arrives as Fermi has encountered difficulties securing a major anchor tenant for its Project Matador development in Amarillo, Texas. The massive 7,570-acre property is designed to become the world’s largest data center facility.
Company officials emphasized that the transition would not impair its capacity to deliver electrical infrastructure or execute tenant agreements. Management noted that prospective lease negotiations had actually intensified, with potential clients resuming engagement within 48 hours following the announcement.
Evercore analyst Nicholas Amicucci characterized the transformation as a shift in leadership philosophy while maintaining operational momentum. Evercore maintained its Outperform rating and $20 price target on the stock.
FRMI shares had already declined 18% year-to-date before Monday’s trading session, with the premarket selloff driving the price down to $5.27.
Corporate Headquarters Relocation and Expansion Strategy
As a component of the Fermi 2.0 initiative, company leadership revealed plans to relocate corporate headquarters to Dallas. Additionally, Fermi intends to develop a dedicated corporate office facility at the Project Matador location in Amarillo.
Management stated these strategic moves represent the company’s evolution from startup phase to large-scale enterprise operations.
Texas Tech University System Chancellor Brandon Creighton reaffirmed the university’s ongoing commitment to its collaboration with Fermi America. Negotiations continue regarding potential extensions to certain milestone deadlines contained in the lease agreement as Project Matador progresses.
The company indicated it would name an Interim CFO within the current week.

Stop Wasting Your Financial Mistakes | Jewish Wealth #explore #shorts

Paul Revere’s midnight ride reenacted with modern day tweaks

New media space opens in Hull to help city's creatives


-

 Crypto World7 days ago
The SEC Conditionalises DeFi Platforms to Be Avoided for Broker Registration
-

 NewsBeat6 days ago
Trump and Pope Leo: Behind their disagreement over Iran war
-

 Fashion3 days ago
Weekend Open Thread: Theodora Dress
-

 Crypto World7 days ago
SEC Signals Exemption for Crypto Interfaces From Broker Registration
-

 News Videos5 days ago
Secure crypto trading starts with an FIU-registered
-

 Sports3 days ago
NWFL Suspends Two Players Over Post-Match Clash in Ado-Ekiti
-

 Crypto World6 days ago
SEC Proposes Certain Crypto Interfaces Don’t Need to Register as Brokers
-

 Business23 hours ago
Powerball Result April 18, 2026: No Jackpot Winner in Powerball Draw: $75 Million Rolls Over
-

 Crypto World3 days ago
Russia Pushes Bill to Criminalize Unregistered Crypto Services
-

 Politics3 days ago
Palestine barred from entering Canada for FIFA Congress
-
 Business4 days ago
Creo Medical agree sale of its manufacturing operation
-

 Politics1 day ago
Zack Polanski demands ‘council homes not luxury flats for foreign investors’
-
 Entertainment6 days ago
Brand New Day’ Footage Reveals the Devastating Impact of ‘Now Way Home’
-

 Crypto World3 days ago
Russia Introduces Bill To Criminalize Unregistered Crypto Services
-
 Tech5 days ago
Microsoft adds Windows protections for malicious Remote Desktop files
-
 Entertainment7 days ago
Karol G’s ‘Ultra Raunchy’ Coachella Set Gave ‘Satanic Vibes’
-

 Sports7 days ago
Aaron Judge says Yankees need to ‘simplify’ approach amid offensive slump
-

 Entertainment7 days ago
How Babylon 5 Turned Brief Side Story Into Emotional Masterpiece
-

 Tech7 days ago
What was the first ransomware attack to demand payment in Bitcoin?
-

 Tech5 days ago
‘Avatar: Aang, The Last Airbender’ Leaked Online. Some Fans Say Paramount Deserves the Fallout
You must be logged in to post a comment Login