
Crypto World
Bitcoin Slows Its Slide, Bear Market Still in Play, Analysts Say

Bitcoin (CRYPTO: BTC) has shown signs that selling pressure may be fading, though analysts caution that a durable bottom is far from guaranteed. In recent sessions, the asset has hovered around key technical levels, with the 20-day moving average offering a critical backdrop near $68,500 and volatility compressing as traders digest macro headlines. While one market update noted that BTC did not accelerate lower on risk-off news, the broader bear-market narrative remains intact for many observers, keeping upside exposure tactical rather than structural.
Key takeaways
- Bitcoin appears to have shifted tactically rather than signaling a structural reversal, with near-term momentum stabilizing but persistent bearish conditions.
- The price has regained the vicinity of the 20-day moving average around $68,500, and Bollinger Bands are narrowing, potentially setting the stage for a defined trading range rather than a fresh down leg.
- BTC touched just above $70,000 in late trading on Coinbase but retraced to roughly $68,400, indicating continued volatility and intra-session shifts.
- The $62,500 level has held on three tests, reinforcing it as meaningful support amid a broader bear-market context.
- Bullish divergences are emerging in momentum indicators like RSI and stochastic, hinting at a possible stabilization even if the larger trend remains down.
Tickers mentioned: $BTC
Sentiment: Neutral
Price impact: Positive — a price bounce driven by crowd-long liquidations in derivatives and easing selling pressure.
Trading idea (Not Financial Advice): Hold. With no confirmed trend change, tactical exposure is reasonable while monitoring for a clear breakout or breakdown.
Market context: The price action unfolds against a backdrop of narrowing volatility, strengthening ETF-related flows, and evolving macro headlines that influence risk appetite across crypto markets. As liquidity conditions remain nuanced, traders are weighing whether recent moves represent a genuine shift in momentum or a temporary pause within a continuing bear market.
Why it matters
The latest price dynamics matter because they illuminate how traders are positioning around a potential bottom without assuming a durable reversal. The evidence for a tactical shift—such as stabilizing momentum indicators and a guarded recovery after tests of critical support—could influence risk management decisions for both hedge funds and retail participants. Yet the overarching framework remains cautious: many analysts still classify Bitcoin as being in a bear-market regime, meaning that any bullish exposure should be limited in scope and time-bound unless a clear directional breakout occurs.
From a market mechanics perspective, several indicators align to suggest a pause rather than a pivot. Volatility appears to be compressing, ETF flows have shown resilience, and the once-widening Coinbase discount has faded, all of which are inconsistent with a market rushing into a fresh leg lower. Still, analysts caution that these are characteristics of consolidation, not confirmation of a new uptrend. The resilience around the $62,500 level—tested multiple times—provides a potential platform for range-bound activity or a gradual accumulation phase, should buyers step in at these levels with sustained interest.
Additionally, the narrative around derivatives markets cannot be ignored. Recent observations point to deeply negative funding rates as a key driver of a short-term rebound, where crowded short positions were forced to unwind as price found support. While that dynamic can produce sharp, short-lived bounces, it does not by itself constitute a lasting reversal or a trigger for sustained upward price action. The absence of durable macro catalysts—such as clear liquidity inflows or institutional commitments—underscores why traders remain cautious about calling a new bull leg.
What to watch next
- Observe BTC’s behavior around the 62,500 support level over the coming sessions to see if buyers maintain conviction or if bears pressure the price lower again.
- Monitor momentum indicators (RSI, stochastic) for continued bullish divergences or a retreat back into bearish territory.
- Track ETF flow data and any shifts in the Coinbase-related pricing discounts as signals of broader liquidity and investor sentiment shifts.
- Watch for changes in funding rates in derivatives markets; a sustained shift back to positive funding could alter the risk-reward dynamic for long positions.
- Keep an eye on macro catalysts that could reintroduce risk-off pressures or, conversely, catalyze renewed risk appetite in crypto assets.
Sources & verification
- 10x Research market update: Is the Bitcoin correction over, bottom formed, or is this a bear-market trap? ( https://update.10xresearch.com/p/is-the-bitcoin-correction-over-has-the-bottom-formed-or-is-this-a-bear-market-trap )
- Bitcoin price context and market observations referenced in BTC price coverage (Cointelegraph article on price movements and bear-market context): https://cointelegraph.com/news/bitcoin-holders-show-zero-panic-as-btc-hits-dollar70k-amid-middle-east-tensions
- TradingView BTCUSD price data (Coinbase exchange view): https://www.tradingview.com/symbols/BTCUSD/?exchange=COINBASE
- ETF flows and related analysis referenced in coverage of how ETF activity affects Bitcoin price dynamics: https://cointelegraph.com/news/are-bitcoin-etfs-quietly-accumulating-or-just-not-selling-the-flow-data-that-matters
- Derivatives funding rate context and potential short-squeeze signals: https://cointelegraph.com/news/negative-bitcoin-funding-rate-may-signal-pending-short-squeeze-above-dollar70k
Bitcoin price action: tests of support and momentum signals
Bitcoin (CRYPTO: BTC) has been navigating a delicate balance between tactical resilience and structural risk. After a period in which selling pressure appeared to intensify alongside macro headwinds, the market is displaying a constellation of signals that traders read as a potential shift in near-term dynamics without confirming a new long-term trend. The most cited technical talking points center on the interaction with the 20-day moving average, the narrowing of volatility bands, and the resilience of a critical support zone around $62,500.
The 20-day moving average has re-emerged as a yardstick for assessing near-term momentum, with BTC hovering near that level at the time of writing. A tightening of Bollinger Bands reinforces the notion that price action may be compressing into a more defined range, which often precedes a breakout or a sustained consolidation. In practical terms, a break above the upper band could portend a bullish continuation, while a break below the lower band would reaffirm downside risk in a bear-market context. These technical nuances are amplified by the price’s behavior around the $70,000 mark in late sessions, where a brief ascent gave way to a retracement as traders reassessed risk and liquidity conditions.
From a supply-demand perspective, the $62,500 threshold has proven notable. It withstood tests on three separate occasions, suggesting authentic support that buyers have targeted in a market characterized by fragile liquidity. The price’s ability to rebound from the $63,000s demonstrates that demand exists at specific price points, even as overall sentiment remains cautious. In tandem, momentum indicators—specifically RSI and stochastic—have started to exhibit bullish divergences, a pattern that traders often interpret as an early harbinger of stabilizing momentum. While these signals are encouraging at the margin, they are not a substitute for a decisive trend shift, especially as macro catalysts remain uncertain.
Beyond the price action, market mechanics play a central role in interpreting the recent bounce. Negative funding rates in derivatives markets have contributed to a squeeze dynamic, where crowded short positions were unwound as price rose from the mid-$60,000s. This type of price activity is not inherently indicative of a durable reversal; it reflects the intricacies of leverage and risk parity in a market that remains susceptible to rapid shifts. The absence of broad, structural inflows—particularly from institutional buyers—keeps the door open for renewed pressure should liquidity conditions deteriorate or if macro risk sentiment deteriorates further.
Looking ahead, the market will be watching for sustained price action that can convert tactical gains into a more persistent trend. Traders will evaluate whether the momentum divergences sustain themselves, whether ETF flow dynamics continue to provide relief to selling pressure, and whether any macro event can catalyze a more pronounced shift in risk appetite. In the meantime, market participants are likely to treat any move that reclaims or holds above the $68,000–$70,000 zone as a potential cue for cautious optimism, while remaining mindful of the longer-term bear-market framework that many analysts still cite as the prevailing context.


Coinbase CEO Brian Armstrong said the company has started testing AI agents on Slack and email to assist employees with work tasks, continuing the company’s efforts to embed AI into its workflows.
In a post to X on Saturday, Armstrong said the company has already deployed two AI agents, modeled after two former executives, speculating that AI agents could eventually outnumber human employees at the crypto exchange.
“Soon, it will be easy for any employee to spin up a new agent for themselves or their team. I suspect we will have more agents than human employees at some point soon.”
Major tech companies have laid off thousands of employees this year as they increased their reliance on AI. Armstrong has been pushing for AI to automate more workflows at Coinbase, stating in September that he wants more than 50% of the company’s code to be written by AI.
A month before, Coinbase said one of its biggest focuses is to transform its more than 4,000-member workforce into “AI-Natives.”
Coinbase introduces AI agents Fred and Balaji
One of the AI agents is Fred, named after Coinbase co-founder Fred Ehrsam. Fred will serve as the company’s “strategic executive agent,” assisting Coinbase workers with strategic clarity and priority alignment while offering executive-level feedback.
The other is Balaji, the agent of chaos and creativity who was modeled after Coinbase’s former chief technology officer, Balaji Srinivasan.
Balaji has been brought in to challenge assumptions and assist Coinbase employees with thinking outside the box in an effort to “spark innovation.”

Coinbase has also contributed to the agentic AI wave, having launched the x402 protocol for agentic AI payments on crypto and fiat rails in May 2025.
AI agents tipped to play a big role in crypto
The move comes amid a broad industry belief that AI agents could become the dominant users of blockchain payments in the coming years.
Related: How AI agents can reshape arbitrage in prediction markets
Earlier this month, Armstrong predicted there will be “more AI agents transacting online than humans very soon,” echoing comments from Circle CEO Jeremy Allaire in January that “literally billions of AI agents” will be transacting onchain in three to five years.
Former Binance CEO Changpeng Zhao also said in January that crypto is the “native currency for AI agents,” which will handle everything from buying tickets to paying bills without credit cards.
Magazine: AI agents will kill the web as we know it: Animoca’s Yat Siu

Key Highlights
- BTC plummeted to approximately $73,753 following Iran’s refusal to participate in additional U.S. peace negotiations
- The cryptocurrency had climbed to $78,300 on Friday before geopolitical developments reversed momentum
- Iranian officials declined talks scheduled in Islamabad, pointing to American naval operations near its coastline
- The bilateral ceasefire arrangement between Washington and Tehran concludes Wednesday, April 22
- Market sentiment indicator Crypto Fear & Greed Index registers 29 — remaining in “fear” zone
Bitcoin experienced a promising start to the weekend before rapidly surrendering those advances as diplomatic friction between Washington and Tehran intensified throughout the weekend period.
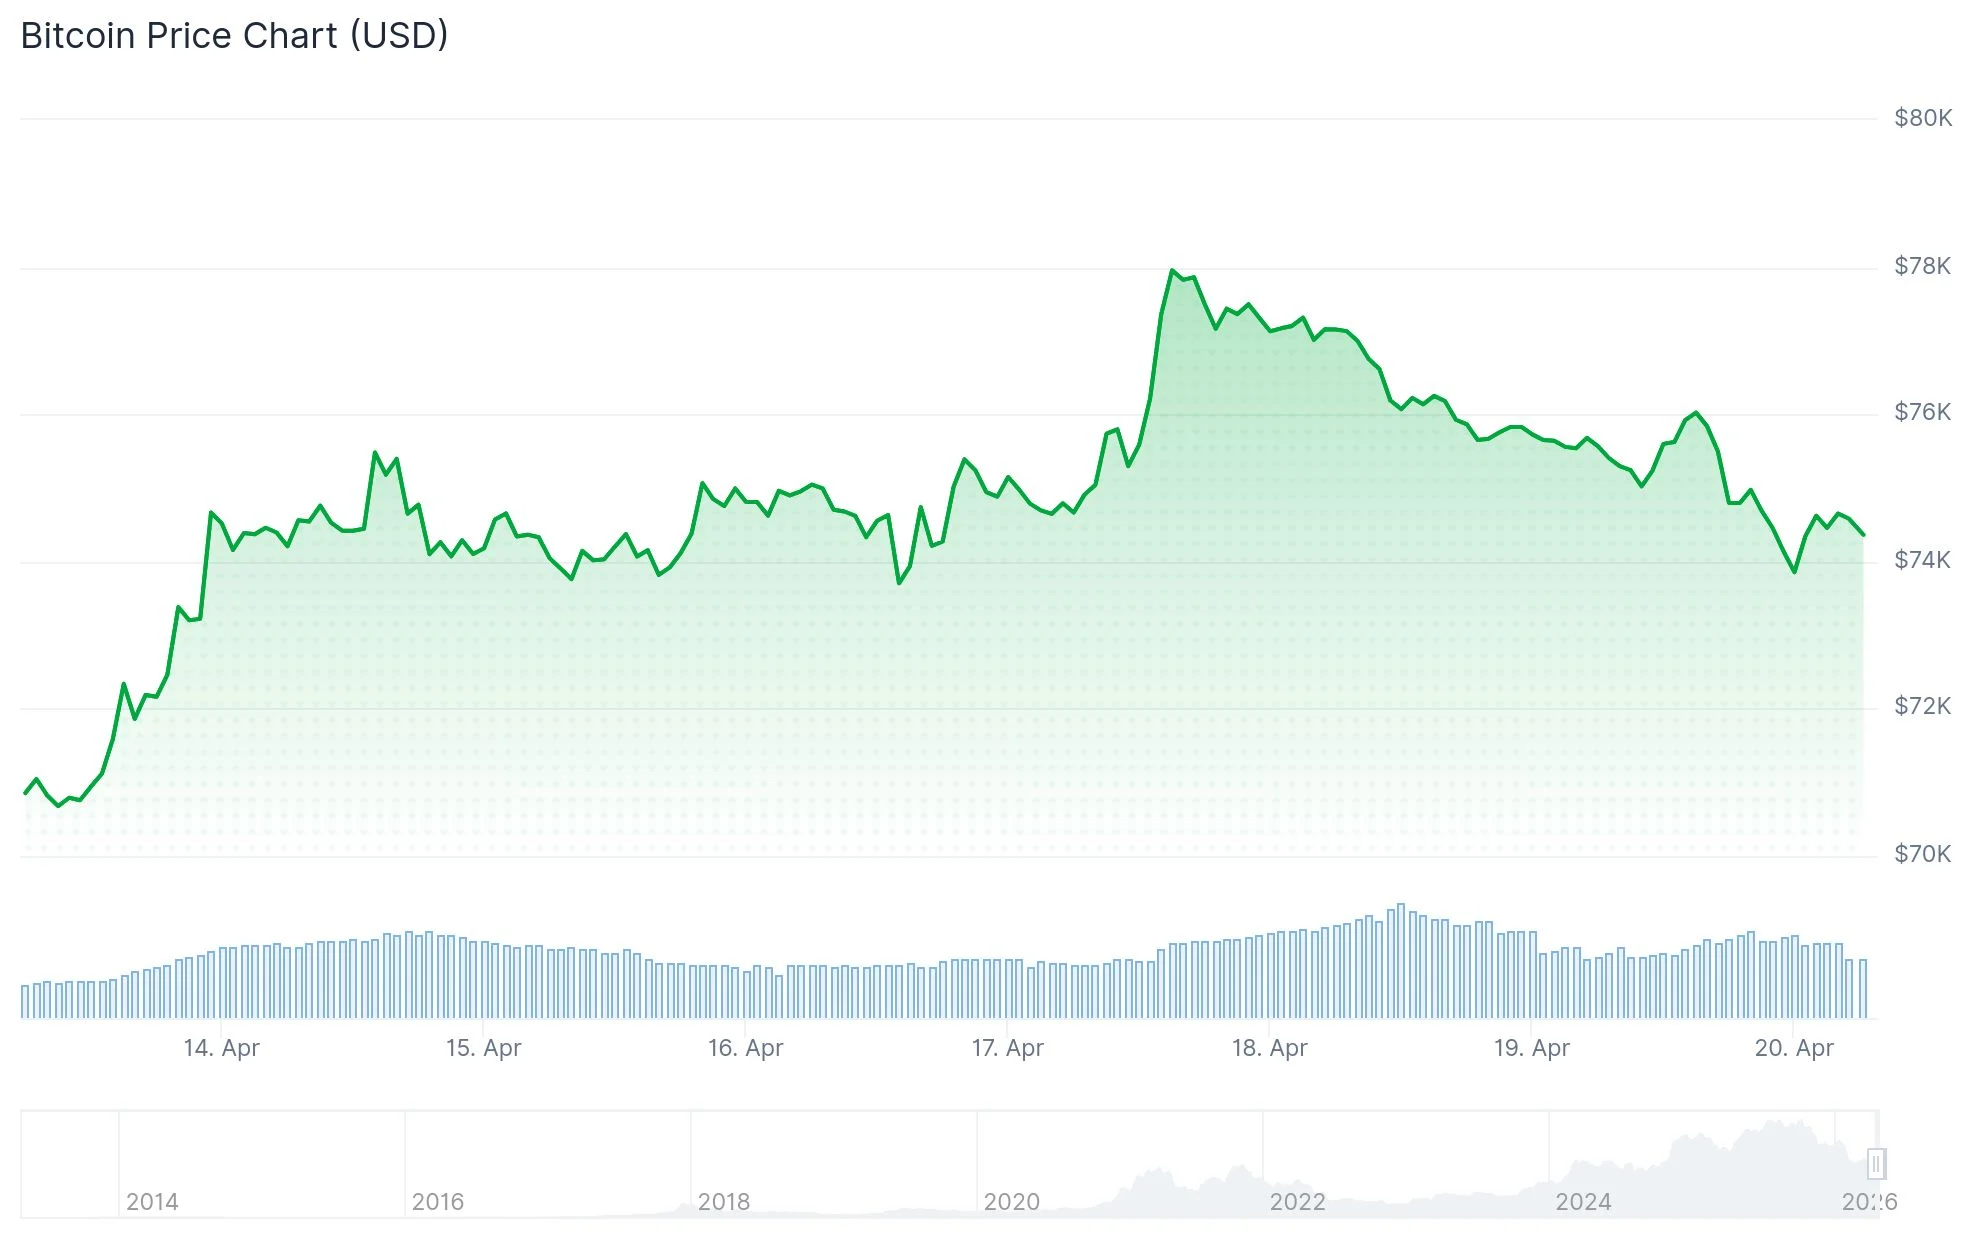
The leading cryptocurrency reached $78,300 on Coinbase during late Friday trading — representing its strongest valuation since early February. However, this upward momentum proved short-lived. By the conclusion of Sunday trading, Bitcoin had slipped beneath the $74,000 threshold.
The catalyst for this decline was Tehran’s decision to withdraw from scheduled diplomatic discussions in Islamabad, Pakistan. Representatives from Iran attributed their decision to Washington’s maritime enforcement activities near Iranian harbors and what they characterized as inconsistent policy positions from American negotiators.
Esmail Baghaei, spokesperson for Iran’s Foreign Affairs ministry, published statements on X platform, characterizing American naval operations as breaches of ceasefire terms and violations of international legal frameworks, specifically citing the UN Charter.
President Donald Trump responded sharply, characterizing Iran’s actions as a “serious violation” of ceasefire terms following Iranian military engagement in the Strait of Hormuz. While Trump expressed continued optimism regarding potential diplomatic resolution, he emphasized an agreement would materialize “one way or another.”
Initial diplomatic sessions occurred April 11–12 in Islamabad, extending beyond 21 hours without producing consensus. Vice President JD Vance acknowledged that Iranian negotiators declined to accept conditions proposed by the United States.
BTC Declines to $73,753 Level
On April 19, the cryptocurrency descended to roughly $73,753 on Bitstamp exchange, representing approximately 2% depreciation within a 24-hour timeframe. This movement pushed BTC outside its previously established $74,000–$77,000 trading corridor.
The wider digital asset marketplace declined in tandem with Bitcoin, with total market capitalization contracting by an estimated $83 billion. The Crypto Fear & Greed Index currently stands at 29 out of 100, maintaining position firmly within “fear” parameters.
American equity futures also retreated Sunday evening. S&P 500 futures decreased 0.8%, Nasdaq-100 declined 0.6%, and Dow Jones futures dropped approximately 450 points. Petroleum futures surged over 4.5% to exceed $95 per barrel amid concerns regarding potential Strait of Hormuz disruptions.
Market analyst Wu Blockchain reported via X that Bitcoin spot exchange-traded funds registered $996 million in net capital inflows during the week spanning April 13–17, representing the third consecutive week of positive movement. Ethereum ETFs attracted $276 million in inflows, XRP spot ETFs recorded $55 million, and SOL spot ETFs accumulated $35 million.
Critical Price Thresholds Under Observation
Technical analysis indicates support zones around $70,500–$71,000 with resistance positioned near $75,000. BTC has attempted to breach $76,000 on multiple occasions in recent trading sessions without sustaining elevation above that mark.
The temporary ceasefire arrangement between Washington and Tehran reaches its conclusion Wednesday, April 22. Iranian authorities have declined further negotiations and accused American officials of violating agreement terms. As of 8:30 p.m. ET Sunday, Bitcoin maintained position marginally above $74,000.


Key Takeaways
- Approximately $290–293 million was stolen from Kelp DAO following a sophisticated attack on RPC nodes connected to LayerZero’s verification system
- Kelp DAO allegedly disregarded LayerZero’s security recommendations to implement multiple verifiers, operating with only one verifier
- Preliminary evidence points to North Korea’s Lazarus Group as the perpetrators behind this security breach
- Nine DeFi platforms, most notably Aave, experienced cascading damage, with Aave’s total value locked declining by $6 billion
- Moving forward, LayerZero has declared it will refuse to support applications operating with single-verifier configurations
In what represents one of 2026’s most significant decentralized finance security breaches, Kelp DAO suffered losses totaling approximately $290–293 million during a weekend attack. LayerZero, the cross-chain messaging protocol utilized in the incident, has attributed the vulnerability to Kelp’s infrastructure decisions.
Earlier today we identified suspicious cross-chain activity involving rsETH. We have paused rsETH contracts across mainnet and several L2s while we investigate.
We are working with @LayerZero_Core, @unichain, our auditors and top security experts on RCA.
We will keep you…
— Kelp (@KelpDAO) April 18, 2026
The breach focused on Kelp’s rsETH token transfer mechanism across different blockchain networks. Operating with a single-verifier architecture meant only one authority needed to validate cross-chain transfers. According to LayerZero, the company had explicitly cautioned Kelp about this configuration and urged adoption of multiple independent verification sources.
LayerZero: KelpDAO Loses ~$290M in Exploit, Attributed to DPRK’s Lazarus Group
LayerZero reported that on April 18, 2026, KelpDAO suffered an exploit resulting in losses of approximately $290M, preliminarily attributed to DPRK’s Lazarus Group (TraderTraitor). The attack poisoned… pic.twitter.com/mfhQRaC2p9
— Wu Blockchain (@WuBlockchain) April 20, 2026
The hackers infiltrated two remote procedure call nodes—specialized servers enabling software to interact with blockchain data. These legitimate nodes were replaced with compromised versions that delivered fraudulent information to LayerZero’s verification system while maintaining normal appearances to other infrastructure components.
Since LayerZero’s verification process also consulted legitimate external nodes, the attackers launched a distributed denial-of-service campaign to disable those systems. This tactic redirected network traffic through the compromised infrastructure during a 80-minute window from 10:20 a.m. to 11:40 a.m. Pacific Time on Saturday.
When the failover mechanism activated, the malicious nodes transmitted confirmation of a legitimate transaction to the verifier. Kelp’s bridge protocol subsequently released 116,500 rsETH to the attackers’ wallets. The hostile software then eliminated itself, erasing all forensic evidence from the affected servers.
Cascading Impact Throughout DeFi Ecosystem
The stolen rsETH tokens were deployed as collateral across various lending platforms, enabling the attackers to withdraw genuine assets. Aave, the dominant decentralized lending platform, absorbed the most substantial damage.
Aave found itself holding illiquid rsETH collateral while valuable assets such as ETH had already been extracted through borrowing mechanisms. Aave’s native token plummeted approximately 15% within a 24-hour period, while the protocol experienced roughly $6 billion in withdrawals as participants scrambled to remove their funds.
No fewer than nine DeFi applications experienced damage, including Fluid, Compound Finance, SparkLend, and Euler. Cybersecurity firm Cyvers characterized the incident as a “cross-protocol contagion event” extending far beyond a single platform vulnerability.
With preliminary confidence, LayerZero has connected this attack to North Korea’s Lazarus Group, specifically its TraderTraitor division. This same organization was implicated in the $285 million Drift Protocol breach on April 1, indicating Lazarus has extracted over $575 million from decentralized finance within an 18-day period using two distinct attack methodologies.
Security Protocol Adjustments
LayerZero reports no evidence of vulnerability spreading to applications operating with multi-verifier architectures. The company has restored its verification service and announced a permanent policy refusing to process messages for any application utilizing single-verifier configurations.
Curve Finance founder Michael Egorov emphasized that this breach demonstrates the inherent risks of relying on solitary transaction verification sources. He additionally cautioned against utilizing cross-chain infrastructure unless operationally essential.
According to Ledger CTO Charles Guillemet, 2026 will “most likely be the worst year in terms of hacks.” Cryptocurrency-related security breach losses have already surpassed $482 million during Q1 2026.
Kelp has remained silent regarding LayerZero’s version of events and has not addressed why the protocol continued operating with a single-verifier architecture despite receiving explicit security warnings.


Coinbase has begun testing artificial intelligence agents within its internal systems, including Slack and email.
Summary
- Coinbase introduces AI agents Fred and Balaji to assist employees with strategy and creative problem solving.
- CEO Brian Armstrong predicts AI agents may soon outnumber human employees within Coinbase operations and workflows.
- AI agents are expected to handle tasks and increase efficiency across crypto and digital transactions.
The move aims to support employees with daily tasks and improve workflow efficiency. According to CEO Brian Armstrong, the company has already introduced two agents designed to assist with different types of work.
Armstrong shared that these agents are part of a broader effort to integrate AI into company operations. He stated that employees may soon be able to create their own agents for team use. He also said that AI agents could eventually outnumber human workers at the company, noting that ”we will have more agents than human employees at some point soon”.
The company has introduced two initial agents named Fred and Balaji. Fred is based on co-founder Fred Ehrsam and acts as a strategic executive agent. It provides guidance on priorities and offers feedback similar to senior leadership.
The second agent, Balaji, is modeled after former chief technology officer Balaji Srinivasan. This agent focuses on creativity and idea generation. It is designed to question assumptions and support innovative thinking. Coinbase said the goal is to help employees approach problems from new angles and improve decision-making.
Moreover, the testing comes as Coinbase continues to expand its use of artificial intelligence. Armstrong has previously stated that the company wants more than half of its code to be written by AI systems. The company is also working to train its workforce to become more familiar with AI tools.
Coinbase has more than 4,000 employees and is aiming to make them “AI-native.” This includes using AI in coding, analysis, and internal communication. The company also introduced the x402 protocol in 2025, which supports payments for AI agents using both crypto and traditional systems.
Growing role of AI agents in crypto
Industry leaders expect AI agents to play a larger role in digital transactions. Armstrong said that ”there will be more AI agents transacting online than humans very soon”. This view is shared by other executives in the crypto sector.
Some leaders believe AI agents could handle tasks such as payments, bookings, and online services without human input. Crypto is often seen as a suitable system for these transactions. This is due to its ability to support fast and automated payments across global networks.
Crypto World
Three Major Japanese Financial Institutions Tap Canton to Bring Government Bonds On-Chain


Mizuho, Nomura, and Japan’s central clearing house are launching a blockchain-based proof-of-concept for collateral management of Japanese government bonds.
Three of Japan’s most prominent financial institutions — Mizuho Financial Group, Nomura Holdings, and Japan Securities Clearing Corporation (JSCC) — have announced a joint proof-of-concept with Canton’s parent company, Digital Asset, to test digital collateral management for Japanese Government Bonds (JGBs) on the Canton Network.
According to a press release shared with The Defiant, the proof-of-concept is part of a broader initiative supported by the Financial Services Agency’s (FSA) Payment Innovation Project. The move aims to verify the efficacy of blockchain for transferring JGB rights within the country’s existing legal framework, specifically the Act on Book-Entry Transfer of Corporate Bonds and Shares.
The project’s main goal is to enable 24/7 real-time collateral transactions, a meaningful upgrade from current infrastructure constrained by business hours and manual reconciliation. By integrating legacy systems with Canton’s blockchain rails, the consortium hopes to dramatically cut the administrative overhead associated with posting and substituting collateral.
The project will also test cross-border scenarios, examining how JGBs can move between clearing houses, institutional investors, clients, and agents across both domestic and international markets, per the release.
JGBs are among the widely accepted forms of eligible collateral globally, according to the release, making their on-chain availability strategically significant.
Canton Network positions itself as a public Layer 1 blockchain with customizable privacy features designed for TradFi institutions. The “public” claim has drawn heat from prominent voices across the crypto industry.
Canton’s TradFi Moves
Canton has been on an institutional partnership tear heading into 2026. Fintech Transcend recently connected to the network, enabling clients to move collateral and cash in real time across counterparties using a mix of traditional and tokenized assets.
Before that, JPMorgan announced it would issue its deposit token natively on Canton, with rollout planned in phases throughout 2026, following DTCC’s selection of Canton to tokenize a subset of the U.S. Treasury securities it holds, citing the platform’s privacy features.
Meanwhile, fellow Japanese TradFi giant Mitsui & Co. has also been expanding its on-chain footprint, with its crypto arm announced last week that it would bring its tokenized metals asset ZipangCoin to Optimism’s L2 OP Mainnet — the first deployment of the token on a public blockchain.
U.S. Treasury debt currently makes up the largest portion of distributed tokenized real-world assets (RWAs) — assets that are transferable on-chain — with over $13.7 billion, over half of which is on Ethereum, per data from RWAxyz.
In contrast, all of the $334.35 billion in tokenized repurchase agreements (repos) on Canton is considered represented value, as it only uses blockchain, in this case Canton, for record keeping.
This article was written with the assistance of AI workflows. All our stories are curated, edited and fact-checked by a human.

BTCC has launched SPACEXUSDT perpetual futures, opening a new way for users to trade price exposure tied to SpaceX. The product is now live in the exchange’s tokenized stocks section and offers leverage of up to 50x.
The timing is no surprise. SpaceX remains one of the most-watched private companies in the world. Elon Musk’s name keeps attention high, while Starlink’s growth and IPO speculation keep investor interest active. For crypto exchanges, few private firms carry as much attention and trading appeal.

On SpaceX
SpaceX is drawing renewed market attention as IPO talk builds. Starlink’s app downloads and monthly active users more than doubled year over year in the first quarter, while total subscribers passed 10 million in February.
Private market pricing has added more fuel to investor interest. A December 2025 tender offer valued SpaceX at $800 billion, while current IPO talk has pulled valuation estimates as high as $1.75 trillion, with Starlink growth driving much of investor focus.
SpaceX is also staying in the news through the satellite internet race. Amazon agreed to buy Globalstar for $11.57 billion as competition with Starlink intensifies. Amazon remains far behind SpaceX in satellite deployment, with Starlink already operating more than 10,000 satellites.
For retail traders, access remains a major draw. Private company exposure usually comes through secondary transactions and private allocations. A perpetual futures contract gives users a simpler way to trade around SpaceX pricing and investor sentiment. Across crypto exchanges, products linked to familiar companies and active news cycles tend to attract faster interest than lesser-known names.
BTCC Is Expanding Its Product Mix
BTCC is using the SpaceX launch to push further into products linked to traditional market themes. The exchange has already pointed to strong early activity in its TradFi product line, where users can trade traditional market instruments with USDT.
SpaceX gives BTCC a high-interest name with strong retail recognition and a story traders already understand. In its announcement, BTCC also says it is among the first exchanges to offer SpaceX perpetual futures and describes SPACEXUSDT as having deep order book liquidity.
BTCC has paired the launch with a giveaway offering up to 1,000 USDT in rewards and a Tesla Cyberbeast. The campaign links the contract to the wider Musk brand universe, which gives the launch even more visibility.
Retail Access Expands, But the Risk Remains High
Products like this appeal to traders because they open access to stories usually reserved for private market participants. SpaceX has long been a company many people wanted exposure to, but few could reach directly.
At the same time, leveraged derivatives demand caution. BTCC states in its support materials that leverage increases both upside and downside. For retail users, a product tied to a pre-IPO story and amplified by leverage can produce large swings in either direction.
This is where the appeal and the danger sit side by side. The product is easy to understand from a narrative perspective, but it still trades like a high-risk derivative.
A New Route Into Private Market Speculation
BTCC’s SpaceX contract shows how crypto exchanges are packaging well-known private company stories into round-the-clock trading products. SpaceX brings public attention, IPO curiosity, and strong name recognition, which makes it a natural fit for this kind of listing.
Whether tokenized pre-IPO trading becomes a lasting category will depend on user demand after the first wave of curiosity fades. For now, BTCC is betting SpaceX can draw traders looking for fresh exposure outside the usual crypto lineup.
The post BTCC Brings SpaceX Pre-IPO Trading to Crypto Markets appeared first on BeInCrypto.
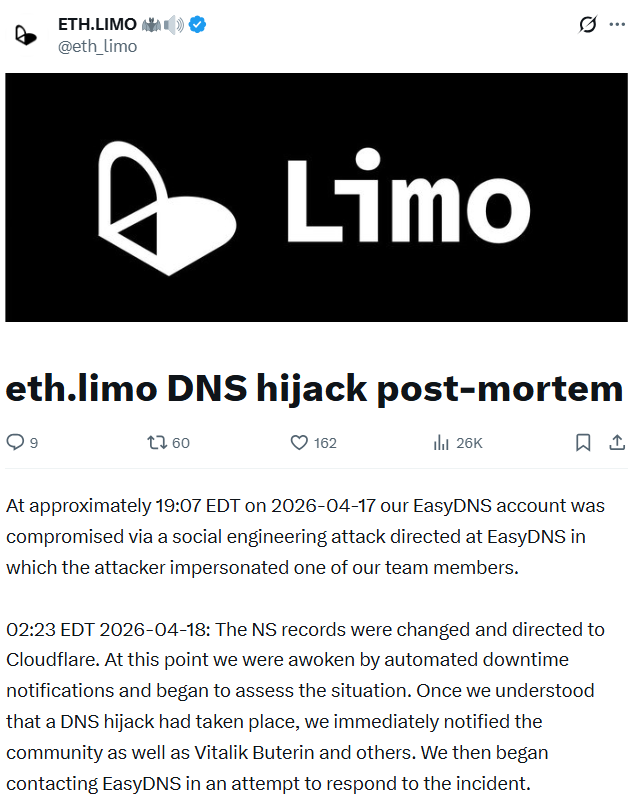
Ethereum Name Service gateway eth.limo has revealed that the domain hijacking on Friday was caused by a social engineering attack directed against EasyDNS, its domain name service provider.
According to a postmortem published by eth.limo on Saturday, an attacker impersonated one of its team members to initiate an account recovery process with easyDNS, granting access to the eth.limo account and allowing them to alter domain settings.
“The NS records were changed and directed to Cloudflare… Once we understood that a DNS hijack had taken place, we immediately notified the community as well as Vitalik Buterin and others. We then began contacting EasyDNS in an attempt to respond to the incident,” the company said.
Eth.limo serves as a Web2 bridge, providing access to around 2 million decentralized websites using the .eth domain name. Hijacking the service could allow an attacker to redirect users to malicious websites. Ethereum co-founder Vitalik Buterin warned users Friday to avoid his blog until the incident was resolved.
Mark Jeftovic, CEO of easyDNS, has publicly accepted responsibility for the incident in its own postmortem report.
“We screwed up and we own it,” said Jeftovic on Saturday.
“This would mark the first successful social engineering attack against an easyDNS client in our 28-year history. There have been countless attempts.”
Both companies have pointed to the Domain Name System Security Extension (DNSSEC) in thwarting the hacker’s attempts to do further damage.
The attacker couldn’t produce valid cryptographic signatures, so Domain Name System resolvers rejected the attacker’s forged DNS responses, causing users to see error messages instead of being redirected to malicious sites.
“DNSSEC was enabled for their domain when the attackers attempted to flip their nameservers, presumably to effect some manner of phishing or malware injection attack, DNSSEC-aware resolvers, which most are these days, began dropping queries,” Jeftovic said.

In its postmortem, eth.limo noted that because the attacker lacked the signing keys, they were unable to bypass the safeguards, which likely “reduced the blast radius of the hijack. We are not aware of any user impact at this time. We will provide updates if that changes.”
easyDNS makes changes since the attack
Jeftovic described the social engineering attack as “highly sophisticated,” and said easyDNS is still conducting a post-mortem on how the breach occurred, and has already begun rolling out changes to prevent a recurrence.

“In eth.limo’s case, we will be migrating them to Domainsure, which has a security posture more suited toward enterprise and high-value fintech domains, TLDR there is no mechanism for an account recovery on Domainsure, it’s not a thing,” he added.
“On behalf of everyone here, I apologize to the eth.limo team and the wider Ethereum community. ENS has always had a special place in our heart as the first registrar to enable ENS linking to web2 domains and we’ve been involved in the space since 2017.”
Related: RaveDAO denies manipulation as Binance, Bitget probe RAVE trading activity
The eth.limo incident is the latest in a series of domain hijackings targeting crypto projects. Days earlier, decentralized exchange aggregator CoW Swap lost control of its website after an unknown party hijacked its domain.
Steakhouse Financial, a DeFi advisory and research firm, similarly disclosed at the end of March that it had lost control of its domain to an attacker.
Prediction market platform Polymarket is reportedly in talks with investors to raise another $400 million in fresh capital, The Information reported Monday.
The $400 million raise would be made at a $15 billion valuation, The Information said, citing two people familiar with the matter.
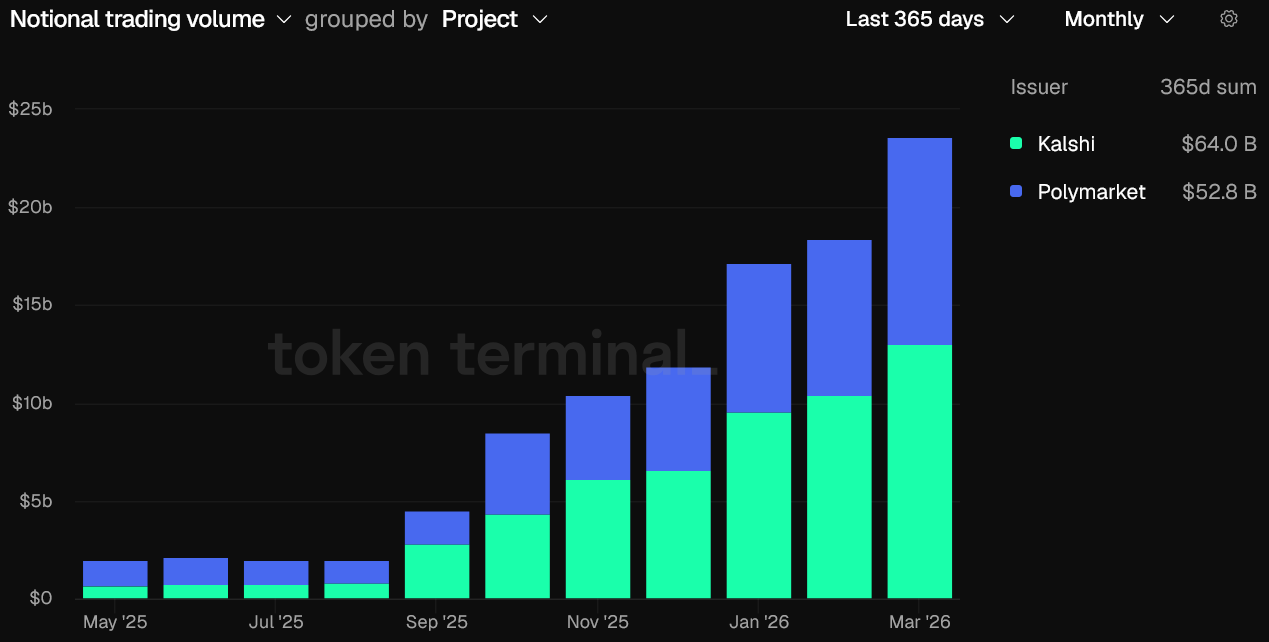
The raise would add to a wave of institutional capital flowing into the predictions market space in recent months. New York Stock Exchange parent Intercontinental Exchange (ICE) invested $600 million into Polymarket in late March, while competitor platform Kalshi’s valuation was marked at about $22 billion in its last funding round.
The Information said Polymarket is looking to add strategic investors beyond ICE in its next funding round, which could total $1 billion.
Prediction markets started booming around the time of the 2024 US election and are now consistently recording over $10 billion in monthly trading volume across markets covering everything from sports and political elections to financial results and cultural events.

With that rise has come surging institutional interest from some of Wall Street’s biggest players.
In early March, one of Nasdaq’s options exchanges, Nasdaq MRX, filed to offer cash-settled, binary-style contracts on the Nasdaq-100 index.
Cboe Global Markets is also launching a prediction market-style offering, while CME Group partnered with American gambling company FanDuel, which will enable traders to bet on markets outside of finance.
Related: Kalshi to create ‘portal for parents‘ on prediction markets: Report
Last week, TradFi firms Charles Schwab and Citadel Securities said they are also weighing a move into prediction markets.
Legal issues linger over prediction markets
Despite the rise in prediction market activity, Kalshi and others have faced regulatory scrutiny over widespread insider trading and market manipulation allegations.
Kalshi is currently engaged in a court battle with the Nevada Gaming Control Board after a lower court temporarily blocked Kalshi from operating in the state.
The state regulator argues that Kalshi’s contracts facilitate unlicensed gambling. Coinbase chief legal officer Paul Grewal has predicted that the case could reach the US Supreme Court, potentially creating precedent over the regulatory treatment of prediction markets and event-based derivatives.
Magazine: Should users be allowed to bet on war and death in prediction markets?


The International Monetary Fund (IMF) lowered its global growth forecast for 2026 to 3.1% in its April update. This marks a 0.2 percentage point downgrade from its January estimate.
The Fund noted that the latest downgrade largely reflects economic disruptions stemming from the ongoing Middle East conflict. It added that in its absence, the outlook would have instead been revised upward by 0.1 percentage point to 3.4%.
IMF Cuts Growth, Lifts Inflation Forecast in 2026
The report added that the global growth forecast for 2027 remains unchanged from the January 2026 World Economic Outlook update.
Follow us on X to get the latest news as it happens
Meanwhile, global headline inflation is expected to edge higher in 2026 before resuming its downward trajectory in 2027. It is currently projected at 4.4% this year, before easing to 3.7% in 2027.
The economic impact remains uneven across regions. Emerging markets saw their 2026 growth outlook downgraded by 0.3 percentage points. Yet, projections for advanced economies were largely unchanged.
“Crucially, there is a high degree of cross-country dispersion in the reference forecast. While the growth and inflation revisions seem relatively modest at the global level, the toll on the conflict region and more vulnerable economies elsewhere—in particular, commodity-importing emerging market and developing economies with preexisting fragilities—is much more pronounced,” the report read.
The IMF also outlined additional downside risks. In a scenario where energy prices rise more sharply and persistently, global growth could slow to 2.5% in 2026.
At the same time, inflation may climb to 5.4%. A more severe disruption, particularly involving damage to energy infrastructure in the conflict region, would deepen the impact, dragging global growth to around 2% and pushing inflation above 6% by 2027. Emerging and developing economies would be disproportionately affected again, with nearly twice the impact as advanced economies.
The IMF said its latest World Economic Outlook uses a “reference forecast” rather than a traditional baseline. This reflects the difficulty of forming stable assumptions amid ongoing uncertainty.
Subscribe to our YouTube channel to watch leaders and journalists provide expert insights
The post IMF Cuts 2026 Global Growth Forecast by 0.2 Points as Middle East War Hits Momentum appeared first on BeInCrypto.


Bitcoin is absorbing the return of Middle East risk better than oil or equities.
Bitcoin traded at $74,335 on Monday morning, down 1.6% over 24 hours but still up 4.8% on the week after the U.S. Navy seized an Iranian ship over the weekend and Tehran reimposed controls on the Strait of Hormuz.
Ether slipped 2.6% to $2,272, Solana fell 1.5% to $84, and BNB held flat at $618, with the broader top-10 showing red across the board but none of the moves breaching 3%.
Brent crude jumped 5.7% to $95.50 a barrel, European natural gas futures surged as much as 11%, S&P 500 futures fell 0.6% after Friday’s record close, and European equity futures indicated a 1.2% drop at the open. Gold fell 0.8% to $4,790, and the dollar edged up as traditional war-hedge demand returned.
The weekend flare-up reversed a three-week unwind of war risk premium. Iran had declared the Strait “completely open” on Friday, prompting the S&P 500’s record close and a broad rally across emerging markets.
By Sunday morning, Trump was threatening to destroy every power plant and bridge in Iran if negotiations fail, and Tehran was signaling it may skip a second round of talks while the U.S. maintains its naval blockade.
This is the fourth major Iran-related risk event crypto has absorbed since the conflict began, and the pattern of shrinking sell-offs continues. Earlier escalations produced sharper drawdowns in bitcoin than this one, with each successive flare-up compressing the magnitude of the crypto reaction even as oil and equities continue to price each headline fresh.
The divergence suggests crypto has largely finished pricing the geopolitical tail risk that traditional markets are still reacting to, either because holders who were going to sell on Iran headlines have already sold, or because the spot ETF bid has become a more reliable floor than the futures-driven weekend gaps that defined earlier cycles.
What traders will watch through the U.S. session is whether the 10-year Treasury yield holding near 4.27% and the dollar bid pull bitcoin lower through the risk-parity channel, or whether the equity correlation that dominated Q1 loosens on a day when the driver is explicitly geopolitical rather than macro-liquidity.
If bitcoin holds $74,000 through the European open and the Strait of Hormuz situation deteriorates further, the asset’s emerging reputation as a geopolitical shock absorber gains another data point. If the move extends below $73,000 on any incremental Iran headline, the shrinking-sell-off thesis breaks.

Motorola Solutions: Relationships, LTS Contracts And Predictable Refresh Cycles To Drive Growth
Matt Bomer’s Son Attends Prom With Billie Lourd’s Sister Ava
![Bitcoin Is One Move Away From $78K [24H Countdown]](https://wordupnews.com/wp-content/uploads/2026/04/1776669273_maxresdefault-80x80.jpg)
Bitcoin Is One Move Away From $78K [24H Countdown]


-

 Crypto World7 days ago
The SEC Conditionalises DeFi Platforms to Be Avoided for Broker Registration
-

 Fashion3 days ago
Weekend Open Thread: Theodora Dress
-

 NewsBeat6 days ago
Trump and Pope Leo: Behind their disagreement over Iran war
-

 Crypto World6 days ago
SEC Signals Exemption for Crypto Interfaces From Broker Registration
-

 News Videos5 days ago
Secure crypto trading starts with an FIU-registered
-

 Sports3 days ago
NWFL Suspends Two Players Over Post-Match Clash in Ado-Ekiti
-

 Crypto World6 days ago
SEC Proposes Certain Crypto Interfaces Don’t Need to Register as Brokers
-

 Business16 hours ago
Powerball Result April 18, 2026: No Jackpot Winner in Powerball Draw: $75 Million Rolls Over
-

 Politics2 days ago
Palestine barred from entering Canada for FIFA Congress
-

 Crypto World2 days ago
Russia Pushes Bill to Criminalize Unregistered Crypto Services
-

 Sports7 days ago
NWFL opens Pathway for new Clubs ahead of 2026 Season
-
 Business3 days ago
Creo Medical agree sale of its manufacturing operation
-
 Entertainment6 days ago
Brand New Day’ Footage Reveals the Devastating Impact of ‘Now Way Home’
-

 Politics21 hours ago
Zack Polanski demands ‘council homes not luxury flats for foreign investors’
-

 Crypto World7 days ago
Trump whales load up ahead of Mar-a-Lago luncheon.
-
Business7 days ago
Kering slides after Morgan Stanley downgrade, Gucci woes loom
-

 Tech7 days ago
Apple glasses won’t go brand shopping like Meta did with Ray-Ban and Oakley
-

 Tech7 days ago
Google adds E2E encryption to Gmail for iOS and Android enterprise users
-

 Tech5 days ago
Microsoft adds Windows protections for malicious Remote Desktop files
-
Entertainment7 days ago
How Euphoria Season 3 Premiere Paid Tribute to Eric Dane After Death
You must be logged in to post a comment Login