

Business
Chobani doubling down on La Colombe’s growth


The steelworks has been under government control for almost a year, but leglistation to nationalise it will be put forward this week.
Business
(VIDEO) Body of Alleged Triple Murderer Julian Ingram Found Near Lake Cargelligo After Four-Month Manhunt

LAKE CARGELLIGO, Australia — Police have discovered a body believed to be that of Julian Ingram, the 37-year-old man wanted for the alleged triple murder of his pregnant former partner, her new boyfriend and her aunt in this central-west New South Wales town in January.
The grim discovery, made Monday beside an abandoned ute about 50 kilometres northwest of Lake Cargelligo, ends a sprawling four-month manhunt that gripped the region and drew national attention. Formal identification and a cause of death are pending, but police sources told the ABC the remains are those of Ingram.
Ingram had been the subject of one of the largest searches in recent NSW history after the Jan. 22 shootings that killed Sophie Quinn, 25 and seven months pregnant, her friend John Harris, 32, and Quinn’s aunt Nerida Quinn, 50. A 19-year-old man, Kaleb Macqueen, was seriously injured but survived.
The day that shattered a small town
On that summer afternoon, police say Ingram opened fire in a suspected domestic violence-related rampage. He allegedly shot Quinn and Harris as they sat in a car, then drove to Nerida Quinn’s nearby home and killed her before wounding Macqueen. Ingram fled the scene in a stolen Lachlan Shire Council ute, sparking an immediate and intense pursuit.
Despite extensive ground and air searches covering more than 60,000 acres, multiple reported sightings and a $250,000 reward, Ingram had evaded capture for 109 days. Police had publicly stated they believed he was receiving assistance from someone in the community while surviving in the arid outback.
Discovery brings mixed emotions
Assistant Commissioner Andrew Holland, Western Region Commander, was scheduled to address the media Monday afternoon. Families of the victims have been notified. Community members expressed a complex mix of relief that the manhunt is over and sorrow for all those affected by the violence.
Aboriginal and Torres Strait Islander readers are advised that this story contains names of Indigenous people who have died, used with permission from their families. Ingram and some of the victims were known in local Indigenous communities.
Ingram’s background and prior history
Court documents later revealed Ingram had a history of domestic violence. A decade earlier, he allegedly threatened a former partner with a gun and made violent statements about her new partner. He had faced bail decisions in the months leading up to the January shootings, raising questions about the handling of his prior matters.
The former council gardener was last seen driving away from Lake Cargelligo shortly after the shootings. His phones and bank accounts remained untouched, adding to the mystery of how he survived for months in harsh terrain.
Impact on victims’ families
The Quinn and Harris families have endured months of painful waiting while grieving. Sophie Quinn’s unborn child also died in the shooting. Relatives described the victims as beloved community members whose loss left deep scars in the tight-knit town of about 1,500 people.
Support services have been offered to affected families and the broader Lake Cargelligo community as news of the body’s discovery spreads. Counselling and victim support remain available through NSW police and local organizations.
The long manhunt
Police conducted one of the most extensive operations in regional NSW history. Strike Force Janko involved hundreds of officers, drones, helicopters and tracking dogs. Numerous reported sightings kept hope alive that Ingram was still alive and could face justice, but many also feared he may have perished in the outback.
The $250,000 reward offered in March generated new tips but no breakthrough until Monday’s discovery. Police had repeatedly appealed for community help, stressing that anyone harbouring Ingram could face serious charges.
Broader questions raised
The case has prompted renewed discussion about domestic violence responses, bail laws and support for regional communities facing violence. Advocacy groups have called for stronger protections for victims and better coordination between agencies handling high-risk offenders.
Small towns like Lake Cargelligo often struggle with visibility and resources when tragedy strikes. The prolonged manhunt placed additional strain on local residents, many of whom knew both the victims and the accused.
What comes next
Forensic examinations, including autopsy and formal identification, will confirm the body’s identity and determine cause of death. Police have not yet commented on whether foul play or self-inflicted injuries are suspected.
The discovery effectively closes the active manhunt phase, but the investigation into the January shootings continues. Coronial inquiries and any related proceedings will provide further answers for the victims’ families.
As Lake Cargelligo processes this latest development, the focus returns to healing and supporting those left behind. The discovery of Ingram’s body brings an end to one chapter of a painful saga while leaving many questions about the events of January 22 still unanswered.
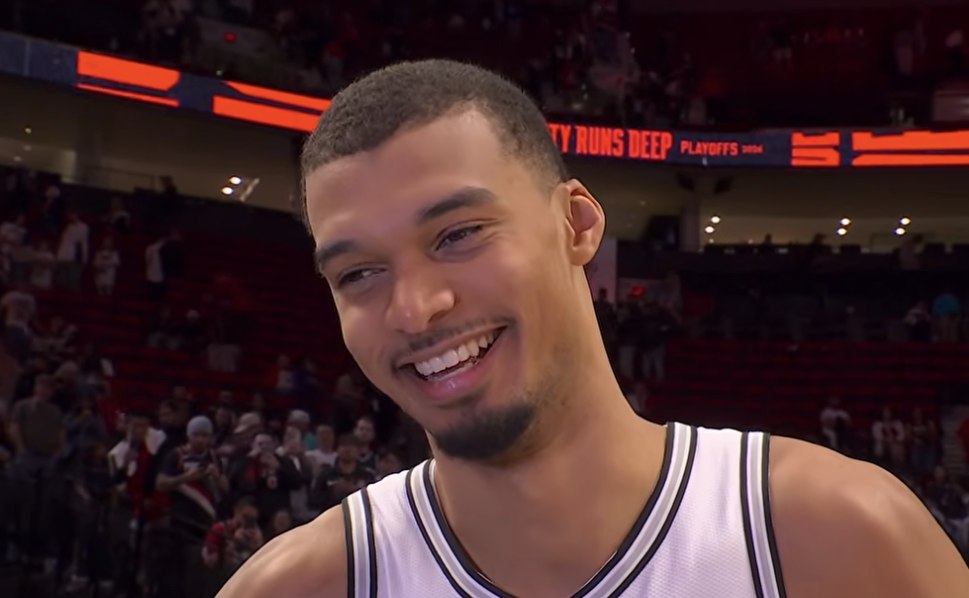
SAN ANTONIO — Victor Wembanyama’s availability for Game 5 of the Western Conference semifinals remains uncertain Monday as the NBA reviews his flagrant-2 ejection from Game 4, leaving the San Antonio Spurs bracing for the possibility of facing the Minnesota Timberwolves without their franchise cornerstone on Tuesday night.

The 22-year-old superstar was tossed with 8:39 left in the second quarter of Sunday’s 114-109 loss in Minneapolis after swinging his right elbow into the jaw and neck area of Timberwolves forward Naz Reid while battling for a rebound. Officials upgraded the foul to a flagrant-2 for excessive and unnecessary contact above the shoulders, resulting in an automatic ejection — the first of Wembanyama’s NBA career.
With the series now tied 2-2 and Game 5 shifting back to the Frost Bank Center, the league’s decision on supplemental discipline could dramatically alter the matchup. Spurs coach Mitch Johnson expressed strong confidence that Wembanyama will be available, calling any further punishment “ridiculous” and emphasizing zero intent on the play.
What the league is considering
NBA officials are expected to deliver a ruling by Monday evening or early Tuesday. While flagrant-2 ejections do not carry automatic suspensions, the review focuses on the nature of the contact, Wembanyama’s history (clean until now), and the high-stakes playoff context. Precedent shows the league sometimes issues one-game suspensions for similar incidents involving contact to the head or neck.
Kendrick Perkins and other analysts suggested a suspension could shift momentum decisively toward Minnesota, especially after Anthony Edwards’ dominant 36-point performance in Game 4. However, Spurs insiders told reporters they do not anticipate missing their defensive anchor and MVP candidate.
Wembanyama himself appeared stunned by the ejection on the bench and later expressed regret for the play’s outcome while defending his physicality in a physical series. Reid downplayed the incident postgame, saying he was fine and that “basketball happens.”
Series context and Spurs’ challenge
San Antonio led the series 2-1 before Sunday’s loss. Wembanyama had been dominant through the first three games, averaging elite production and anchoring a defense that frustrated Minnesota’s attack. His absence in the second half of Game 4 allowed the Timberwolves to exploit mismatches and pull away late.
If Wembanyama sits, the Spurs will lean heavily on Stephon Castle, De’Aaron Fox, Harrison Barnes and a thin frontcourt. Coach Johnson has emphasized depth and resilience all postseason, but losing the 7-foot-4 Defensive Player of the Year would represent a massive blow at home.
Game 5 carries enormous weight. A Spurs win would give them a 3-2 lead with a chance to close out the series in Minnesota. A loss would hand the Timberwolves the momentum heading back to Target Center for a potential elimination game.
Wembanyama’s growth and the physical toll
At just 22, Wembanyama has transformed the Spurs into contenders ahead of schedule. This postseason marks his deepest playoff run, and the physicality has tested his composure. Opponents have targeted him with hard fouls and physical play throughout the series, a reality for young big men in the playoffs.
Johnson defended his star’s reaction: “I’m glad he took matters into his own hands… at some level, you have to protect yourself.” The coach made clear he did not condone the elbow but understood the context of repeated physical battles.
Analysts note Wembanyama’s rapid maturation. His ability to dominate on both ends while navigating superstar attention has drawn comparisons to generational talents. A suspension, however brief, would test the team’s growth in his absence.
Timberwolves’ perspective
Minnesota enters Game 5 with renewed confidence after even the series. Edwards has thrived, and the supporting cast stepped up without Wembanyama on the floor. Coach Chris Finch praised his team’s composure after the physical play and believes they can capitalize if San Antonio is shorthanded.
The Wolves have shown resilience all season and view the series as winnable regardless of Wembanyama’s status. Their length, athleticism and defensive versatility could pose problems for a depleted Spurs frontcourt.
Fan and league-wide reaction
The ejection and its potential aftermath dominated basketball conversation Monday. Social media erupted with debates over intent, officiating consistency and playoff physicality. Many defended Wembanyama as a young star learning boundaries, while others called for accountability to protect players.
League officials face a delicate balance: maintaining player safety standards without overly punishing a franchise cornerstone in his first deep playoff run. The decision will be scrutinized by players, coaches and fans alike.
What to watch in Game 5
If Wembanyama plays, expect heightened physicality and emotional intensity at the Frost Bank Center. The Spurs will look to protect him better while leveraging his rim protection and scoring gravity. If he sits, San Antonio must find collective energy to match Minnesota’s momentum.
Tip-off is set for Tuesday night in San Antonio. Regardless of the final ruling, the series has delivered compelling basketball and now hinges on one young star’s availability and how both teams respond to adversity.
The Western Conference semifinals have already produced drama. Wembanyama’s potential absence would add another layer to a compelling narrative centered on one of the NBA’s brightest young talents.
Business
Michael’ Dethrones ‘Bohemian Rhapsody’ as Highest-Grossing Music Biopic Ever in North America

LOS ANGELES — Antoine Fuqua’s “Michael,” the long-awaited Michael Jackson biopic starring the King of Pop’s nephew Jaafar Jackson, has officially surpassed “Bohemian Rhapsody” to become the highest-grossing music biopic of all time at the North American box office, crossing approximately $240 million domestically through its third weekend.
The Lionsgate film, which opened to a record-shattering $97.2 million in its first weekend in late April, has demonstrated remarkable staying power despite mixed-to-negative critical reviews and pre-release controversy. With a current domestic total hovering near $240.4 million, it has eclipsed the $216.4–$216.7 million lifetime gross of the 2018 Queen biopic starring Rami Malek, a record that stood for nearly eight years.
Globally, “Michael” has already surpassed $570 million and is on track to become only the second music biopic ever to cross the half-billion-dollar mark worldwide, trailing only “Bohemian Rhapsody’s” eventual $910 million total.
Record-breaking debut and audience enthusiasm
“Michael” arrived in theaters on April 24, 2026, with the biggest opening weekend ever for a biographical film and the strongest debut for any music biopic, smashing previous benchmarks set by “Straight Outta Compton” ($60.2 million) and “Bohemian Rhapsody” ($51 million). The film benefited from strong IMAX and premium large-format screenings, which accounted for nearly 40% of its opening gross in some reports.
Audience reception has been far warmer than critic scores. Exit polling showed strong scores among younger viewers and Jackson fans, with many praising Jaafar Jackson’s transformative performance and the film’s recreation of iconic moments from the Jackson 5 era through the late 1980s. Word-of-mouth has fueled solid second and third weekends, with only a 44% drop in its sophomore frame.
Controversy meets commercial success
The film’s path to success was not without obstacles. Pre-release debates centered on the decision to largely avoid addressing the child sexual abuse allegations against Jackson. Co-produced by the Jackson estate, “Michael” focuses on the artist’s creative journey and personal ambition, drawing both praise for its musical sequences and criticism for what some called a sanitized portrait.
Despite the discourse, audiences turned out in force. The film has resonated particularly strongly with Black moviegoers and older demographics who grew up with Jackson’s music, turning theaters into impromptu sing-alongs during key performance scenes.
How it stacks up against other music biopics
“Michael” now sits comfortably atop the domestic music biopic rankings:
- “Michael” — ~$240 million and climbing
- “Bohemian Rhapsody” — $216.4 million
- “Straight Outta Compton” — $161.2 million
- “Elvis” — $151 million
Its global trajectory also positions it among the biggest biographical hits of the past decade. Lionsgate has described the performance as a validation of bold storytelling and a major win for the studio.
Production and cultural significance
Directed by Antoine Fuqua and written by John Logan, “Michael” chronicles Jackson’s life from childhood prodigy through the “Thriller” era and up to the 1980s. Jaafar Jackson underwent extensive vocal and dance training to portray his uncle, with additional support from CGI and archival footage for later career moments. The film’s $155–200 million budget made it one of the most expensive biopics ever produced.
Its success highlights the enduring global appeal of Jackson’s catalog and the power of authorized estate-backed projects. Music supervisors incorporated dozens of Jackson hits, creating a near-jukebox experience that has driven repeat viewings.
Industry implications
“Michael’s” dominance reinforces the commercial strength of music-driven biopics even in an era dominated by franchises. It also provides a significant boost for Lionsgate and underscores the value of star power — in this case, the Jackson name and legacy — combined with premium theatrical presentation.
Theaters have reported strong concession sales and extended run potential, with some locations planning special sing-along screenings. International markets have been particularly enthusiastic, contributing over 58% of the total gross so far.
What’s next for the film
With strong legs and continued word-of-mouth, “Michael” is projected to push well past $300 million domestically and could approach or exceed $800 million worldwide by the end of its run. Awards season buzz remains modest due to critical reception, but the film’s cultural impact and box office dominance ensure it will be part of the 2026 conversation.
For fans of Jackson and the music biopic genre, “Michael” represents both a commercial triumph and a nostalgic celebration. By dethroning “Bohemian Rhapsody,” it has cemented its place in cinematic history — proving that the King of Pop’s influence remains as powerful on screen as it was on stage.
As final domestic numbers roll in this week, “Michael” stands as a clear victor: a film that moonwalked past expectations and claimed the throne as Hollywood’s biggest music biopic ever in North America.

I’m an independent equity trader and licensed financial advisor focused on uncovering high-upside opportunities in overlooked sectors especially focusing on small-caps, energy, commodities, and special situations. My investment strategy is based on growth. I look for fundamental momentum (EPS, ROE, revenue), price-volume confirmation, and macro filters. I also use econometric tools and calculations to analyse market direction, cycles and behaviour. I’ve been managing personal capital since 2020 and advising under MiFID II since qualifying with a license. I hold a bachelor’s in Business Administration and Economics and am currently completing a master’s in Finance. My masters thesis topic: Impact of Financial Results Announcements on Stock Returns and Trading Volumes of Micro-Capitalization Gold Mining Companies.
Analyst’s Disclosure: I/we have no stock, option or similar derivative position in any of the companies mentioned, and no plans to initiate any such positions within the next 72 hours. I wrote this article myself, and it expresses my own opinions. I am not receiving compensation for it (other than from Seeking Alpha). I have no business relationship with any company whose stock is mentioned in this article.
Seeking Alpha’s Disclosure: Past performance is no guarantee of future results. No recommendation or advice is being given as to whether any investment is suitable for a particular investor. Any views or opinions expressed above may not reflect those of Seeking Alpha as a whole. Seeking Alpha is not a licensed securities dealer, broker or US investment adviser or investment bank. Our analysts are third party authors that include both professional investors and individual investors who may not be licensed or certified by any institute or regulatory body.
Business
(VIDEO) Thousands Left in Dark as Massive Power Outage Hits Kenner, Entergy Works to Restore Service

KENNER, La. — More than 9,000 customers in Kenner lost power Sunday afternoon in one of the largest single-day outages to strike the Jefferson Parish suburb in recent years, leaving neighborhoods without electricity for several hours during warm spring weather.
Entergy Louisiana reported the outage began around midday, with the company’s outage map showing a peak of 9,293 customers without power concentrated in Kenner. Crews responded quickly, and by early evening the majority of customers had power restored, though several thousand remained affected into the night.
The utility said the cause was under investigation but indicated early assessments pointed to equipment issues at a local substation. No injuries or major property damage were immediately reported, but the outage disrupted daily life for thousands of residents in the New Orleans suburb just as evening approached.
Impact on residents and businesses
Many Kenner families found themselves without lights, air conditioning or refrigeration as temperatures hovered in the 80s. Residents turned to generators, battery-powered fans and neighbors with power for relief. Local businesses, including restaurants and grocery stores, faced challenges keeping operations running smoothly.
Traffic signals in some areas went dark, prompting police to direct traffic at key intersections and increasing the risk of accidents. Emergency services remained operational on backup power, and no widespread 911 disruptions were reported. Hospitals and critical facilities in the region maintained service without interruption.
For families with young children, elderly members or those relying on medical equipment, the outage created anxiety. Several residents used social media to share photos of darkened homes and ask for updates on restoration times. Entergy’s estimated restoration time initially listed 8 p.m., though some areas saw power return earlier.
Entergy’s response
Crews were on scene within hours, working to identify and repair the fault. Entergy encouraged customers to report outages through its app, website or by texting OUT to 36778. The company activated its storm center protocols even though no severe weather was involved, reflecting the scale of the disruption.
By 6:14 p.m., power had been restored to the majority of affected customers, with roughly 3,000 still without service as crews continued targeted repairs. Entergy apologized for the inconvenience and thanked customers for their patience.
Broader context in Jefferson Parish
Kenner, a city of about 66,000 residents located between New Orleans and Metairie, has experienced several notable outages in recent years, often linked to aging infrastructure, vehicle accidents or weather events. This latest incident comes amid ongoing discussions about grid reliability in the greater New Orleans area as the region faces increasing extreme weather risks.
Entergy serves more than 1.3 million customers across Louisiana. The utility has invested billions in grid modernization, but challenges persist with equipment failures and growing demand. Local leaders have called for continued upgrades to prevent similar large-scale disruptions.
Community reaction
Residents expressed frustration mixed with understanding on social media. Many praised Entergy’s relatively quick response compared to past outages, while others questioned why such a large area was affected by what appeared to be a localized issue. Some used the downtime for family time or neighborhood gatherings, turning an inconvenience into a momentary community bonding experience.
Local officials urged residents to stay safe, avoid downed lines and prepare for potential after-effects such as spoiled food. The American Red Cross and local organizations stood ready to assist vulnerable populations if the outage had extended overnight.
Safety reminders during outages
Entergy and emergency officials issued standard guidance: treat all downed lines as live, use flashlights instead of candles to reduce fire risk, and throw out perishable food that has been above 40 degrees for more than two hours. Generators should be operated outdoors with proper ventilation to avoid carbon monoxide poisoning.
For those with medical needs, backup power plans and cooling centers were available if needed. Jefferson Parish emergency management monitored the situation closely.
Looking ahead
While power has been largely restored, Entergy will continue investigating the root cause to prevent recurrence. The incident highlights the importance of infrastructure resilience in a region prone to storms and heavy usage.
As Kenner returns to normal, residents and officials alike hope for smoother days ahead. The utility has promised to provide updates and work transparently with the community on any long-term improvements needed.
For the latest outage information, customers can check Entergy’s website, mobile app or call 800-9OUTAGE. Monday’s events serve as a reminder of how quickly modern life can be disrupted — and how communities pull together when the lights go out.

Macnica ATD Europe acquires Indesmatech

Eric Ayrault has spent more than three decades in education. His journey has taken him across continents, classrooms, and communities. Through it all, one theme stands out: a deep commitment to helping students grow.“For me, teaching is about connection,” Ayrault says. “If students feel seen, known, and challenged, they rise.”He grew up in Kirkland, Washington. His early life was shaped by education and athletics. His father led Lakeside School, where Ayrault studied from grade 5 through 12. Outside the classroom, he played football, basketball, lacrosse, and raced whitewater kayaks. He also developed a passion for the outdoors, working for both his high school’s outdoor program and Outward Bound.After high school, he traveled to Kenya and taught physics in a local school.“That experience changed everything,” he says. “It showed me how powerful education can be in any setting. It also made me see I could teach and travel the world, so my career plan was set.”
Harvard Education and International Experience
Ayrault went on to attend Harvard University. He studied history and completed coursework for teaching certification. He also rowed crew, continuing a family legacy in the sport, and climbed in the mountains of New Hampshire with the Harvard Mountaineering Club.After graduating, he began teaching full-time. His early career included international roles in Tanzania, France, and Italy. These experiences shaped his approach to education.“Teaching in different countries forces you to adapt,” he explains. “You learn quickly that students are different, but the core needs are the same.”He later earned a master’s degree in speech communication from the University of Washington. This added depth to his work in the classroom, especially in helping students express themselves clearly.
Building a Long-Term Career in Education
Over the years, Ayrault worked in both public and private schools across the United States. He taught English and supported programs focused on student achievement and college readiness.His work has always centered on communication and student engagement.“I try to meet students where they are,” he says. “You have to understand what motivates them before you can teach them. Good teaching starts with listening.”His long career has given him a front-row seat to how education has evolved. One of the biggest changes has been the role of technology in students’ lives.
How Cell Phones and Social Media Affect Students
Ayrault has become a strong voice on the impact of technology in schools. He sees both the benefits, but is more concerned now with the negative effects in reading, attention, and mental health.“I saw the shift happen,” he says. “Cell phones, social media, and games started to take over students’ attention.”He points out that constant access to devices can make it harder for students to stay focused.“Students are not just competing with each other anymore,” he says. “They are competing with an entire digital world in their pocket.”Social media, in particular, has changed how students see themselves.“Students compare themselves all day long,” he says. “That creates pressure that didn’t exist before.”He also notes how games are designed to keep users engaged for long periods.“They are built to keep you hooked,” he explains. “That makes it hard for students to focus on long-term goals like school.” Ayrault says everyone should read The Anxious Generation by Johnathan Haidt, and has all of his students access those ideas through podcasts in class.
Beyond the Classroom: Outdoor Education and Mentorship
Ayrault’s work has not been limited to traditional classrooms. He has also taught skiing in Colorado and earned certifications in outdoor education, including Wilderness Emergency Medical Technician training.“I’ve always liked working outside the classroom too,” he says. “I love it, and it gives students a different way to learn.”These experiences allowed him to connect with students in new ways. Outdoor settings often bring out different strengths and build confidence.He has also stayed active in his communities. He volunteered with programs supporting underserved students in California and worked with local shelters in Colorado.“Teaching doesn’t stop at the classroom door,” he says. “It’s about helping people grow wherever you can.”
A Broad Perspective on Modern Education
With experience across multiple countries and school systems, Ayrault brings a wide perspective to education today.“I’ve taught in many places,” he says. “The challenges are different, but the goal is always the same—help students succeed.”He believes the key is balance. Technology, structure, and human connection all play a role.“We need better boundaries,” he says. “Students need structure, both at school and at home.”His focus remains on helping students develop skills that go beyond academics.“It’s not just about grades,” he says. “It’s about preparing students for life.”
What’s Next for Eric Ayrault
Today, Eric Ayrault is focused on building the next chapter of his career with the same energy he has brought to teaching for decades. He is exploring new opportunities where his experience in education, communication, and mentorship can make an impact.“There are so many ways to help students and communities, both inside and outside the classroom.”He is especially interested in roles that allow him to speak, mentor, and share his perspective on modern education. His insights on technology, student focus, and learning environments continue to resonate with parents and educators alike.“I’ve seen how much things have changed,” he says. “Now I want to be part of helping people navigate those changes.”With a global background and years of hands-on experience, Ayrault is well-positioned to contribute in new ways. Whether through teaching, advising, or community work, his focus remains steady.“At the end of the day,” he says, “it’s still about helping people grow. That’s what drives me.”
Xtrackers (IE) PLC schedules annual meeting for June 11

Remitly Global: SMB Could Be The Most Undervalued Revenue Driver

Arteta Praises Referees After Arsenal Win Over West Ham

From Financial Crisis to Multi-Millionaire: The Power of World-Class Coaching| #financetips #stock

British Steel set to be nationalised, Starmer says
Manchester United reach agreement with Casemiro over contract clause amid transfer speculation

US brings back mandatory military draft registration

Steven Gerrard disagrees with Gary Neville over ‘shock’ Chelsea and Arsenal claim | Football


-
 Crypto World3 days ago
HarrisX Poll Found 52% of Registered Voters Support the CLARITY Act
-

 Crypto World4 days ago
Upbit adds B3 Korean won pair as Base token gains Korea access
-

 Fashion3 days ago
Weekend Open Thread: Marianne Dress
-

 Tech7 days ago
Image AI models now drive app growth, beating chatbot upgrades
-
 NewsBeat4 days ago
NCP car park operator enters administration putting 340 UK sites at risk of closure
-

 Politics2 days ago
Politics Home Article | Starmer Enters The Danger Zone
-
 Business2 days ago
Ignore market noise, India’s long-term story intact, say D-Street bulls Ramesh Damani and Sunil Singhania
-

 Tech3 hours ago
GM Agrees To Pay $12.75 Million To Settle California Lawsuit Over Misuse Of Customers’ Driving Data
-
 Sports7 days ago
2026 NHL playoff picks: Second-round predictions, series odds, Stanley Cup bracket
-

 Crypto World6 days ago
UAE Free Zone Deploys Blockchain IDs to Verify Registered Firms
-

 Crypto World5 days ago
BlackRock CEO Larry Fink Discusses a New Asset Class
-

 Crypto World4 days ago
Robinhood says Wall Street is building onchain
-

 Tech1 day ago
Auto Enthusiast Carves Functional Two-Stroke Engine from Solid Metal
-
Entertainment6 days ago
Serena Williams hits Met Gala in metallic dress after GLP-1 reveal
-

 Tech5 days ago
Apple and Samsung are dominating smartphone sales so thoroughly that only one other company makes the top 10
-

 Entertainment7 days ago
Skai Jackson Responds To AI Baklash After Viral Snapchat Photos
-

 Politics6 days ago
Met Gala 2026: Madonna’s Dramatic Red Carpet Look Steals The Show
-

 Fashion4 days ago
The Best Work Pants for Women in 2026
-

 Tech5 days ago
I tested the Xiaomi 17 Ultra’s camera and I don’t think I’ll ever go back to an iPhone
-
 Sports7 days ago
Hearts v Rangers LIVE: Prediction, team news and line-ups as Scottish Premiership title rivals meet at Tynecastle
You must be logged in to post a comment Login