

Business
Ex-GM exec leading EV battery startup’s pivot to defense industry
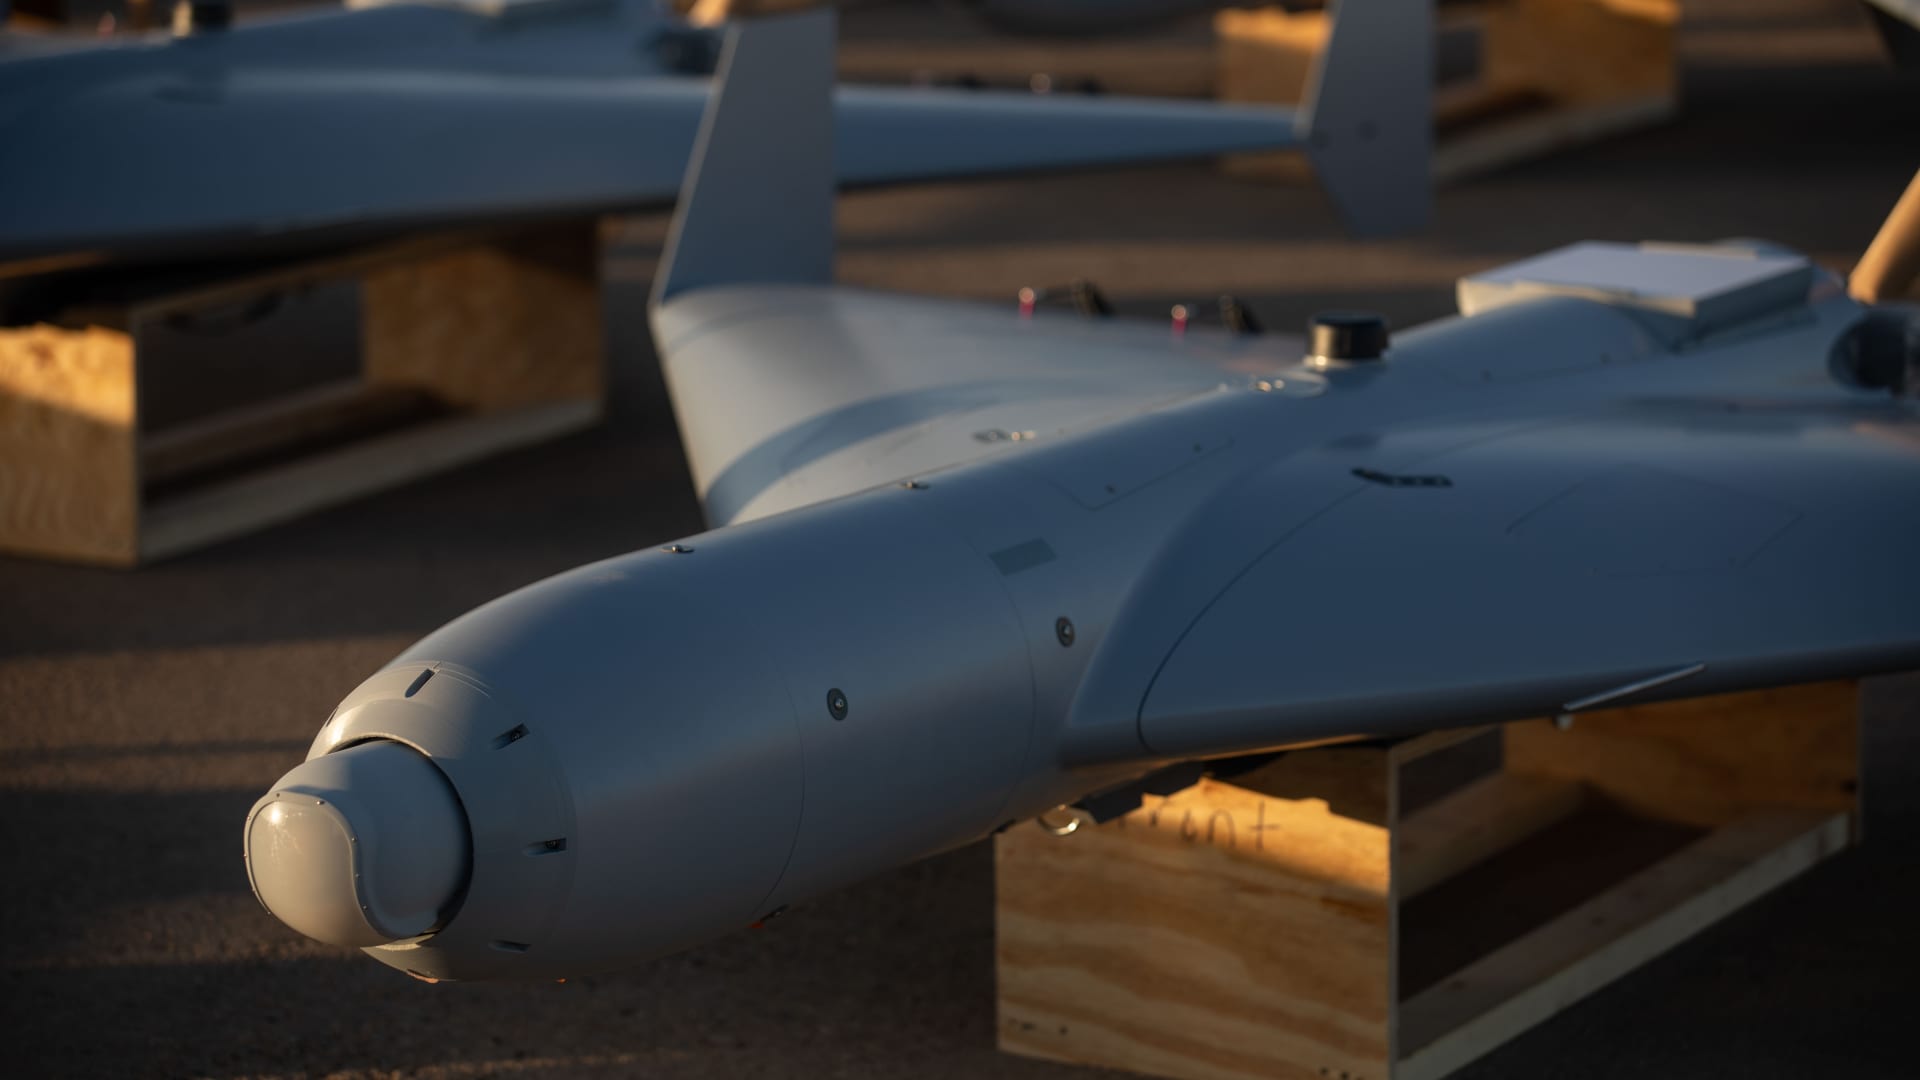
Low-cost Unmanned Combat Attack System (LUCAS) drones are positioned on the tarmac at a base in the U.S. Central Command operating area.
Source: U.S. CENTCOM
An Arizona-based battery startup led by a former General Motors executive is moving from making products for all-electric vehicles to making products for the aerospace and defense industries amid the war in Iran and growing demand for U.S. drones by the Trump administration.
Sion Power expects to commercialize high-energy lithium-metal battery cells for drones and other defense-related products later this year after focusing on the development of all-electric vehicles for much of the past decade, according to CEO Pamela Fletcher.
“We’re targeting to commercialize this technology,” Fletcher told CNBC exclusively. “We had hoped, and thought, that would be in automotive, and I think that possibility still exists, but the faster path, and frankly, a big need, is out there in this defense space.”
The decision is a unique example of how companies that bet on the unrealized adoption of all-electric vehicles are pivoting to different segments. Other companies have moved to the stationary storage and aerospace sectors to utilize unused battery production capacity for EVs.
Automakers in the U.S. have significantly pulled back from pure EVs and taken billions of dollars in write-downs following slower-than-expected adoption of the vehicles and changes by the Trump administration to incentives that supported them.

Sion Power’s planned “Licerion HE” lithium-metal battery cells will support both primary, or single-discharge, and secondary, or rechargeable, battery applications, according to the company.
The battery cells are designed for next-generation drones, autonomous systems and other mission-critical platforms that require maximum energy in the smallest, lightest possible footprint, according to Fletcher.
“Lithium-metal technology, which is what we developed, has high gravimetric energy, which means it’s a lot of energy in a lightweight pack,” said Fletcher, who began leading the company in 2024. “It works really well for things that fly.”
Fletcher said Sion Power’s lithium-metal cells are engineered to deliver energy densities exceeding 500 watt-hour per kilogram, compared with approximately 300-350 Wh/kg for today’s most advanced lithium-ion technology.
Such batteries can power drones or missiles as well as their on-board systems such as cameras, sensors and processors for combat, surveillance and other needs.
Sion Power has a 110,000-square-foot facility in Tucson, Arizona, with pilot manufacturing capabilities. Fletcher said it’s currently producing Licerion HE cells for defense applications and converting its production cell line from automotive battery cells to defense products, which are smaller.
Sion Power CEO Pamela Fletcher, formerly an executive at General Motors
Mario Anzuoni | Reuters
The company will continue to develop cells for other segments, such as EVs, but its main focus and growth right now is defense, which the company had been working on prior to focusing on EVs, Fletcher said.
Fletcher, a former EV and growth business executive who left GM in 2022, said the opportunity in defense is comparable to the ongoing surge in demand for energy storage from data centers across the U.S.
The privately held company does not plan to be a direct supplier to the U.S. government, but it hopes to sell its products to other certified contractors, Fletcher said. The move comes as the Trump administration’s Department of Defense is exploring increasing production of U.S.-sourced Low‑Cost Uncrewed Combat Aerial System, or LUCAS, drones.
Such drones have been an integral part of the war between Russia and Ukraine as well as the Iran war.
“It’s evolved quite rapidly in the last three or four years, and now, even with the Iran war, things are changing even further,” Sion Power Chief Commercial Officer Mitch Hourtienne told CNBC. “There’s a lot of emerging applications coming out of, unfortunately, the Ukraine war, now the Iran war.”
Sion Power’s custom defense pack that includes its Licerion lithium-metal battery cells.
Courtesy Sion Power
Several companies other than Sion Power, such as Quantumscape, have spent years researching and developing lithium-metal batteries for vehicles, but so far there hasn’t been mass commercialization for using that technology in the automotive sector.
Lithium-metal battery cells function similarly to currently used lithium-ion cells, but have greater energy density, potentially at a lower cost. But they can be more volatile and are viewed as farther out than emerging solid-state batteries for cars, according to experts.
Sam Abuelsamid, vice president of market research at communications and consulting firm Telemetry, said lithium-metal cells could be used for different industries and use cases.
“It’s better for energy density. It also should reduce cost,” said Abuelsamid, an engineer and battery expert. “There’s no reason why they wouldn’t be just as effective in smaller objects, especially something that flies, like a drone.”
The biggest difference between defense and automotive is shelf life versus cycle life. Auto batteries typically require hundreds of charge life cycles, whereas defense uses require only one to 20 cycles and can demand three to eight years of shelf life.
Sion Power has raised more than $200 million for development of lithium-metal cells. Investors have included South Korean battery manufacturer LG Energy Solution, former Google CEO Eric Schmidt’s family office, Hillspire, and unnamed global automakers, according to the company.
The company, established in 1989 as a spin-off from Brookhaven National Laboratory, said it plans to seek further capital as its products are expected to launch and ramp up during the second half of 2026 and into 2027.


Vauxhall, one of Britain’s oldest and best-loved motoring marques, is to fit Chinese-engineered components in its vehicles for the first time in its 122-year history, in a striking move designed to keep family motoring within reach of cash-strapped UK households.
Parent group Stellantis confirmed at the weekend that electric motors, battery packs and powertrain technology supplied by Hangzhou-based Leapmotor will sit at the heart of the new Vauxhall C-SUV, a mid-sized family vehicle pencilled in for showrooms in 2028. It marks a significant shift for a brand that has built motor cars in Luton since 1905 and whose Ellesmere Port plant remains a totemic part of British manufacturing.
The deal is the clearest signal yet that Europe’s legacy carmakers have concluded they can no longer fight the Chinese on their own. Stellantis, which already owns a €1.5bn (£1.3bn) stake in Leapmotor acquired in 2023, will also throw open the doors of its Spanish plants to its partner, ending an arrangement under which Leapmotor manufactured exclusively on home soil.
Antonio Filosa, chief executive of Stellantis, described the Chinese group as a “trusted peer” and pitched the tie-up as “a true win-win for both of us”. He added that the agreement was “expected to support production and advance localisation in Europe of world-class manufacturing of electric vehicles at affordable prices to meet customers’ real-world needs”.
That nod to “real-world” buyers will not be lost on investors. Earlier this year Stellantis publicly conceded it had taken its eye off the average motorist during an ill-judged dash into electric vehicles, a misstep that prompted a €22bn writedown in February after sales fell well short of forecasts.
The wider picture is bleak for European and American manufacturers. A wave of well-priced, well-equipped Chinese electric models has caught the West flat-footed, and more than one in four EVs now sold in the United Kingdom is built in China, according to the Society of Motor Manufacturers and Traders.
Western carmakers complain that the playing field is anything but level. Research by the Rhodium Group puts the per-car state subsidy enjoyed by Chinese brand BYD at $347 (£257), against just $39 for Volkswagen and nothing at all for Tesla. Faced with that gulf, alliances with Chinese rivals are fast becoming a survival strategy rather than a strategic option. Stellantis, having taken its initial Leapmotor stake in 2023, has since spun out a 51pc-owned joint venture, Leapmotor International, to push Chinese-designed models into Western markets.
Nissan, the Japanese carmaker with deep roots in Sunderland, is also understood to have held exploratory talks with China’s Chery, the group behind the Omoda and Jaecoo nameplates now appearing on British driveways.
For motorists, the hope is cheaper cars. For Whitehall, the picture is rather more complicated. Under British law, every new vehicle must carry an embedded SIM card capable of contacting the emergency services after a crash, relaying location data and allowing the occupants to speak directly to 999 operators. Critics warn that the same technology could, in theory, allow a manufacturer, or a hostile state, to harvest in-car data or even tap into onboard cameras. Chinese marques and their trade bodies have consistently maintained that their vehicles comply fully with British and European privacy rules.
Under the new arrangement, the Vauxhall C-SUV will roll off the lines in Zaragoza in northern Spain, with a sister Leapmotor model produced in Madrid. Vauxhall engineers are expected to take the lead on design, ride and handling, and interior comfort, in an effort to preserve the brand’s British character.
Zhu Jiangming, the founder and chief executive of Leapmotor, struck a confident note. “Our leading-edge technologies, combined with Stellantis’s global reach, deep regional roots and much-loved automotive brands, would make this a uniquely powerful partnership,” he said. “Our joint venture, Leapmotor International, has quickly shown its benefits for both partners and in less than three years has seen us launch our brand on five continents and significantly grow our international reach and reputation.”
Founded in 2015 and shipping its first car in 2019, Leapmotor is a comparative newcomer in an industry measured in centuries. For Vauxhall, which has watched its market share slip as Chinese rivals such as BYD, MG and Omoda eat into the family-car segment, the gamble is plain enough: borrow the technology, keep the badge, and hope British buyers care more about the price on the windscreen than the country code on the components beneath the bonnet.
Jamie Young
Jamie is Senior Reporter at Business Matters, bringing over a decade of experience in UK SME business reporting.
Jamie holds a degree in Business Administration and regularly participates in industry conferences and workshops.
When not reporting on the latest business developments, Jamie is passionate about mentoring up-and-coming journalists and entrepreneurs to inspire the next generation of business leaders.

Construction is an industry worth $13 trillion globally, yet it remains one of the least profitable on earth. Margins of between 1 and 4 per cent are the norm, and the commercial fate of most projects is sealed long before a single foundation is poured. That uncomfortable truth has just attracted serious capital.
ProcurePro, an Australian-founded software business pitching itself as the first end-to-end procurement platform built specifically for construction, has closed an $11 million (US) funding round led by QIC Ventures, the venture arm of one of Australia’s largest sovereign wealth funds and a substantial infrastructure asset owner in its own right. The round values the six-year-old company at more than $80 million.
Existing backers Airtree and Glitch Capital followed on, and were joined on the cap table by French construction heavyweight Bouygues, which invested through its corporate venture vehicle managed by ISAI. The fresh capital will be funnelled into ProcurePro’s AI roadmap and an ambitious push into the United Kingdom, the Middle East and North America.
The thesis is straightforward, if uncomfortable for an industry not known for its appetite for change. By the time a contractor breaks ground, roughly 80 per cent of project costs have already been committed and the bulk of supply chain risk is baked in. Yet across the sector, that critical procurement stage is still largely run on a patchwork of spreadsheets, email threads and disconnected PDFs — a state of affairs that would be unrecognisable in almost any other industry handling sums of comparable size.
ProcurePro’s response is to pull the full procurement lifecycle, scheduling, tendering, bid analysis and subcontracting, into a single system designed to give commercial teams genuine oversight before pen hits paper. Over the past six years, the platform has been used on 6,000 construction projects worldwide, representing more than $90 billion in build value, and has handled in excess of 200,000 trade packages.
That accumulated dataset is now the company’s strategic moat. It underpins BidLevel AI, ProcurePro’s flagship tool for comparing complex subcontractor quotes, a job that has traditionally swallowed days or even weeks of commercial managers’ time, and which the platform claims to compress into minutes.
Alastair Blenkin, founder and chief executive of ProcurePro, said the raise opens the next chapter of the company’s international growth. “Construction firms are still managing their most critical commercial decisions and millions in spend via out-of-date and untrustworthy spreadsheets,” he said. “The lack of true oversight delays risk identification, which ultimately erodes margins. We built ProcurePro to bring structure, control and certainty to the commercial cockpit of construction firms.”
Blenkin is unsubtle about the prize. “After years of supporting procurement across thousands of projects, we now have a rich foundation of real-world procurement data. This funding allows us to invest further in AI, where we’ll enable construction firms to estimate new project costs backed by their historical purchasing data, rather than someone’s estimate, memory, or a finger in the wind.”
Nick Capell, investment director at QIC Ventures, framed the deal in industrial-policy terms. “Procurement sits upstream of construction spend, yet remains highly manual and weakly governed. It’s a globally relevant problem that remains unsolved,” he said. “With Queensland delivering a once-in-a-generation infrastructure programme ahead of the 2032 Olympics, innovations that improve construction productivity are critical.”
For Bouygues, the appeal is more operational. Marie-Luce Godinot, the group’s senior vice-president for innovation, sustainability and IT, said ProcurePro had already proved itself on live sites. “ProcurePro is one of the first technologies we have seen that brings greater control to the full procurement journey for contractors. It has been deployed successfully on some Bouygues projects, with usage progressively developing across several business units.”
For UK contractors and their SME subcontractor base, the more immediate consequence is staffing. ProcurePro plans to hire 100 people globally over the next two years across product, engineering and go-to-market roles, with its London office among those being scaled alongside Brisbane and Dubai. A first US base is also on the cards.
Whether the platform proves to be the productivity catalyst its backers describe will ultimately be decided on building sites rather than in pitch decks. But after years of construction being singled out as the laggard of the digital economy, the level of conviction now being shown by sovereign wealth, tier-one contractors and specialist venture investors suggests the sector’s spreadsheet era may finally be drawing to a close.
Amy Ingham
Amy is a newly qualified journalist specialising in business journalism at Business Matters with responsibility for news content for what is now the UK’s largest print and online source of current business news.

China, US arrest 5 in joint drug smuggling investigation, Xinhua reports

SYDNEY — The S&P/ASX 200 index traded lower on Monday, May 11, 2026, but several standout performers bucked the broader trend, led by Metcash Ltd and Dyno Nobel Ltd following impressive trading updates and first-half results that highlighted resilience in key sectors.
Here are the top 5 gainers on the ASX 200 today:
- Metcash Ltd (ASX: MTS) — Up approximately 6.6% to 9.5% intraday The wholesale distributor and supermarket operator rose sharply after releasing a positive FY26 trading update. The company expects revenue growth of around 0.7% and underlying net profit after tax between $268 million and $270 million. Management highlighted cost discipline and resilience in its Food and Liquor divisions, with plans for at least $25 million in annualised savings next year.
- Dyno Nobel Ltd (ASX: DNL) — Up around 7.7% to 8.7% The explosives manufacturer delivered a standout first-half performance, with net profit after tax (excluding material items) surging 83.3% to $160.9 million. Strong demand across metals, coal, quarry and construction markets drove revenue higher in both Asia-Pacific and Americas segments. The board lifted the interim dividend by 91.7% to 4.6 cents per share.
- Capstone Copper Corp (ASX: CSC) — Up about 3.9% Copper exposure provided support as the metal benefited from global supply concerns and industrial demand. Capstone shares climbed alongside other miners on positive sentiment in the sector.
- Develop Global Ltd (ASX: DVP) — Up roughly 3.5% The resources company gained on broader strength in copper and base metals, with investors rotating into smaller explorers and developers amid commodity tailwinds.
- Sandfire Resources Ltd (ASX: SFR) — Up around 3.4% Another copper play that advanced as prices for the red metal held firm. Sandfire’s operations and growth projects continue attracting interest from investors seeking leveraged exposure to industrial metals.
Market context and broader moves
The ASX 200 finished the morning session down around 0.5-0.6%, weighed by weakness in healthcare (following CSL’s profit warning) and financials. However, materials and industrials provided pockets of strength. Copper stocks in particular outperformed as global prices responded to supply dynamics and demand expectations.
Dyno Nobel’s result marked a “new era” after its separation from the fertilisers business, positioning it as a pure-play global explosives leader. CEO Mauro Neves highlighted expansion in key markets like Malaysia and Indonesia.
Metcash CEO Doug Jones pointed to a “solid result” underpinned by diversified operations and disciplined execution, offering reassurance to investors amid cost-of-living pressures affecting consumers.
Why these stocks stood out
Both Metcash and Dyno Nobel benefited from clear earnings beats and forward guidance that exceeded expectations in a cautious market. Positive updates provided catalysts at a time when many investors sought quality names with defensive qualities or commodity leverage.
Copper-related stocks gained additional support from higher oil prices and global industrial sentiment. Analysts note that supply constraints in copper could persist, making ASX-listed producers and developers attractive.
Investor takeaways
Today’s gainers illustrate the market’s selective nature. While macro concerns and sector-specific news (such as healthcare downgrades) pressured the broader index, company-specific positive developments drove strong individual performances.
Traders and longer-term investors alike are watching for follow-through. Metcash and Dyno Nobel could see continued momentum if upcoming analyst commentary remains favourable. Copper names may remain volatile but offer upside if metal prices hold or rise.
Sector rotation signals
The outperformance of industrials and materials today suggests some rotation away from heavily weighted sectors like healthcare and banks. With the federal budget due this week and ongoing geopolitical tensions affecting commodities, investors appear selective — favouring names with strong fundamentals and clear catalysts.
Volume was solid in the top movers, indicating genuine buying interest rather than thin trading. Metcash and Dyno Nobel both saw above-average turnover as the results circulated.
What to watch next
Attention now shifts to further earnings releases and the federal budget’s potential impact on consumer-facing stocks like Metcash. For copper plays, global economic data and China stimulus signals will remain key drivers.
The ASX 200’s mixed session underscores a market in transition — rewarding strong execution while punishing disappointments. As always, individual stock performance can diverge sharply from the index, creating opportunities for active investors.
Monday’s top gainers highlight the importance of earnings season and sector-specific tailwinds in driving Australian equity returns. With Metcash and Dyno Nobel leading the way, investors are reminded that solid operational results can shine through even on a softer overall market day.

The shock waves have been felt from the Middle East, where big exporters like Kuwait have cut production, to American highways, where drivers are facing higher prices at the pump. The average price for a gallon of regular unleaded in California, where drivers pay the most in the U.S., is more than $6. See how prices have jumped since the conflict began and more.

STARTRADER Launches “STAR Trading League,” an NBA-Inspired Global Trading Tournament

ANALYSIS: While the US-Iran conflict has disrupted global trade and overshadowed earlier tariff tensions, protectionism has not disappeared from the US agenda.


Evacuation of passengers from virus-hit cruise ship to be completed on Monday
Business
Police Weigh Third Arrest Warrant Bid for HYBE’s Bang Si-hyuk After Second Prosecutorial Rejection

SEOUL — South Korean police are considering a third attempt to secure an arrest warrant for HYBE Chairman Bang Si-hyuk after prosecutors rejected their latest request, marking the second time in two weeks investigators failed to persuade the Seoul Southern District Prosecutors’ Office to detain the K-pop mogul.

The high-stakes financial investigation into alleged unfair trading and investor deception ahead of HYBE’s 2022 IPO has dragged on for months, casting a shadow over the entertainment giant behind global superstars BTS and NewJeans. Bang, 53, remains free while authorities debate next steps in one of the most closely watched corporate probes in South Korea’s music industry.
Prosecutors on May 7 formally returned the police’s refiled warrant application, citing incomplete supplementary investigation as requested after the first rejection in late April. The decision underscores ongoing tensions between police investigators and prosecutors over the strength of evidence in the complex case.
Details of the allegations
Bang stands accused of violating the Capital Markets Act by misleading early investors about HYBE’s IPO plans, allegedly inducing them to sell shares at undervalued prices before the company’s public listing generated massive gains. Police claim the actions allowed Bang and associates to secure unfair profits estimated in the hundreds of billions of won (roughly $180-260 million).
The probe intensified after complaints from minority shareholders and former investors who alleged they were not properly informed of upcoming corporate developments that significantly boosted share values post-IPO. HYBE went public in 2022 at a valuation that propelled Bang’s personal fortune into the billions.
Bang’s legal team has consistently denied wrongdoing, emphasizing full cooperation with investigators. They argue the case lacks sufficient grounds for detention, describing the police actions as overly aggressive. Bang has voluntarily appeared for questioning multiple times, including extended sessions last year.
Timeline of warrant attempts
Police first sought an arrest warrant on April 21. Prosecutors rejected it on April 24, ordering further investigation into key details such as specific communications, financial records and the necessity of detention given Bang’s cooperation.
Investigators refiled on April 30, asserting they had addressed the gaps. Yet on May 7, the Seoul Southern District Prosecutors’ Office’s financial and securities crime division again denied the request. Officials stated that requested supplementary probes had not been adequately conducted.
A Seoul Metropolitan Police Agency spokesperson confirmed they are now “reviewing” whether to reapply a third time after bolstering their case. No timeline has been set, and sources indicate internal deliberations could take days or weeks.
Impact on HYBE and K-pop industry
The prolonged uncertainty has weighed on HYBE’s operations and share price. The company, valued at tens of billions of dollars, continues day-to-day business under Bang’s leadership while facing separate scrutiny over artist management practices and internal power struggles.
Industry analysts warn that a prolonged investigation could distract from creative output and international expansion. HYBE’s global influence, built on BTS’s unprecedented success, makes the case a bellwether for corporate governance standards in South Korea’s entertainment sector.
Broader context of entertainment probes
The Bang case fits a pattern of heightened regulatory scrutiny on South Korea’s entertainment conglomerates. Similar investigations have targeted other agency leaders over stock manipulations, artist contracts and workplace issues. Prosecutors’ cautious approach reflects lessons from past high-profile cases where premature arrests led to public backlash or overturned convictions.
Legal experts note that arrest warrants in white-collar cases require clear demonstration of flight risk, evidence tampering potential or societal impact. Bang’s high profile, substantial assets and history of compliance make detention a high bar to clear.
What happens next
Police have several options: conduct deeper supplementary probes as directed, seek alternative measures like travel restrictions or summons, or ultimately forward the case for indictment without arrest. Prosecutors could also request additional materials before any third warrant attempt.
Bang continues to lead HYBE amid the legal cloud. The company has issued statements expressing confidence in his leadership and cooperation with authorities. No charges have been formally filed yet, meaning the investigation remains in its pre-indictment phase.
Reactions from fans and stakeholders
BTS fans (ARMY) and broader K-pop communities have followed developments closely, with many expressing support for Bang while calling for a fair process. Online forums buzz with speculation about potential outcomes and their effects on favorite artists.
Corporate governance advocates view the case as a test of accountability for entertainment chaebol-style leaders who wield enormous influence. Others worry excessive scrutiny could hamper innovation in a globally competitive industry.
As deliberations continue, the saga highlights the complex intersection of celebrity, corporate power and justice in South Korea. Police must now decide whether a strengthened third warrant application can overcome prosecutorial skepticism or if the case will proceed through slower channels.
For now, Bang Si-hyuk remains at liberty, steering HYBE through turbulent waters while the legal spotlight persists. The coming weeks could prove decisive in determining whether one of K-pop’s most powerful figures faces detention or continues operating under investigation.
The first US presidential visit to China in almost 10 years will test a fragile tariff truce.

Labour calls Reform ‘divisive’ despite its own election smear tactics
5 Handy Quinn Tools You Can Get At Harbor Freight For Under $25

Horoscope today: Your daily guide for Monday, May 11, 2026
Manchester United reach agreement with Casemiro over contract clause amid transfer speculation

US brings back mandatory military draft registration

Steven Gerrard disagrees with Gary Neville over ‘shock’ Chelsea and Arsenal claim | Football


![BITCOIN IS BREAKING CRITICAL RESISTANCE! [TRAP TRAP TRAP]](https://wordupnews.com/wp-content/uploads/2026/05/1778482707_maxresdefault-80x80.jpg)
-
 Crypto World3 days ago
HarrisX Poll Found 52% of Registered Voters Support the CLARITY Act
-

 Crypto World4 days ago
Upbit adds B3 Korean won pair as Base token gains Korea access
-

 Fashion3 days ago
Weekend Open Thread: Marianne Dress
-

 Tech6 days ago
Image AI models now drive app growth, beating chatbot upgrades
-
 NewsBeat4 days ago
NCP car park operator enters administration putting 340 UK sites at risk of closure
-
 Business2 days ago
Ignore market noise, India’s long-term story intact, say D-Street bulls Ramesh Damani and Sunil Singhania
-

 Politics2 days ago
Politics Home Article | Starmer Enters The Danger Zone
-
 Sports7 days ago
2026 NHL playoff picks: Second-round predictions, series odds, Stanley Cup bracket
-

 Crypto World6 days ago
UAE Free Zone Deploys Blockchain IDs to Verify Registered Firms
-

 Crypto World5 days ago
BlackRock CEO Larry Fink Discusses a New Asset Class
-

 Crypto World4 days ago
Robinhood says Wall Street is building onchain
-

 Tech1 day ago
Auto Enthusiast Carves Functional Two-Stroke Engine from Solid Metal
-

 Tech5 days ago
Apple and Samsung are dominating smartphone sales so thoroughly that only one other company makes the top 10
-
Entertainment6 days ago
Serena Williams hits Met Gala in metallic dress after GLP-1 reveal
-

 Tech58 minutes ago
GM Agrees To Pay $12.75 Million To Settle California Lawsuit Over Misuse Of Customers’ Driving Data
-

 Entertainment7 days ago
Skai Jackson Responds To AI Baklash After Viral Snapchat Photos
-

 Politics6 days ago
Met Gala 2026: Madonna’s Dramatic Red Carpet Look Steals The Show
-

 Fashion4 days ago
The Best Work Pants for Women in 2026
-
 Sports7 days ago
Hearts v Rangers LIVE: Prediction, team news and line-ups as Scottish Premiership title rivals meet at Tynecastle
-

 Tech5 days ago
I tested the Xiaomi 17 Ultra’s camera and I don’t think I’ll ever go back to an iPhone
You must be logged in to post a comment Login