
Crypto
Ethereum price tests lower Bollinger Band at $2,460

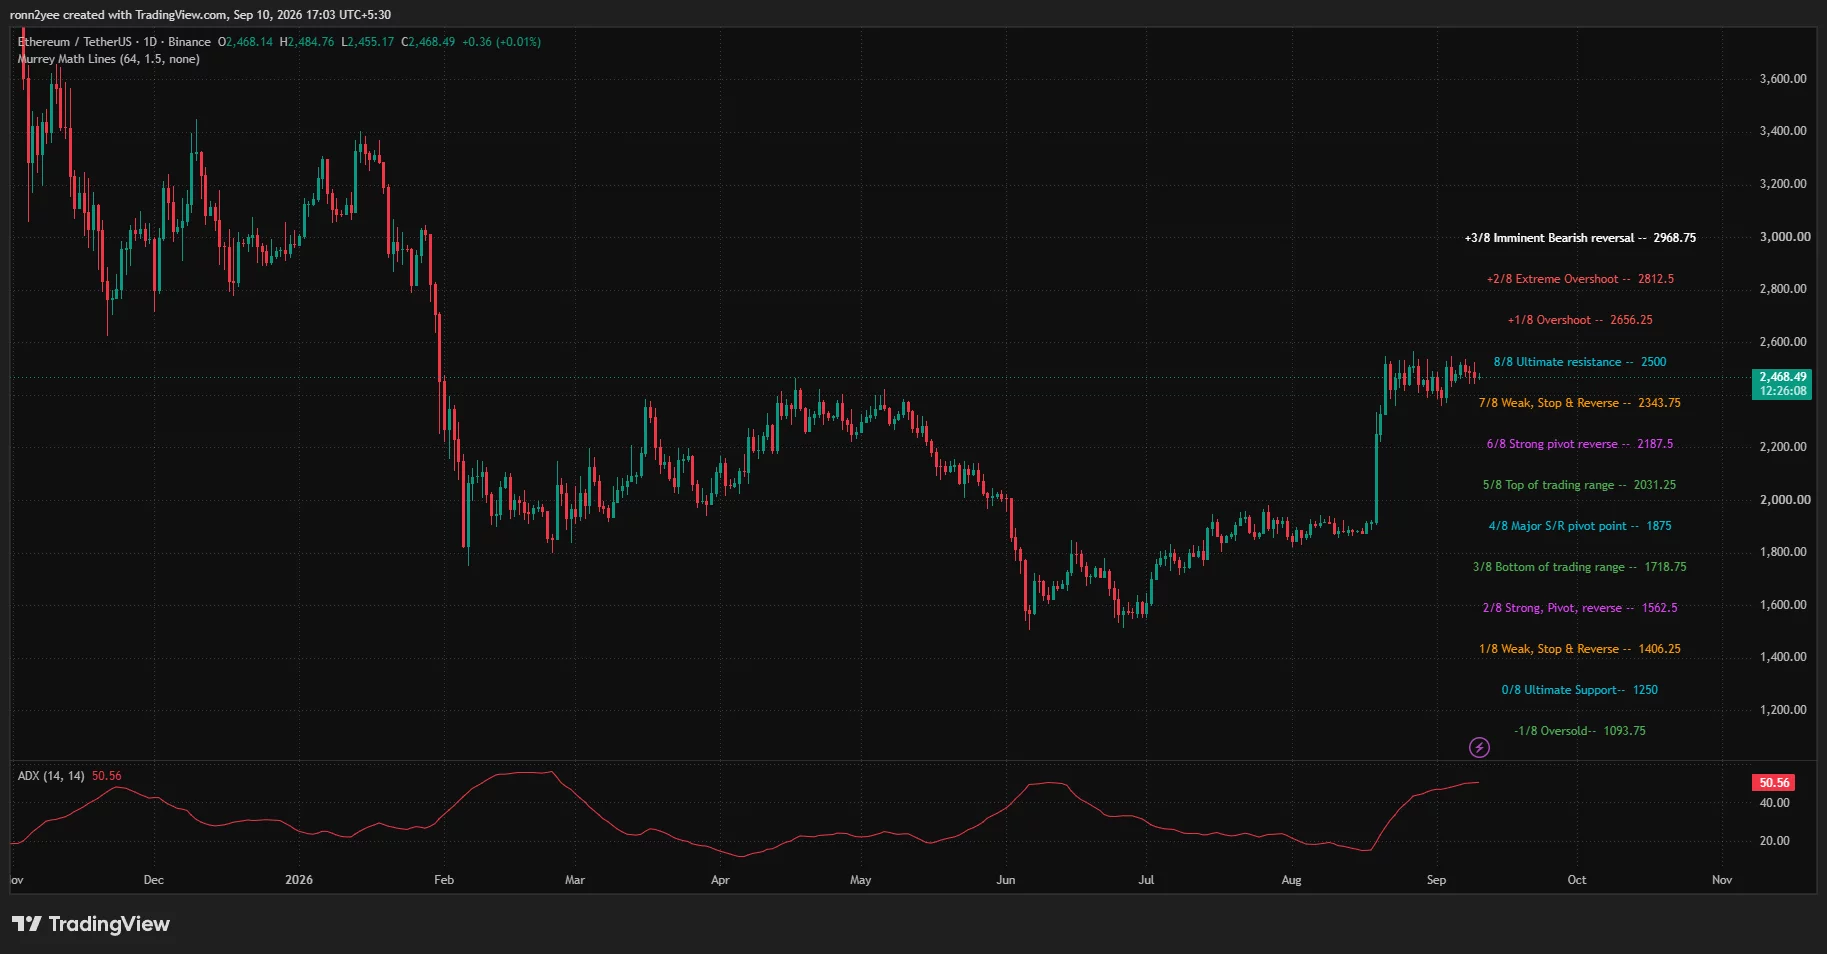
Ethereum price hovered near $2,468 on Sep. 10 as buyers defended the lower end of a multiweek range, while repeated failures above $2,500 kept the short-term outlook uncertain.
Summary
- Ethereum price traded near $2,468 after moving between approximately $2,455 and $2,485 during the session.
- The 4-hour chart places immediate support at $2,460 and resistance between $2,500 and $2,508.
- A weekly close above $2,550 could open the way toward $2,656 and $2,812.
- Liquidation clusters near $2,440 and $2,490 could increase volatility if either level breaks.
Ethereum price action today
According to data from crypto.news, Ethereum (ETH) price traded around $2,468 at the time of writing after briefly falling to approximately $2,455. The token remained below the psychological $2,500 level, which has repeatedly limited recovery attempts since late August.
The daily chart showed ETH holding inside a narrow range after its rapid August advance from below $1,900. Price has since struggled to extend that rally, with sellers appearing each time it approaches the $2,500 area.
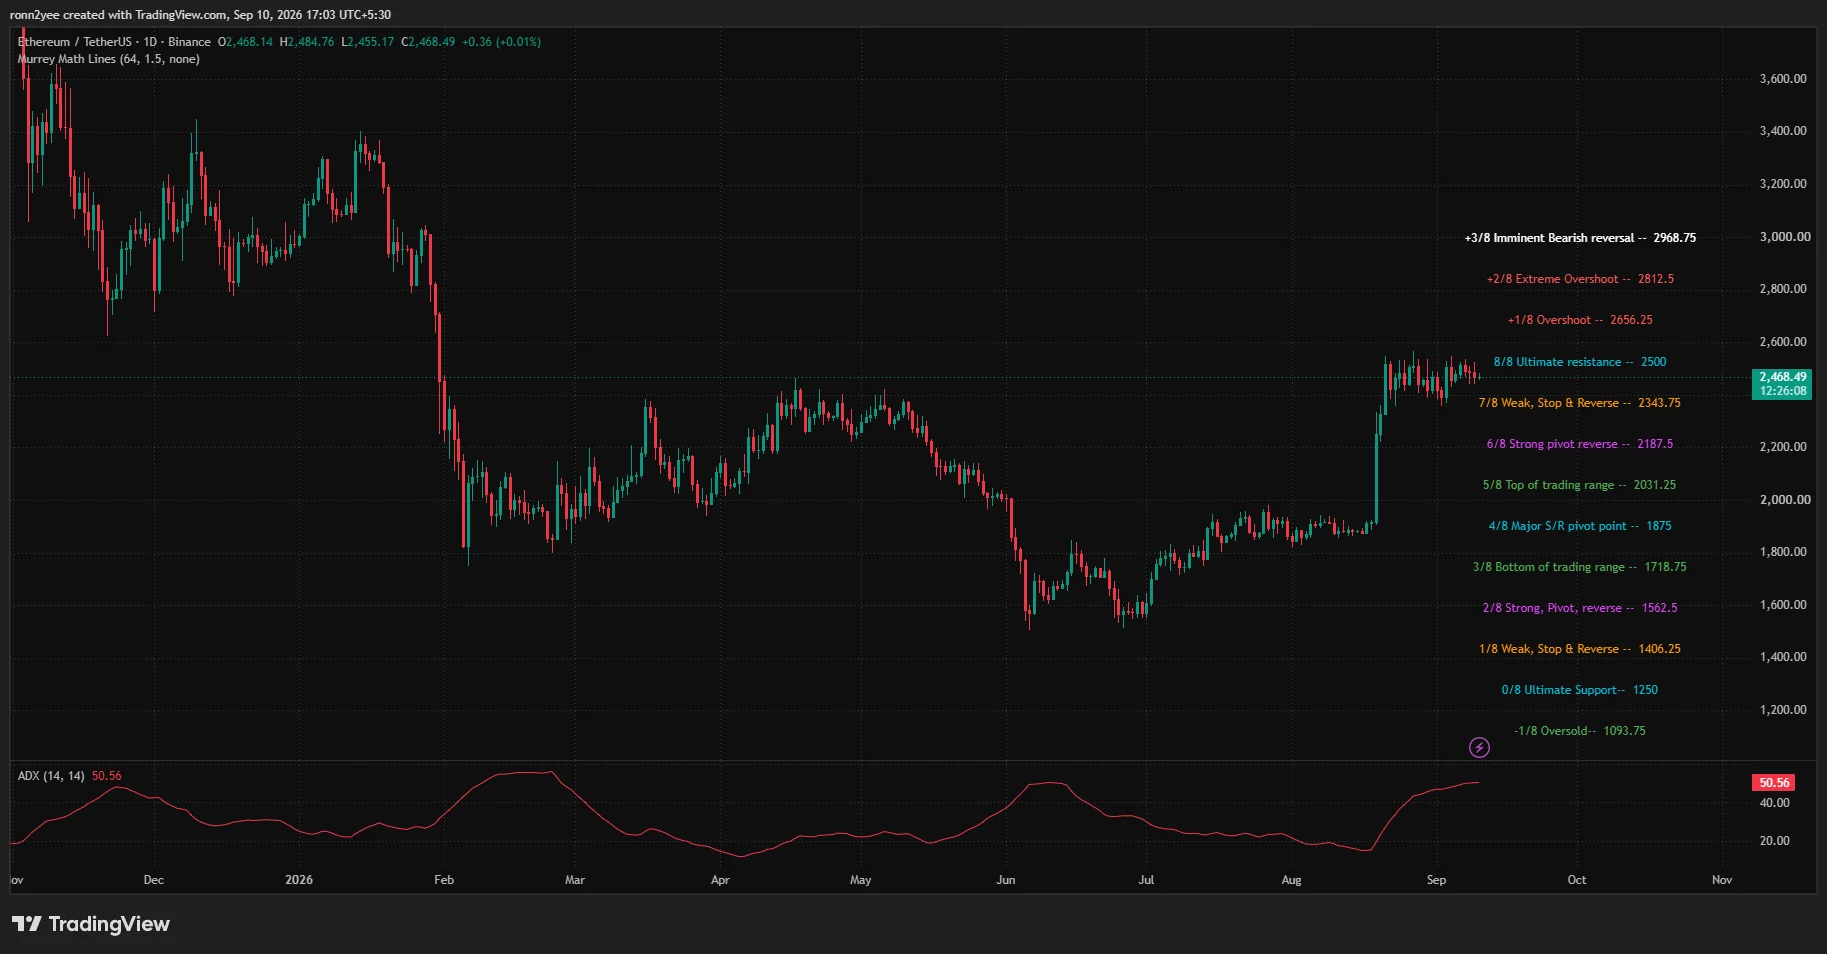
Ethereum’s latest daily candle opened at $2,468.14, reached a high of $2,484.76 and fell as low as $2,455.17. The small trading range showed that neither buyers nor sellers had established firm control during the session.
The broader structure remains stronger than it was before the August breakout. However, ETH is now testing the 8/8 Murray Math resistance at $2,500, making the level an important dividing line between continued consolidation and another upward move.
4-hour indicators show weak buying pressure
On the 4-hour chart, Ethereum traded at $2,469.40, below the Bollinger Bands’ middle line at $2,484.18. The upper band stood at $2,507.87, while the lower band was near $2,460.49.
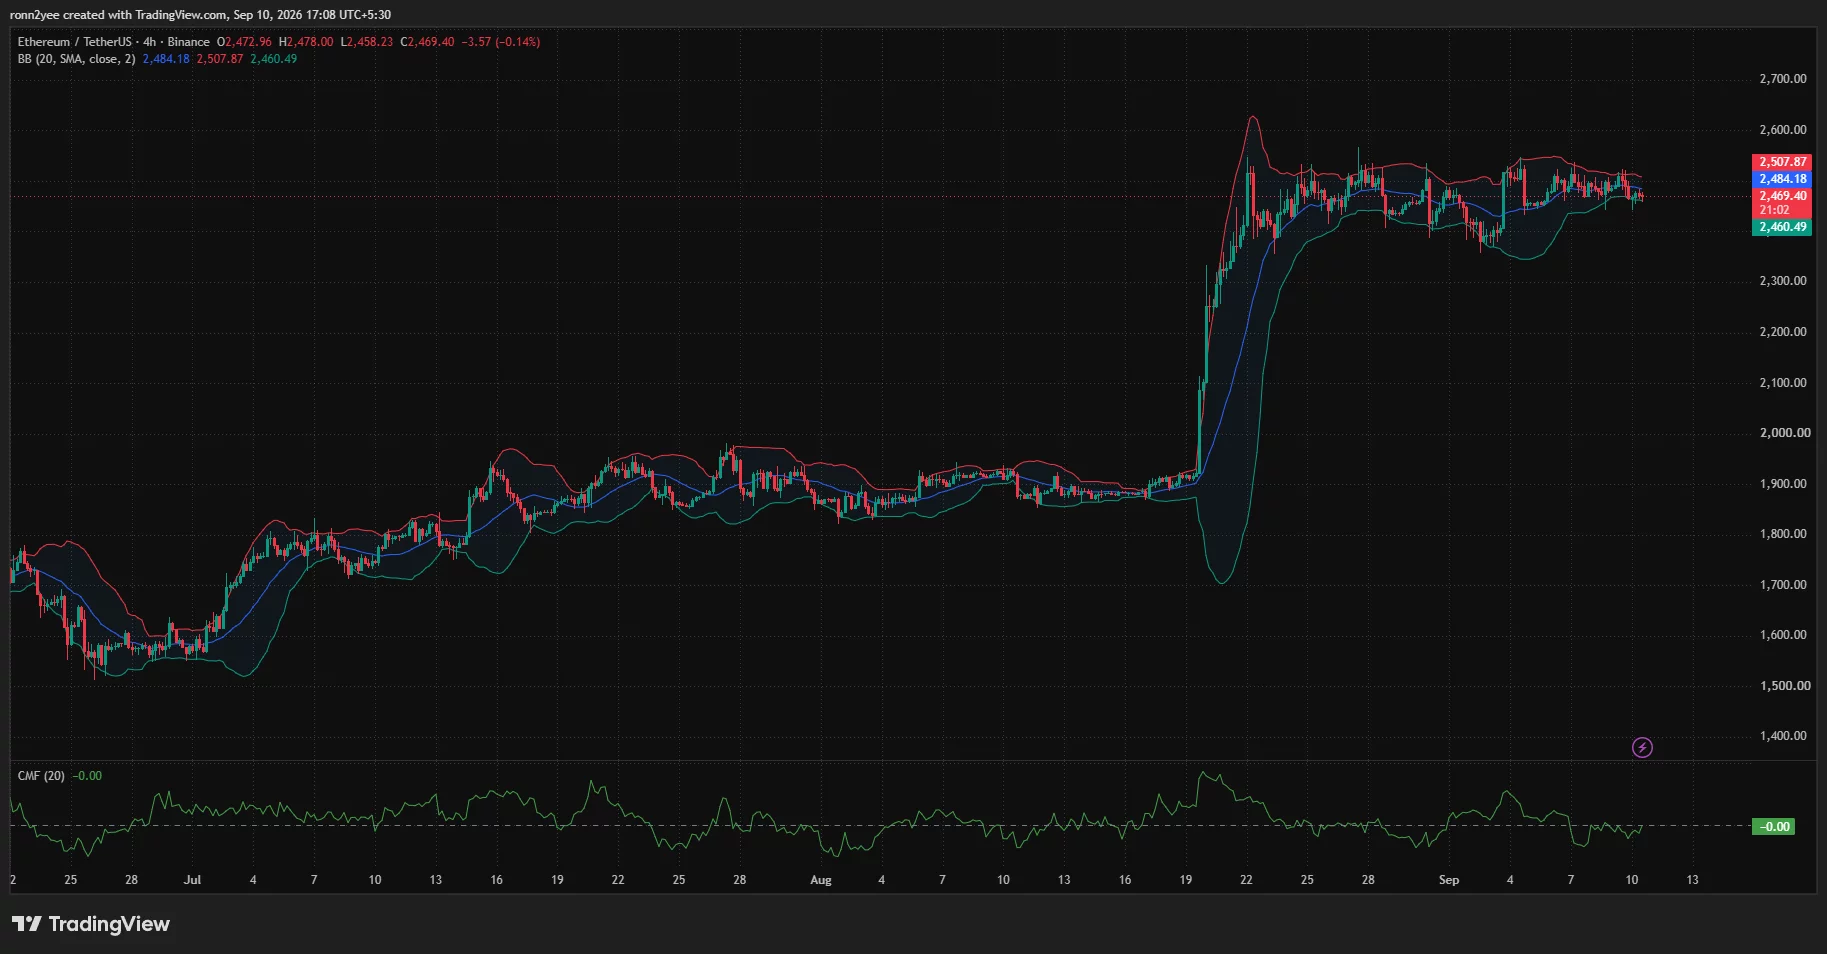
Price sitting close to the lower band showed that short-term selling pressure remained active. A close below $2,460 could push ETH toward the recent intraday low near $2,445, while a recovery above the middle band would return attention to the $2,500–$2,508 resistance zone.
The Chaikin Money Flow reading was near zero, showing no clear net inflow of capital on the 4-hour timeframe. The neutral reading matched the sideways price structure, with ETH moving between support and resistance without strong follow-through.
The daily Average Directional Index stood at 50.56. An ADX reading above 25 usually indicates a strong trend, but the indicator does not determine its direction. In Ethereum’s case, the elevated reading reflects the strength of the larger move that began in August, even as price consolidates beneath resistance.
Liquidation map places ETH between two liquidity zones
CoinGlass’ 24-hour Ethereum liquidation heatmap showed large concentrations of leveraged positions on both sides of the current price.
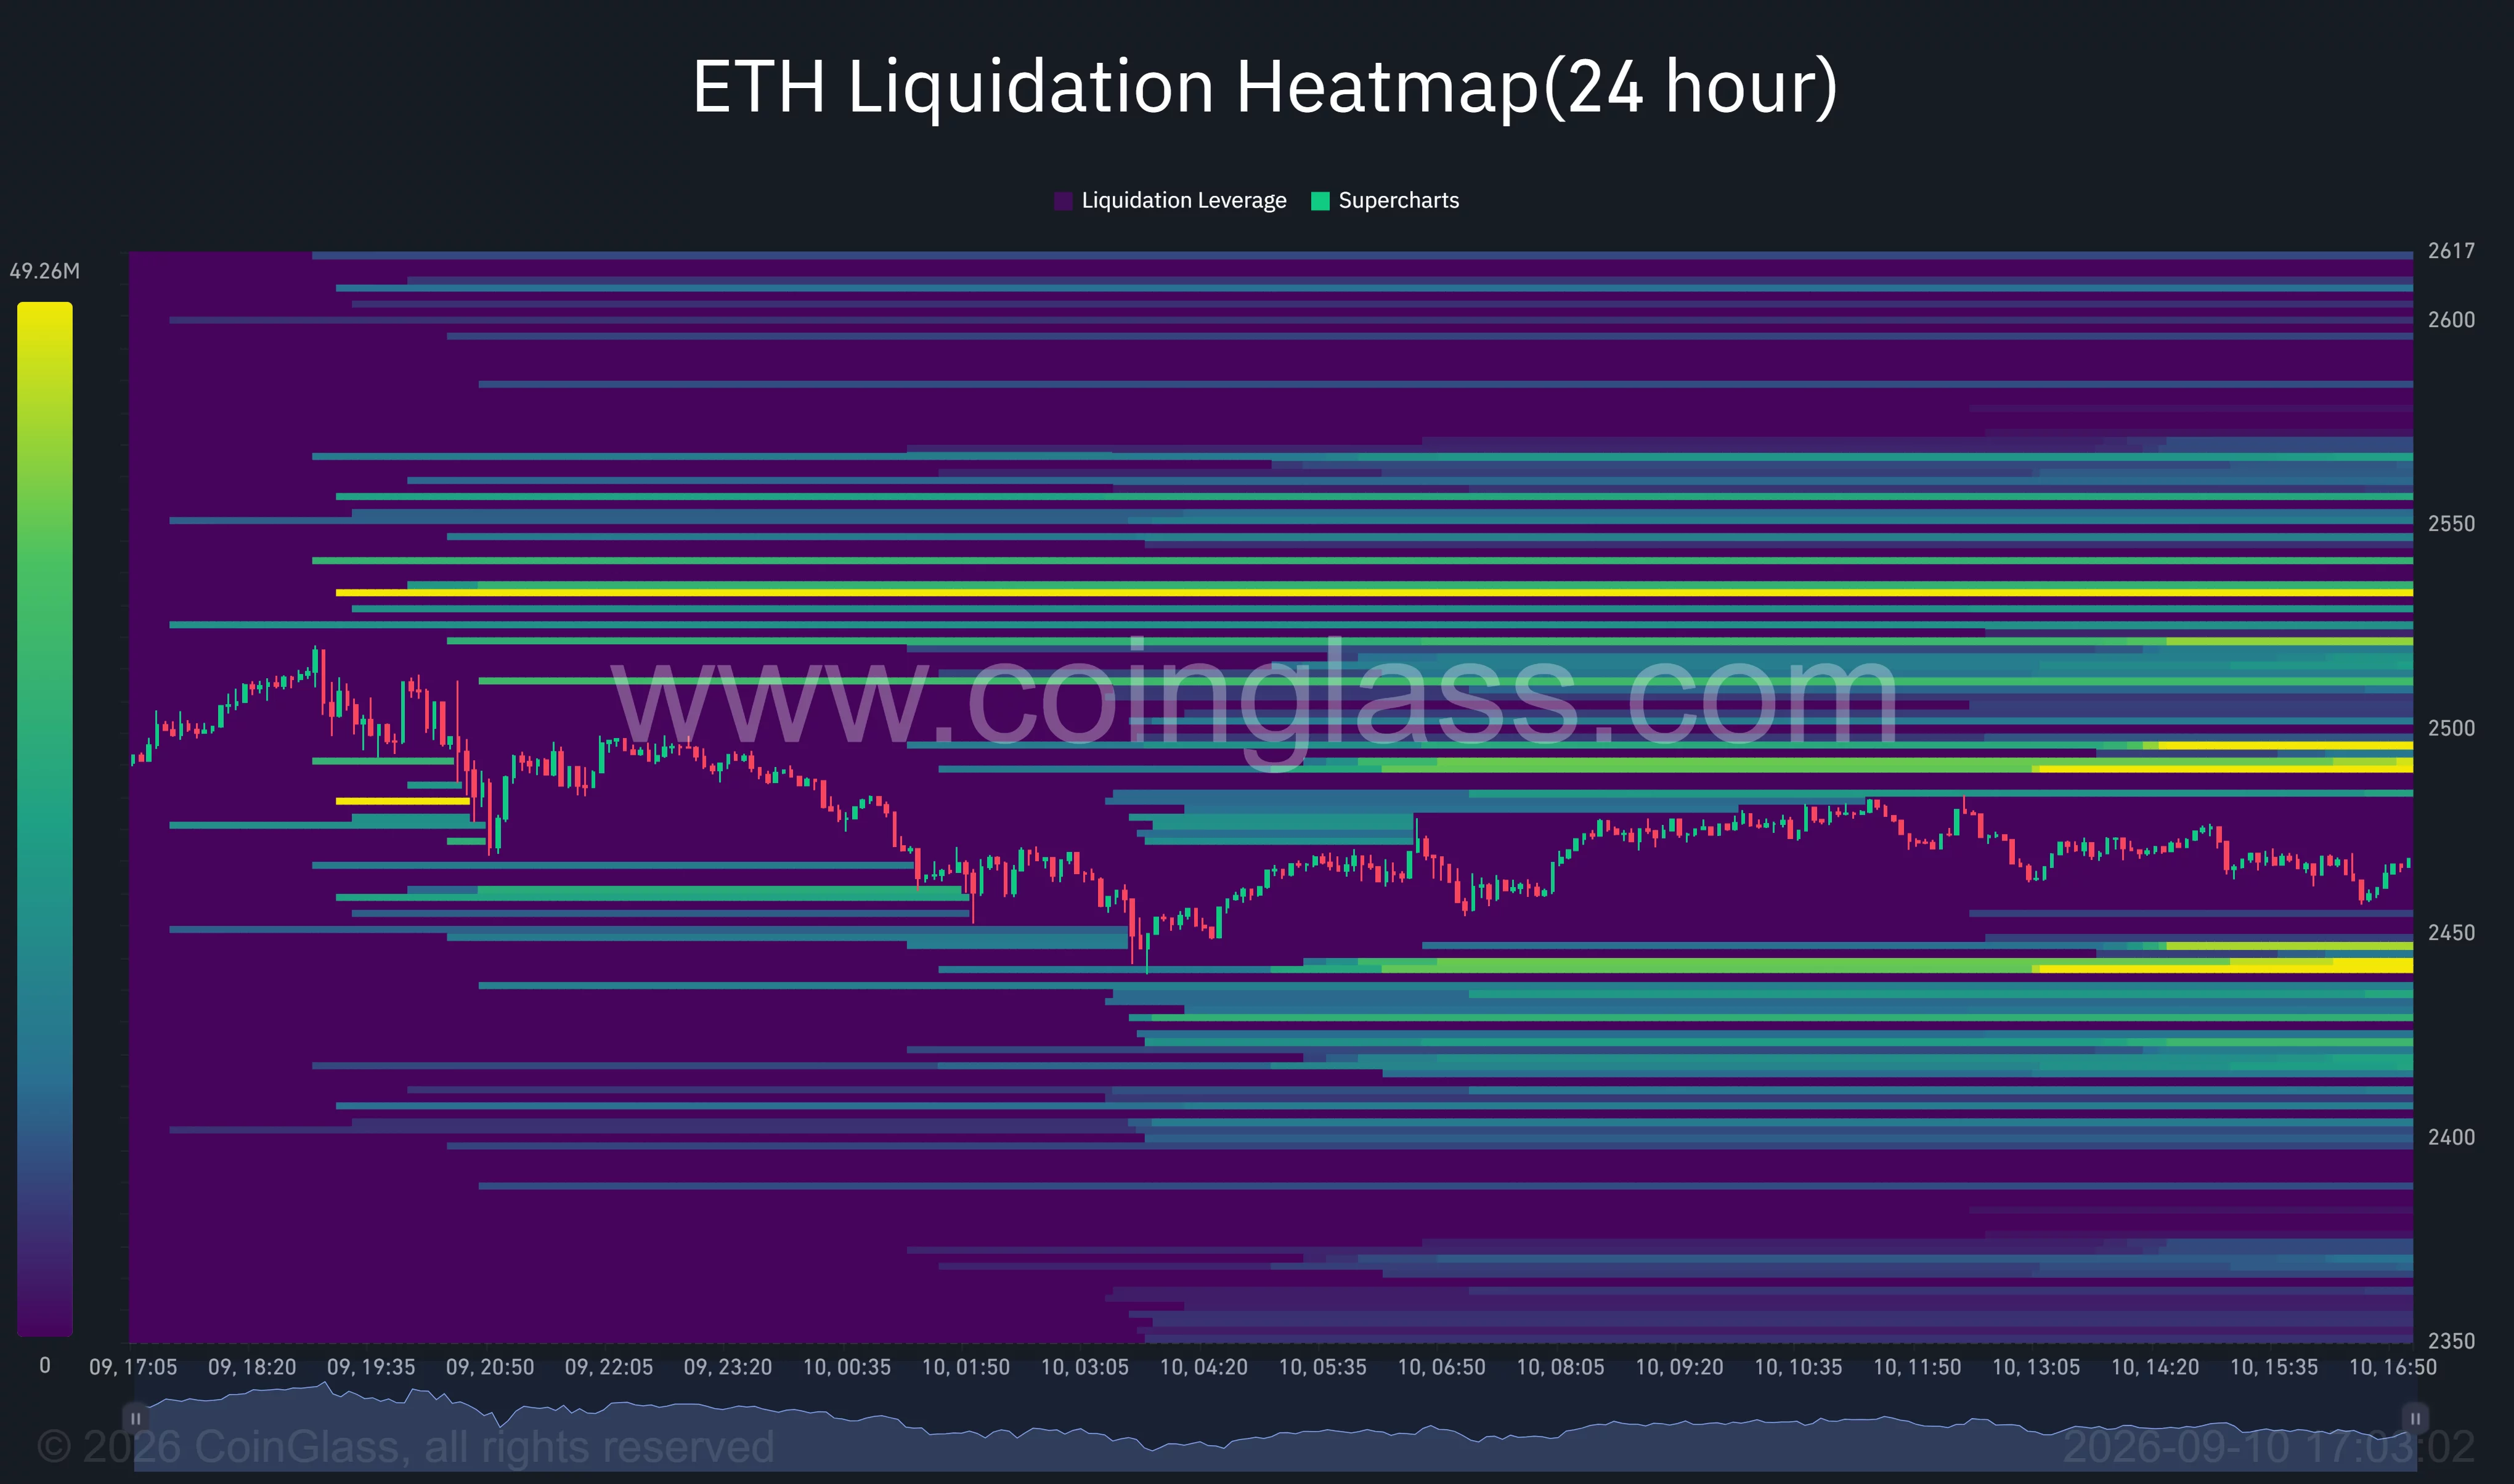
The nearest major liquidity cluster below ETH appeared around $2,440. Additional concentrations were visible between approximately $2,400 and $2,430. A break under $2,440 could force leveraged long positions to close and accelerate a move toward those lower bands.
Above the market, the largest nearby liquidation concentrations appeared around $2,490 and between $2,520 and $2,535. Liquidity was also visible near $2,550.
A rebound through $2,490 could therefore trigger short liquidations and pull Ethereum back toward $2,520. However, the number of liquidity bands on both sides of the price raises the risk of sharp moves within the existing range before ETH establishes a clear direction.
The liquidation heatmap also supports the short-term technical boundaries shown by the 4-hour Bollinger Bands. Both charts place Ethereum between support around $2,440–$2,460 and resistance beginning near $2,490.
Analysts identify $2,550 as the breakout level
Crypto trader Daan Crypto Trades said Ethereum had formed a tighter range than Bitcoin while sitting on support near $2,460. According to the analyst, neither bulls nor bears had strong momentum while both assets remained inside their respective ranges.
Daan added that a range break could lead to heavy liquidations among traders positioned on the wrong side. The heatmap supports that risk, with leveraged positions concentrated directly above and below Ethereum’s current market price.
Analyst Ted Pillows identified a wider range between $2,450 and $2,550. He said Ethereum would need a weekly close above $2,550 to begin another upward leg.
A confirmed move above $2,550 would place the next Murray Math target at $2,656.25. Further gains could expose $2,812.50, while the daily chart marks $2,968.75 as a higher resistance level.
The bearish scenario begins with a sustained break below $2,450. The next major daily level sits at $2,343.75, followed by stronger pivot support around $2,187.50. Ted’s weekly chart similarly identifies support near $2,215 if the current range fails.
US macro conditions could decide the range break
Ethereum’s compressed range comes ahead of the Federal Reserve’s Sep. 15–16 policy meeting. US interest-rate expectations remain important for ETH because higher yields can reduce demand for non-yielding risk assets, while a softer policy outlook can support speculative markets.
Until the Fed decision provides more clarity, Ethereum may remain sensitive to changes in Treasury yields, the US dollar and broader risk appetite. Derivatives positioning could amplify the reaction because large liquidation clusters sit close to both sides of the current price.
The immediate technical decision remains clear. Holding $2,440–$2,460 would preserve the range and allow another test of $2,500. Ethereum needs a weekly close above $2,550 to confirm stronger upside momentum, while a loss of $2,440 would shift attention toward $2,344 and $2,215.
Disclosure: This article does not represent investment advice. The content and materials featured on this page are for educational purposes only.


BTC’s move above $80,000 has triggered a “double-bottom breakout,” a technical analysis pattern confirming a bullish trend and opening the door for a rally to $100,000, according to Jurrien Timmer, director of global macro at Fidelity Investments.
“Bitcoin is looking particularly interesting here as it challenges key resistance at $80k. If it breaks it will confirm a double bottom targeting $100K,” Timmer wrote on X on Friday.
A double bottom looks like the letter W on a price chart. The price drops to a low, bounces, falls back to roughly the same level, then rises again. The two dips show buyers stepping in at the same price twice. The peak in the middle of the W acts as resistance. A break above it suggests sellers have run out of steam and a new uptrend may be starting.
Timmer’s chart shows bitcoin’s two lows this year at $60,033 and $57,742, with the middle peak near $82,800.
Chart patterns are not guarantees. Breakouts often fail, reversing quickly and trapping buyers who chased the move.
Still, the bullish setup is consistent with options traders positioning for more gains. The $90,000 call is the most popular bitcoin options bet on crypto exchange Deribit, with $2.45 billion in open interest. The $95,000 call follows with $2.33 billion, and the $100,000 call holds $1.79 billion. A call gives the buyer the right to buy at a set price and profits when the market rises above it.
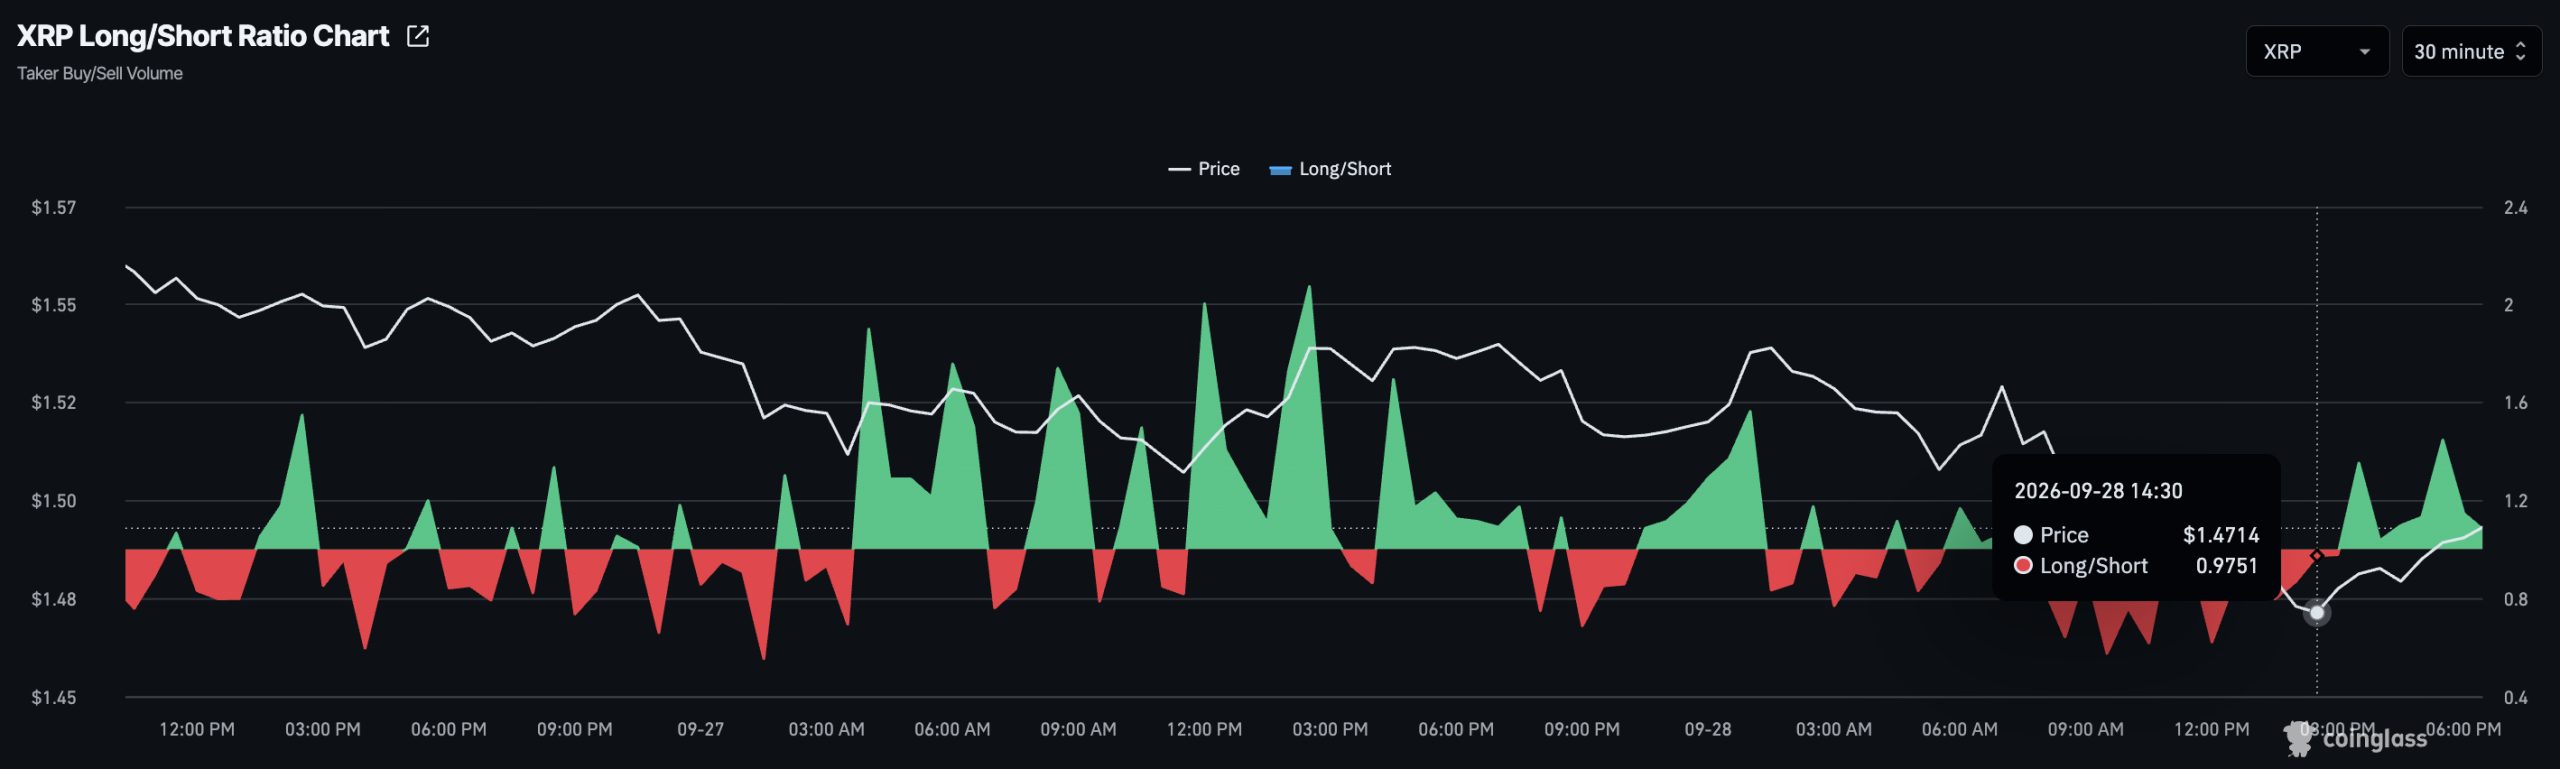
XRP price hovers under $1.49 after three consecutive daily declines left the token losing the $1.50 support, even as a modest bounce pulled it off session lows. CoinGlass data showed the long-to-short ratio at 0.975, meaning short positions marginally outnumbered longs, while the funding rate sat at a positive 0.008%, the reading that determines whether long or short traders pay a periodic fee to hold perpetual futures.
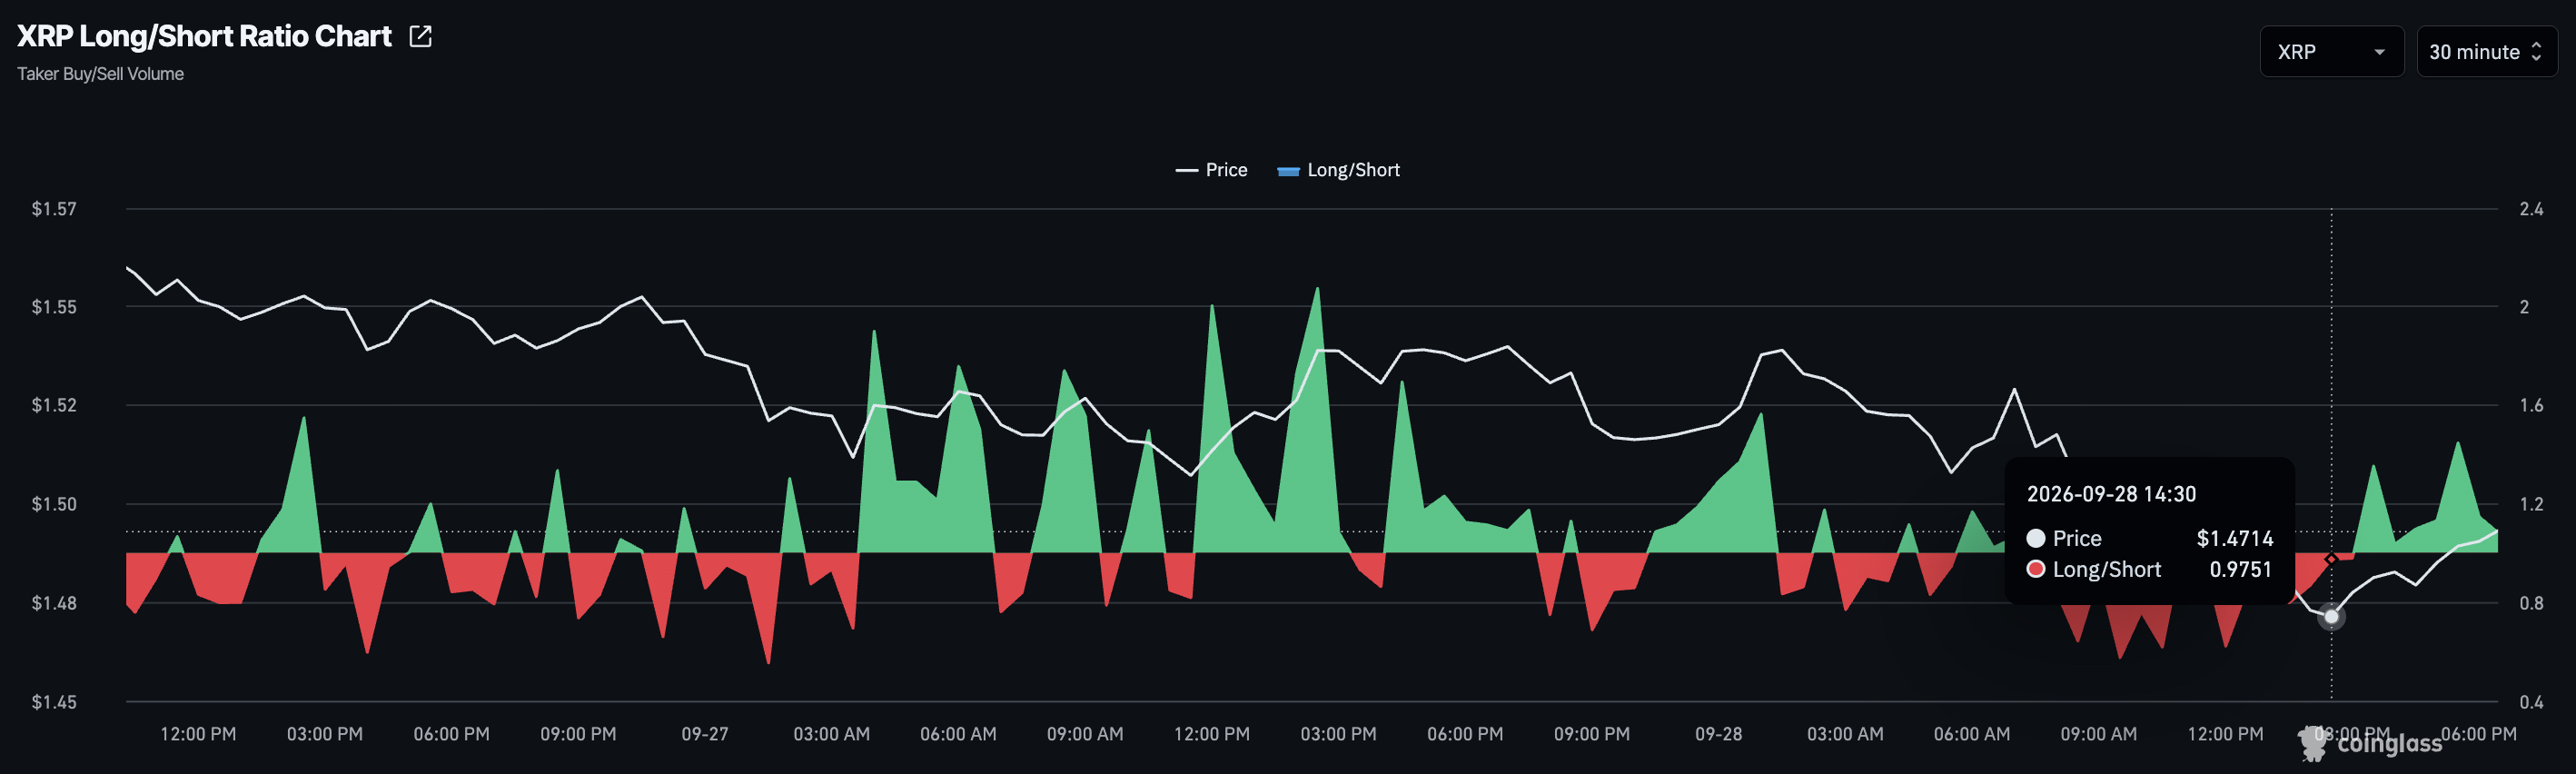
XRP Long Short Ratio, Coinglass
That combination is the crux of the problem. Traders are still paying to stay long, yet the spot price has not moved in a way that rewards the bet, and the disconnect between heavy spot selling and futures demand is the setup that tends to unwind fast once a key level gives way.
A 0.975 long-to-short ratio is not a bearish signal in any decisive sense. It sits close enough to 1.0 that it reads as near-balanced positioning rather than a market leaning hard in either direction.
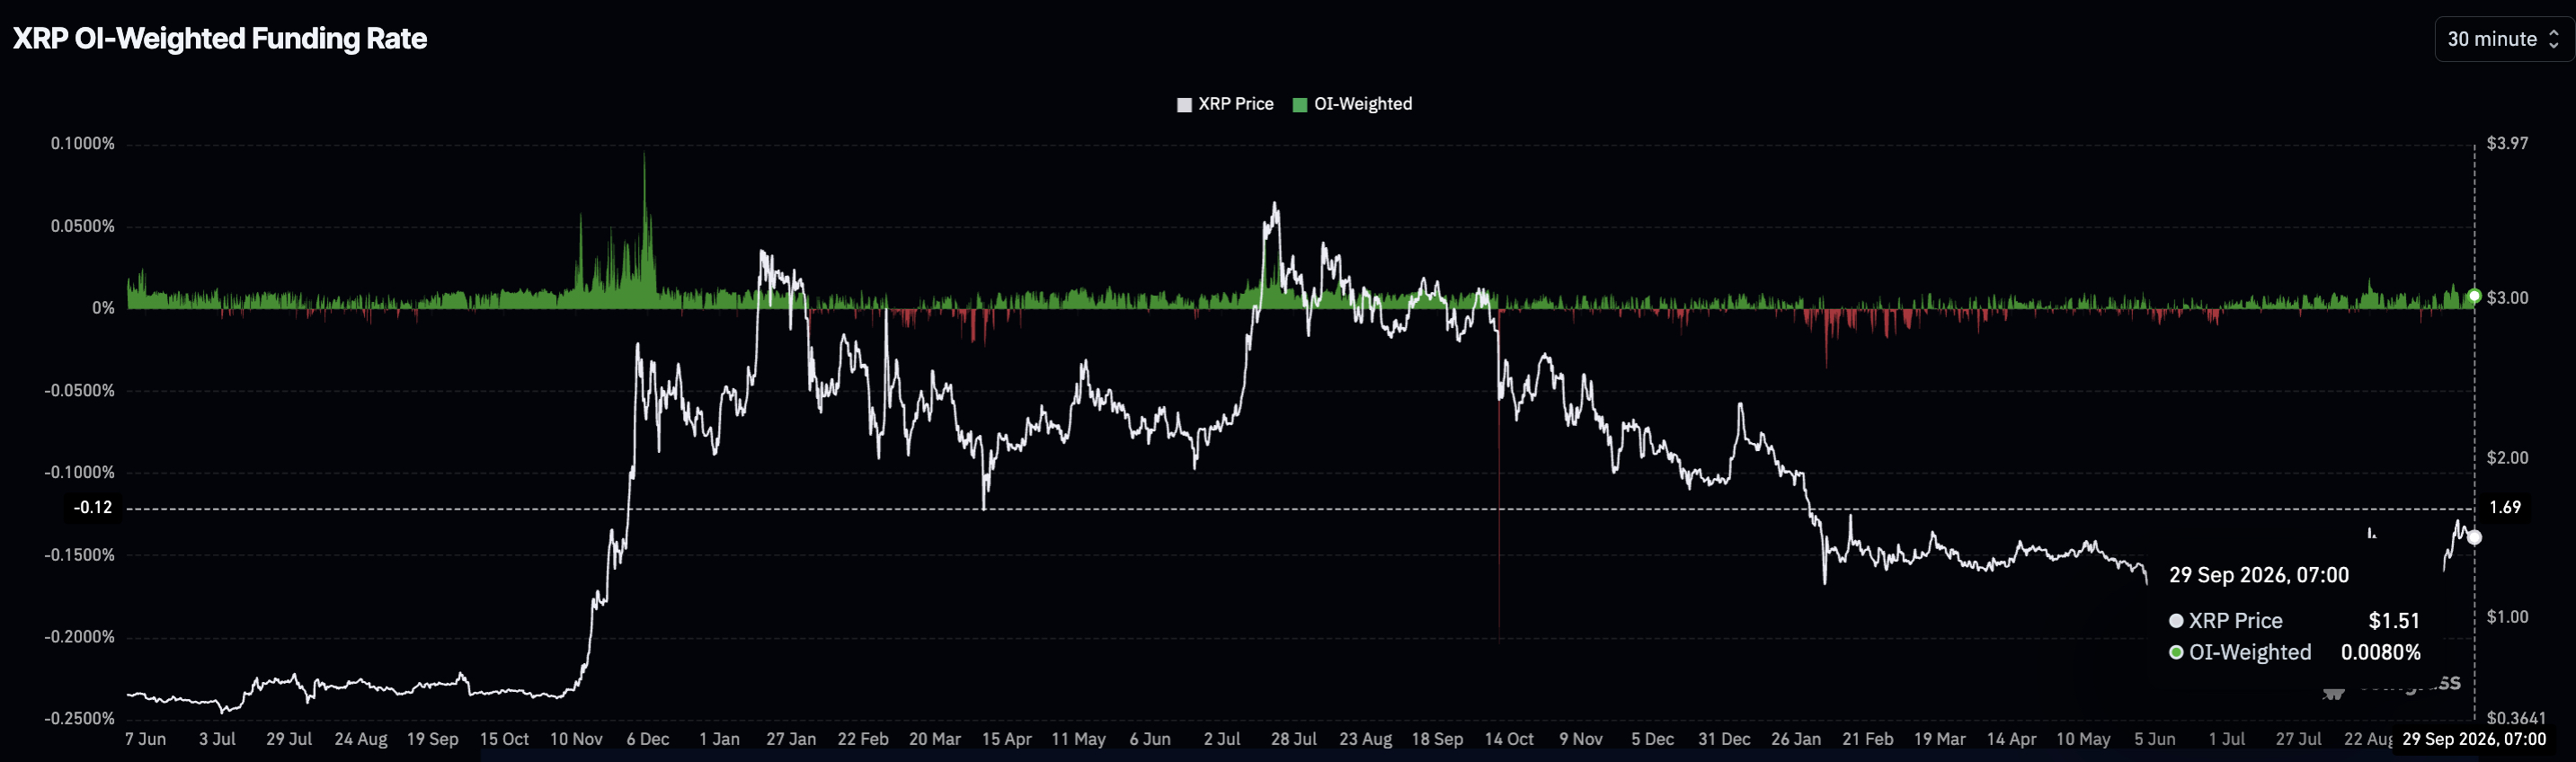
XRP Funding Rate, Coinglass
Funding tells a more interesting story on its own. A positive rate means demand for long exposure in crypto derivatives is real enough that longs are compensating shorts to hold the position, which typically signals conviction that price moves higher.
However, it cuts both ways: if price falls further, those same leveraged longs become forced sellers, and a positive funding regime built on thin spot demand can flip into a liquidation cascade faster than one built on genuine accumulation.
CryptoQuant’s summary data flagged overheating conditions across both XRP’s spot and futures markets, alongside sell-side dominance in futures, meaning sellers have retained the upper hand in derivatives even as funding stays positive. That is the missing piece: positive funding shows traders are willing to hold bullish exposure, but it has not yet translated into enough buying pressure to absorb the futures selling and push through resistance.
Earn $50 and Enter $300K Prize Draw on EdgeX
XRP Price and the $1.37 Support
The daily chart still leans bullish on a longer timeframe. XRP held above its 50-day price exponential moving average near $1.365 and its 200-day EMA near $1.369 through the three-day slide, with the 100-day EMA sitting lower at $1.307 as a secondary reference.
Momentum has cooled rather than reversed. The RSI sat near 55, close to neutral, and the MACD flattened around zero, a pattern consistent with consolidation after an earlier advance rather than an active breakdown.
The level that matters most sits at $1.37, where the 50-day and 200-day EMAs converge into a single support band. A clean break below that zone opens the $1.30 area, and a deeper slide would eventually put the $1.00 psychological level in play, though XRP would need to fall substantially before that becomes the immediate focus. On the upside, reclaiming the $1.574 resistance level is the trigger that would strengthen the case for a move toward $1.90.
Trade XRP on Bybit and Get a Chance to Win Our $1,000 USDT Airdrop
What Happens Next for XRP?
Two scenarios frame the near-term path. If XRP holds the $1.37 zone, the market stays in a consolidation phase where positive funding continues to reflect trader appetite for long exposure, but that alone won’t confirm a breakout without a corresponding rise in open interest and spot volume.
If XRP price instead reclaims $1.574, the technical case for a run toward $1.90 gets meaningfully stronger, and that move would likely force shorts to cover into strength. The alternative is a sustained break below $1.37, which shifts focus to $1.30 as the next line of defense, with $1.00 as the deeper level only if that support also fails.
Either way, the current setup leaves no room for complacency on either side of the trade. Near-balanced positioning combined with positive funding and futures sell-side dominance is a fragile mix, and the next move in spot price will do more to settle the argument than another shift in the long-short ratio.
Discover: The Best Token Presales
The post XRP Price in Danger: Positive Funding Masks a Fragile Setup appeared first on Cryptonews.
Bitcoin recovered Monday’s losses to trade at $84,170 on Tuesday, up 0.82% since midnight UTC and 1.4% over 24 hours, with 72 of the 100 CoinDesk 100 constituents higher and the index adding 0.89% to 1,904.49.
The bid is arriving despite conditions that have been suppressing risk assets for a week, the 10-year Treasury yield sitting at 5.234% after ending Monday above 5.2%, near levels last seen in 2007, and the 30-year at 5.549% having topped 5.56% on Monday, around a 2004 high.
U.S. stocks fell for a second session on Monday, the Dow dropping more than 300 points and the S&P 500 and Nasdaq Composite shedding 0.8% and 0.9%, with futures mixed on Tuesday morning.
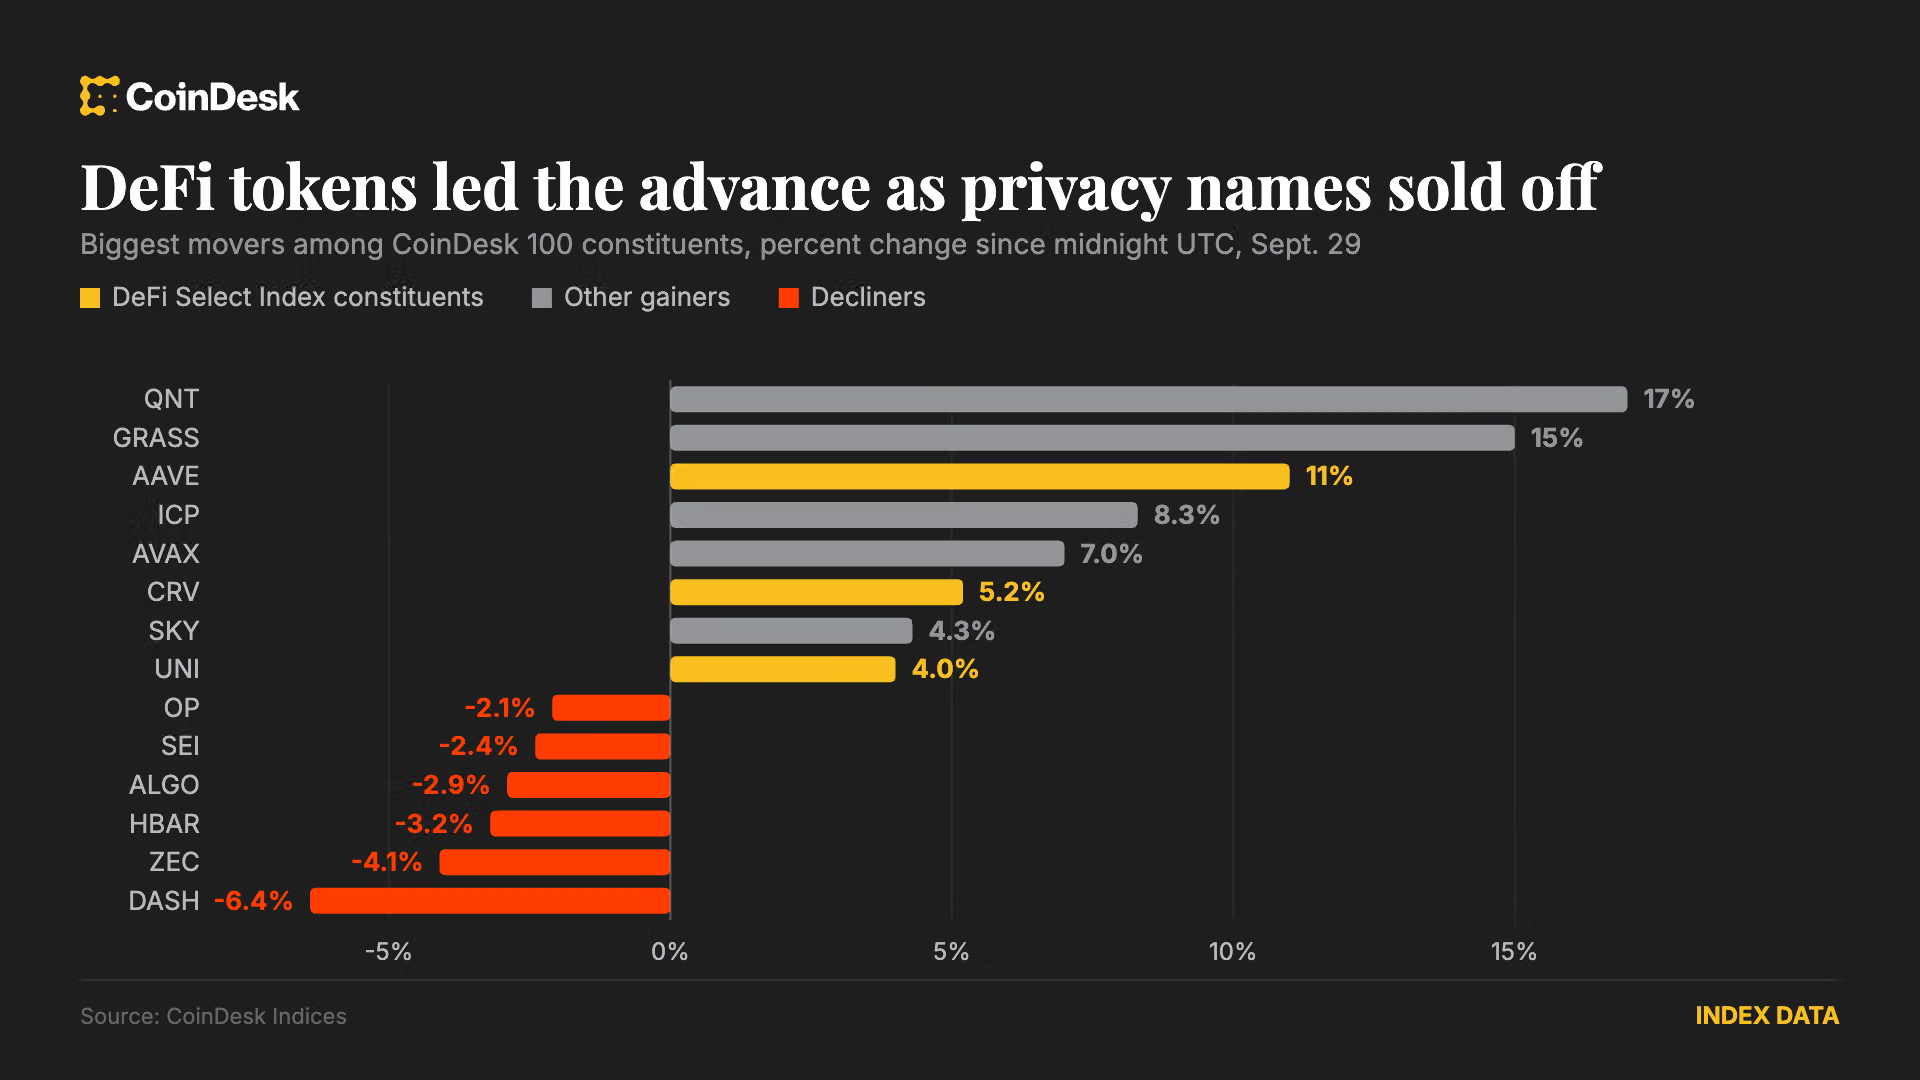
Decentralized finance (DeFi) is driving the move for the second time in a week, with the DeFi Select Index (DFX) gaining 5.0% since midnight, led by lending protocol token aave at 11% and curve dao token at 5.2%. The CoinDesk 80 rose 2.0% against the CoinDesk 5’s 1.3%, though the ranking inverts over 24 hours, where the CD5’s 1.7% beats the CD80’s 0.44%.

The D’CENT wallet hack, the year’s second-largest drain of XRP behind the Bitget crypto exchange hack, has spilled beyond the XRP Ledger onto additional blockchains like Bitcoin, Ethereum, and Stellar.
Hackers have drained more than 12.4 million XRP from more than 7,000 D’CENT wallets, still some way behind Bitget’s loss of 102.9 million XRP.
Although the wallet was popular among the XRP community, D’CENT users who owned assets of other blockchains have also lost their funds.
D’CENT’s own disclosure named Bitcoin, Tron, and Ethereum, for example. Even a Stellar user has lost XLM in the incident.
Hackers are able to sweep funds across blockchains with one compromised recovery phrase for the multi-blockchain wallet.
IoTrust, the maker of D’CENT, confirmed at least 110 abnormal transfer reports, including non-XRP assets, per ZDNet Korea.
XRP holders lose $18 million in D’CENT hack
Drains of XRP are the most well-documented, due to the prominence of D’CENT among XRP holders.
At least six waves of theft occurred between September 15 and 20, emptying 6,678 wallets of 11.7 million XRP.
The thief stole from large wallets first, by hand, and soon wrote scripts to take funds from progressively smaller wallets.
Warnings from D’CENT and other members of the XRP community couldn’t stop the drainage. Thieves took 640,370 additional XRP after September 21, bringing the tally to above 12.4 million.
By Friday, 6.3 million of those stolen XRP had crossed to Ethereum’s blockchain through the swap service THORChain.
As the theft spilled over to other blockchains, researchers admitted the scope of the losses, saying, “Most of it is no longer XRP.”
Read more: David Schwartz warns of hard fork because XRP nodes won’t upgrade
In August, D’CENT was still touting its hardware wallets’ secure element, boasting that it was impervious to vulnerabilities linked to the Coldcard hack.
D’CENT now warns users that wallets they created using its app are vulnerable, urging them to create a fresh recovery phrase and immediately migrate everything, including tokens, NFTs, and any staked assets.
Got a tip? Send us an email securely via Protos Leaks. For more informed news and investigations, follow us on X, Bluesky, and Google News, or subscribe to our YouTube channel.
Market action since 2022 backs Thielen’s take. The 10-year yield more than doubled to 3.88% that year as the Fed raised interest rates rapidly, including several 50- and 75-basis-point hikes to fight inflation.
Bitcoin fell 64% that year. Fed tightening and rising yields added to the pain from crypto scams and blowups.
The picture has been different since. From the end of 2023, the 10-year yield has risen 135 basis points to 5.23%, the highest since 2007. Over the same stretch, bitcoin has roughly doubled to $86,000, even after pulling back from its October record above $126,000.
Thielen and others attribute much of the recent rise in yields to fiscal fears and a higher term premium. In plain English, investors want to be paid more to lock up their money in long-term bonds, given the uncertainty over inflation and government borrowing.
Chicago-based Strategic Analytics made a similar point about gold, noting that it has tracked fiscal risk more closely than the Fed’s policy path since 2022.
“Since 2022, gold has increasingly tracked fiscal-risk perceptions – term premium, deficits, debt sustainability – rather than the Fed’s policy path. Gold is not defying real yields. It is pricing fiscal sustainability and currency debasement, which has become the marginal driver,” it said recently in a LinkedIn post.

Humanoid robots box during the 5th Global Digital Trade Expo on September 25, 2026 in Hangzhou, Zhejiang Province of China.
Vcg | Visual China Group | Getty Images
BEIJING — China’s securities regulator is raising the bar for public listings of humanoid robot startups, according to three sources familiar with the CSRC’s thinking.
It’s a sign of how one of the hottest sectors of the market is cooling, as investors globally assess whether artificial intelligence stocks are in a bubble.
The Chinese regulator wants local “embodied AI” startups seeking to go public to meet three specific criteria, according to the sources, who requested anonymity due to the sensitivity of the situation.
They are:
- The “window guidance” requires that the humanoid applicants have sustainable revenue and commercial orders.
- Losses must narrow, with one source saying a three-year forecast is needed.
- The company must possess core technology such as robotic brain or hands.
Even if a startup only has to meet two of the three criteria, as one source indicated, it’s unclear which, if any, of the companies can do so.
That’s lowered expectations to just a handful, or none, of these startups making it to public markets, the sources said.
At least two dozen humanoid-related embodied AI companies have filed to list in Hong Kong alone, according to two of the sources. Hong Kong in May 2025 started letting tech companies file confidentially for IPOs.
The Hong Kong stock exchange declined to comment. The China Securities Regulatory Commission did not immediately respond to a request for comment. Mainland China companies wanting to list in Hong Kong also need the CSRC’s blessing.
Unitree IPO impact
Scrutiny on China’s growing number of humanoid robot startups and their fast-growing valuations — supported by a mix of government and private sector funds — has grown over the last several weeks.
The industry’s posterchild, Unitree, got a regulatory fast-track to its listing in Shanghai on Aug. 19 as the World Robot Conference kicked off in Beijing.
But in a keynote a day later, founder Wang Xingxing cautioned that commercialization beyond dancing robots remained years away. It accentuated a debate that picked up in subsequent weeks on what humanoids can actually do — and whether industry startups were actually making money.
China now has well over 100 humanoid companies, which fall under the national push for “embodied AI.” The term received Beijing’s support in the last two annual government work reports, although authorities have warned of a bubble in the humanoid robot industry.
Reflecting a rapid surge in interest, investment in the sector hit 47.09 billion yuan ($6.95 billion) in the second quarter, more than double that of the first quarter — and up over six times versus the same period last year, according to industry data provider Xiniu.
Unitree raised about about 6.1 billion yuan ($905 million) in its IPO on Aug. 19 with Shanghai-listed shares skyrocketing more than 460% in their debut to close at 845 yuan.
The stock had nearly halved in price as of Monday, at 459.65 yuan a share.
Hong Kong-listed Ubtech has also tumbled more than 40% so far this year. The company, which went public in December 2023, still reported an operating loss for the first half of this year of 279 million yuan.
The share price decline contrasts with the flood of capital pouring into humanoid robotics companies over the last 12 months or so. The tech, often called “physical AI” in China, has been seen as a way for early-stage investors to benefit from the surge of interest in artificial intelligence models.
However, Rhodium Group analysis this month found that China’s AI companies only make about 10% the revenue of Anthropic and OpenAI. The ratio of valuation to revenue — especially for Chinese AI startups Moonshot and DeepSeek — was far higher than their U.S. rivals, the report said.
While expectations grow for the U.S. AI giants’ IPOs, chipmaker AMD said Monday it is acquiring World Labs for $8.2 billion in a stock deal. The startup, founded by AI pioneer Fei-Fei Li, is building AI models for creating virtual 3D environments frequently used in humanoid robot development.
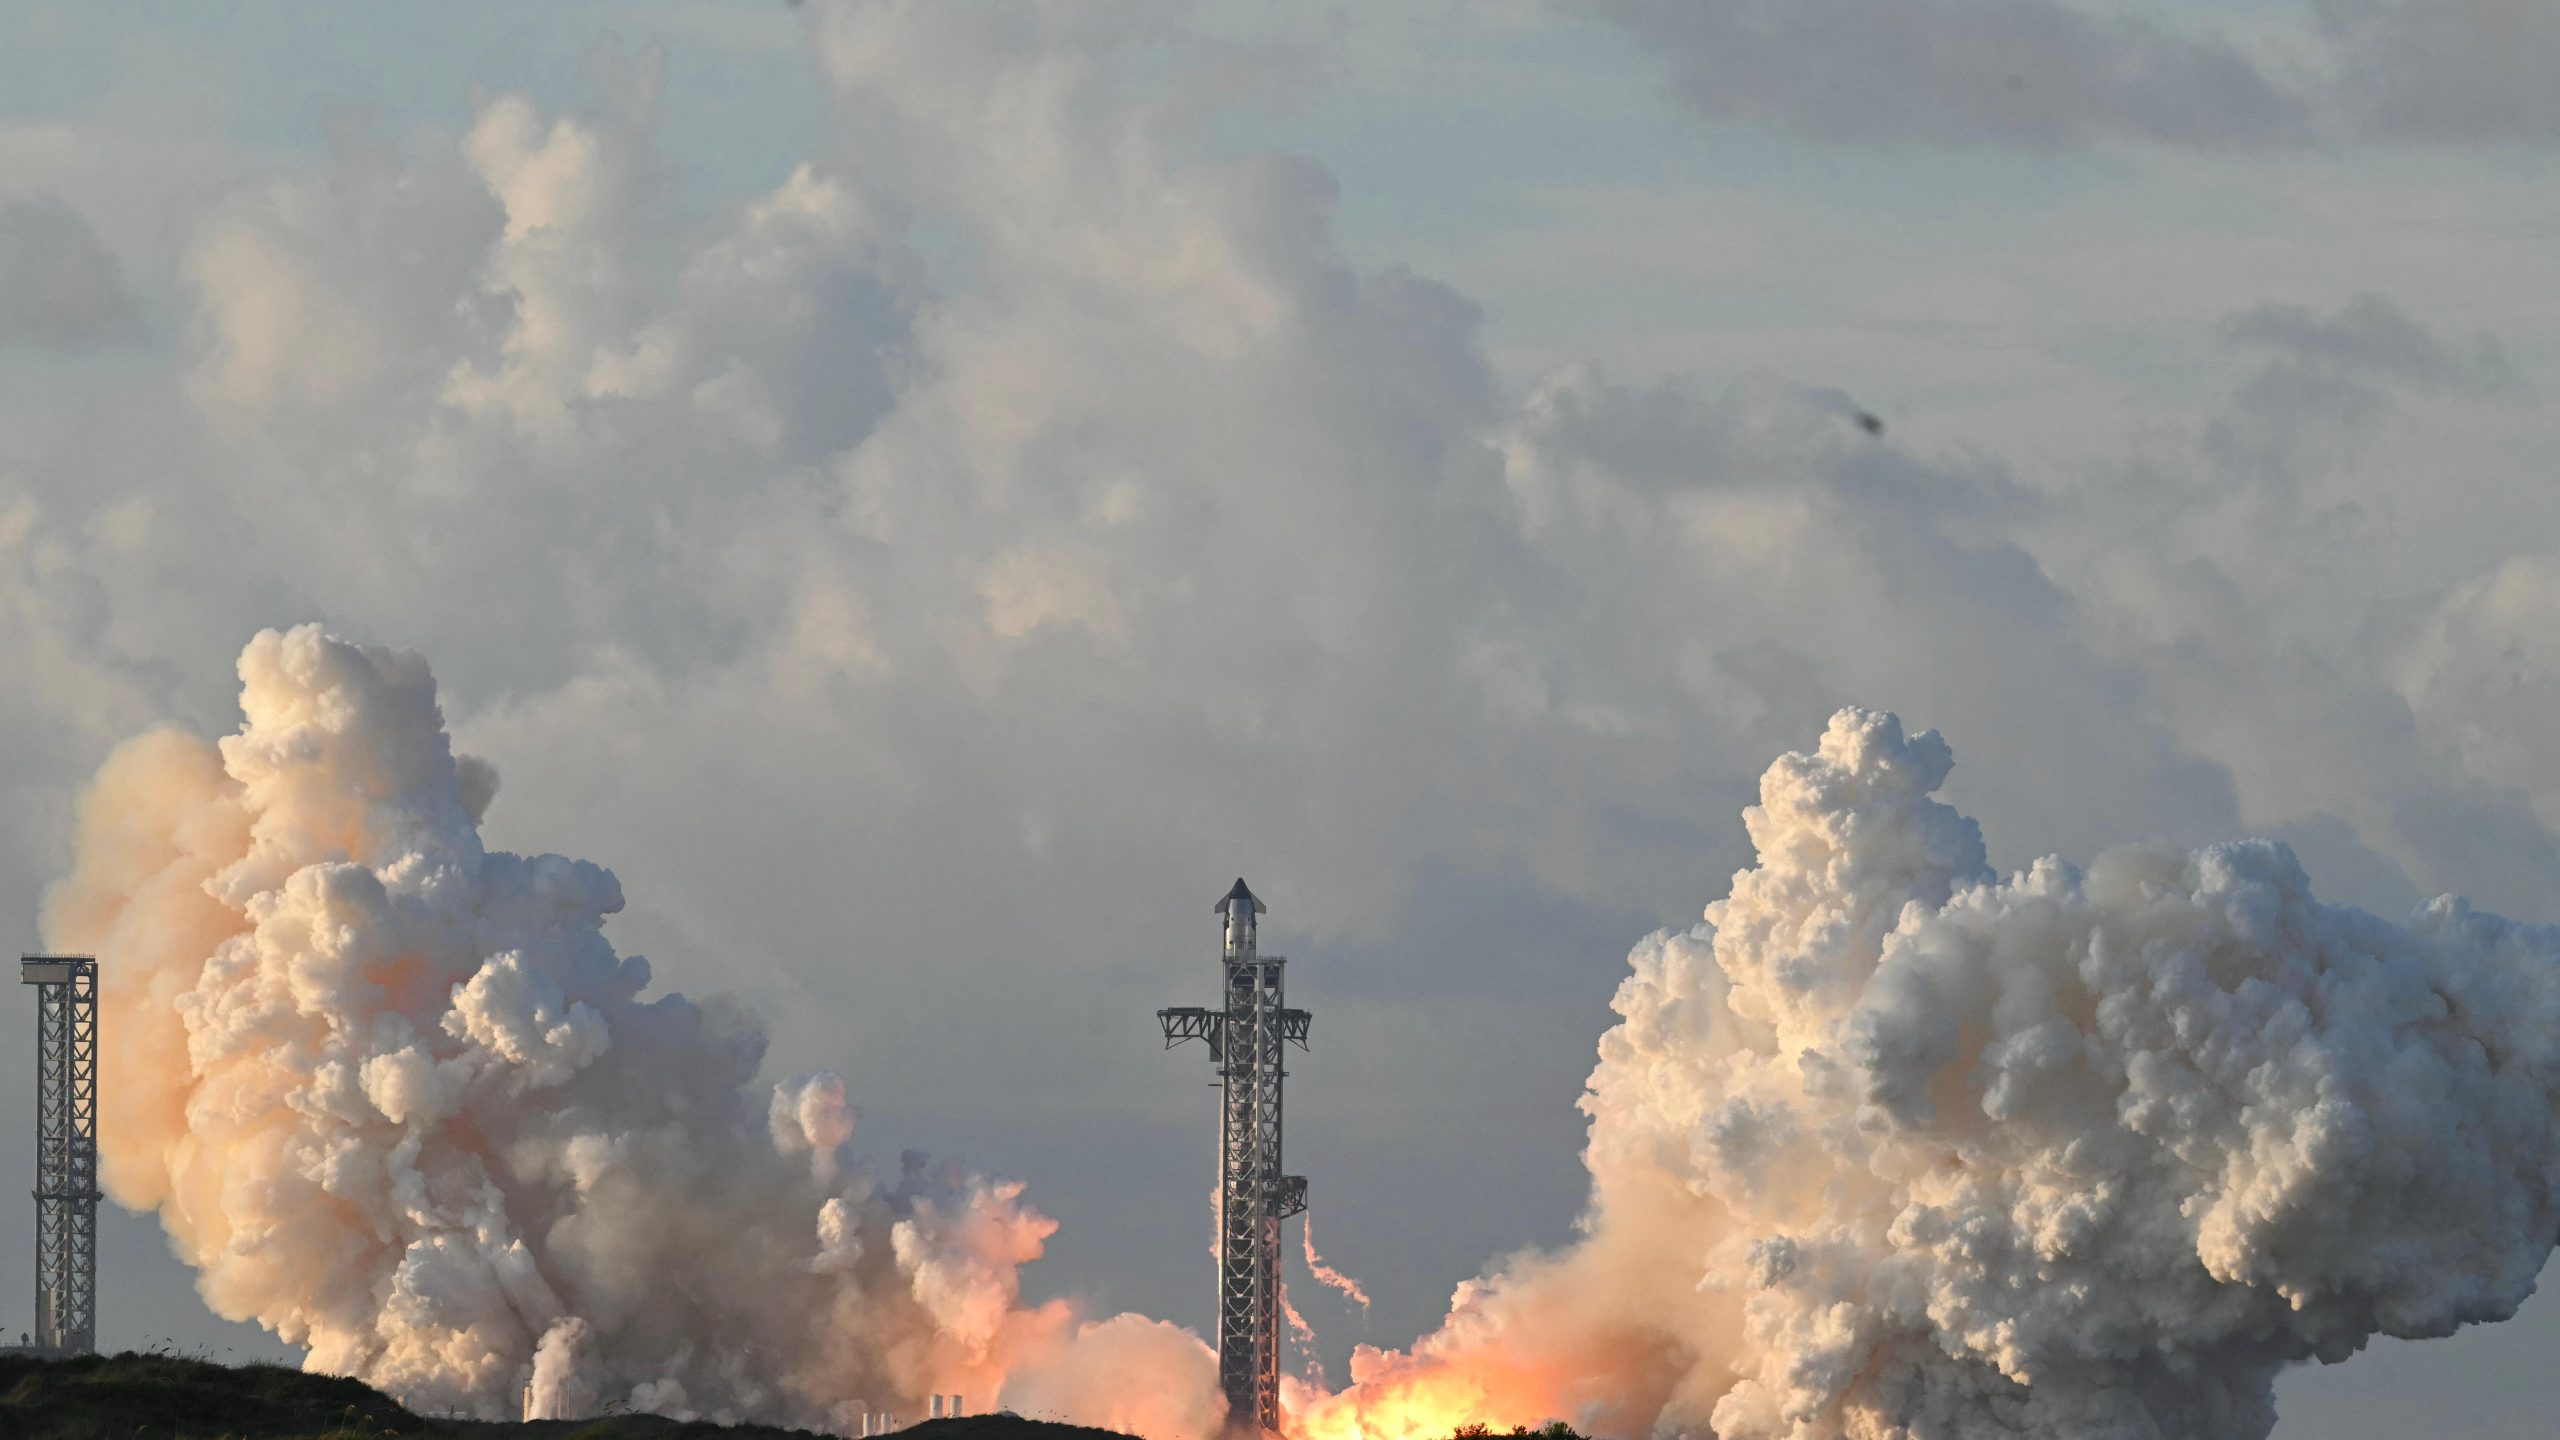
The launch this morning was both imperfect and stripped down to its orbital essentials. On the way up, one of the Starship’s six engines failed to burn properly, requiring the other engines to compensate for the missing thrust to get the ship in orbit.
In addition, the return to Earth was simplified. SpaceX has made itself famous for safely landing the first stage of its Falcon 9 and Starship boosters—with 641 out of 688 Falcon 9 launches featuring this kind of recovery, allowing the boosters to be reused and make flying cheaper. Starship’s first stage, meantime, performs what has become known as a chopstick recovery, with the booster navigating its way back to the launch tower where two giant metal arms pluck it from the sky. For the current mission, the chopstick recovery was done away with to simplify the flight objectives; instead the first stage made a soft, engine-assisted splashdown in the Gulf of Mexico. The Starship spacecraft was planned for a six-orbit, 10-hour mission, with the ship’s engines set to fire around the dinner hour Monday to bring the spacecraft down for a similar gentle, watery landing.
Goldman Sachs’ Anshul Sehgal says bonds yielding 5% or more are not the best trade right now. He still favors AI infrastructure, which he sees as a far more asymmetric bet than the long bond.
Sehgal, a global co-head of Fixed Income, Currencies and Commodities (FICC) at the bank, laid out the view just a few days after the Federal Reserve raised interest rates.
Why Goldman Sachs Is Passing on 5%+ Bonds
On Goldman’s The Markets, Sehgal said the 30-year Treasury, known as the long bond, had hovered around 5% for weeks. He noted that clients want to buy it at 5% or higher, yet he still sees little upside.
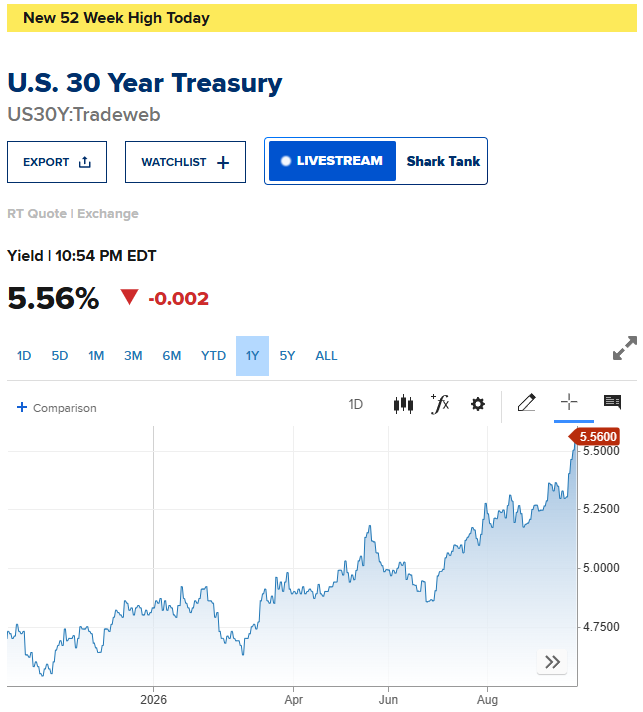
The yield has kept climbing since the recording, reaching 5.56% on September 29, a new 52-week high. Sehgal blamed structural pressure for the strain on the long end. Retiring baby boomers are buying fewer long bonds, and heavy long-dated borrowing tied to AI is crowding the market.
Those pressures explain why the selloff can persist even without a fresh inflation shock. Fewer retirees buying long bonds and a steady flow of long-dated borrowing tied to AI both weigh on prices, and neither fades quickly.
Sehgal adds that fear over US debt sustainability makes investors less willing to hold the long end, which feeds on itself.
The takeaway is that a rising yield does not necessarily break his thesis. It may instead show why he sees limited reward in owning the bond, while the risk to his AI trade is that costlier long-term borrowing squeezes the levered companies he favors.

AI Compute Is the Asymmetric Trade
An asymmetric trade offers far more potential gain than risk. Sehgal applies that label to compute (AI computing power), data centers, and Neoclouds, which are cloud providers built to rent out that capacity.
“I think the asymmetric expression is being long compute.”
Anshul Sehgal, Goldman
The catch is leverage. Savers collecting higher interest have effectively financed the AI build-out, leaving equities more indebted than a year ago. Sehgal admits these are levered bets. Still, he thinks they can multiply in value, while the wider stock market looks less certain.
Tighter Policy Hits Spenders, Not Capital
Sehgal says the Fed frames its September 16 hike as catch-up after five years above its inflation target. Schwab counts 16 of 19 Fed officials expecting another increase this year. Fed Chair Kevin Warsh also stressed three times that the Fed is easing back some stimulus rather than turning restrictive, Sehgal adds.
He argues that government interest payments flow to capital rather than workers, so higher rates curb household spending, a risk for the broader stock market.
He also rejects the debt-sustainability fears weighing on long bonds.
“For me, that’s a red herring.”
Anshul Sehgal, Goldman
Meanwhile, BlackRock’s Rick Rieder is cutting equities for bonds paying 7% to 8%, though his high-grade bond call still cautions against rushing into the 10-year Treasury.
Sehgal names the Middle East conflict as the top driver of policy and markets in the weeks ahead.
The post Goldman Sachs Explains Why Not to Buy the 5%+ Bonds and Rather Stick to AI appeared first on BeInCrypto.
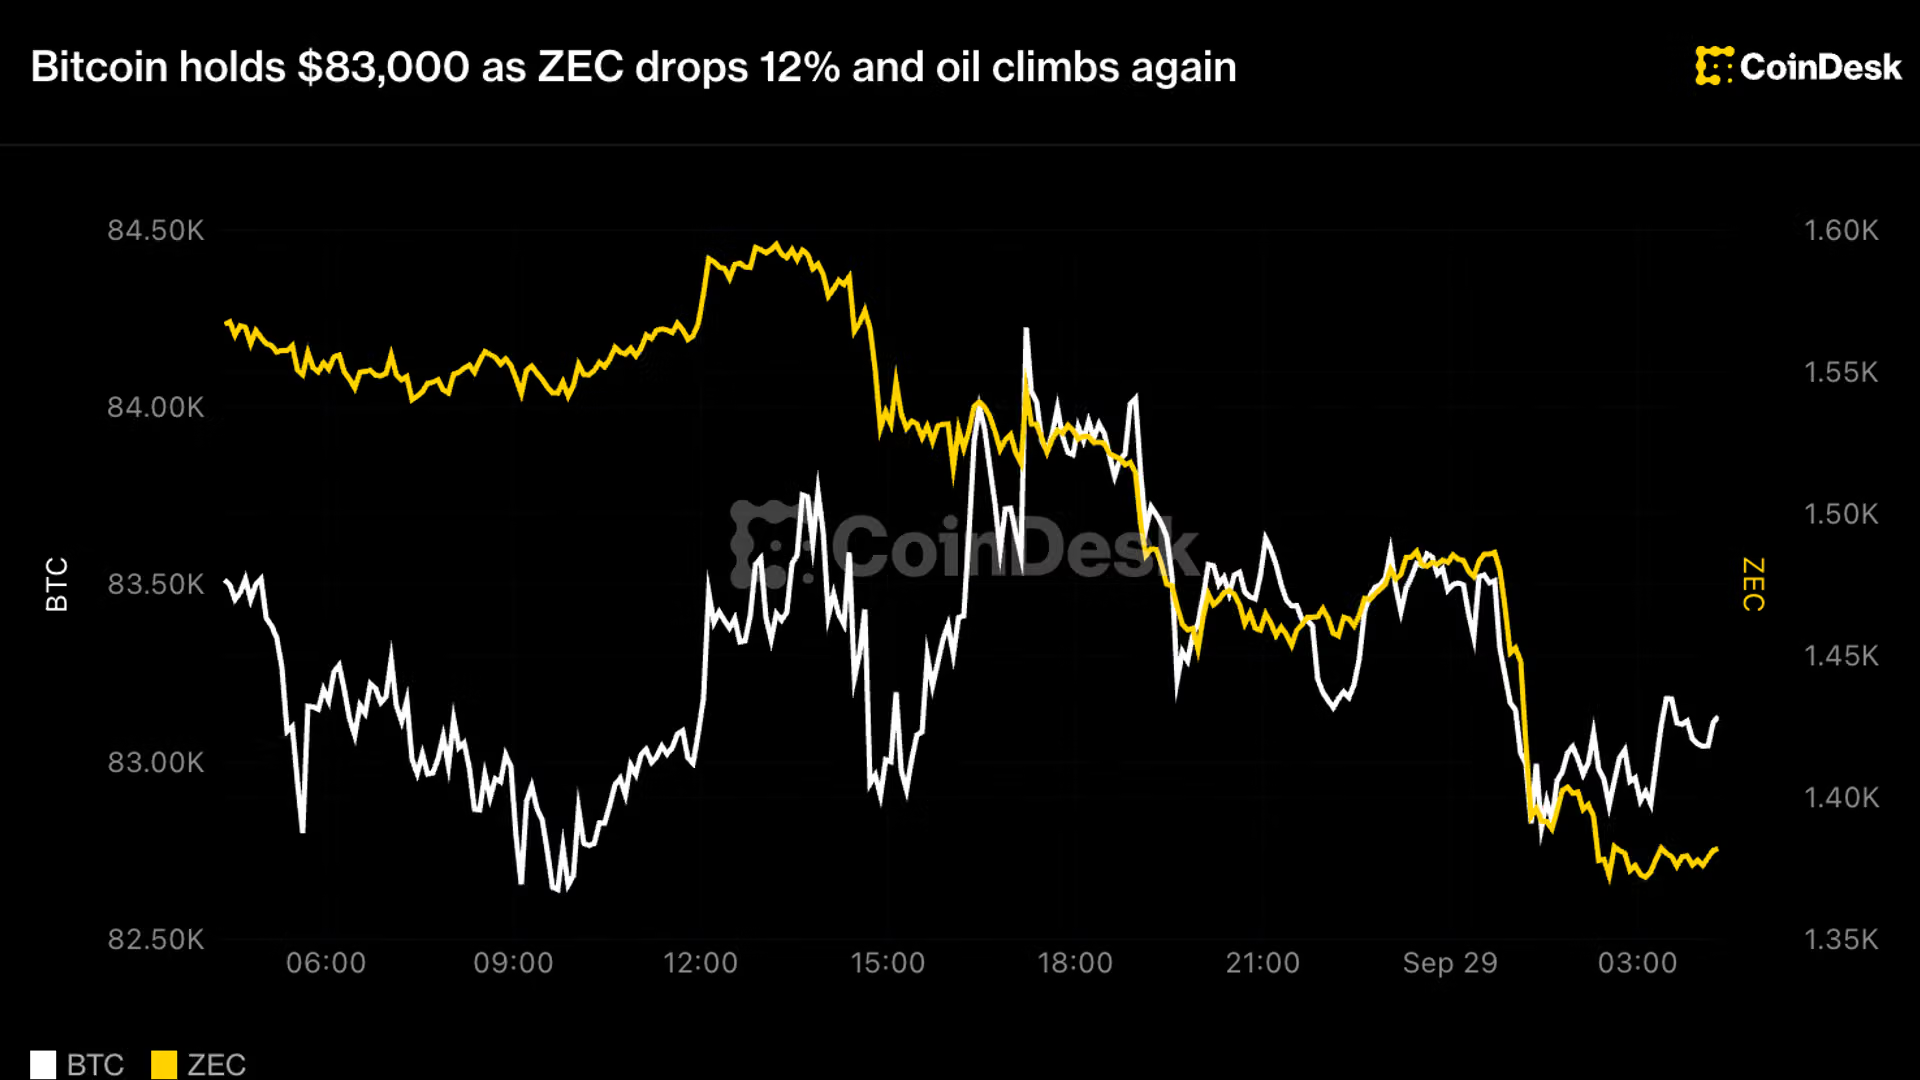
“Bitcoin has pulled back to $83K, testing the lower boundary of last week’s consolidation range,” Alex Kuptsikevich, chief market analyst at FxPro, said in an email to CoinDesk. “As with the market as a whole, a retest of the $82K region, where peaks were formed in May and early September, is entirely to be expected under current conditions.”
“Looking ahead, a sustained return to prices below $80K would be an important signal that the market is not ready to move higher for some time yet. If, however, this consolidation is soon followed by a new bullish momentum, it could send the leading cryptocurrency well above $90K,” he added.
The pressure is coming from bonds and oil.
Treasuries steadied in Asia after tumbling during U.S. trading, with the 10-year yield up one basis point to 5.25% after reaching its highest level since 2007 on Monday. A higher guaranteed return on government debt raises the bar for holding assets that pay no income, bitcoin among them.
Brent rose more than 1% to nearly $107 a barrel, its second straight gain, as hopes for an imminent diplomatic breakthrough with Iran faded.
Pricier oil feeds into inflation, and traders have been adding to bets that the Fed will raise rates again. MSCI’s All Country World Index fell to its lowest since Sept. 18, and Nasdaq 100 futures slipped 0.3% after Monday’s tech-led selloff on Wall Street.
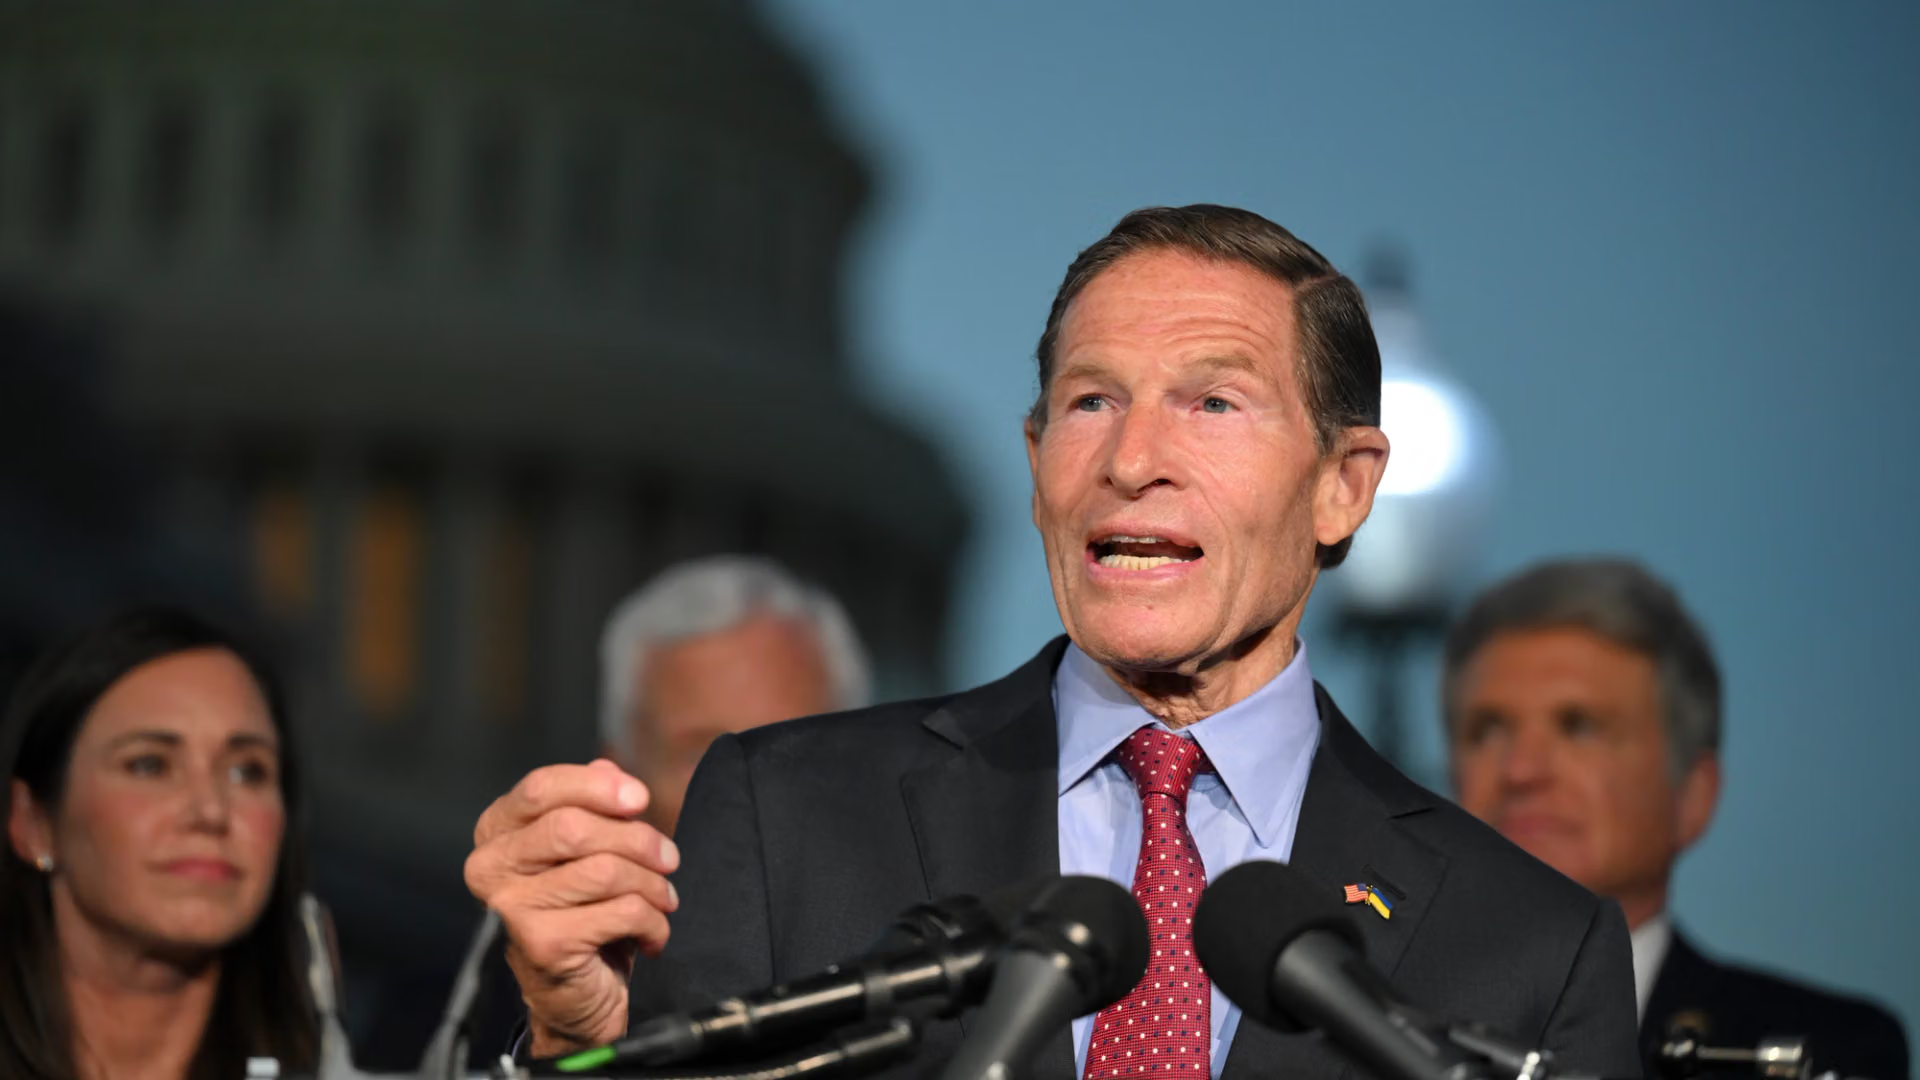
U.S. dollar-pegged stablecoin Tether is a go-to tool for the Iranian government to bypass sanctions, a new report from a group of Senate Democrats said.
Democrats on the Senate’s Homeland Security and Governmental Affairs Committee’s Permanent Subcommittee on Intelligence published a report Monday laying out the argument that Tether plays a key role in allowing Iran to conduct transactions that skirt international sanctions.
“Iran’s cryptocurrency-based shadow banking network has processed significant volumes of funds and implicates various Iranian interests,” the report said, adding that Tether has “repeatedly failed” to block Iran-connected wallets.
“USDT has become a significant financial lifeline within Iran’s shadow banking network,” the report said.
When Tether does freeze wallets, it sometimes takes weeks, but the company also sometimes responds to requests without actually blacklisting wallets, the report claimed.
“Prior to 2024, Tether did not comprehensively and consistently freeze wallets designated by counter-terrorism agencies and continues to fail to proactively block clearly illicit wallets,” the report said. “This absence of deterrence invited abuse: terrorist organizations such as Hamas shifted from transacting in Bitcoin and a mix of cryptocurrencies to promoting USDT.”

October Skies Will Put On a Show: Here’s When to Look Up

Bangkok floods threaten to shave 0.3 percentage points from Thailand’s 2026 growth

Festival camping: sorting your hair, skin and sun without a bathroom


-

 Fashion4 days ago
Weekend Open Thread: J.McLaughlin – Corporette.com
-
 Crypto7 days ago
Goldman Sachs and Deutsche Bank Agree: The S&P 500 Rally Isn't Over
-

 Tech & AI2 days ago
Anthropic turns Claude into an AI marketplace with 2,000+ plugins and connectors
-

 Tech & AI2 days ago
OpenAI is preparing “o,” an always-on ChatGPT assistant that could handle email
-

 Fashion5 days ago
8 iPhone Accessories That Add Personality
-

 Entertainment6 days ago
These 17 Fall Amazon Dresses Seriously Look Like Anthropologie
-
 Tech & AI7 days ago
Reolink’s solar 4K security camera falls to its lowest price in months
-

 Crypto6 days ago
This Bearish Netflix Stock Trade Can Cash In On Video Streaming Giant’s Woes
-

 Crypto6 days ago
BitGo says Bitcoin absorbed Fed hike, CLARITY failure
-

 Crypto6 days ago
Crude Oil Prices Pressured by Diplomatic Hopes in the Middle East
-
 Crypto6 days ago
Bitcoin price tests $83,600 Supertrend support after $87K rejection
-
 Business & Hussles6 days ago
Oil Price Today (September 23): Crude oil below $100 on hopes of US-Iran talks. What did Trump say?
-
 Crypto6 days ago
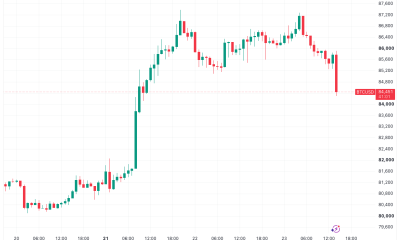
Bitcoin Threatens Sub-$84,000 Breakdown as Long Liquidations Spike
-
 Crypto7 days ago
Did Jim Cramer Just Give GameStop Stock the Kiss of Death When He Said the Turnaround Is Working?
-
 Tech & AI6 days ago
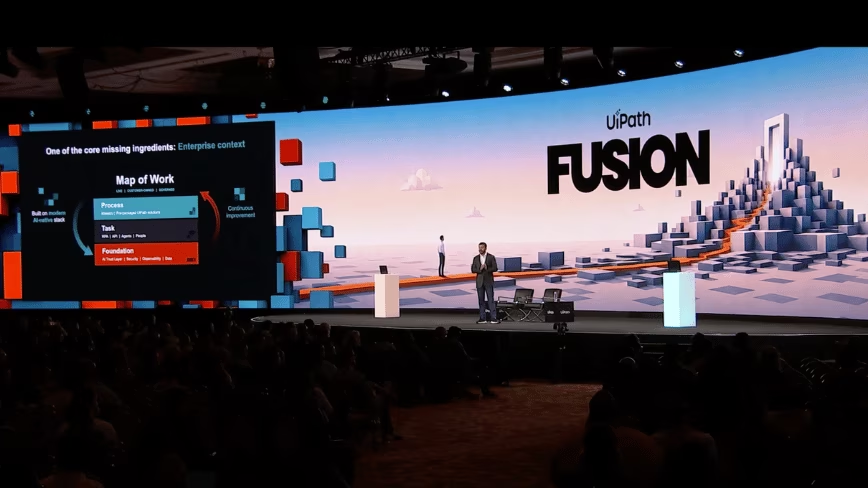
UiPath’s Dines says AI needs a manual and launches Cartographer to write it
-
Business & Hussles15 hours ago
Perpetua Resources at Mining Forum Americas 2026: shift to construction
-

 Crypto6 days ago
As Amazon Stock Prospers, Traders Might Consider This Option Play
-

 Crypto6 days ago
Strategy resumed Bitcoin buying, but Strive gained more BTC per share
-

 Tech & AI7 days ago
Sega nearly killed Sonic before the movies revived the franchise
-
 Crypto2 days ago
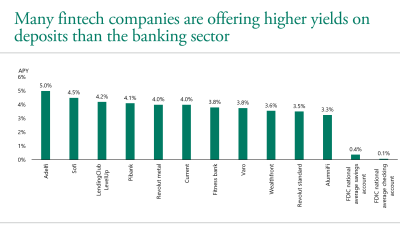
Wall Street Giant Warns AI Agents Could Trigger a New Kind of Bank Run
You must be logged in to post a comment Login