
Crypto World
3 Altcoins That Are Not in a Bear Market and Could Rally
The crypto bear market seems to be taking form. Bitcoin and Ethereum remain under pressure, with Bitcoin down nearly 24% year-to-date and about 22% year-on-year, while Ethereum has fallen roughly 34% YTD and over 30% across the same period. The broader market continues to reflect weak sentiment.
Yet, BeInCrypto analysts have identified three altcoins that are still posting strong gains in the year-to-date and year-over-year periods, signaling demand and technical structures that appear disconnected from the ongoing bear market.
Bitcoin Cash (BCH)
The crypto bear market has not stopped Bitcoin Cash (BCH) from showing unusual strength. While many altcoins struggle, BCH remains one of the strongest altcoins, holding large yearly gains. Bitcoin Cash is still up nearly 80% year-on-year, showing that demand has stayed intact even as the broader crypto bear market continues.
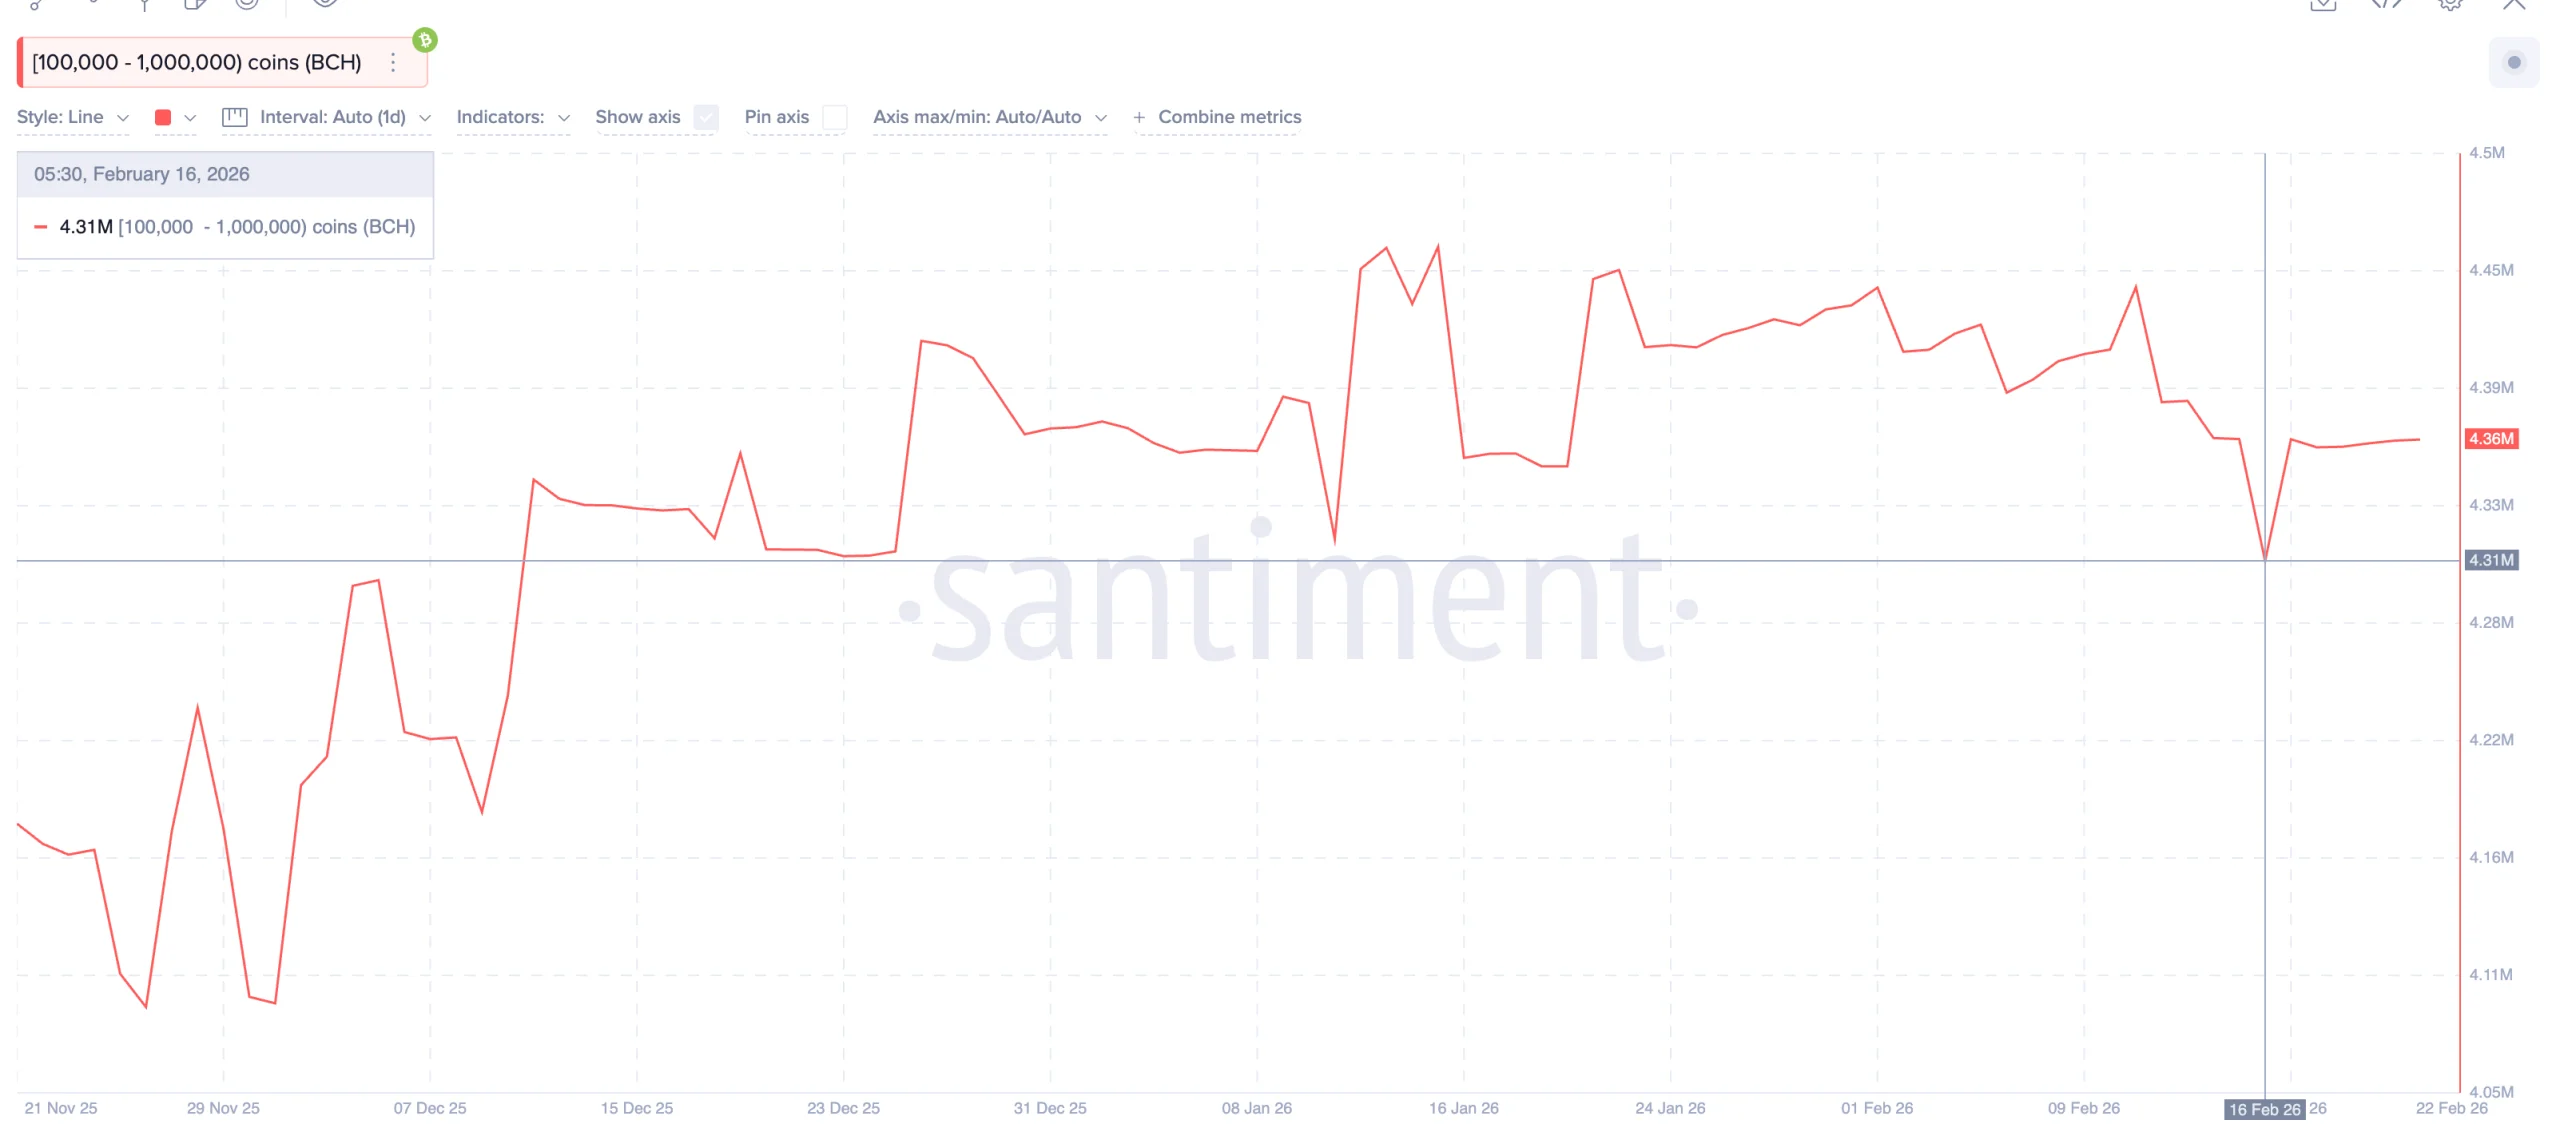
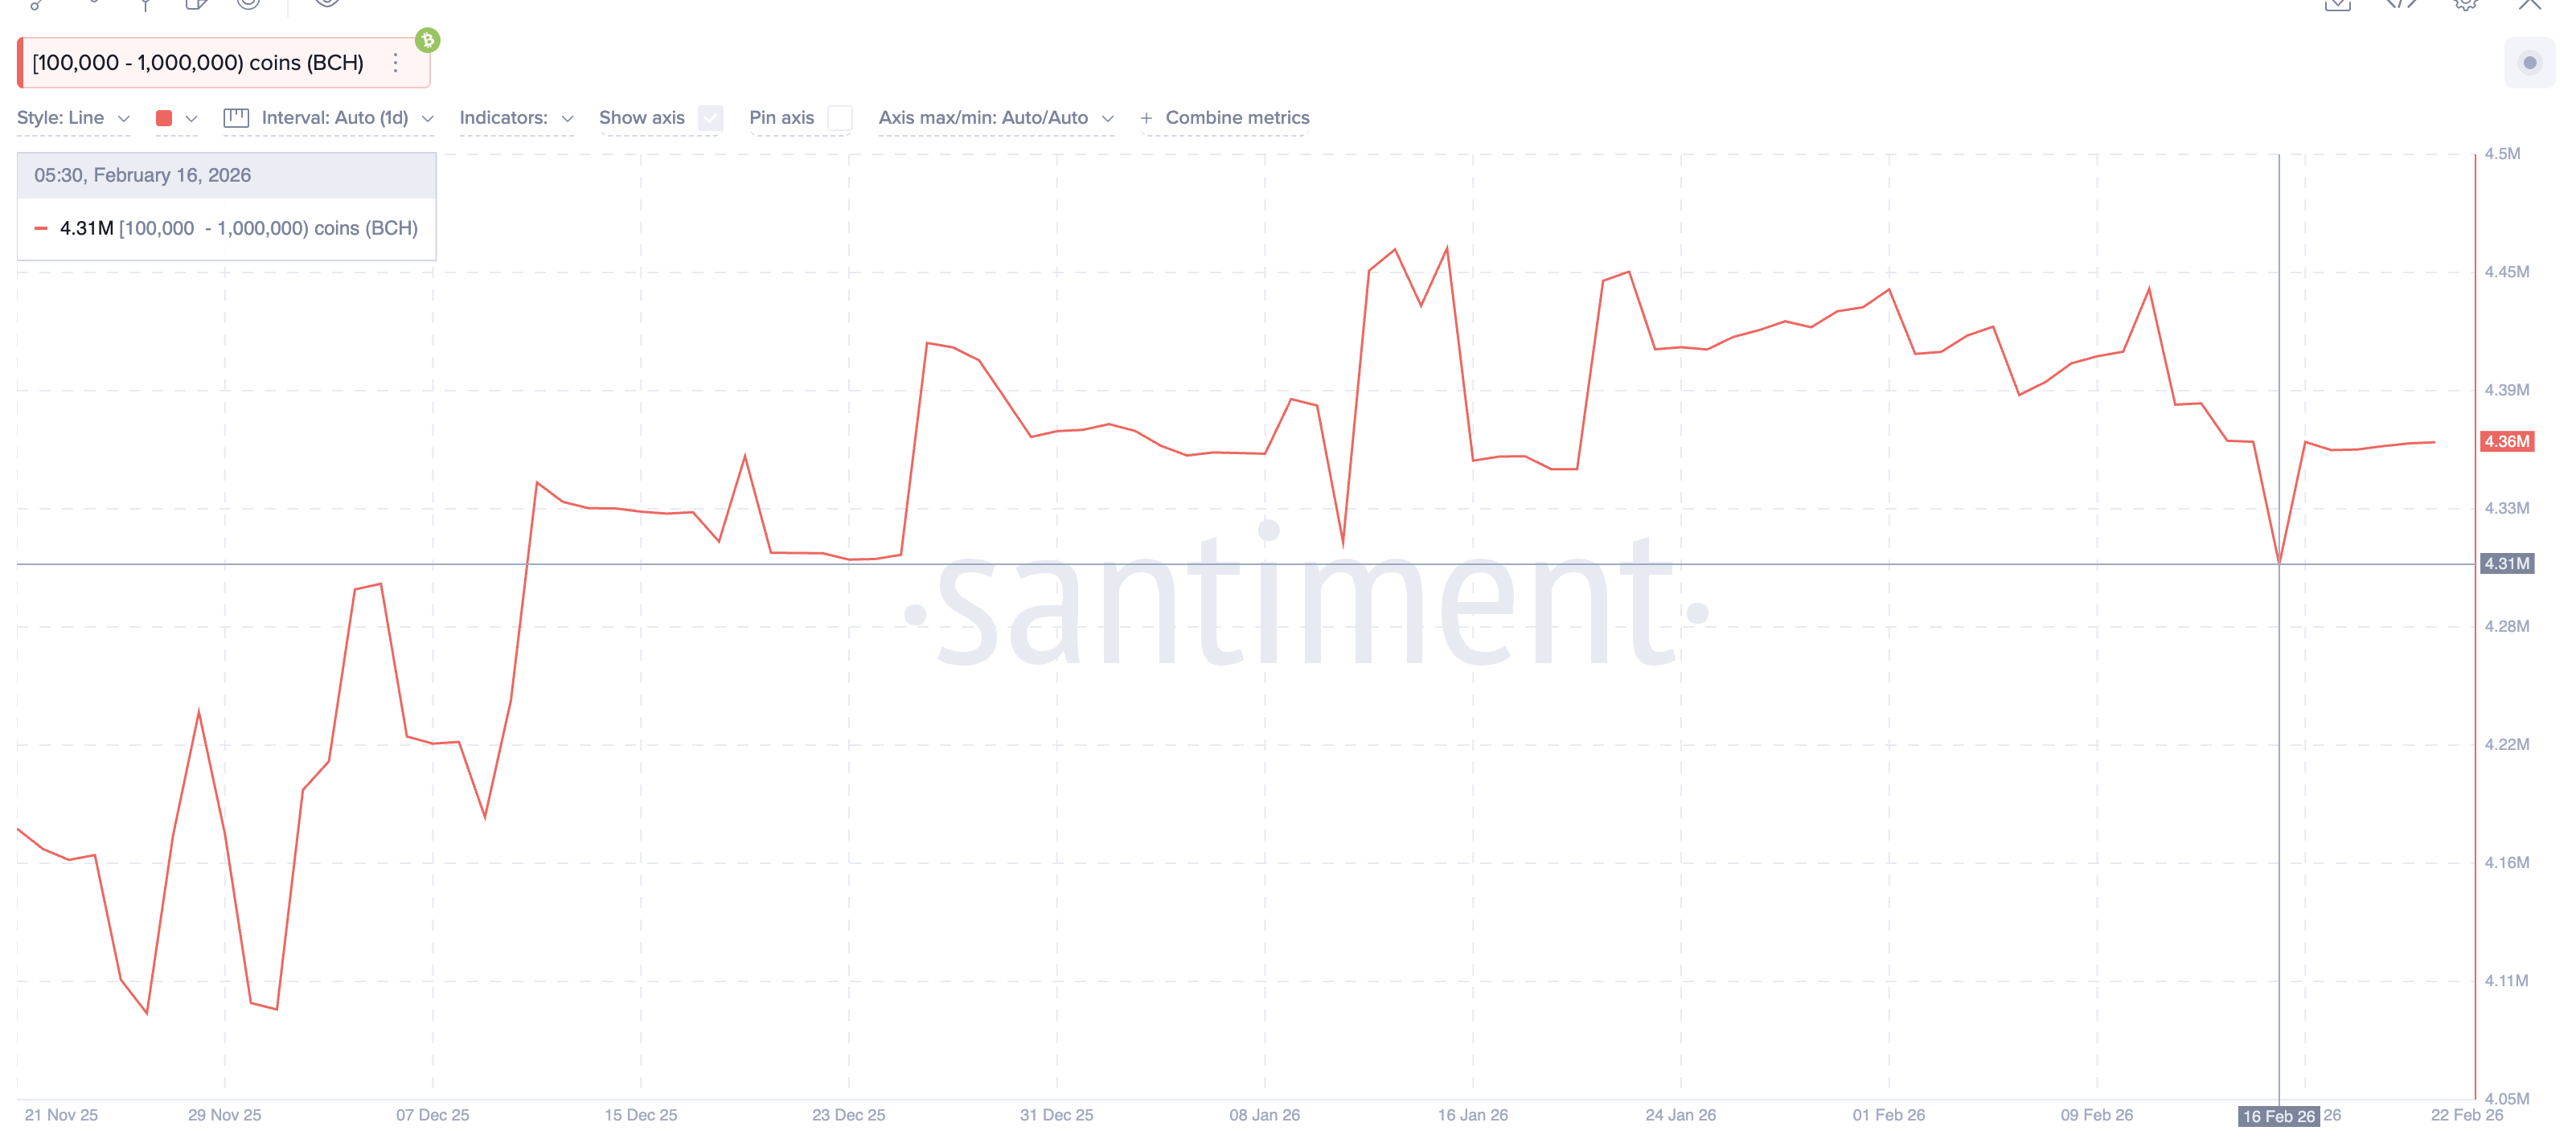
This strength is now clearly visible in whale behavior. The largest Bitcoin Cash holders, wallets holding between 100,000 and 1 million BCH, increased their holdings from 4.31 million BCH on February 16 to 4.36 million BCH recently.
This means whales added 50,000 BCH, worth about $28.5 million at the current price. Whale accumulation during a crypto bear market often signals confidence, as these investors typically buy when they expect higher prices ahead.
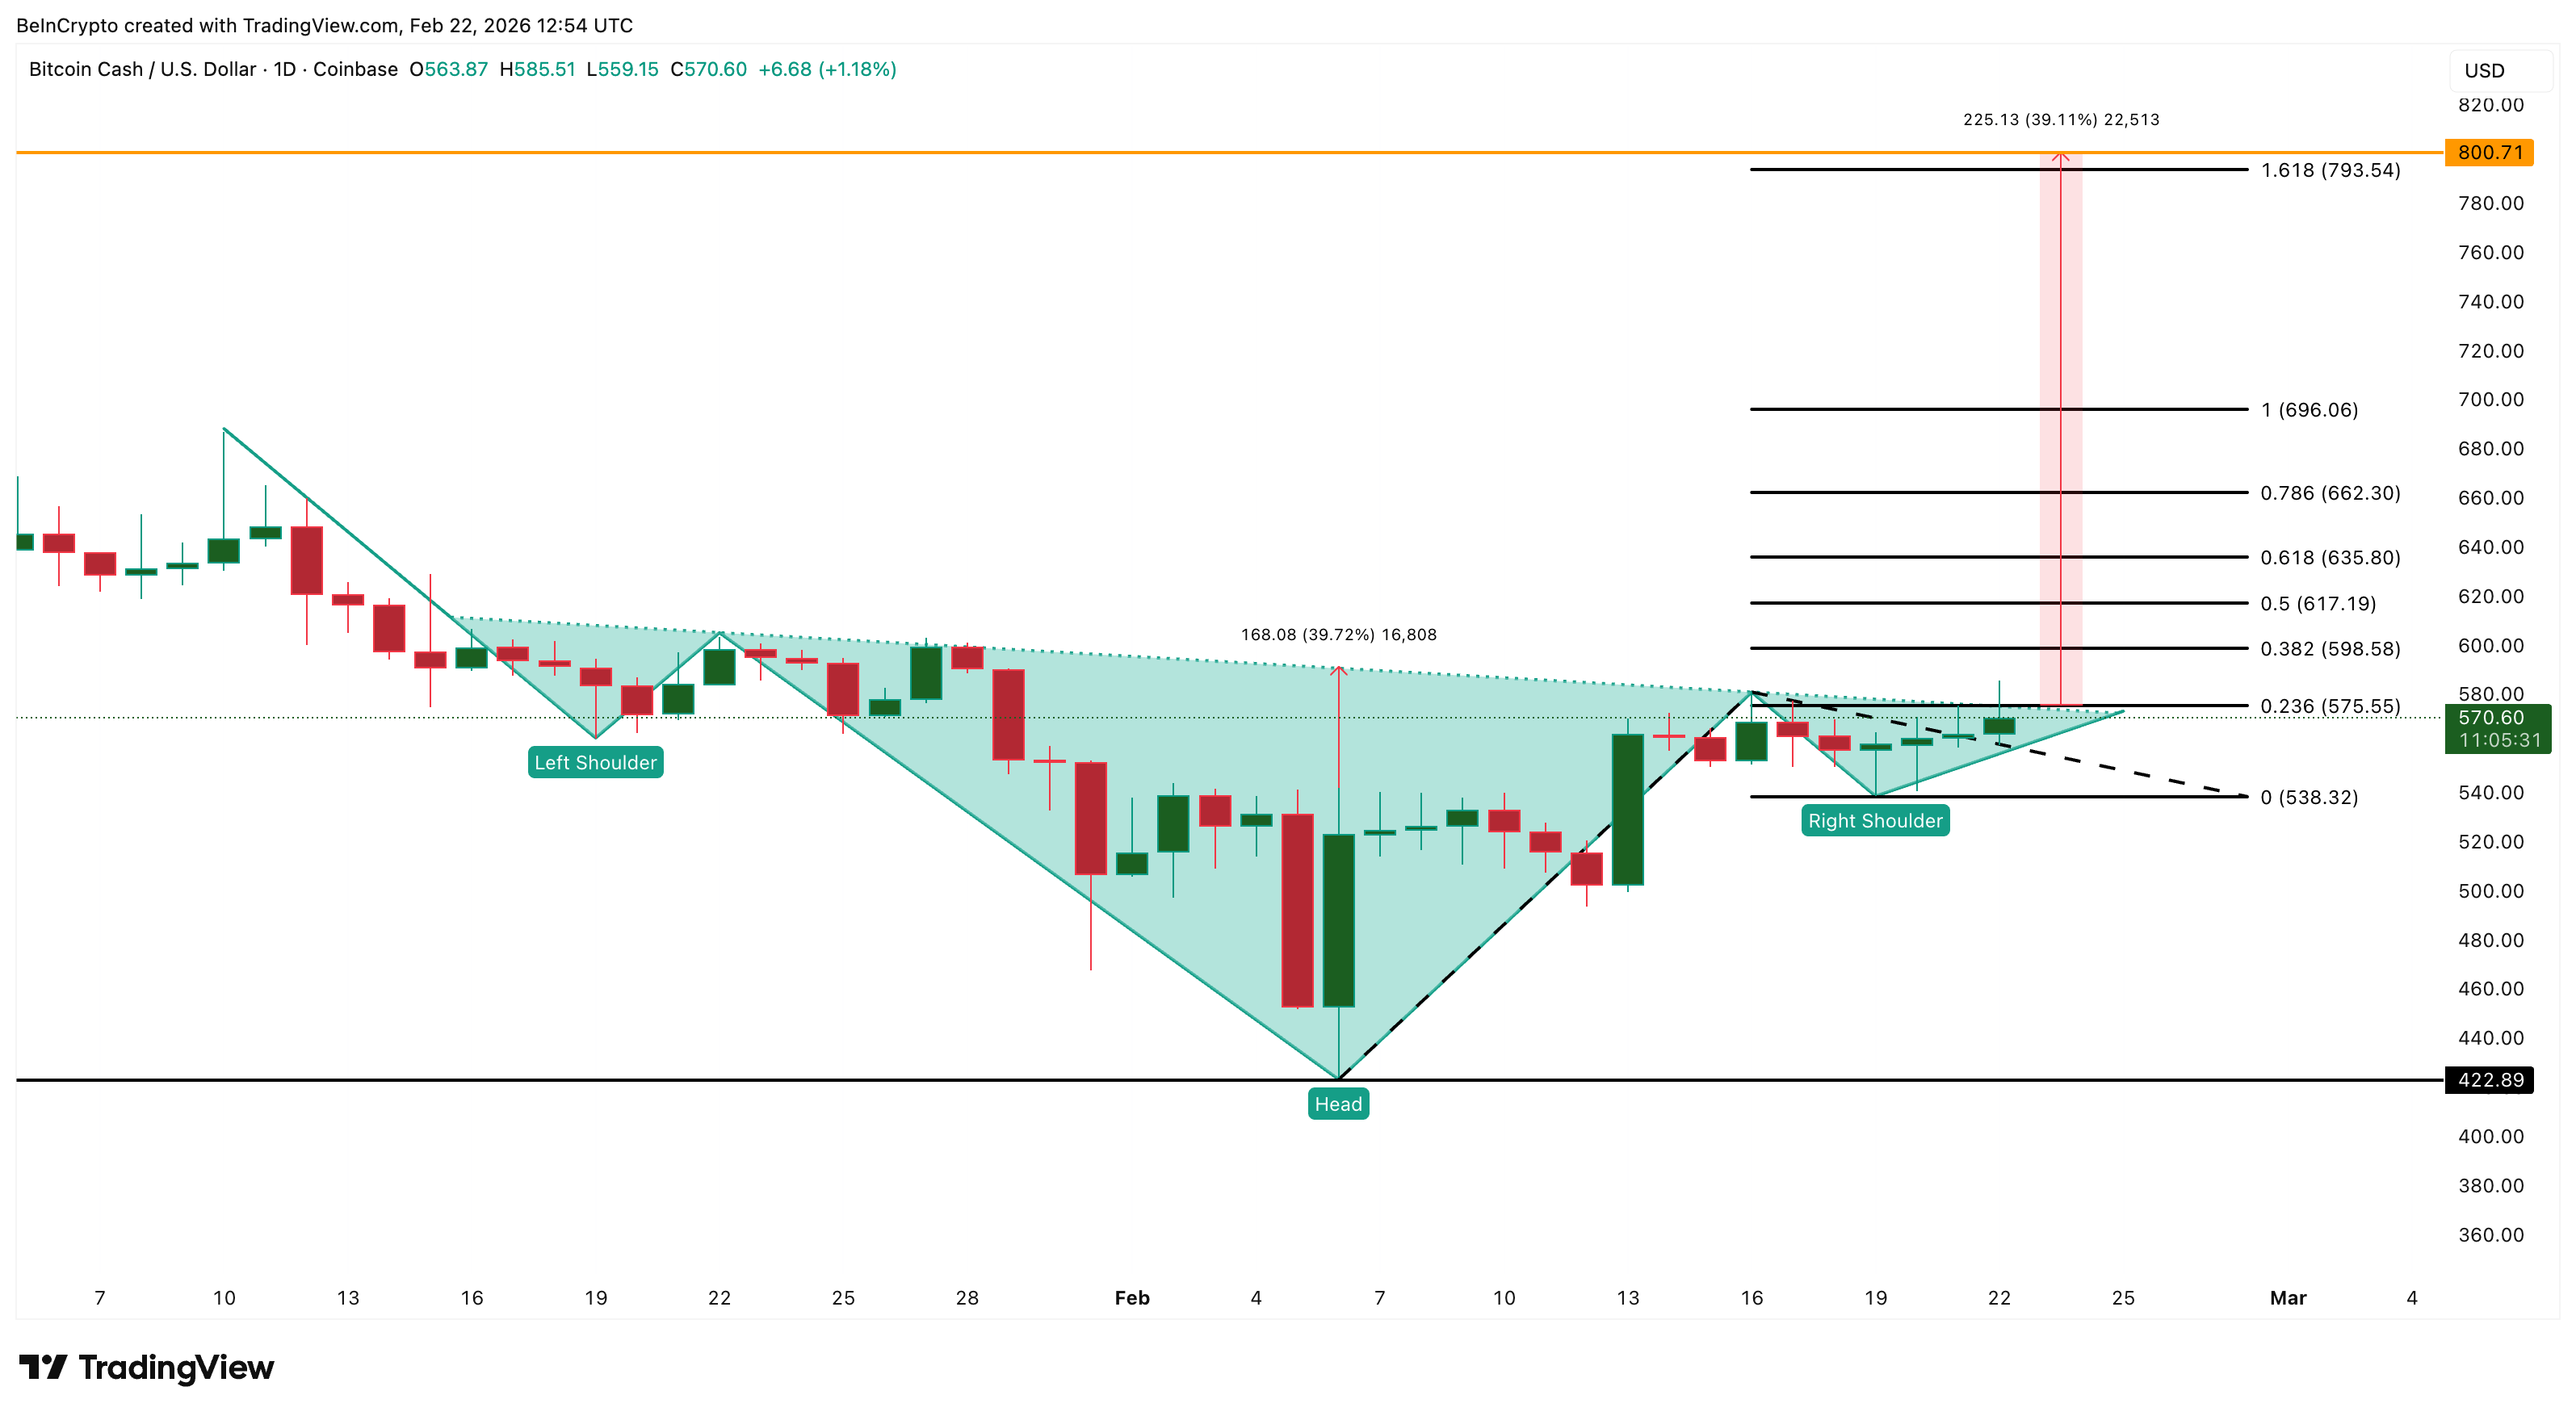
This optimism connects directly with Bitcoin Cash’s price chart. BCH is currently forming an inverse head-and-shoulders pattern, a bullish pattern that often precedes a breakout.
This pattern shows that selling pressure is fading and buyers are slowly gaining control. BCH attempted a breakout near $575 but faced some selling pressure. However, continued whale buying suggests this resistance may weaken over time.
A confirmed breakout requires a daily close above $575. If that happens, BCH could rally toward $793 and potentially $800, completing the pattern’s nearly 40% upside target. These levels also align with Fibonacci resistance zones, strengthening the bullish case.
However, risks still exist. The bullish structure weakens if BCH falls below $538, because that would show buyers losing control. Full invalidation happens only if the BCH price drops under $422, which would break the entire pattern.
For now, Bitcoin Cash stands out as one of the rare altcoins defying the bear market, supported by both whale accumulation and a bullish technical structure.
Morpho (MORPHO)
Among the altcoins defying the bear market, Morpho stands out because of its strong fundamentals and bullish price structure.
Morpho is the governance token of a decentralized lending platform that allows users to lend and borrow crypto more efficiently. Its infrastructure, called Morpho Blue, improves capital efficiency by directly matching lenders and borrowers, offering better yields and lower borrowing costs.
This strong foundation is now attracting institutional attention. On February 13, 2026, Apollo Global Management, which oversees nearly $940 billion in assets, committed to acquiring up to 90 million MORPHO tokens, or about 9% of the total supply, over time. This creates steady buying pressure and validates Morpho’s role in institutional decentralized finance.
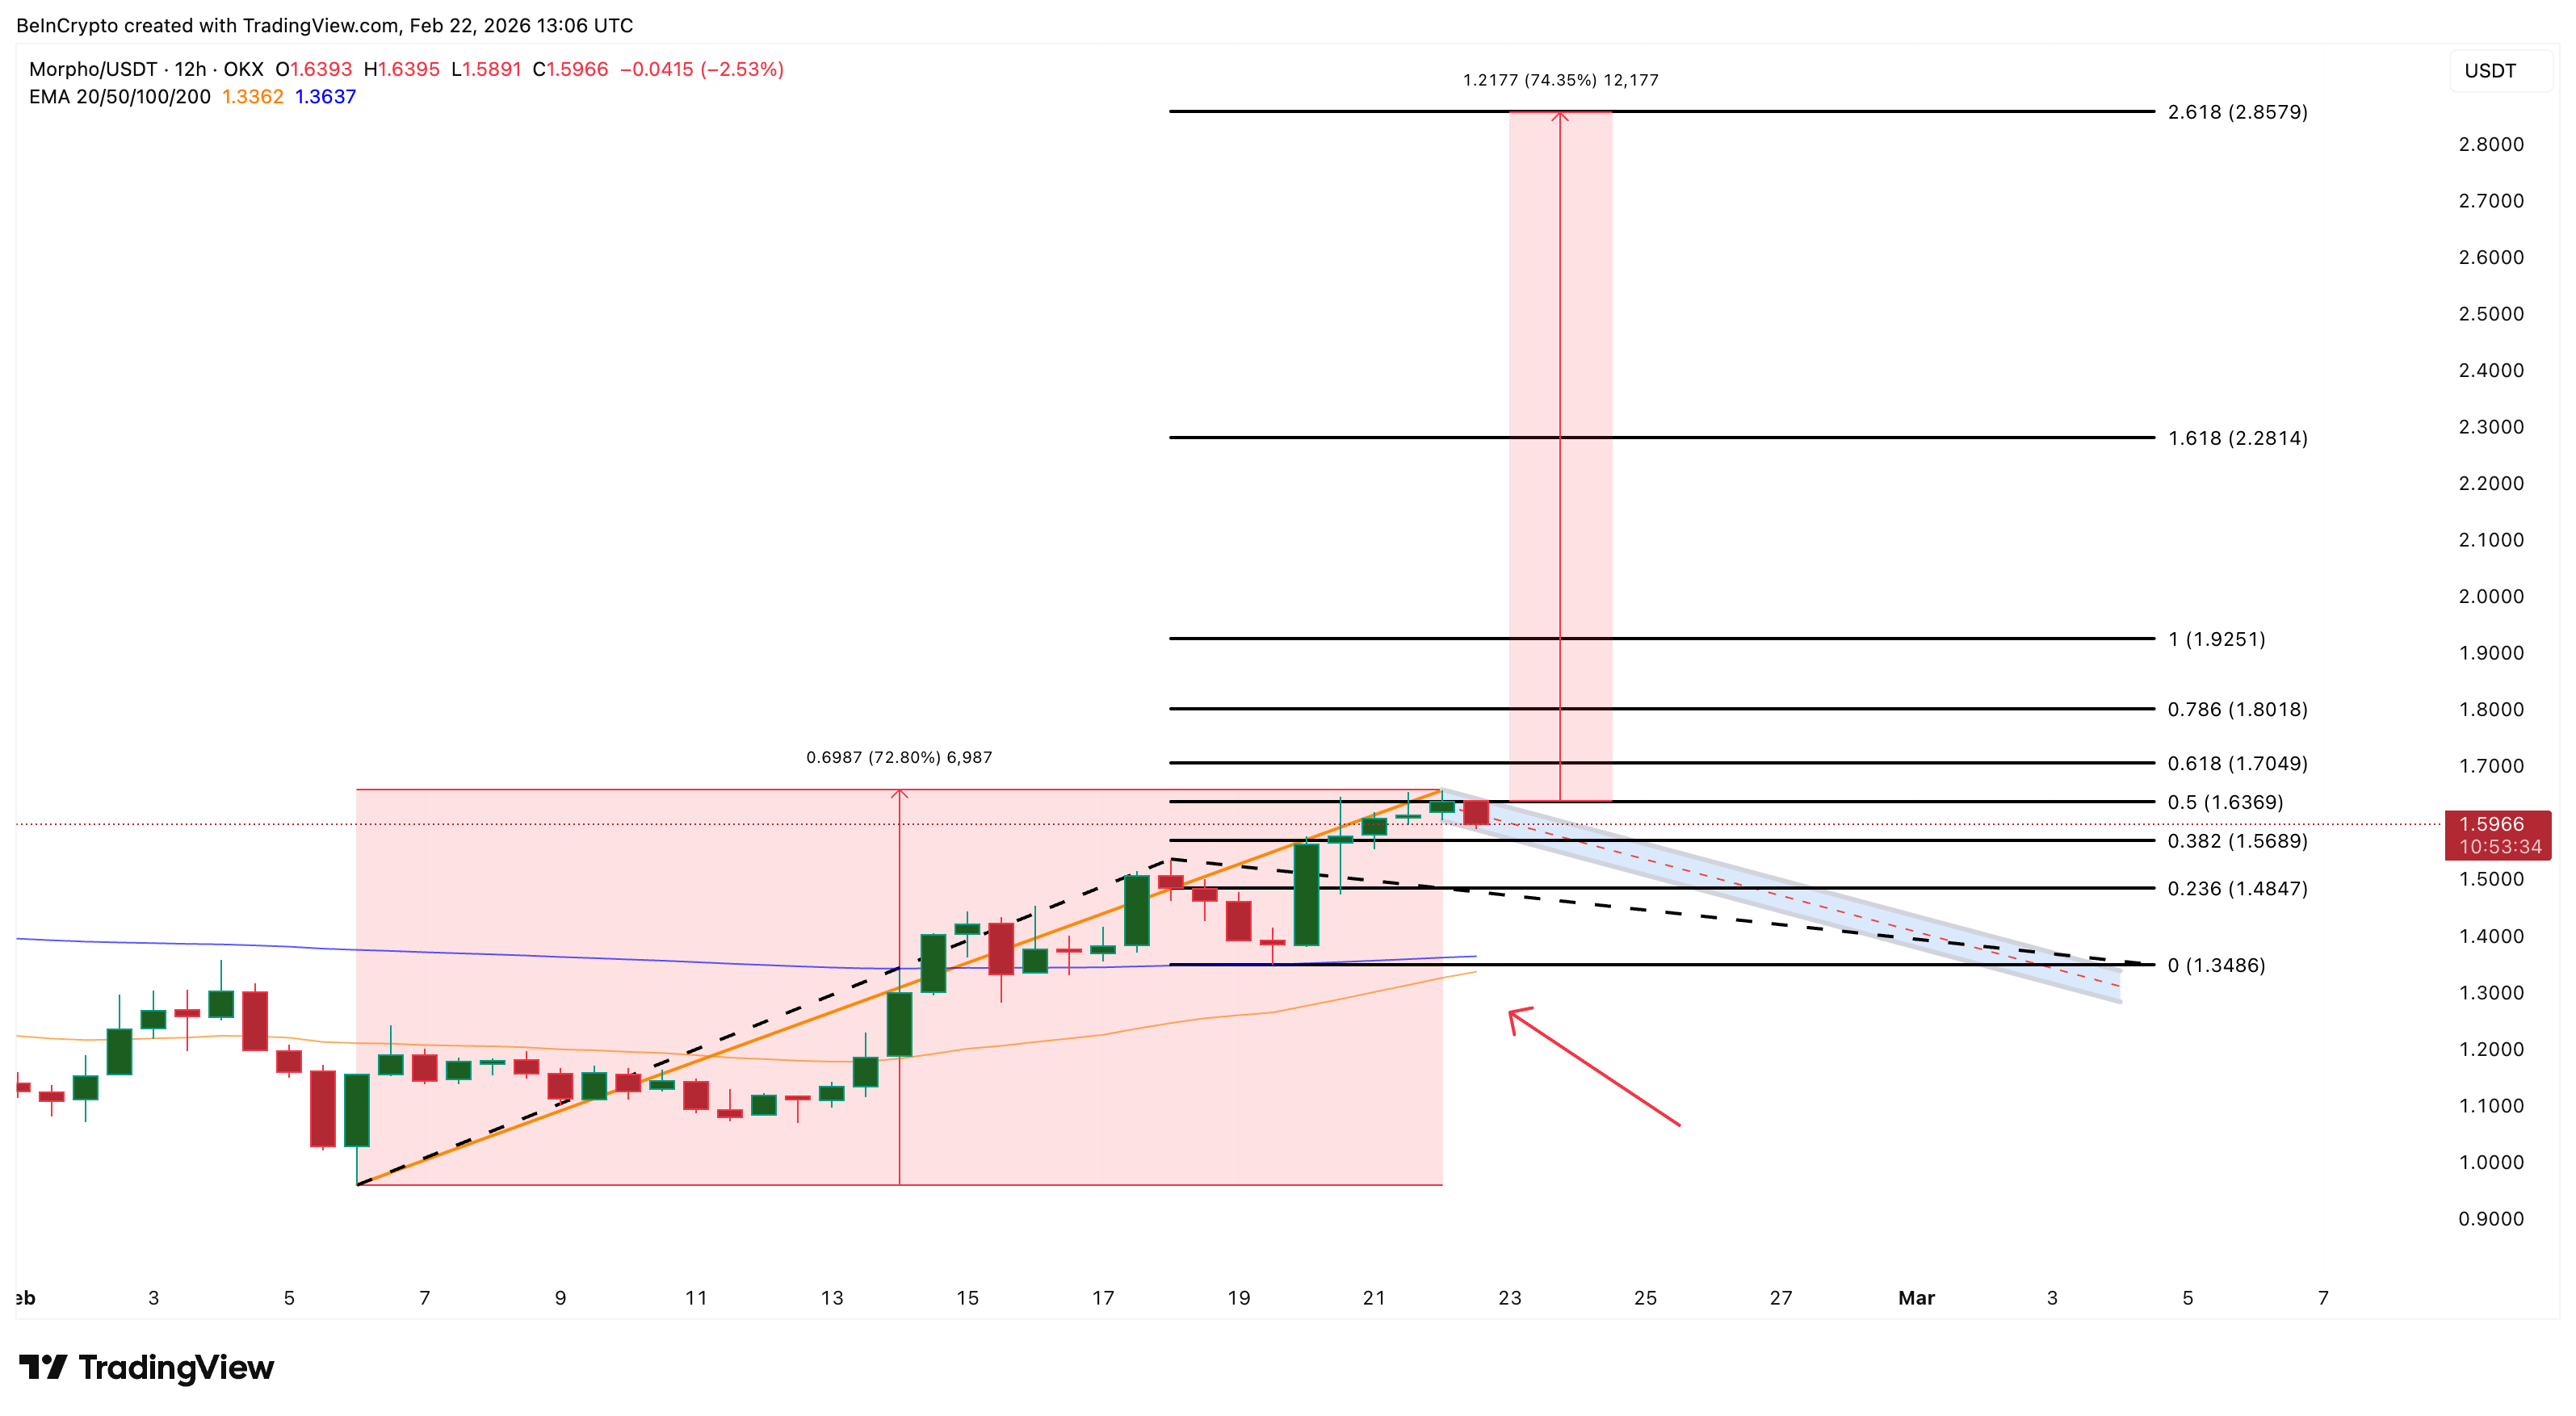
This fundamental optimism is also visible on the price chart. Since February 6, MORPHO has already rallied more than 72%, forming the pole of a classic bullish continuation pattern called a pole-and-flag.
The current consolidation could form the flag, which is a normal pause before another potential move higher.
At the same time, a golden crossover is approaching. This happens when the 50-period Exponential Moving Average (EMA), which tracks the medium-term price trend, moves above the 200-period EMA, which tracks the long-term trend. This signal often confirms the start of a sustained uptrend.
Want more token insights like this? Sign up for Editor Harsh Notariya’s Daily Crypto Newsletter here.
For now, MORPHO remains strong as long as the consolidation range holds above $1.48. However, the structure weakens below $1.34, where the 200-period EMA sits.
However, a confirmed breakout above $1.63 could trigger another 72% rally toward $2.85, reinforcing Morpho’s position among altcoins defying weakness during the crypto bear market.
Decred (DCR)
After Bitcoin Cash and Morpho, Decred has emerged as another altcoin quietly showing unusual strength. The token is up 93% year-on-year and 61% year-to-date, making it the strongest performer in this group of strong altcoins. Even in the past 24 hours, Decred has gained nearly 10%, highlighting persistent demand.
Part of this strength comes from its recent treasury upgrade, which improved how the network funds its own growth and reinforced long-term investor confidence.
However, the chart structure explains why this strength may not be over yet.
Decred is currently trading inside an ascending channel. It is a bullish structure in which the price moves between two rising parallel trendlines.
This pattern usually signals steady accumulation and controlled upward momentum. At the same time, a cup pattern is forming within this channel, creating what appears to be two bullish patterns folded into one structure.
This dual formation significantly strengthens the outlook. Based on the channel and cup projection, Decred could see nearly 37% upside. One major target sits near $39.76, while the extended target aligns near $45.33 if momentum continues.
In the short term, the structure remains healthy as long as Decred holds above $23.66. This level acts as the lower support inside the channel.
A move above $28.79 would signal growing strength and increase the chances of a breakout toward $32.98. It is a key zone that aligns with the channel’s upper trendline. Once this level breaks, the larger upside projection becomes more likely.
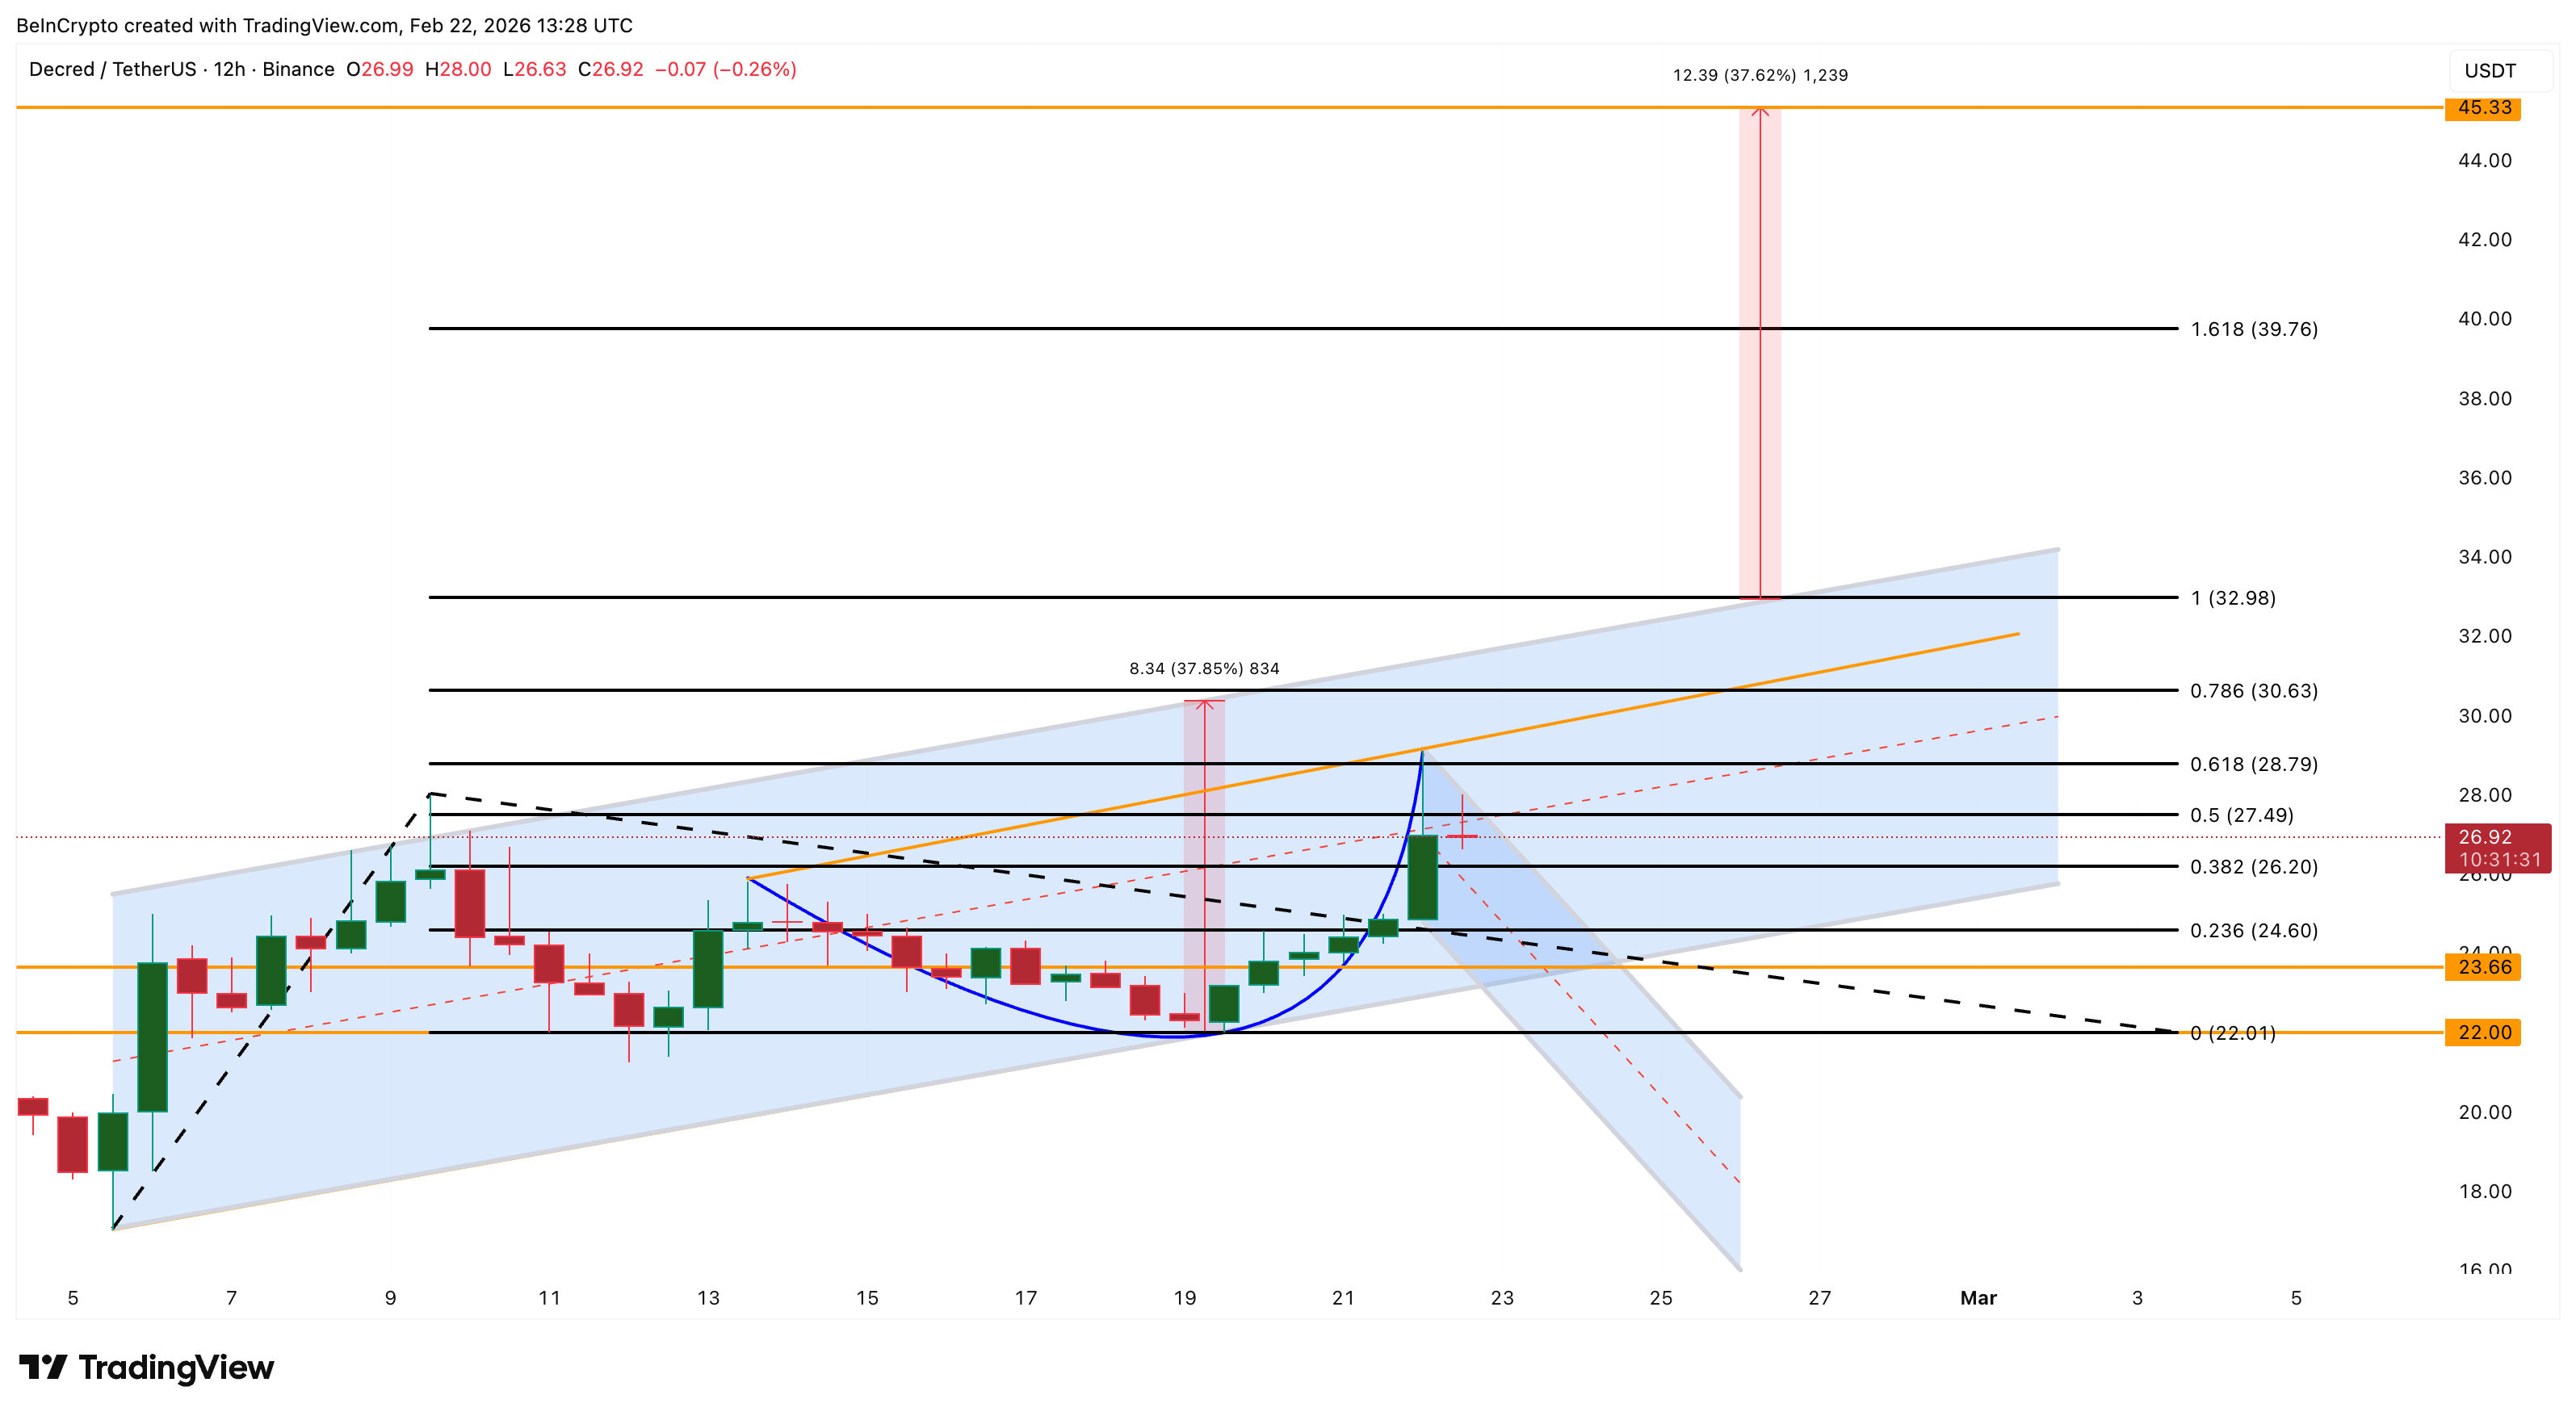
However, a drop below $22.01 would weaken the pattern and shift the structure from bullish to neutral. For now, Decred’s rare combination of strong performance and a layered bullish chart setup shows why it continues to stand out amid most altcoins’ struggles.

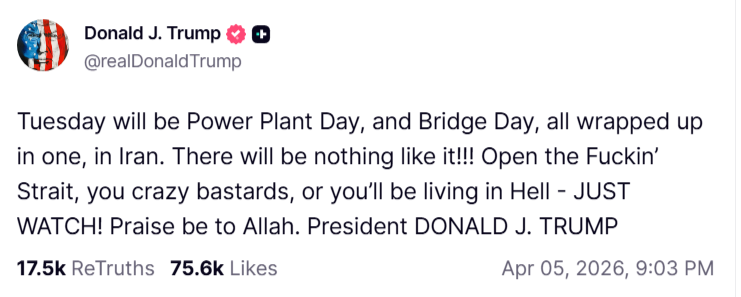
Oil prices extended gains in early Asian trading on Monday as President Donald Trump sharply escalated threats against Iran. He vowed to strike power plants and bridges unless Tehran reopens the Strait of Hormuz by Tuesday.
The latest ultimatum signals that the six-week-old conflict is entering a more dangerous phase with no diplomatic off-ramp in sight.
Trump’s Ultimatum: ‘Power Plant Day, and Bridge Day’
In a social media post, Trump declared Tuesday would be “Power Plant Day, and Bridge Day” and demanded Iran “open the f—ing Strait,” warning Tehran would “be living in Hell.” The unprecedented language signals Washington’s growing frustration with stalled diplomacy over the critical waterway.
Brent crude climbed above $111 a barrel, up 1.9%, while West Texas Intermediate traded near $112 during the Asian morning session. Tehran rejected the demands, and the Strait of Hormuz remains closed to most shipping traffic. The war has triggered a supply shock now threatening to become a full-blown global energy crisis.
Rising oil and fuel prices are stoking inflation, slowing economic growth, and squeezing businesses and consumers worldwide. US gasoline pump prices have risen by roughly $1 per gallon since the conflict began. Analysts expect the March consumer price data on Friday to show the sharpest monthly increase since 2022.
OPEC+ members approved a modest 206,000 barrel-per-day output increase for May after a weekend meeting. However, the move was largely symbolic, as key producers cannot increase output due to the war. Russian supply has also been disrupted by Ukrainian drone strikes on its Baltic Sea export terminal.
Market stress indicators are flashing red. Brent’s prompt spread widened beyond $10 a barrel in backwardation. That gap exceeds peaks seen during Russia’s 2022 invasion of Ukraine. Physical market prices tell an even starker story. Dated Brent surged past $140, reaching levels not seen since 2008.
Diplomacy Stalls as Attacks Continue
Iran has officially told mediators it will not meet US officials in Islamabad, and ceasefire efforts have stalled. Tehran has allowed limited passage through the Strait of Hormuz for select vessels from countries it deems friendly. Iraq received an exemption from Iran’s shipping curbs, though carriers remain cautious about entering the strait. Oman said it discussed options with Tehran to restore shipping flows.
Global buyers are now aggressively bidding for alternative crude supplies from the US Gulf Coast and the North Sea. Israeli strikes continued across Iran over the weekend, while Tehran hit Kuwait Petroleum Corp. headquarters and shut down an Emirati petrochemicals plant.
Asian equity markets opened cautiously. Japan’s Nikkei rose 0.7% and South Korean shares gained 2%. Gold fell about 1% to around $4,630 as surging energy costs undermined expectations of interest rate cuts.
The post Trump’s Hormuz Ultimatum Sends Oil Past $110, Highest Since March appeared first on BeInCrypto.

The Drift Protocol, a Solana-based decentralized finance platform, is drawing renewed scrutiny after a $280 million exploit exposed persistent gaps in its security posture. A post-incident review and commentary from legal counsel frame the breach as something that could have been prevented with basic operational security measures, prompting discussions about civil negligence and the broader risk landscape facing DeFi projects.
Attorney Ariel Givner described the scenario as a failure to safeguard user funds, saying, “In plain terms, civil negligence means they failed their basic duty to protect the money they were managing.” Her assessment followed Drift’s post-mortem detailing how the attack unfolded and how the platform responded. The comments come as critics question the adequacy of Drift’s procedures in a space where attackers frequently rely on social engineering and supply-chain compromises to breach multi-signature setups and other critical controls.
“Every serious project knows this. Drift didn’t follow it,” she said, adding, “They knew crypto is full of hackers, especially North Korean state teams.” Givner continued, “Yet their team spent months chatting on Telegram, meeting strangers at conferences, opening sketchy code repos, and downloading fake apps on devices tied to multisignature controls.”
The debate underscores a larger concern: social engineering and project infiltration remain among the most effective attack vectors in crypto, capable of draining user funds and eroding trust in platforms that users otherwise rely on for high-stakes liquidity and yield opportunities.
Key takeaways
- Drift Protocol is facing scrutiny over basic security practices after a $280 million exploit, with legal perspectives labeling the incident as civil negligence in light of alleged operational shortfalls.
- Experts point to missteps such as storing signing keys on non-air-gapped systems and insufficient vendor and developer due diligence, particularly with personnel encountered at conferences.
- The attackers’ approach reportedly involved months of planning, culminating in targeted social engineering and malware introduced through developer machines.
- There are signals of a possible link to North Korea–aligned threat actors, with Drift stating a “medium-high confidence” that the same group behind the Radiant Capital hack (October 2024) was involved.
- Radiant Capital’s 2024 incident has become part of the narrative tying industry-wide risks to well-known escalation patterns in state-sponsored cyber operations.
Attack narrative and defensive lessons
Drift Protocol published an update detailing how the breach unfolded, asserting that the assault was the product of six months of planning. The attackers reportedly approached Drift at a major crypto industry conference in October 2025, signaling interest in potential integrations and partnerships. Over the following months, the bad actors cultivated relationships with Drift developers, ultimately delivering malicious links and embedding malware that compromised the developers’ machines used to manage the protocol’s multisignature controls.
Drift’s account emphasizes that those involved were not North Korean nationals, though the firm conceded that the threat actors were linked to a broader pattern associated with state-backed cyber campaigns. In a contemporaneous assessment with “medium-high confidence,” Drift tied the incident to actors believed to have previously orchestrated the October 2024 Radiant Capital hack. Radiant Capital had disclosed that its breach involved malware spread via Telegram from an operator posing as an ex-contractor connected to North Korea. While Drift’s update stops short of confirming a direct line of responsibility, these correlations highlight a persistent threat environment in which sophisticated adversaries leverage social channels to compromise engineering workflows.
Legal and security observers highlight a recurring theme: even mature crypto teams can underestimate the risk of supply-chain and social-engineering exploits if governance practices do not enforce strict separation between development activities and sensitive credentials. Givner’s critique goes beyond the specifics of Drift’s incident, pointing to a universal expectation that “air-gapped” signing keys should be kept separate from day-to-day developer work, and that engaging with third-party developers or contractors requires rigorous vetting and ongoing due diligence. In her words, many projects already adhere to these principles because the crypto landscape is “full of hackers,” and a lapse can be costly both financially and reputationally.
Industry context: echoes of a broader security paradigm
The Drift incident arrives as a broader discussion unfolds about how DeFi projects manage risk in a period of heightened adversarial activity. Social engineering, phishing, and malware campaigns targeting developer ecosystems have been repeatedly implicated in high-profile hacks. The Radiant Capital case from late 2024, which involved a North Korea–linked operator impersonating an ex-contractor to disseminate malware, is frequently cited in security analyses as a cautionary tale about the limits of conventional defensive measures when human factors become the weakest link.
Industry observers note that the Drift episode reinforces the need for robust governance frameworks around key management, formal vendor assessment processes, and stringent controls on how and where signing keys are stored and used. If the attackers exploited trusted relationships with developers and relied on compromised devices to gain access to multisignature controls, the path to remediation likely involves reinforcing air gaps, implementing hardware security modules for key management, and institutionalizing continuous monitoring and key rotation practices. The emphasis on “due diligence” also raises questions about how conferences, hackathons, and third-party collaborations are vetted, and whether drift toward more rigorous third-party risk management will become standard practice across the sector.
What this means for investors and builders
For investors, the Drift incident is a reminder that risk management remains a primary driver of platform credibility and capital allocation in DeFi. Projects that can demonstrate resilient onboarding, robust key management, and rigorous vendor scrutiny may distinguish themselves in a market where security shocks can quickly alter perceptions of value and reliability. Builders, in turn, face a delicate trade-off between openness and security. While collaboration and rapid integration are hallmarks of DeFi innovation, the Drift episode suggests that even well-resourced teams must normalize security drills, red-teaming, and clear separation of duties to prevent supply-chain breaches from translating into user losses.
As regulators and industry groups debate standardized best practices, Drift’s experience could accelerate conversations about mandatory security benchmarks for on-chain protocols, particularly those relying on multi-party computation and multisignature frameworks. In the meantime, users should monitor how Drift and similar platforms respond—through security upgrades, partner vetting, and transparent post-incident reporting—as a practical barometer for the sector’s willingness to translate rhetoric about security into measurable safeguards.
Meanwhile, Drift has not publicly detailed its next steps beyond the immediate remediation measures described in its update. The extent to which the platform will overhaul its governance, vendor risk management, and incident response cadence remains to be seen, as does the broader industry adoption of stricter security controls that could alter how quickly and fluidly DeFi protocols can operate with external partners.
What remains uncertain is how quickly the market will react to these revelations and whether Trust signals built on vulnerability disclosure will translate into a longer-term commitment by users to platforms that publicly address security gaps. For now, the incident underscores a recurring lesson: in DeFi, the difference between resilience and ruin often hinges on the discipline with which teams implement and enforce fundamental security practices—before a breach, not after.
As the investigation and remediation continue, market watchers will be paying close attention to Drift’s communications, the evolution of industry security standards, and any subsequent movements by competitors to raise the bar for securing developer environments and signing-key management. The path forward for the sector will be shaped by whether this incident catalyzes meaningful adoption of stronger controls and more rigorous third-party risk governance across the ecosystem.
The Ethereum Foundation just staked $93 million worth of ETH in a single day, pushing its total past 69,500 ETH and nearly hitting its 70,000 ETH target. The move shifts the Foundation from selling ETH to earning yield, cutting one of the biggest sources of sell pressure the market has faced for years.
The ethereum price prediction points to solid targets ahead, but Pepeto is the layer that helps regular traders find what big money finds before the crowd gets there. With $8.68 million raised and analysts projecting 100x, the presale shuts once the Binance listing arrives.
The Ethereum Foundation staked 45,034 ETH on April 3 in batches of 2,047 ETH each, bringing its total staked position to roughly $143 million and completing the target it set in February, per CoinDesk. The program is projected to generate $3.9 to $5.4 million in annual yield, replacing the need to sell ETH for operating costs.
The Foundation still holds over 100,000 ETH beyond the staked amount, per Arkham Intelligence. This treasury pivot removes a persistent overhang that weighed on price for years.
Reduced selling pressure lifts the outlook, but the exchange still at presale pricing and set to catch volume when capital flows on chain is where the return math shifts completely before listing.
Where the ETH Targets Meet Presale Returns Before the Final Window Closes
Pepeto
As dormant institutional capital starts moving on chain, the number of new tokens, scams, and opportunities grows faster than any single trader can track. Pepeto was built for exactly this kind of market, and every tool went live before the flood arrived.
With $8.68 million raised at $0.0000001862 and 100x projected by analysts, the case for this exchange being the top presale gets harder to argue against every day. The Binance listing will open full access to the contract scanner that flags dangers before your money moves, PepetoSwap with zero trading costs, and the cross-chain bridge at zero cost.
While institutional moves like the Foundation’s staking unlock dormant capital, Pepeto builds the layer that gives regular traders access to what that capital finds next. Staking at 188% APY grows early positions while stages fill. SolidProof cleared the full codebase, a former Binance executive shaped the tools, and the founder who took the original Pepe token to $11 billion on a 420 trillion supply built the exchange.
The returns that defined past bull runs all started with one choice made during fear, and Pepeto at $0.0000001862 is that choice sitting in front of you while the Binance listing window still holds. Once trading opens, this presale price disappears and daily utility drives consistent value rather than a spike that fades after listing week.
Ethereum Price Prediction: Can ETH Break $2,250 and Reach $3,000?
Ethereum trades near $2,034 as of April 5, sitting 58% below its $4,953 all-time high from August 2025 while the Foundation’s staking move cuts sell pressure, per CoinMarketCap.
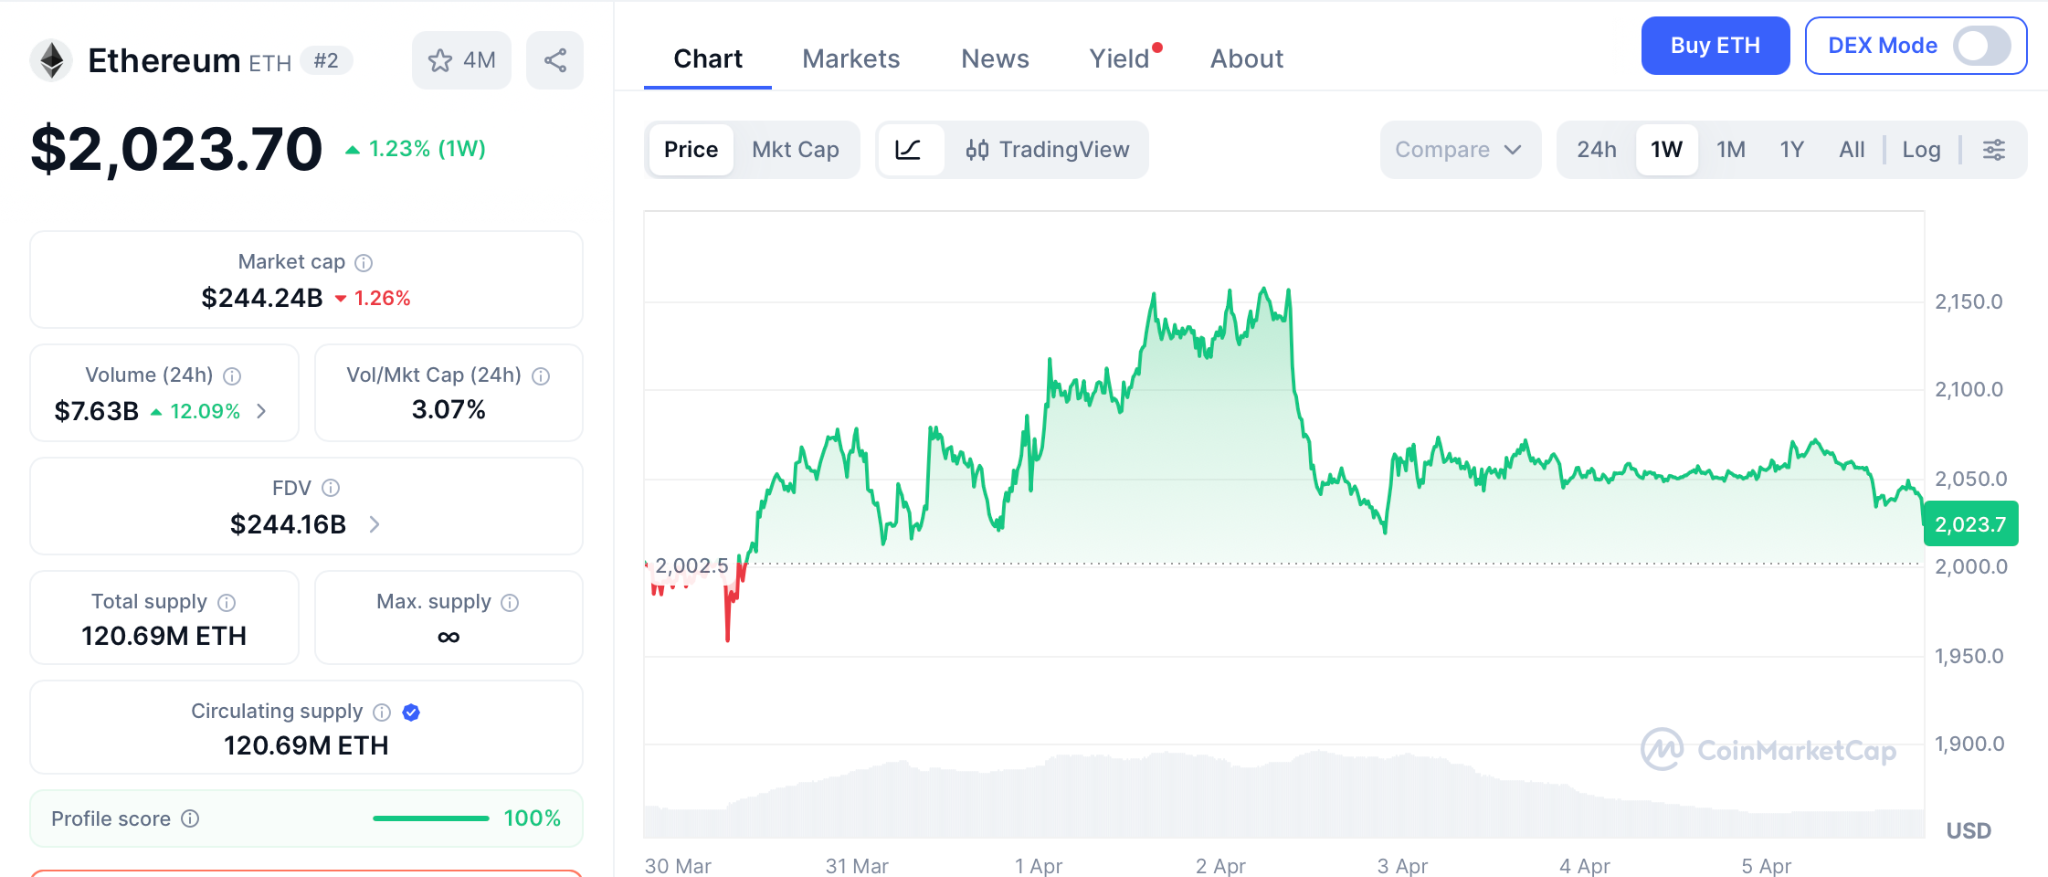
The ETH forecast depends on clearing $2,200 to $2,250, which opens $2,500. From there, $3,000 becomes a real target based on historical zones that preceded major runs in past cycles. Standard Chartered holds a $7,500 year-end call, meaning $3,000 sits at the halfway mark and could arrive much sooner if macro conditions improve and the Iran conflict cools.
Support holds at $2,000 with the structure at risk if that level breaks. The ethereum price prediction is strong for patient holders, but the path from $2,034 to $3,000 is a 46% move over months, not the 100x the presale compresses into one listing event.
Conclusion
The Foundation just locked $93 million into staking instead of selling. The ETH outlook firms up as sell pressure drops and infrastructure matures. When that kind of money stays on chain instead of hitting the market, the ceiling lifts for the entire ecosystem.
But the gains that reshape portfolios come from being early in what the market finds after the listing, not from recovery. The founder behind Pepe plus working exchange tools plus a Binance listing is the rarest mix crypto produces. The Pepeto official website is where that entry stays open, and the wallets that caught ETH below $100 in 2019 already know which path they would take again.
Click To Visit Pepeto Website To Enter The Presale

FAQs
Can ETH reach $3,000 based on the ethereum price prediction?
Yes. $3,000 is a 46% gain from current levels and sits halfway to Standard Chartered’s $7,500 target. Realistic if macro eases.
What does the ethereum price prediction reveal about the current market?
ETH holds above $2,000 as the Foundation stops selling and starts staking at Pepeto targets 100x before listing.
What drives Pepeto’s returns beyond the ethereum price prediction?
Five live exchange tools scale with on-chain growth. The Binance listing compresses what months of ETH recovery delivers into one event.
Disclaimer: This is a Press Release provided by a third party who is responsible for the content. Please conduct your own research before taking any action based on the content.


Harvard economist Kenneth Rogoff believes the Chinese yuan will become a global reserve currency within five years. He argues that President Xi Jinping’s explicit call for yuan internationalization marks a turning point.
Rogoff says investors worldwide are desperate to diversify away from the US dollar, making China’s push well-timed.
China’s Path to Reserve Status
In a recent interview with the South China Morning Post, Rogoff outlined the key steps China must take. Beijing needs to open its government bond markets to foreign investors. It also needs forward markets and interest rate swaps to support international participation.
Rogoff noted that fully open capital markets are not required. The US itself maintained many restrictions on foreign investment through the 1970s. It was still the world’s dominant reserve currency during that period.
China must also build financial rails independent of the SWIFT system. Rogoff said modern blockchain technology can duplicate existing systems at much lower cost. The country’s Cross-border Interbank Payment System already serves as a foundation for this effort.
Crypto’s Role in Dollar Erosion
Rogoff also addressed how cryptocurrencies are reshaping currency competition. He estimated the global underground economy at roughly 20% of total output. That amounts to at least $20 trillion.
Cryptocurrency, particularly stablecoins, has already captured a significant share of illicit transactions. Physical cash once dominated this space. Digital assets now offer faster and harder-to-trace alternatives.
Stablecoins Face Regulatory Reckoning
However, Rogoff warned that crypto will never replace the dollar in the legal economy. Governments have more than enough regulatory power to prevent that outcome.
He criticized the US Genius Act as overly liberal in its stablecoin regulation. Stablecoins remain difficult to trace once they leave their issuer. Rogoff predicted that future rules will eventually mirror central bank digital currency requirements.
The race for currency dominance is accelerating. Both Europe and China are building independent financial systems to reduce vulnerability to US sanctions.
The post Yuan, Not Crypto, Will Challenge Dollar Within 5 Years appeared first on BeInCrypto.

TLDR:
- Coinbase filed a formal SEC submission opposing mandatory issuer approval for third-party stock tokenization on April 1, 2026.
- The filing argues issuer consent mandates contradict Section 4(a)(1) of the Securities Act and decades of SEC legal precedent.
- Coinbase warns that requiring issuer approval could create anticompetitive barriers and push blockchain innovation offshore.
- A flexible dual framework supporting both issuer-led and third-party tokenization would unlock T+0 settlement and 24/7 trading.
Coinbase filed a formal submission with the SEC’s Crypto Task Force on April 1, 2026, addressing third-party tokenization of publicly traded securities.
The document argues against requiring issuer approval for blockchain-based representations of existing stocks. The filing responds to the SEC’s ongoing effort to modernize securities markets through blockchain technology.
Coinbase’s position centers on protecting secondary market activity from unnecessary regulatory barriers.
Coinbase Challenges Issuer Veto Power Over Secondary Markets
The full title of the submission is “Re: Why Third-Party Tokenization of Publicly Traded Securities Should Not Require Issuer Approval.”
Coinbase argues that mandating issuer consent contradicts established U.S. federal securities law. Specifically, the filing references Section 4(a)(1) of the Securities Act, which permits resale without issuer involvement in many secondary-market scenarios.
The company also cited Rule 17Ad-20, which governs transfer agents and secondary market restrictions. Decades of SEC precedent support free transferability of securities in secondary markets. Issuers traditionally hold no veto power over how investors transfer or custody shares after entering public markets.
According to the tweet by @martypartymusic, Coinbase warned that requiring issuer approval would grant companies unprecedented control over lawful secondary-market activity.
This could create anticompetitive barriers and favor incumbent-controlled closed systems. Such a mandate would directly stifle innovation in the tokenization space.
Coinbase further clarified that third-party tokenization does not create a new security. Instead, it represents existing shares on a blockchain while fully preserving shareholder rights, including voting, dividends, and corporate actions.
Flexible Framework Would Support Both Issuer and Third-Party Tokenization
Coinbase advocates for a dual approach that accommodates issuer-led and third-party tokenization simultaneously.
Under this framework, companies could issue their own blockchain versions of shares if they choose. Independent platforms, however, would also be free to create tokenized representations of existing stocks.
The filing points to recent SEC-friendly developments as evidence that issuer consent is unnecessary. Nasdaq’s tokenized trading pilots and the DTCC’s Tokenization Services have both advanced without imposing such requirements. Adding a consent mandate now would represent a reversal of regulatory progress already underway.
A flexible framework, Coinbase argues, would unlock key market efficiencies. These include T+0 instant settlement, 24/7 trading, reduced intermediary costs, greater transparency, and peer-to-peer transfers.
Tokenized stocks could also integrate with decentralized finance protocols while maintaining regulatory compliance.
Coinbase also warned that overly restrictive rules could push blockchain innovation offshore. This would limit the SEC’s ability to oversee markets and gather data for future rulemaking.
The filing ties directly to the SEC’s planned “innovation exemption,” urging that access to it not be unnecessarily restricted.
TLDR:
- Stellar’s open network design attracts broader adoption than XRP’s institution-focused approach.
- XLM demand ties directly to real network activity, giving it stronger organic economic foundations.
- XRP’s legal battles with the SEC have slowed adoption and weakened institutional confidence over time.
- Stellar’s diverse ecosystem, spanning payments, stablecoins, and NGOs, reduces reliance on single partners.
Stellar (XLM) and XRP remain two of the most discussed blockchain payment networks in crypto. Both target cross-border transactions, yet their approaches differ sharply.
Those differences may determine which asset captures greater long-term value. Stellar’s open design, usage-driven tokenomics, and lower regulatory exposure give it structural advantages.
Meanwhile, XRP leans heavily on institutional partnerships and faces ongoing legal scrutiny in key markets.
Open Network Design and Real Usage Demand
Stellar was built to support financial inclusion from the ground up. Anyone — individuals, startups, or institutions — can issue assets and interact freely on its network.
This open access model drives broader adoption compared to XRP’s bank-focused design. The wider a network grows, the more value it tends to attract over time.
XRP, by contrast, targets large financial institutions as its primary users. That focus concentrates value among a limited group of participants.
Open network effects, which Stellar benefits from, tend to compound as more users join. This structural difference matters significantly when measuring long-term growth potential.
Stellar’s tokenomics also tie XLM demand directly to real network activity. Every transaction, account creation, and asset exchange requires XLM, creating consistent organic demand.
XRP often functions as a temporary bridge asset in liquidity operations. Tokens are held only briefly, which weakens sustained structural demand for the asset.
This usage-driven demand model gives Stellar a more reliable economic foundation. As transaction volumes grow on the network, so does the need for XLM.
That relationship between usage and demand is a strong indicator of long-term value retention. Developers and institutions building on Stellar contribute directly to that demand cycle.
Regulatory Environment and Ecosystem Diversity
XRP has faced considerable legal challenges, particularly in the United States. The Ripple lawsuit created uncertainty around market perception, adoption, and liquidity.
Even as some regulatory clarity has emerged, the damage to institutional confidence lingers. Lower legal risk makes an asset more attractive to developers and financial partners.
Stellar has largely avoided such regulatory friction and operates in a more stable environment. The Stellar Development Foundation maintains a relatively neutral governance image.
That neutrality appeals to developers who prioritize decentralization and compliance. It also reduces the kind of institutional hesitation that has slowed XRP’s growth in certain markets.
Beyond regulation, Stellar supports a diverse real-world ecosystem. Its network powers low-cost cross-border payments, stablecoins, and humanitarian finance projects.
NGOs and financial inclusion initiatives in emerging markets actively use the network. This breadth of application reduces dependence on any single sector or partner group.
XRP, while technically efficient, relies more heavily on specific institutional agreements. A concentrated ecosystem carries greater risk if key partnerships shift or dissolve.
Stellar’s multi-sector presence provides a more resilient foundation for sustained network growth. That diversity, combined with lower regulatory pressure, positions XLM as a strong long-term contender.
TLDR:
- Walmart recorded a 66% conversion drop when embedding agentic checkout directly inside ChatGPT’s interface.
- OpenAI phased out Instant Checkout after merchants reported poor results with chatbot-based purchase experiences.
- The Machine Payments Protocol lets AI agents pay via HTTP requests, using cards, wallets, or stablecoins natively.
- Know Your Agent frameworks are now being developed to secure invisible payments before autonomous spending scales further.
Invisible commerce is emerging as the next frontier in AI-driven payments, replacing the checkout model. Walmart recently recorded a 66% drop in conversion rates when embedding agentic checkout inside ChatGPT.
OpenAI subsequently phased out its Instant Checkout feature. These developments signal a major shift. The payments industry built agentic commerce on the wrong foundation.
Agents do not need better checkouts — they need payments that happen automatically, without human intervention.
Walmart’s Checkout Experiment Exposed a Fundamental Flaw
Walmart’s conversion rate collapse was a clear indicator that something was broken. Embedding a human-optimized checkout inside a chatbot created friction rather than reducing it. The process was designed for human eyes, not machine logic.
OpenAI responded by pulling Instant Checkout entirely. Merchants now handle purchases through their own app-based systems instead.
This retreat confirmed what many in the payments space suspected — agentic commerce built on traditional checkout rails does not work.
Fintech analyst Simon Taylor captured this tension clearly. He noted that agentic commerce protocols now outnumber actual agentic transactions.
The infrastructure is ahead of the real-world use case, and the use case itself may have been wrong from the start.
Stripe previously outlined five levels of agentic commerce, borrowing from autonomous driving. Each level still assumed a visible purchase event. Even at the highest level, an agent reacts to human intent. That model is now being questioned.
The Parking Agent Demonstrates a New Payment Paradigm
A hackathon project changed how some in the industry are thinking about this problem. A developer built a parking AI agent that detects a user’s location and pays the local parking authority automatically. No checkout appeared. No purchase intent was required.
The payment happened because an event occurred in the physical world. The agent inferred what was needed and completed the transaction. This is the model that Taylor refers to as invisible commerce.
This approach mirrors how Uber handles payments. A rider exits a vehicle and money moves — no cart, no confirmation screen, no “pay now” button. Uber achieved this by owning both sides of the marketplace. The challenge now is replicating that experience across open agent ecosystems.
Developer Steve Krouse shared a related observation on X, noting that giving agents a USDC wallet produced a genuinely magical product experience. That sentiment reflects growing interest in agent-native payment infrastructure.
Machine Payments Protocol Points Toward Agent-Native Commerce
The Machine Payments Protocol (MPP) launched recently as one attempt to solve this infrastructure gap. It allows agents to initiate payments through a simple HTTP request. The protocol supports credit cards, digital wallets, and stablecoins.
Early use cases include agents purchasing API access, compute resources, stock footage, and real-time data feeds. However, the first viral use case was far simpler. Users had their agents buy them sandwiches, as shared by developer Josh on X, citing MPP and related tools.
Google is also releasing new agentic protocols regularly. X402 is another protocol operating in this space. The competition signals that the market sees real demand for machine-native payment rails.
Security remains an open question. When agents spend autonomously, audit trails become harder to track. Liability for compromised agents is still unresolved. Researchers are now working on Know Your Agent (KYA) frameworks to close that gap before the technology scales further.
Crypto World
Crypto Market Loses $1.5 Trillion in Two Quarters: Is the Worst Still Ahead for Bitcoin?
TLDR:
- Crypto markets shed over $1.5 trillion across Q4 2025 and Q1 2026, with Bitcoin driving nearly 60% of total losses.
- Gold outperformed Bitcoin by nearly 40% in recent months, a strong signal that large capital favors safety over risk assets.
- Bitcoin has traded flat between $65K and $69K for weeks despite rising oil prices and growing geopolitical tensions globally.
- BTC dominance and the gold-to-Bitcoin ratio remain the two most critical metrics to watch for early signs of market recovery.
The crypto market sits at a crossroads as Bitcoin consolidates within a narrow range. Over the past two quarters, digital assets lost over $1.5 trillion in total market value.
Institutional capital has pulled back, and macro forces are weighing on risk appetite. Traders are watching carefully as the market weighs potential recovery against further downside, with conditions outside crypto likely determining the next major move.
Bitcoin’s Recent Losses Point to Broader Institutional Retreat
Bitcoin led the market lower across Q4 2025 and Q1 2026. Combined, those two quarters wiped out roughly 45% in value from the broader market. BTC accounted for nearly 60% of total losses recorded during that period.
That detail changes how analysts read the sell-off. When Bitcoin drives the drawdown, it is not retail traders dumping speculative tokens. It reflects real capital reducing exposure across the entire asset class.
As MR Black noted on X, “When BTC is leading the drawdown, it isn’t a sector rotation. It isn’t retail panic selling memecoins.” That observation carries weight, especially for investors trying to time a re-entry into the market.
Gold’s Outperformance Sends a Clear Risk-Off Signal
The XAU/BTC ratio has shifted nearly 40% in gold’s favor over recent months. Gold offers no yield and carries no technological narrative. Its strength signals that large capital holders are choosing preservation over growth.
That ratio matters because it reflects institutional psychology, not retail sentiment. When the biggest players move into gold, it means confidence in risk assets remains low. Crypto has not yet shown the kind of recovery that would pull that capital back.
However, analysts note that this ratio could become one of the first signs of a turnaround. When it begins reversing, it may indicate that risk appetite is returning and that institutional money is ready to rotate back into Bitcoin.
Sideways Price Action Raises Questions About What Comes Next
Bitcoin has traded between roughly $65,000 and $69,000 for several weeks. That range has held despite rising geopolitical tension, higher oil prices, and growing inflation concerns. Normally, any of those factors would trigger sharp movement in crypto markets.
The muted reaction suggests one of two things. Either the market has already absorbed much of the uncertainty, or it remains so undecided that it needs a strong external trigger to break either way. That ambiguity makes directional calls difficult right now.
BTC dominance remains a key metric to track through this period. When dominance rises, capital clusters in Bitcoin and altcoins suffer.
When it falls, capital rotates into higher-risk assets, and historically that rotation has preceded some of the strongest alt-season runs in a given cycle.
The path forward for crypto depends heavily on macro developments in the coming weeks. If oil cools and geopolitical risks ease, the current consolidation could prove to be a base for recovery.
If conditions worsen, further downside remains possible, with altcoins likely absorbing the most pressure. Traders watching signals beyond the price chart may be better positioned for whatever move comes next.
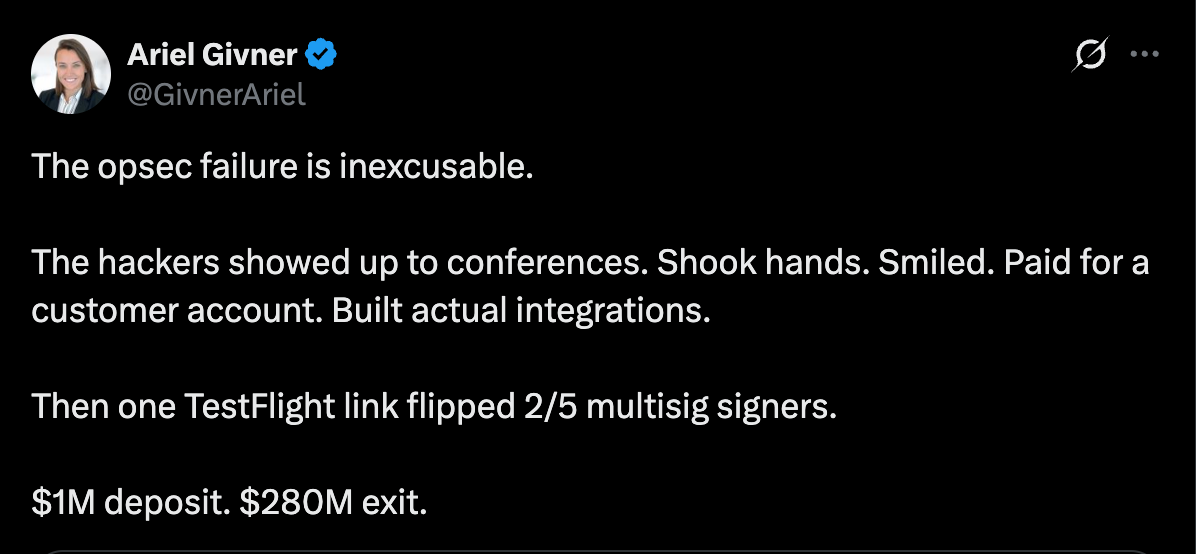
The hack of the Solana-based decentralized finance (DeFi) platform Drift Protocol could have been prevented if standard operational security procedures were followed by the Drift team, and may constitute “civil negligence,” according to attorney Ariel Givner.
“In plain terms, civil negligence means they failed their basic duty to protect the money they were managing,” Givner said in response to the post-mortem update provided by the Drift team and how it handled Wednesday’s $280 million exploit.
The Drift team failed to follow “basic” security procedures, including keeping signing keys on separate, “air-gapped” systems that are never used for developer work, and conducting due diligence on blockchain developers met through industry conferences.

“Every serious project knows this. Drift didn’t follow it,” she said, adding, “They knew crypto is full of hackers, especially North Korean state teams.” Givner continued:
“Yet their team spent months chatting on Telegram, meeting strangers at conferences, opening sketchy code repos, and downloading fake apps on devices tied to multisignature controls.”
Advertisements for class action lawsuits against Drift Protocol are already circulating, she said. Cointelegraph reached out to the Drift Team but did not receive a response by the time of publication.

The incident is a reminder that social engineering and project infiltration by malicious actors are major attack vectors for cryptocurrency developers that could drain user funds and permanently erode customer trust in compromised platforms.
Related: Drift explains $280M exploit as critics question Circle over USDC freeze
Drift Protocol says attack took “months” of planning
The Drift Protocol team published an update on Saturday outlining how the exploit occurred and claimed that the attackers planned the attack for six months before execution.
Threat actors first approached the Drift team at a “major” crypto industry conference in October 2025, expressing interest in protocol integrations and collaboration.
The malicious actors continued to build rapport with the Drift development team in the ensuing six months, and once enough trust was built, they began sending the Drift team malicious links and embedding malware that compromised developer machines.
These individuals, who are suspected of working for North Korea state-affiliated hackers and physically approached the Drift developers, were not North Korean nationals, according to the Drift team.
Drift said, with “medium-high confidence,” that the exploit was carried out by the same actors behind the October 2024 Radiant Capital hack.
In December 2024, Radiant Capital said the exploit was carried out through malware sent via Telegram from a North Korea-aligned hacker posing as an ex-contractor.
Magazine: Meet the hackers who can help get your crypto life savings back
TLDR:
- Over $6 billion in short positions face liquidation if the Bitcoin price rises toward the $72.5K level
- Nearly $2 billion in long positions are exposed to liquidation risk if Bitcoin drops below $65K
- Dense liquidation clusters between $68K and $74K may drive rapid upside price movement
- Lower zones around $60K to $66K show strong long liquidation pressure during downside moves
Bitcoin is approaching a critical price range where large leveraged positions face liquidation pressure. Data from a recent liquidation map shows billions in potential forced trades, with both upside and downside zones tightly packed around current levels.
Liquidation Map Reveals Tight Market Positioning
A recent post by Crypto Rover on X points to a sharp imbalance in Bitcoin’s liquidation landscape. The data shows over $6 billion in short positions at risk if Bitcoin climbs toward $72,500. Meanwhile, nearly $2 billion in long positions sit vulnerable near the $65,000 level.
The visualization tracks liquidation activity over a 30-day window. Bitcoin’s current price stands near $67,314, marked clearly on the chart. Price levels stretch from roughly $58,000 to $74,000, offering a clear view of where leverage is concentrated.
Above the current price, the cumulative short liquidation curve rises steeply. This indicates that many traders have opened short positions expecting a decline. As price moves higher, these positions face forced closure, which requires buying Bitcoin back.
Below the current level, the long liquidation curve grows steadily. This shows that many traders are positioned for upside but risk liquidation if prices fall. When these positions close, they trigger selling pressure.
Exchange-specific data adds more detail. Clusters from Binance, OKX, and Bybit show where liquidation activity is most concentrated. These zones often attract price movement due to the liquidity they provide.
Key Price Zones Define Market Direction
The liquidation map points to several high-activity zones that traders are watching closely. Around $65,000, there is a dense cluster of long liquidations. This area has already seen recent activity, making it a sensitive level.
Further down, the $60,000 to $62,000 range holds another concentration of long positions. If Bitcoin drops into this zone, forced selling could accelerate quickly. This type of movement often leads to sharp and rapid declines.
On the upside, liquidity builds strongly between $68,000 and $74,000. The most notable concentration appears between $72,000 and $74,000. This range holds the largest pool of short liquidations identified in the data.
If Bitcoin moves into this upper band, short sellers may be forced to exit positions. That process requires buying, which can push prices even higher. This chain reaction is often referred to as a short squeeze.
The current structure places Bitcoin between two pressure zones. Below the market, long positions risk liquidation and potential cascading sell-offs. Above the market, short positions create conditions for upward acceleration.
Crypto Rover’s tweet frames this setup as a market caught between competing forces. The larger liquidity pool sits above the current price, suggesting a strong area of interest. However, downside zones remain active and closely packed.
The map does not predict direction but shows where leverage is concentrated. Traders use this data to understand where forced activity may occur. These zones often act as magnets, drawing price toward areas with the most liquidity.

Trump declares victory after pilot rescue, but threats to US aircraft and personnel remain in Iran

Devon Energy: Merger Deal, Iran War, Price Tailwinds
Trump’s Hormuz Ultimatum Sends Oil Past $110, Highest Since March


-

 NewsBeat3 days ago
Steven Gerrard disagrees with Gary Neville over ‘shock’ Chelsea and Arsenal claim | Football
-

 Business3 days ago
No Jackpot Winner and $194 Million Prize Rolls Over
-

 Fashion2 days ago
Weekend Open Thread: Spanx – Corporette.com
-
Entertainment6 days ago
Fans slam 'heartbreaking' Barbie Dream Fest convention debacle with 'cardboard cutout' experience
-

 Crypto World4 days ago
Gold Price Prediction: Worst Month in 17 Years fo Save Haven Rock
-

 Tech7 days ago
The Pixel 10a doesn’t have a camera bump, and it’s great
-

 Business2 hours ago
Three Gulf funds agree to back Paramount’s $81 billion takeover of Warner, WSJ reports
-

 Tech7 days ago
Avatar Legends: The Fighting Game comes out in July and it looks pretty slick
-
Crypto World6 days ago
Dems press CFTC, ethics board on prediction-market insider trades
-

 Sports1 day ago
India men’s 4x400m and mixed 4x100m relay teams register big progress | Other Sports News
-

 Business4 days ago
Login and Checkout Issues Spark Merchant Frustration
-

 Tech6 days ago
Apple will hide your email address from apps and websites, but not cops
-

 Tech6 days ago
EE TV is using AI to help you find something to watch
-

 Sports5 days ago
Tallest college basketball player ever, standing at 7-foot-9, entering transfer portal
-

 Politics6 days ago
Should Trump Be Scared Strait?
-

 Tech6 days ago
Flipsnack and the shift toward motion-first business content with living visuals
-
Tech6 days ago
Daily Deal: StackSkills Premium Annual Pass
-

 Fashion7 days ago
The Best Spring Trends of 2026
-

 Crypto World6 days ago
U.S. rule change may open trillions in 401(k) funds to crypto
-

 Sports6 days ago
Women’s hockey camp eyes fitness boost, tactics ahead of WC 2026 campaign | Other Sports News
You must be logged in to post a comment Login