Crypto World
$887 Million Inflows Raise Red Flags

Ethereum has extended its recent decline, slipping toward the $2,000 level. At first glance, the pullback appears to be stabilizing. However, on-chain data suggests the weakness may not be over.
While ETH is hovering near a key level, underlying metrics reveal persistent stress; there is a chance that this cycle mirrors prior downturn patterns.
Sponsored
Sponsored
Ethereum Can Repeat History
Ethereum fell below its Realized Price toward the end of January. Since then, ETH has remained trapped under this crucial on-chain benchmark. The Realized Price reflects the average acquisition cost of all coins in circulation. Trading below it often signals widespread unrealized losses.
The Market Value to Realized Value, or MVRV, ratio confirms this pressure. ETH’s MVRV has remained below 1.0, indicating that the average holder is at a loss. Extended periods in this zone historically coincide with deep market corrections.
Want more token insights like this? Sign up for Editor Harsh Notariya’s Daily Crypto Newsletter here.

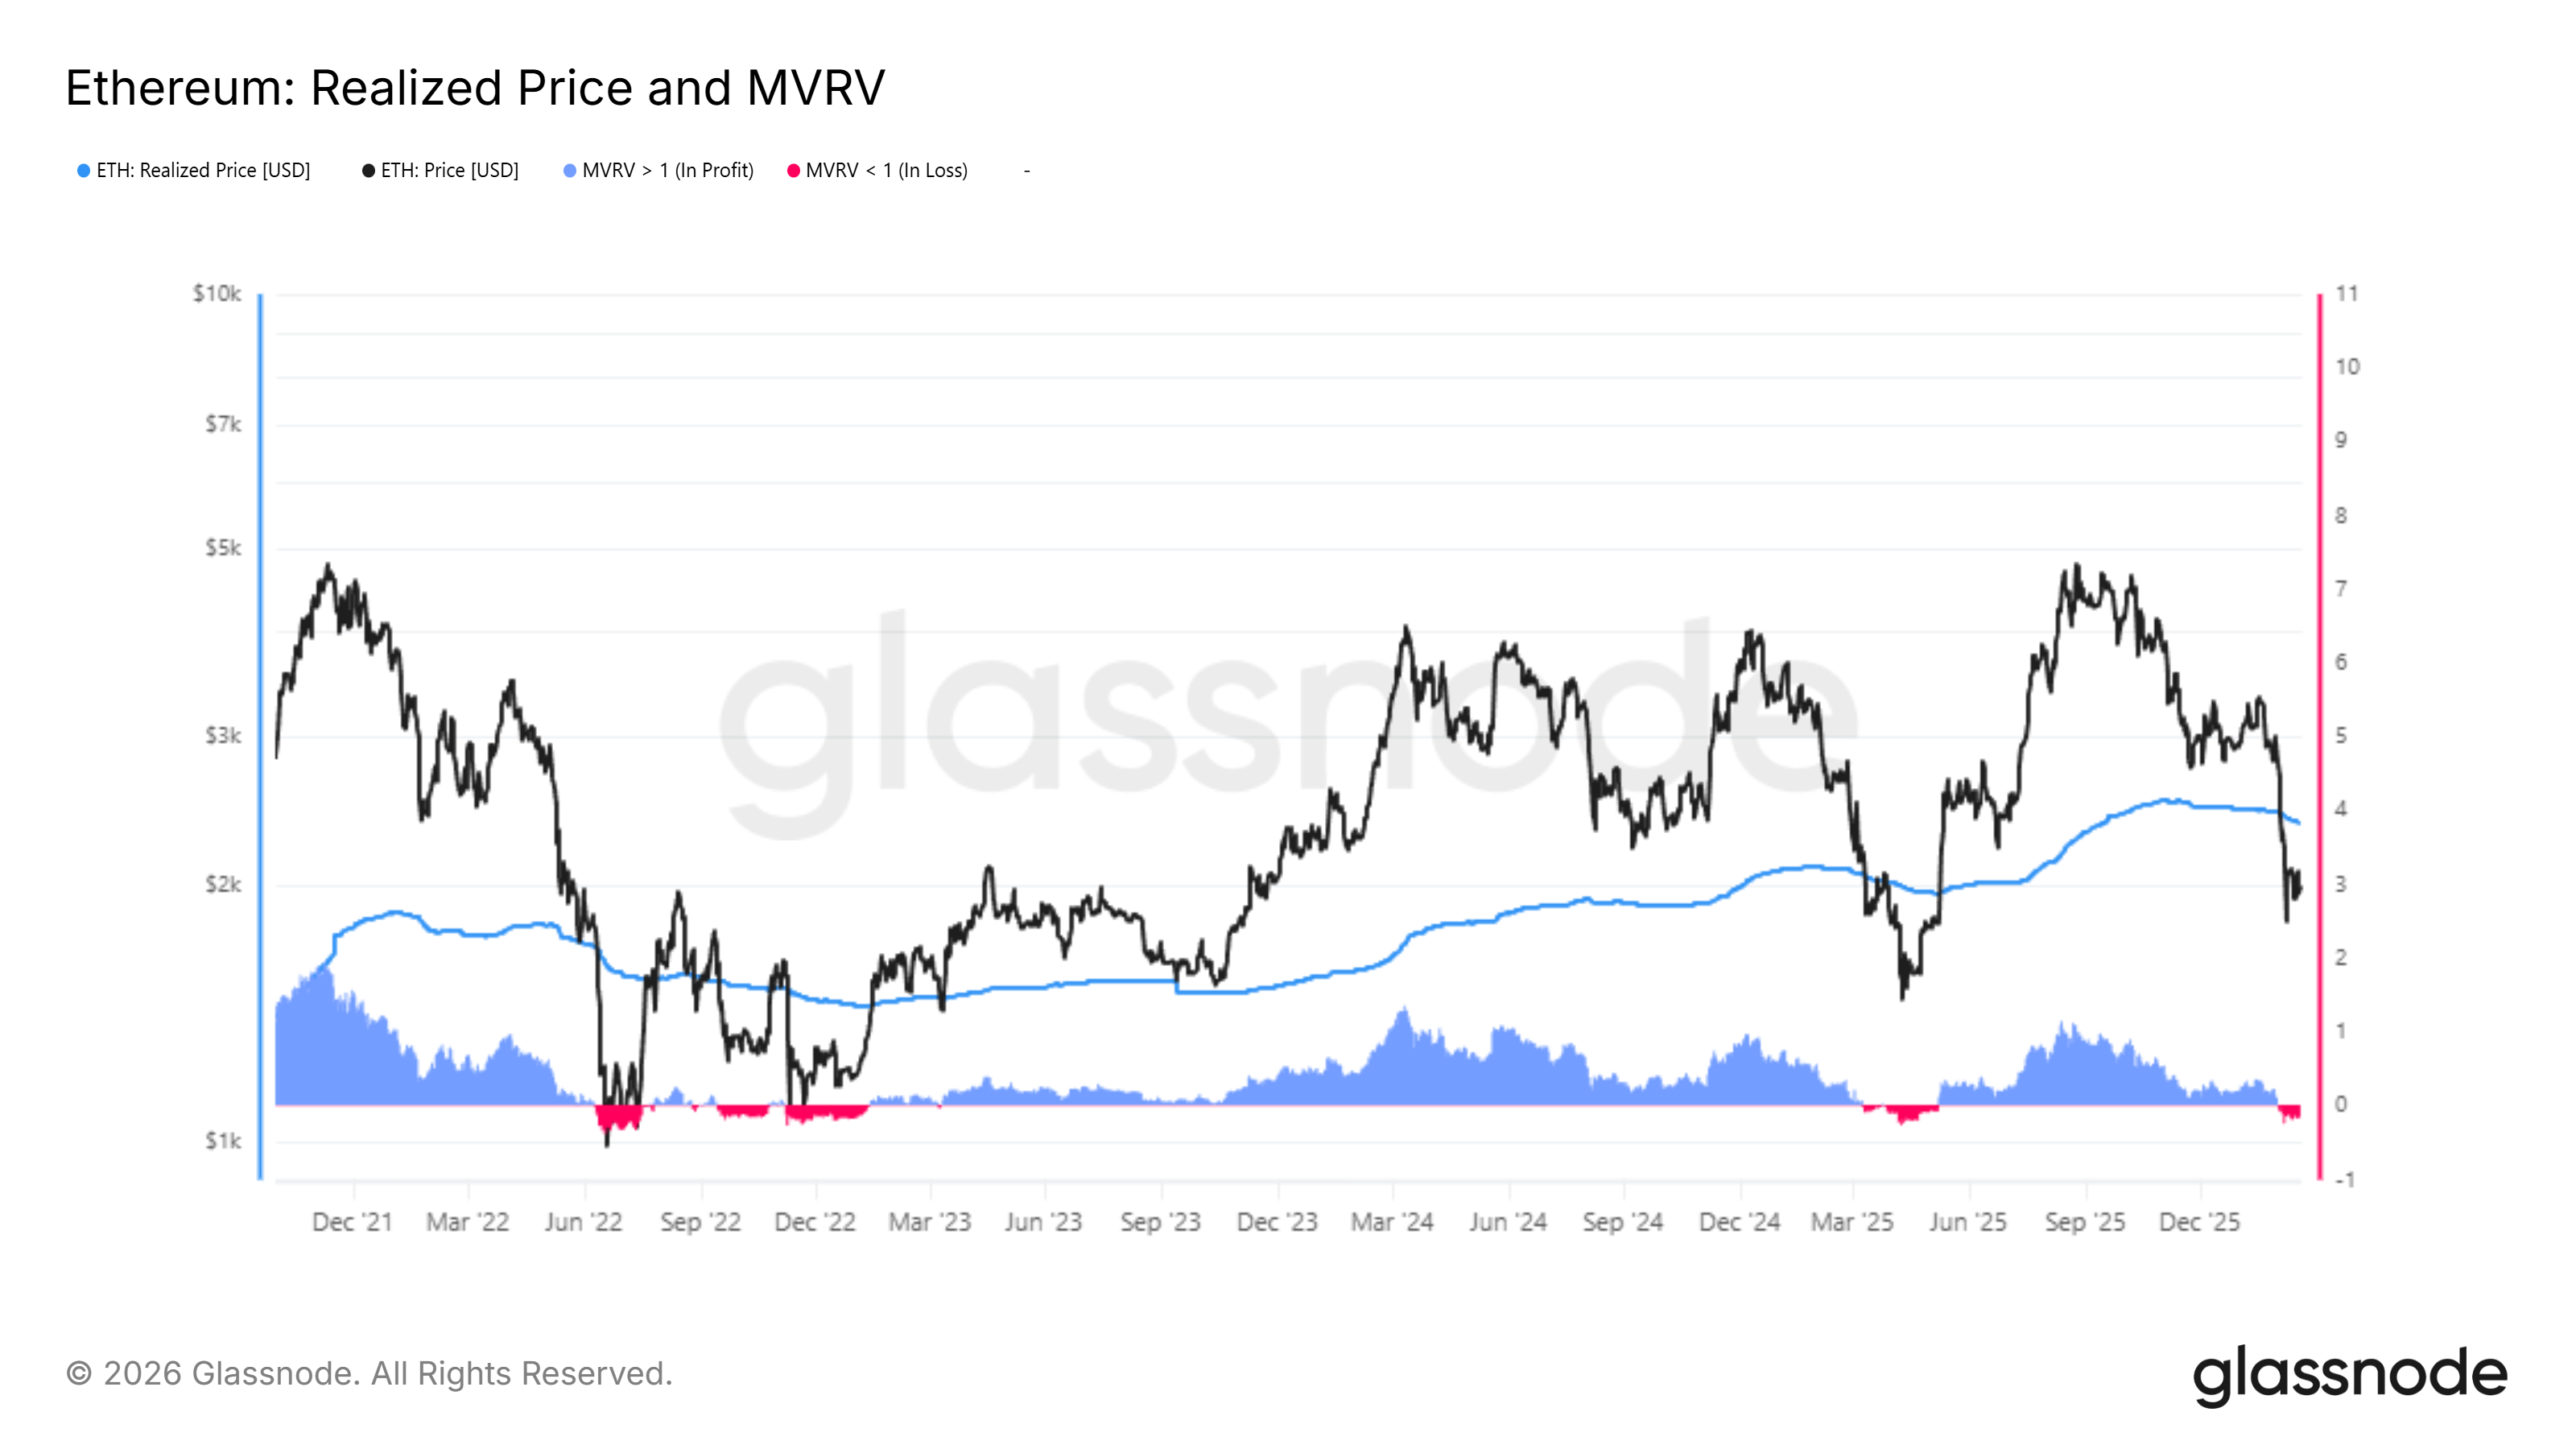
Past cycles show that recovery eventually follows prolonged sub-Realized Price trading. However, such recoveries often occur after capitulation phases. In prior bear markets, ETH experienced additional downside before forming durable bottoms. Current conditions suggest that further decline could precede stabilization.
ETH Selling Is Active
Exchange On-Balance data reveals an increasing supply moving onto trading platforms. Over the past week, approximately 445,000 ETH entered exchanges. At current prices, this represents more than $887 million in potential sell pressure.
Sponsored
Sponsored
Rising exchange balances typically indicate distribution. ETH Investors often transfer assets to exchanges with the intention of selling. The scale of recent inflows suggests heightened caution among holders.
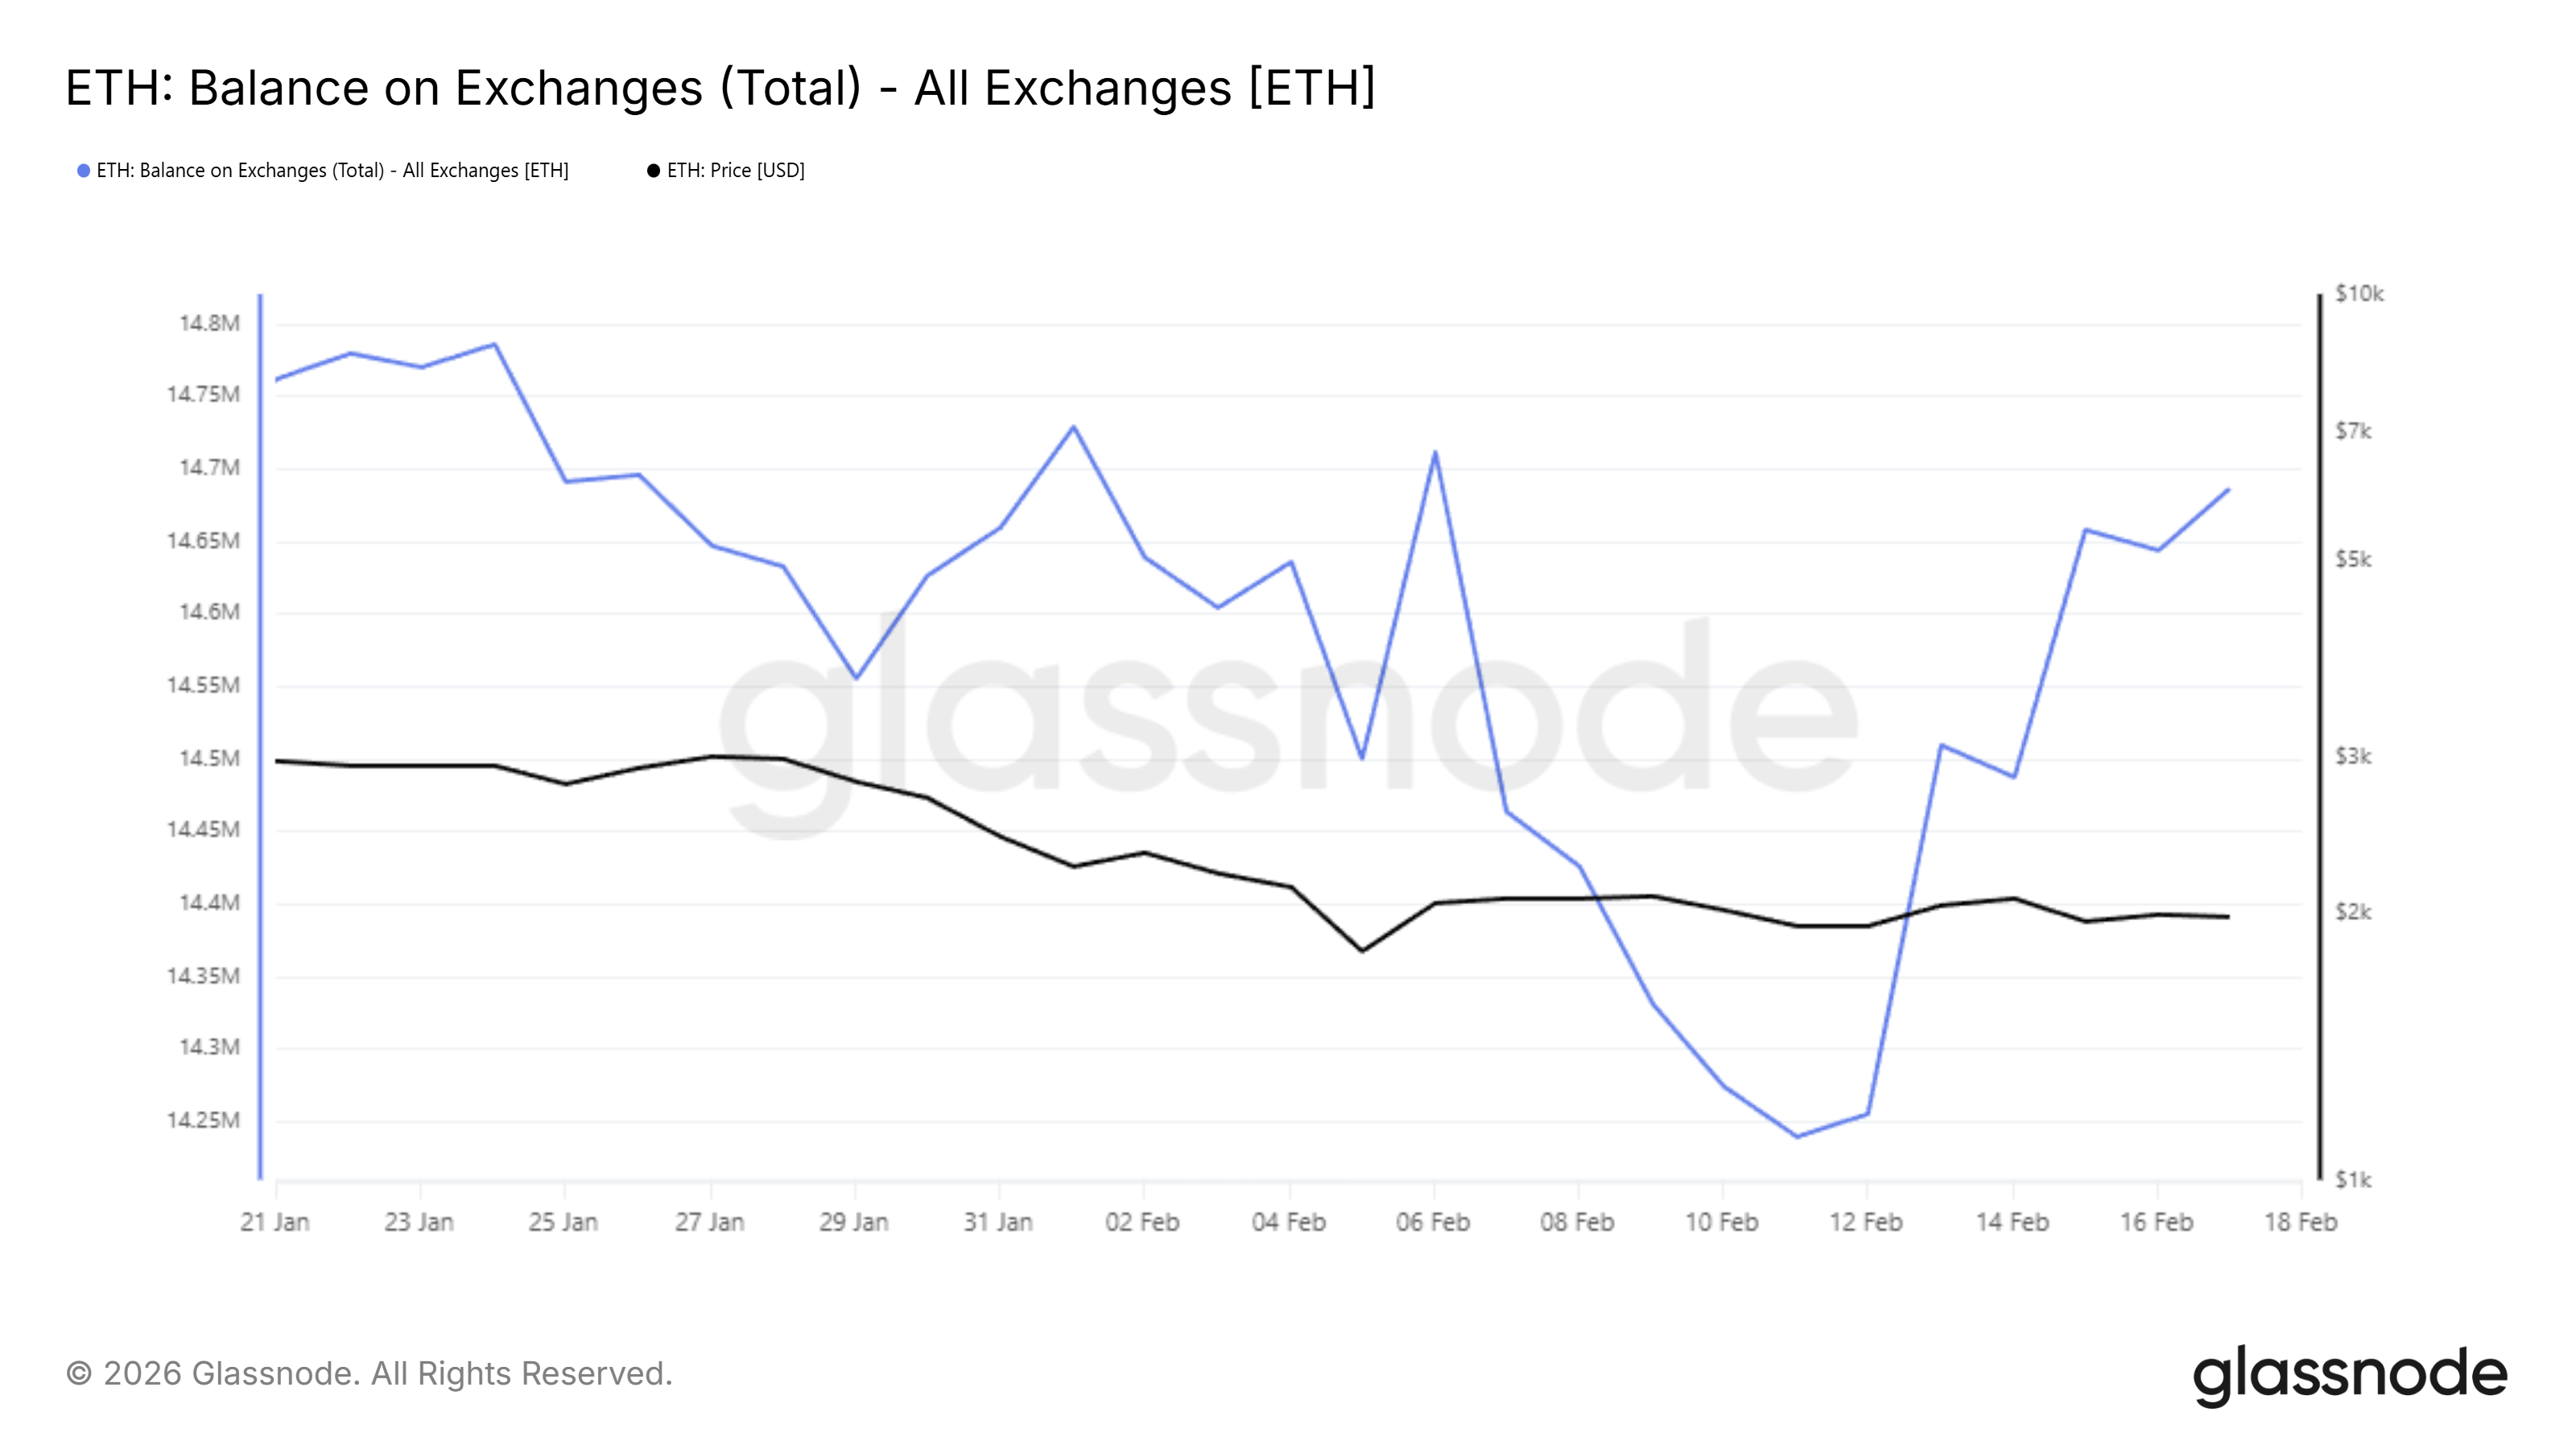
If the price fails to rebound quickly, panic selling could intensify. Similar spikes in exchange deposits have historically preceded sharp drawdowns. The combination of unrealized losses and rising supply increases downside vulnerability.
ETH Price May Witness Further Decline
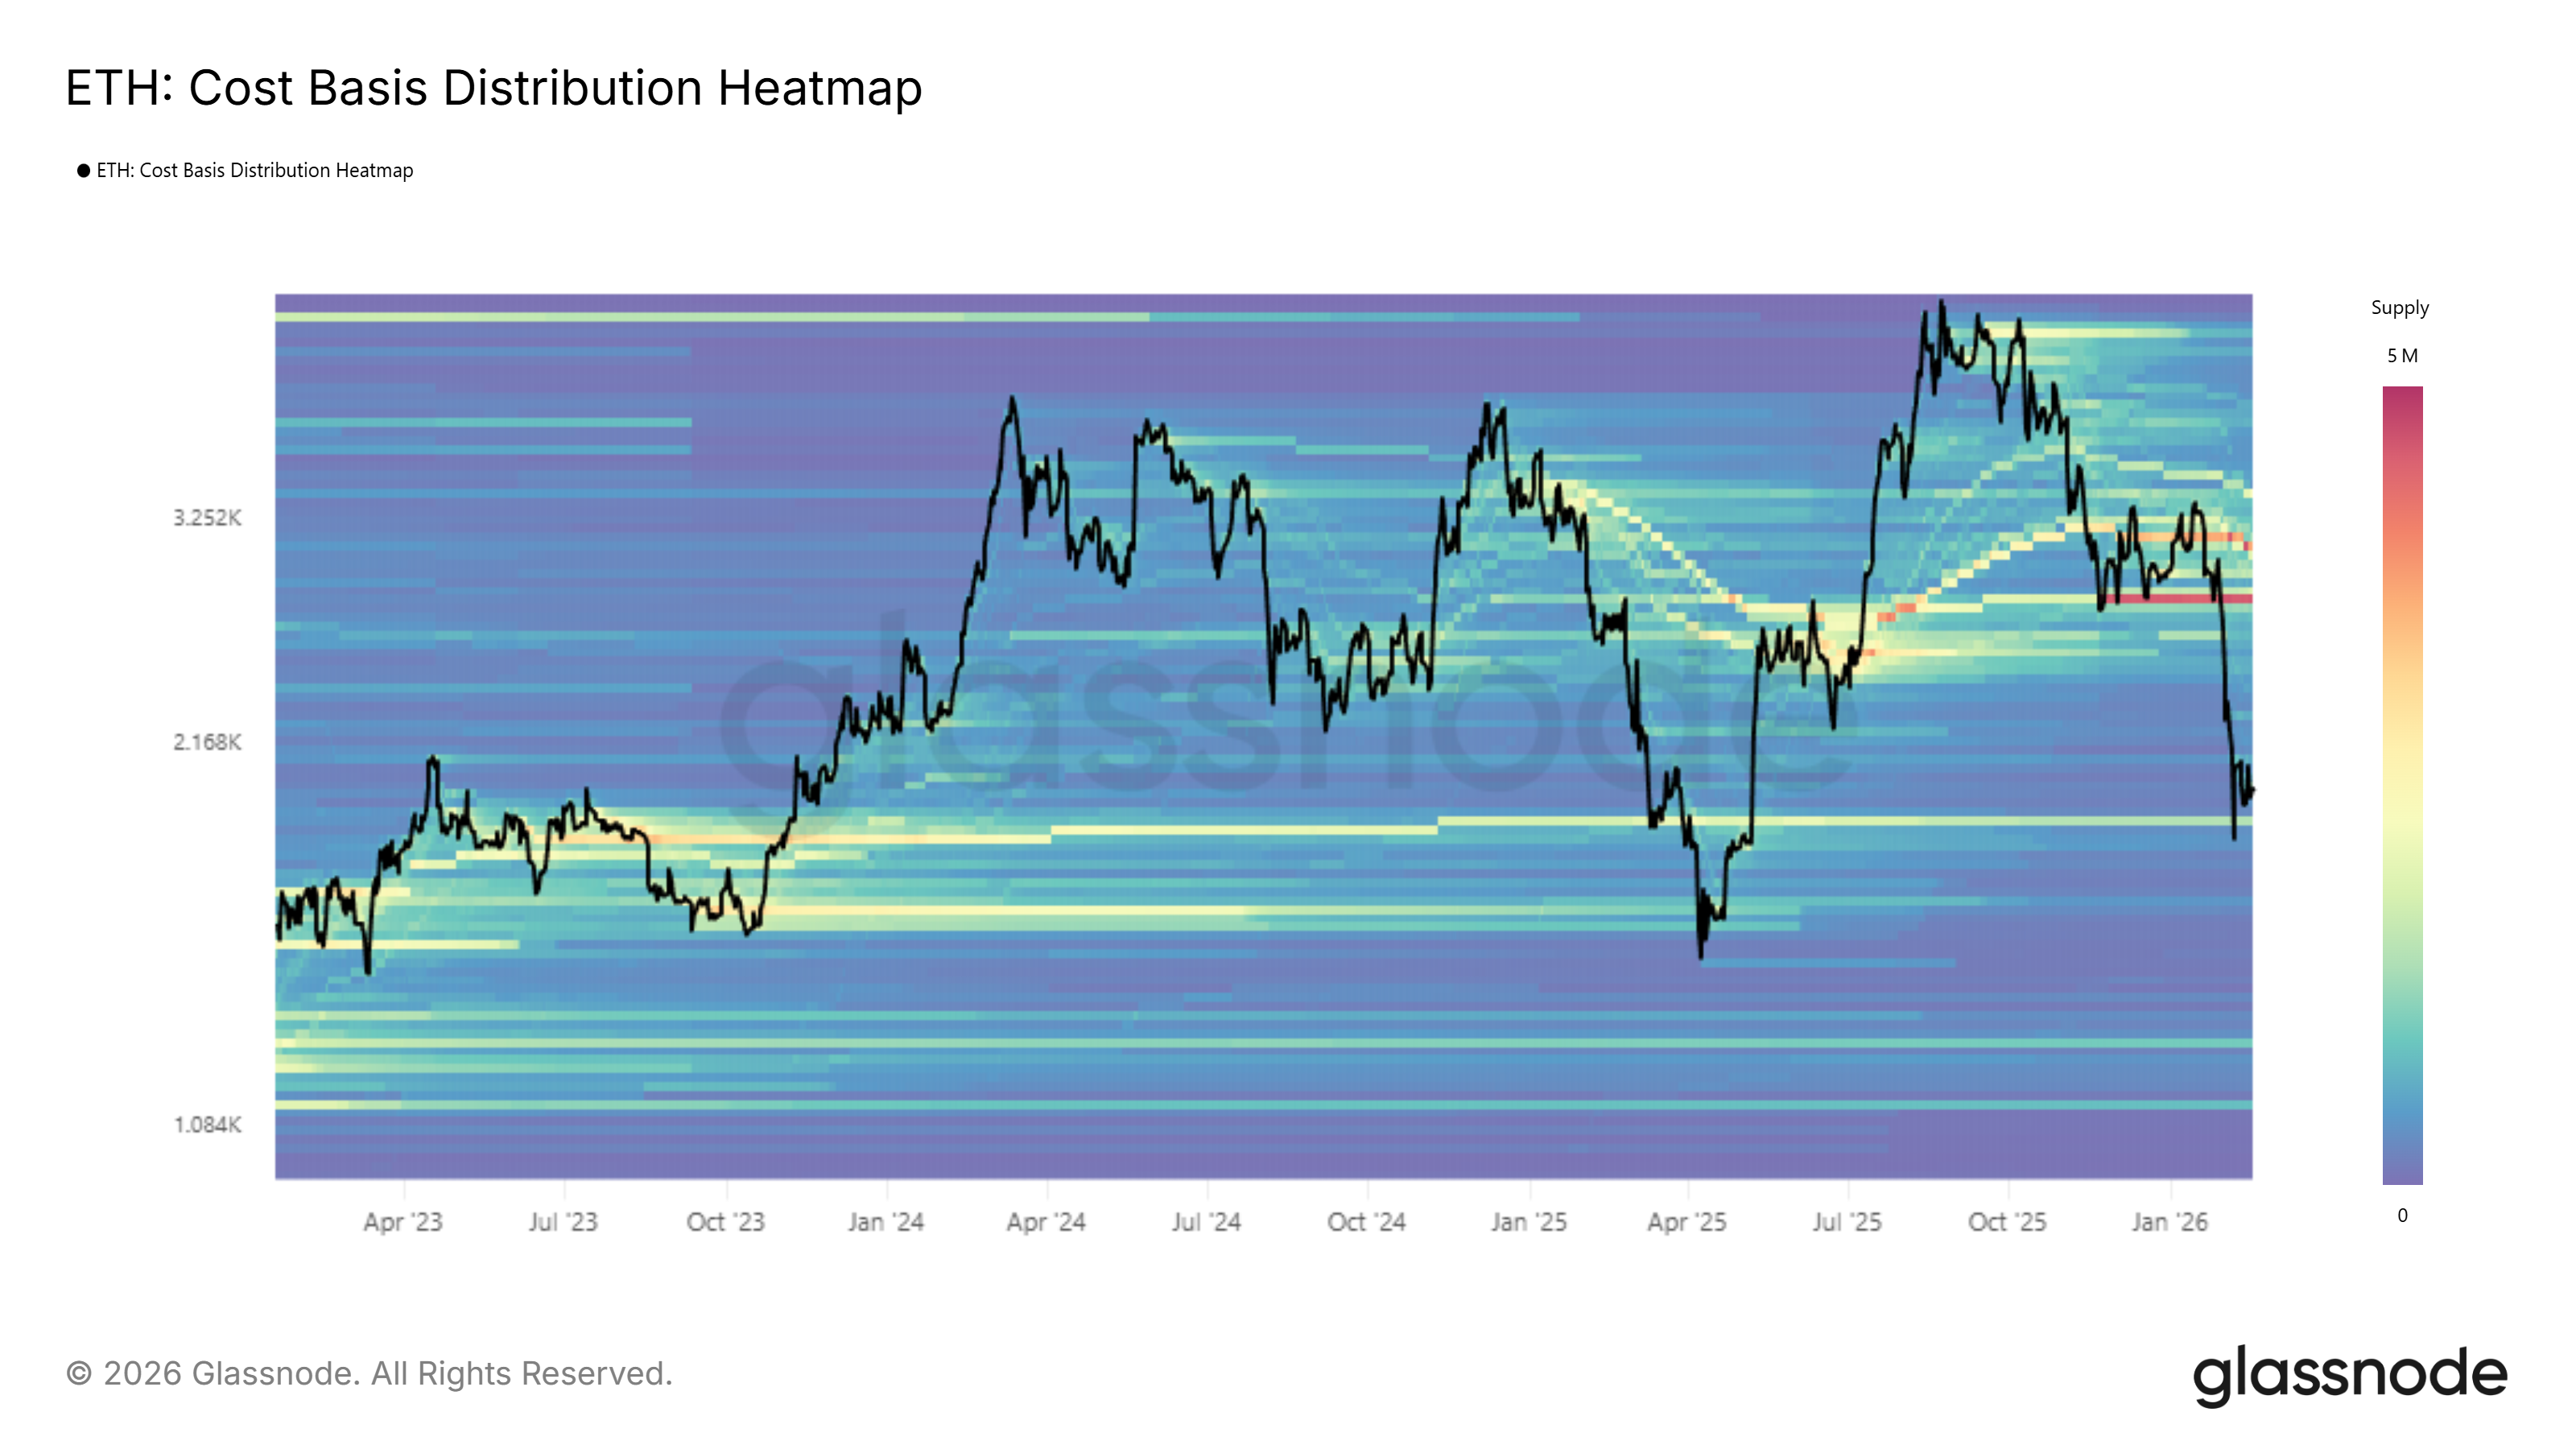
Ethereum is trading at $1,997 at the time of writing. The $2,000 level represents a critical psychological threshold. While this zone may attract short-term buying, persistent selling pressure reduces the probability of a sustained bounce. The $1,866 level represents the next notable support based on the CBD Heatmap.

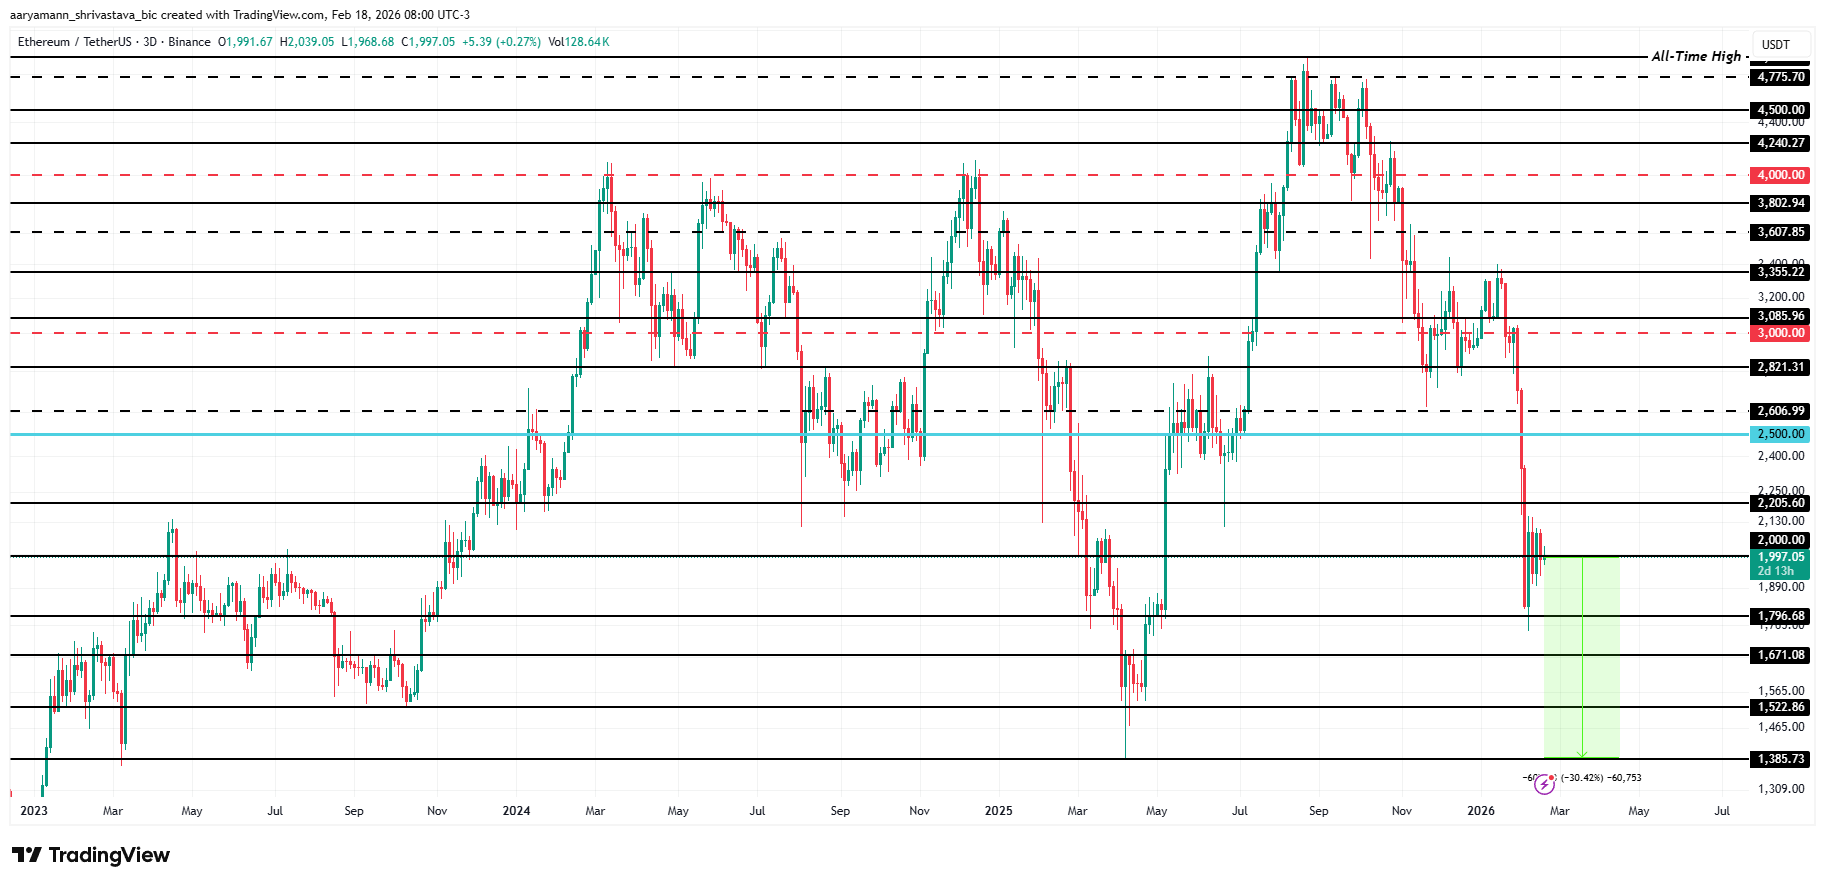
This zone reflects prior accumulation activity. If ETH loses $1,866, downside risk expands toward $1,385. This level has served as a structural bottom during previous cycles. A drop to $1,385 would represent roughly a 30% decline from current levels. The next major support beyond that sits near $1,231.
Conversely, a change in investor behavior could alter the trajectory. If holders reduce exchange deposits and accumulation resumes, ETH could stabilize above $2,000. A rebound may target $2,205 in the short term. Sustained buying pressure could extend gains toward $2,500, invalidating the current bearish outlook.