

Crypto World
A 13% Bounce Is All BMNR Stock Got Last Time: Can This Bullish Attempt Do Better?

BMNR stock price trades at $22.34, up 4% on the day. A bullish RSI divergence has flashed for the second time in a week and options positioning has shifted toward calls.
Yet Bitmine’s institutional interest remains pinned near zero. Institutional capital is not following the momentum. The last time this divergence appeared, it delivered just a 13% bounce before fading. A head-and-shoulders pattern on the daily chart adds a 23% downside risk if the current move fails.
A Bullish Divergence Flashes Again but the Last One Only Gave 13%
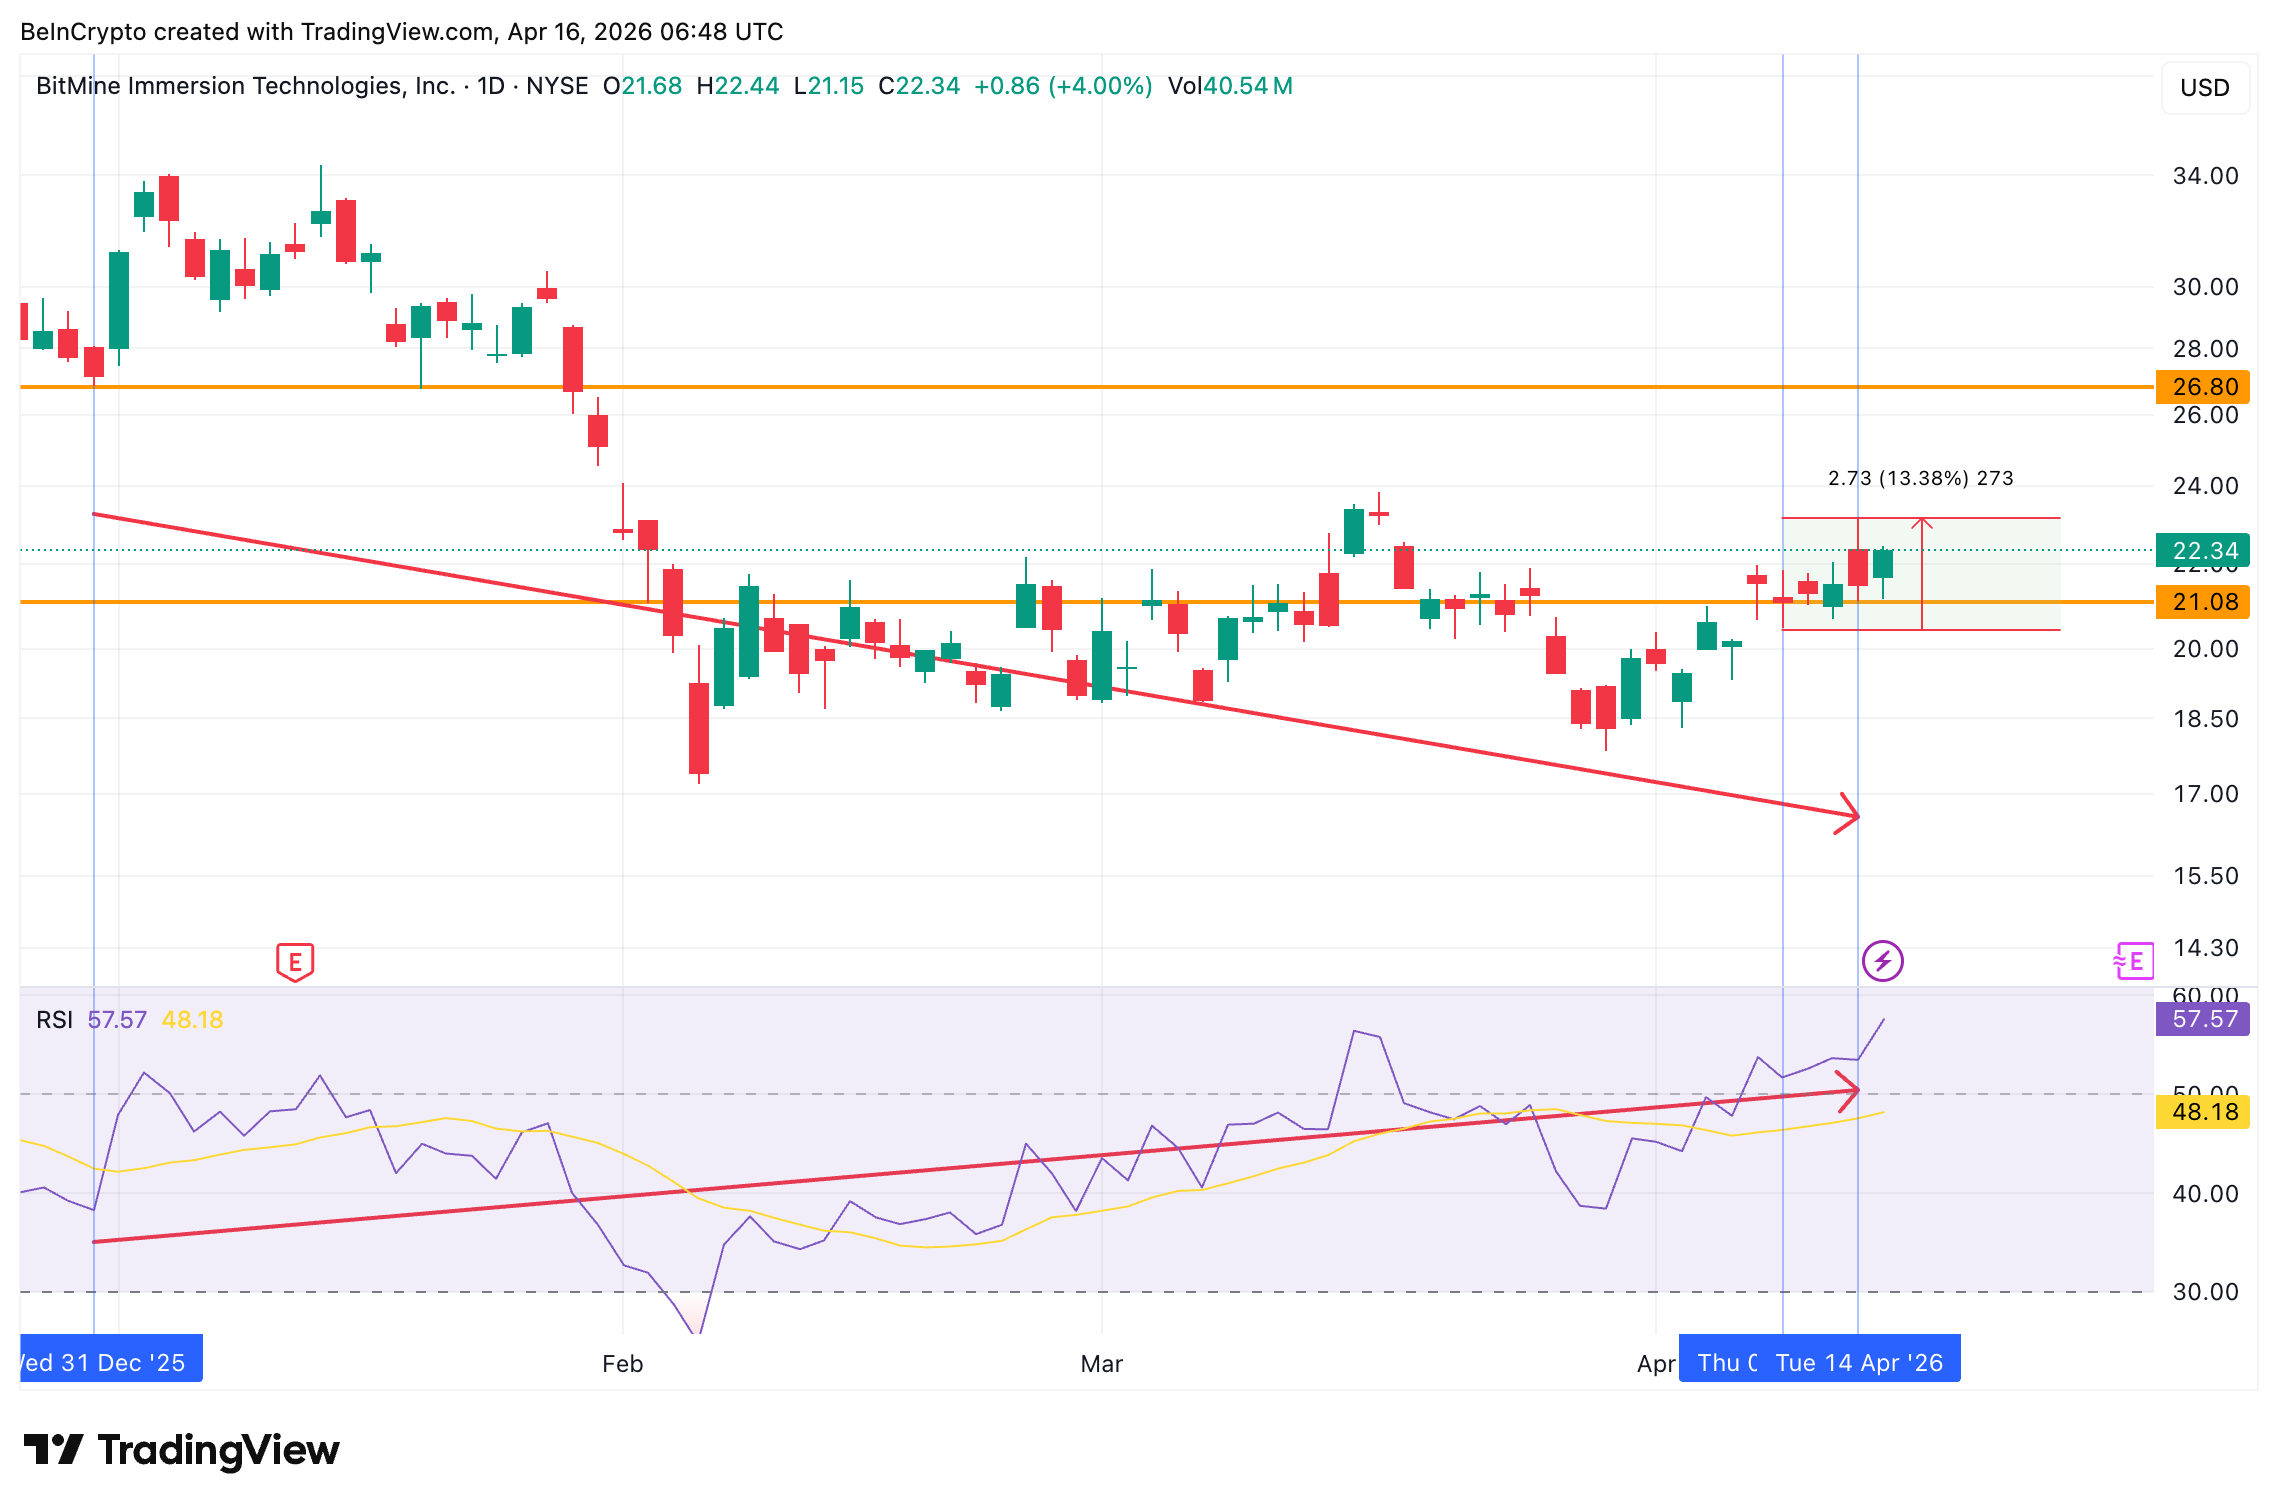
BMNR stock price has been declining since peaking in early January. However, the Relative Strength Index (RSI), a momentum indicator that measures the speed and size of recent price moves, is showing signs of a potential reversal.
Between December 31 and April 9, price made a lower low while the RSI made a higher low. That formed a standard bullish divergence, a signal that selling pressure is weakening. However, that divergence only led to a 13% price rise before the rally stalled.
A similar signal has now flashed between December 31 and April 14. Price again made a lower low while the RSI printed a higher low.
Want more insights like this? Sign up for Editor Harsh Notariya’s Daily Newsletter here.
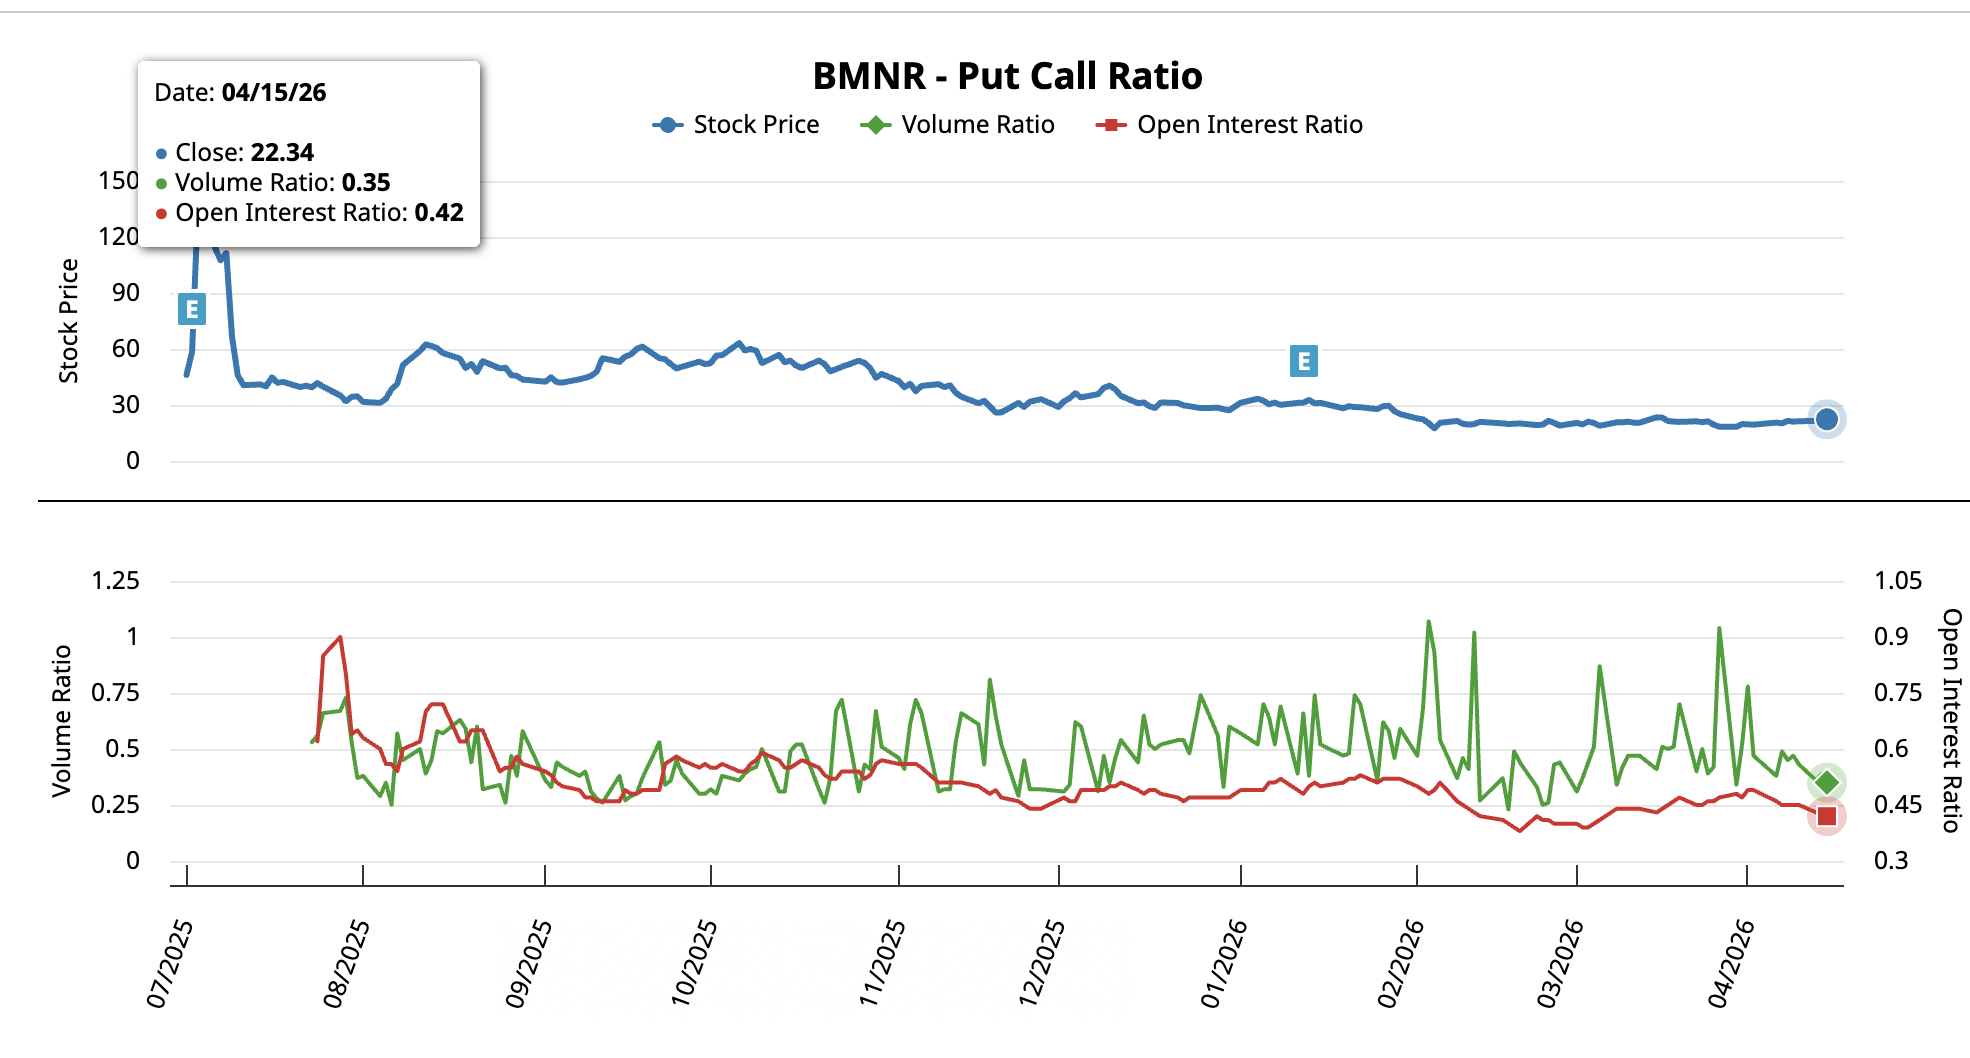
Options positioning on Bitmine stock supports the near-term shift. In late March, the put-call volume ratio, which compares bearish bets against bullish bets, stood at 1.04. That reflected nearly balanced positioning with a slight bearish tilt. As of April 15, it has dropped to 0.35, heavily favoring calls.
Open interest ratio fell from 0.47 to 0.42. That drop means existing bearish positions are being closed. New activity is favoring calls while old puts are being unwound.
The divergence and options data both point to short-term strength. However, a 13% bounce and a fade is exactly what happened last time. Whether this attempt succeeds depends on one metric that has refused to cooperate.
Institutional Money Flow Hasn’t Crossed the Zero Line
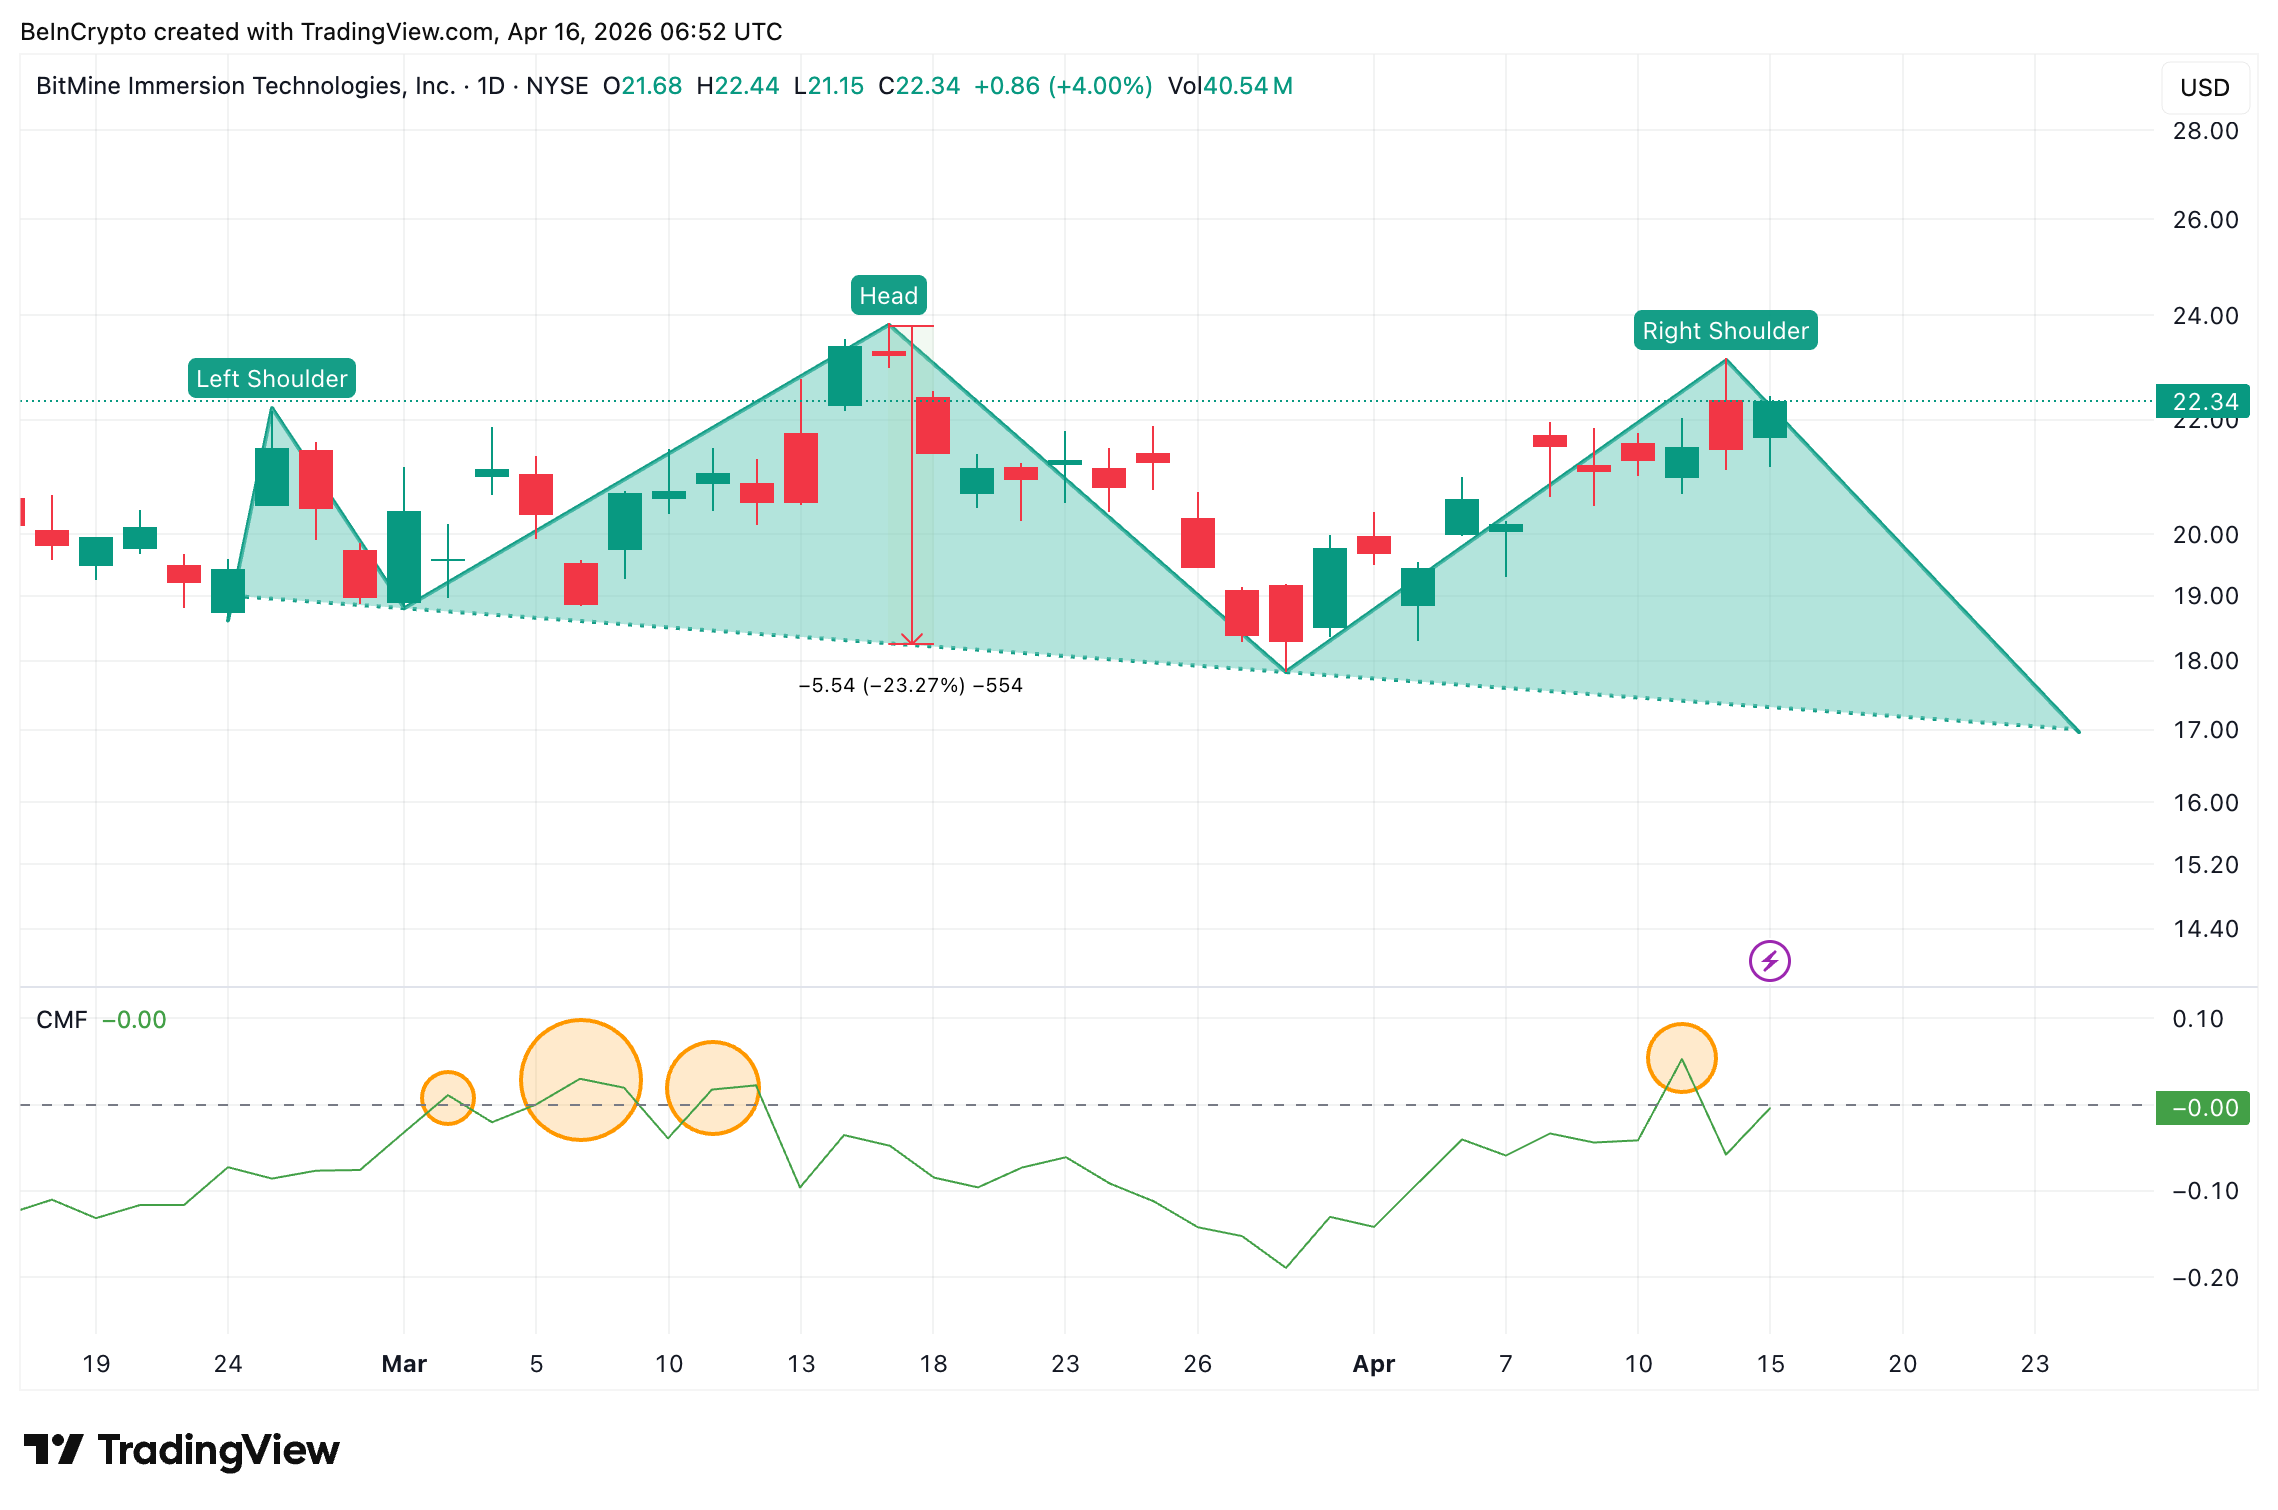
The Chaikin Money Flow (CMF), a proxy for institutional capital sits at 0.00 on the daily chart. It has barely touched the zero line and still leans on the negative side.
Since March, only a few brief instances of CMF crossing above zero have occurred. Each time, the reading quickly fell back below. That pattern means institutional capital has ridden brief bounces but has not committed to accumulating BMNR stock.
The broader structure explains why. The daily chart shows a head-and-shoulders pattern forming, a bearish formation. If the pattern completes, the measured breakdown projects a roughly 23% decline from the neckline.
The divergence says bounce. The CMF says institutions are not behind it. The head and shoulders says the larger structure remains bearish. That conflict is what makes the price levels ahead critical.
BMNR Stock Price Levels That Decide Between Bounce and Breakdown
The BitMine price chart maps where stock price either validates the divergence or confirms the bearish pattern.
A drop below $21.08 would invalidate the divergence. That was the swing low where the latest signal formed. Below that, $20.87, the 0.382 Fibonacci level, acts as the next floor. A loss of $19.46, the 0.618 Fibonacci, would suggest the CMF was right. From there, $17.17, the head-and-shoulders neckline, becomes the target. A neckline break projects a BMNR price decline toward $13.14.
Yet a daily close above $23.16 would reclaim the top of the current range. That move would weaken the right shoulder and give the divergence room to run. Beyond that, $23.86 is the head’s peak and the level above which the bearish pattern breaks entirely.
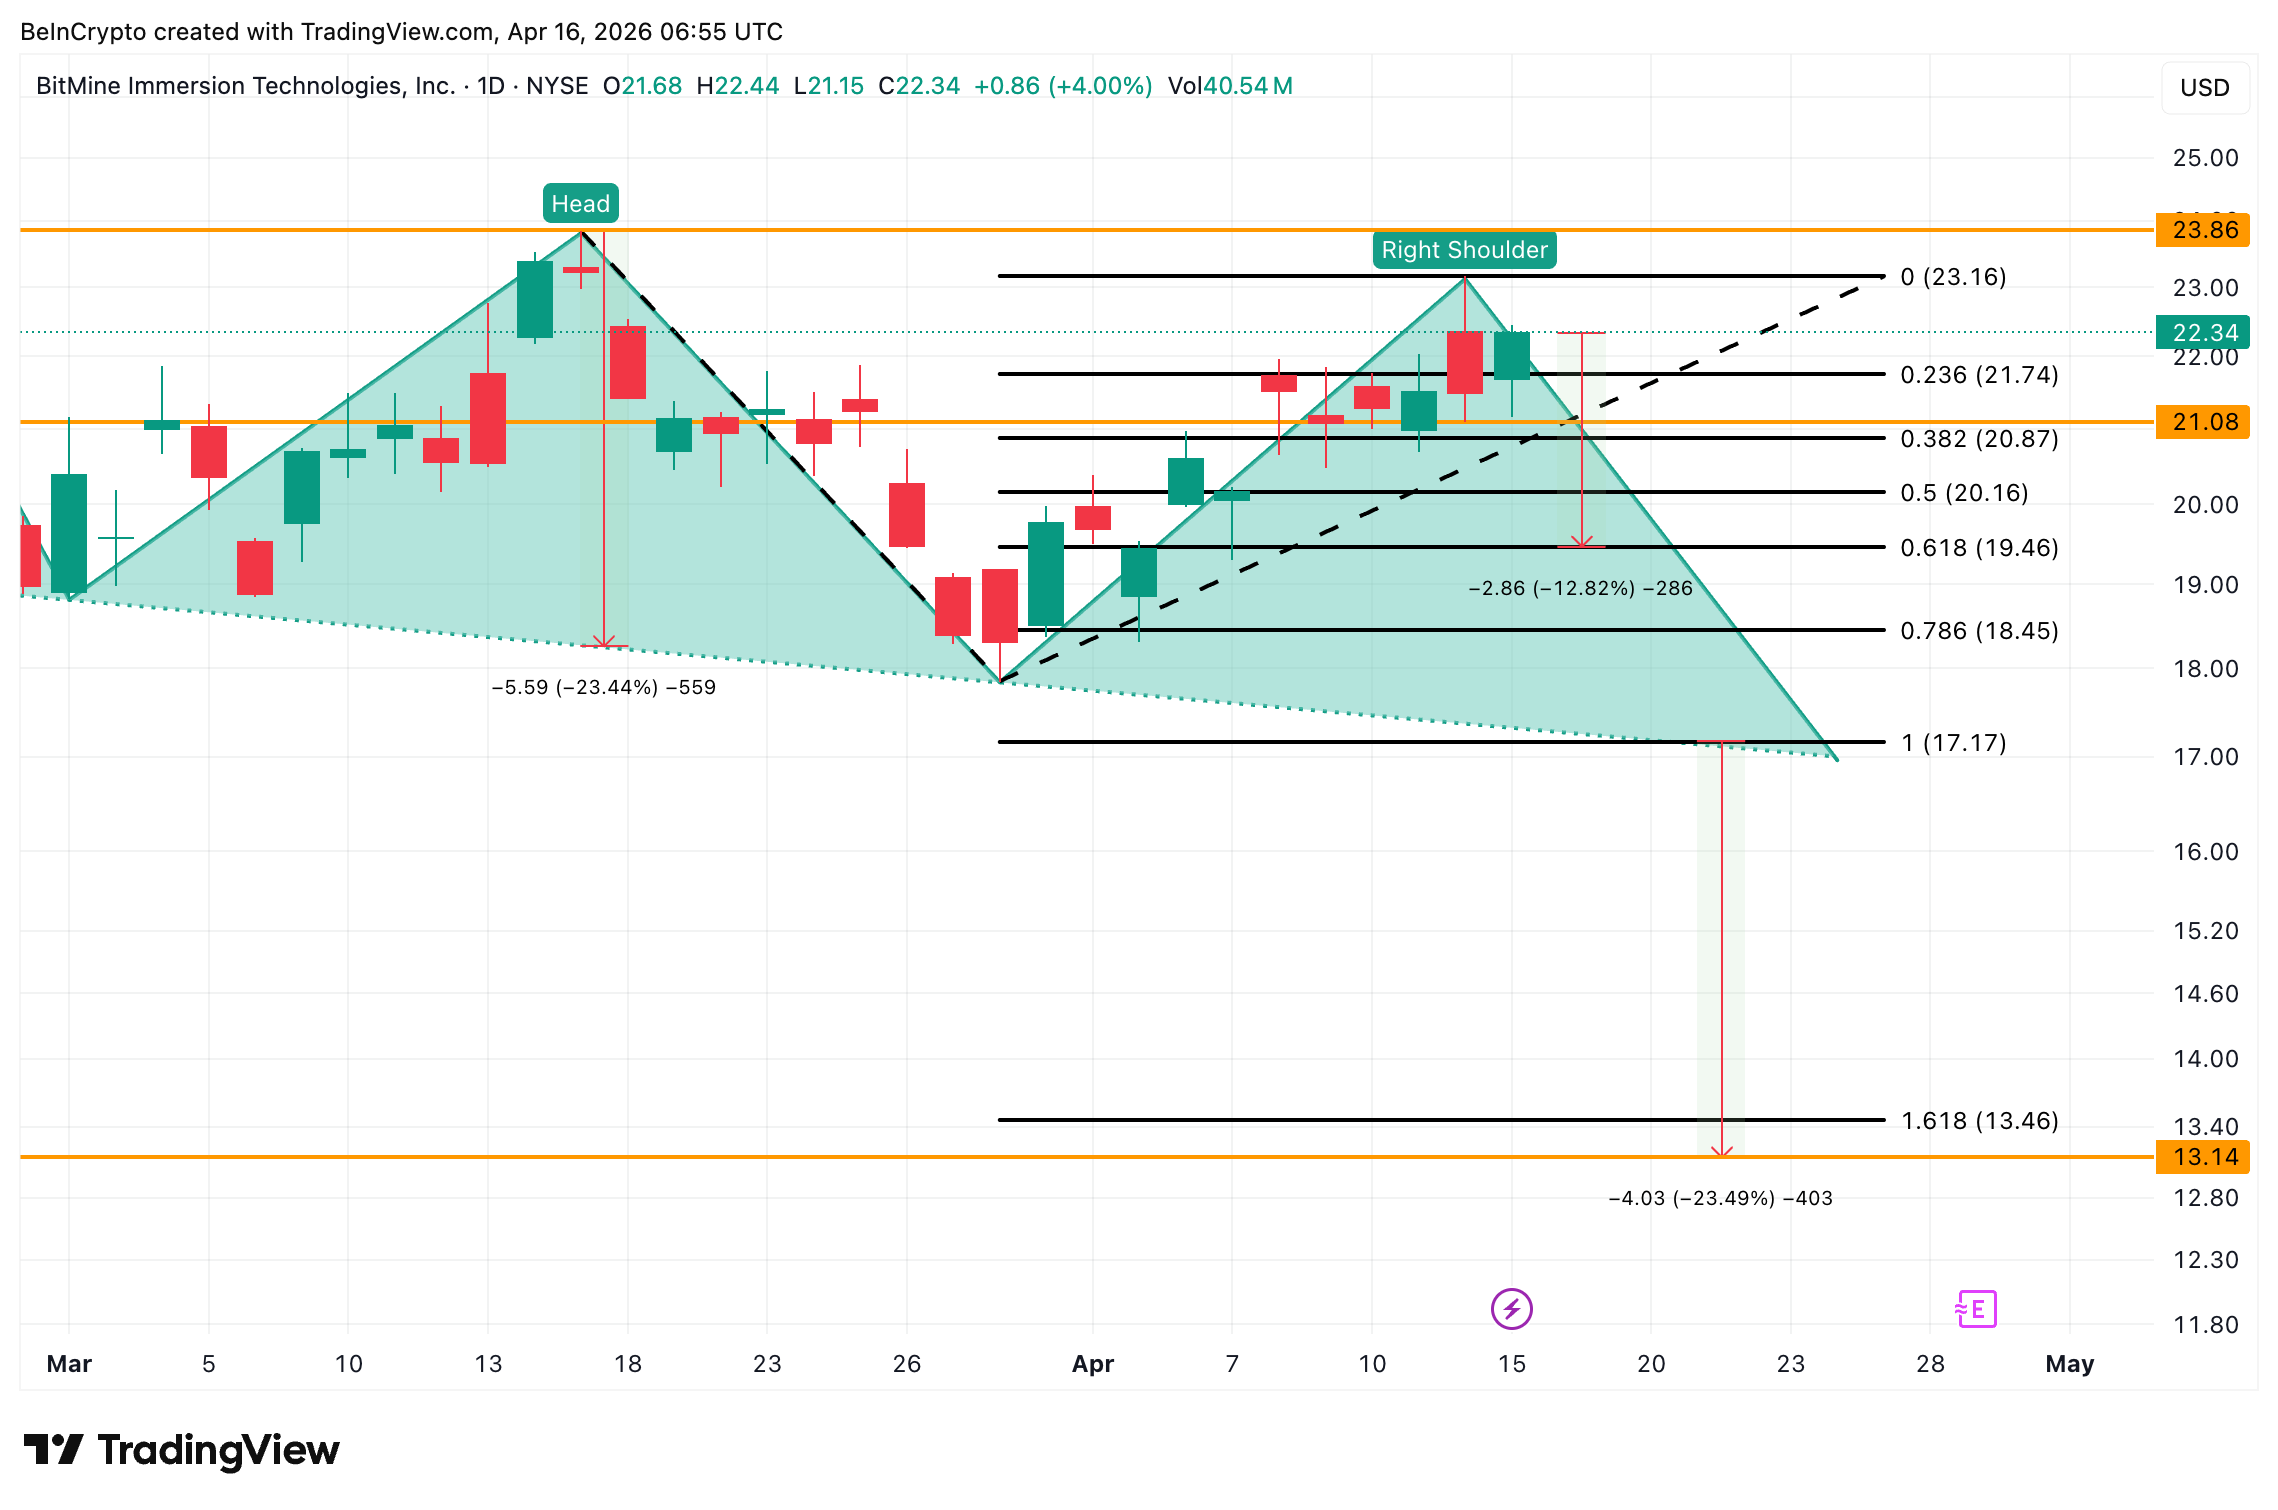
BMNR stock price at $23.16 separates a successful divergence from a repeat of the 13% fade. A close above it gives institutions a reason to follow. A drop below $21.08 hands the chart back to the head and shoulders.
The post A 13% Bounce Is All BMNR Stock Got Last Time: Can This Bullish Attempt Do Better? appeared first on BeInCrypto.


Key Highlights
- Major labor organizations caution that cryptocurrency legislation may jeopardize pension security.
- Upcoming Senate vote draws opposition from unions, financial institutions, and regulatory advocates.
- Retirement fund protection emerges as central issue in cryptocurrency policy debate.
- Stablecoin compensation provisions create additional controversy ahead of committee action.
- Labor coalition demands senators vote against legislation citing retirement account vulnerabilities.
A coalition of prominent labor organizations has launched a campaign against pending cryptocurrency legislation ahead of Thursday’s Senate Banking Committee decision. The unions contend that expanded digital currency regulations could leave worker retirement accounts vulnerable to cryptocurrency market instability. This opposition intensifies existing divisions among legislators already grappling with security questions, ethical considerations, and stablecoin governance.
Union Coalition Mobilizes Against Pending Legislation
Five major labor organizations—AFL-CIO, SEIU, AFT, NEA, and AFSCME—have called upon senators to reject the proposed legislation. Their primary focus involves protecting pension programs, public retirement systems, and savings vehicles that serve working Americans. The coalition insists on enhanced protective measures before lawmakers authorize broader cryptocurrency integration into mainstream finance.
These organizations contend the Crypto Bill would transfer market instability risks onto employees and pensioners. According to their analysis, cryptocurrency enterprises would gain expanded market entry while ordinary households shoulder potential financial damage. The groups emphasize that insufficient regulatory oversight could leave retirement portfolios increasingly exposed to volatile digital assets.
The Senate Banking Committee has scheduled its preliminary vote for Thursday following extended negotiations. Republican lawmakers have advocated for more defined market frameworks, whereas certain Democratic members continue pressing for enhanced safeguards. Yet the legislation’s final language remained unsettled as mounting pressure arrived from both labor and financial sector representatives.
Stablecoin Compensation Provisions Spark Additional Controversy
The proposed cryptocurrency legislation also encounters banking sector resistance regarding stablecoin reward mechanisms. Financial institutions contend that digital currency platforms could employ yield-similar incentives to attract deposits away from traditional banks. These institutions express concern that such provisions might erode deposit foundations and generate systemic stability risks.
Cryptocurrency industry representatives dispute these objections, noting that amended language would prohibit direct yield distributions. They maintain that activity-driven rewards differ fundamentally from conventional bank interest and advance payment system innovation. Nevertheless, this disagreement has positioned stablecoin governance among the legislation’s most contentious elements.
The proposed legislation seeks to establish more definitive frameworks for digital asset markets and payment tokens. Proponents argue that federal standardization could eliminate regulatory ambiguities and enable supervised industry development. Critics counter that Congress should not broaden cryptocurrency access without substantially stronger consumer and pension protections.
Retirement Security Takes Center Stage in Policy Debate
Labor organizations have reframed the cryptocurrency legislation as fundamentally a workplace and retirement security matter rather than purely market regulation. Their advocacy effort could sway Democratic legislators who depend on union backing during significant policy decisions. Additionally, it provides hesitant lawmakers additional justification to demand more rigorous amendments.
The AFL-CIO informed committee members that inadequate regulations could embed digital assets more deeply throughout the financial system. The federation further cautioned that platform operators and token issuers may gain disproportionate advantages over workers. This messaging reflects broader labor movement concerns regarding volatility, savings protection, and public pension fund exposure.
The cryptocurrency legislation now approaches Thursday’s committee vote facing intensifying pressure from multiple constituencies. Banking organizations seek strengthened restrictions, while labor unions demand clearer protections surrounding retirement accounts. Concurrently, cryptocurrency industry advocates maintain pressure on lawmakers to establish comprehensive federal regulation.


XRP exchange-traded funds (ETF) drummed up their biggest inflows since January amid a slew of developments at related company Ripple and favorable price action for the world’s fourth-largest token by market capitalization.
The five U.S.-listed spot XRP exchange-traded funds reported a combined $25.8 million in net inflows on Monday, the largest single-day haul since Jan. 5, when they drew $46 million in their first week of trading, according to SoSoValue data.
Franklin Templeton’s XRPZ led with $13.6 million, followed by Bitwise’s XRP at $7.6 million and Grayscale’s GXRP at $4.6 million. Canary’s XRPC and 21Shares’ TOXR reported no flows for the day.
Cumulative net inflows across all XRP spot ETFs now sit at $1.35 billion, with total net assets at $1.18 billion, representing about 1.3% of XRP’s market cap. Every XRP fund rose more than 4% on Monday alongside the underlying token, which climbed 1.2% over 24 hours to $1.47.
The flows come as Ripple announced the successful closing of a $200 million debt facility from funds managed by Neuberger Specialty Finance, the dedicated asset-based investment team within Neuberger, a global investment management firm.
The facility will support the continued growth of Ripple’s multi-asset prime brokerage platform, Ripple Prime, amid rising client demand for institutional-grade prime services and margin financing solutions.
Last week, Ripple said it completed a pilot tokenized U.S. Treasury settlement on the XRP Ledger with JPMorgan, Mastercard, and Ondo Finance, processing the redemption in under five seconds and bridging public blockchain rails with traditional interbank settlement infrastructure.
Separately, Ripple unveiled a four-phase plan to make the XRP Ledger quantum-resistant by 2028, positioning it for a potential “Q-day” when quantum computers can break current cryptography.
The roadmap included an emergency “Q-day readiness” phase that would force a migration to quantum-safe accounts and enable fund recovery using zero-knowledge proofs if quantum threats arrive sooner than expected.
Such institutional use cases may boost sentiment among ETF buyers, because they give XRP a function beyond speculative trading.
Meanwhile, spot bitcoin ETFs are on track for their seventh consecutive week of net inflows, with over $3.4 billion absorbed during the streak. The pattern of bitcoin leading, altcoin ETFs catching the spillover, and ether lagging behind has held through most of the year.
XRP remains down 39% over the past six months despite the ETF interest, with the token still well off its July 2025 all-time high near $3.65.


The developer of Claude has updated its terms of service, warning against the third-party sale or transfer of its private equity.

TLDR
- Pulse Biosciences (PLSE) shares climbed 16.8% Tuesday following a $13.3 million stock acquisition by two key executives.
- Co-Chairman Robert Duggan acquired 660,233 shares totaling approximately $13 million, while CEO Paul LaViolette purchased 15,000 shares for roughly $295,000.
- Both transactions occurred through the company’s at-the-market equity program during an approved trading period.
- The company specializes in nPulse nanosecond pulsed field ablation technology for atrial fibrillation treatment.
- Year-to-date performance shows PLSE shares climbing nearly 39%, with the company valued at $1.3 billion.
Shares of Pulse Biosciences (PLSE) rallied 16.8% Tuesday following the announcement that two top-level executives purchased a combined $13.3 million worth of company stock.
The transactions, executed by Co-Chairman Robert Duggan and CEO Paul LaViolette on May 11, 2026, took place during an authorized trading window established by the company.
At press time, shares were trading approximately 13% higher, pushing the year-to-date advance to around 39%.
Duggan dominated the buying activity, securing 660,233 shares for about $13 million. LaViolette contributed by acquiring 15,000 shares valued at approximately $295,350.
Collectively, the executives obtained 675,233 shares via Pulse Biosciences’ at-the-market offering program.
The ATM mechanism allows the company to issue shares directly into public markets. When executives use this avenue to purchase rather than the company to sell, it typically signals strong internal conviction about future prospects.
What Makes This Insider Activity Noteworthy
Insider acquisitions of this magnitude are uncommon. When two senior leaders collectively invest $13.3 million, markets typically pay attention — and respond accordingly.
The timing follows closely behind the company’s Q1 earnings release and new clinical data regarding its nPulse catheter technology.
Wall Street reactions to those developments were split. Some analysts highlighted encouraging clinical performance in European markets and accelerated U.S. pivotal trial schedules. Others pointed to negligible revenue generation, expanding losses, and significant cash consumption.
Despite generating limited commercial sales, Pulse Biosciences commands a $1.3 billion market capitalization.
Understanding PLSE’s Core Business
The company’s flagship technology leverages nanosecond pulsed field ablation — administering extremely brief electrical pulses to eliminate targeted cells while preserving adjacent tissue structures.
Its main therapeutic focus addresses atrial fibrillation, a widespread cardiac rhythm abnormality.
Management has prioritized expediting its U.S. regulatory pathway, with European feasibility trial results serving as an encouraging indicator according to industry analysts.
Daily trading volume for PLSE averages approximately 294,600 shares. Current technical analysis indicators signal a “Strong Buy” rating.
TipRanks’ AI model assigns PLSE a Neutral rating overall, noting that financial weaknesses are counterbalanced by a healthy balance sheet and promising clinical development pipeline.
With a year-to-date gain approaching 39%, the stock significantly outperforms broader market indices as 2026 reaches its midpoint.
The Senate Banking Committee released a 309-page text of the Digital Asset Market Clarity Act of 2025 (CLARITY Act), expanding the January 278-page draft.
The text arrives ahead of a key Thursday markup vote. Committee members have until tomorrow to submit amendments before the 10:30 AM ET executive session.
Follow us on X to get the latest news as it happens
What Changed in the Clarity Act Draft
The CLARITY Act cleared the House back in July 2025 with broad bipartisan backing and has since been working its way through extended Senate negotiations. The January text faced significant pushback and ultimately stalled, with the treatment of stablecoin yield emerging as a central sticking point.
Then, earlier this month, Senators Thom Tillis and Angela Alsobrooks unveiled a bipartisan compromise on stablecoin rewards. The May rewrite preserves the nine-title structure but expands the bill by 31 pages.
The Tillis-Alsobrooks compromise allows regulated stablecoin issuers to offer certain forms of yield or rewards, but under tighter limits and oversight designed to stop stablecoins from functioning like unregulated bank deposits or securities.

Section 404 now contains the Tillis-Alsobrooks compromise. The bill also adds a new Section 109 that applies insider trading laws.
Another new addition is the Section 702 Insolvency Safe Harbor, which allows counterparties to close out digital commodity positions and access collateral outside standard bankruptcy proceedings (mirroring protections already available for conventional derivatives).
Section 906 Effective Date, which sets a general 360-day effective date after enactment, with rulemaking-dependent provisions taking effect either 360 days after enactment or 60 days after the final rule is published, whichever comes later.
“One interesting worth noting now is the inclusion of the Build Now Act (sec 904),” Alex Thorn, Head of Firmwide Research at Galaxy Digital, wrote.
Moreover, the bill includes substantial revisions to Title I (Sections 102, 104, and 108).
However, the bill, like its January counterpart, leaves ethics provisions as the remaining sticking point. Elizabeth Warren has stressed that ethics safeguards that would prevent senior government officials from financially benefiting from cryptocurrencies remain a priority.
Subscribe to our YouTube channel to watch leaders and journalists provide expert insights
The post Senate Banking Drops New 300-Page CLARITY Act Draft: What’s Changed Since January appeared first on BeInCrypto.

Kraken introduced Flexline, a lending product that accepts cryptocurrency as collateral at 10–25% APR fixed rates, targeting crypto-native businesses and high-net-worth individuals excluded from traditional banking.


Payward, the parent company of crypto exchange Kraken, is working with asset manager Franklin Templeton to expand the use of tokenized financial products for institutional investors.
The companies said Tuesday they will develop a range of blockchain-based investment offerings, including tokenized yield products, tokenized equities and custody services tied to digital assets.
The move comes as large financial firms explore testing tokenized versions of conventional assets. BlackRock, Fidelity and JPMorgan have all expanded blockchain-related financial products over the past two years, particularly tokenized Treasuries and money market funds.
Tokenization refers to representing traditional financial assets such as stocks, bonds or money market funds on blockchain networks, where they can be traded and settled digitally. Supporters argue the approach can reduce settlement times, expand market access and allow assets to move more easily between financial platforms.
The collaboration joins two firms that have taken different routes into tokenized finance. Franklin Templeton has spent years building blockchain-based investment products. Payward has focused on crypto trading infrastructure through Kraken and its xStocks tokenized equities platform, which the company says has processed more than $30 billion in trading volume since starting up in 2025.
The firms plan to explore actively managed tokenized investment products that could trade onchain and become available to institutional investors and, in some jurisdictions, retail Kraken users.
Kraken also plans to integrate BENJI, Franklin Templeton’s suite of tokenized money market funds, into its platform. The funds could serve as collateral or cash management tools for institutional trading clients seeking blockchain-based alternatives to traditional treasury operations.
Analysts view tokenized Treasury funds as one of the fastest-growing sectors in digital assets because they offer yields tied to government securities while operating on blockchain rails. In practice, that can allow institutions to move collateral around the clock instead of waiting for banking hours or multiday settlement periods.
Read more: Kraken parent Payward seeks fresh funding at $20 billion valuation ahead of planned IPO


Blockchain analytics firm Elliptic said it raised $120 million in fresh funding from investors including Nasdaq Ventures and Deutsche Bank as financial institutions ramp up spending on crypto compliance and security infrastructure.
The fundraising round, led by growth equity firm One Peak, values the London-based company at $610 million, according to a Tuesday press release. The British Business Bank also participated.
The investment comes as crypto markets face a wave of security breaches and exploits that have exposed weaknesses in both decentralized finance (DeFi) protocols and centralized platforms. Hackers have stolen nearly $3 billion in crypto assets since the beginning of 2025 through smart contract exploits, phishing attacks and cross-chain bridge breaches, and regulators are pushing exchanges and banks to tighten anti-money laundering controls.
As a result, blockchain analytics firms have become critical infrastructure providers for institutions entering the digital asset industry. Elliptic’s software tracks crypto transactions across dozens of blockchains and flags wallets linked to sanctions, fraud, ransomware or illicit finance.
Banks, exchanges and government agencies use these tools to monitor transactions and comply with financial crime rules. The company said two-thirds of global crypto trading volume flows through exchanges that already use its services.
Demand for those systems has accelerated alongside the growth of stablecoins and tokenized assets, which are increasingly moving into mainstream finance. Stablecoins accounted for roughly $33 trillion in transactions last year, according to the company.
Large financial firms are also exploring tokenized securities and blockchain-based settlement systems, raising the stakes for compliance providers that can monitor activity across public blockchains in real time. At the same time, artificial intelligence (AI) tools are making attacks cheaper and faster, forcing a rethink of how crypto systems stay secure.
Elliptic said the new funding will be used to expand its AI-driven monitoring and risk analysis tools as institutional adoption of digital assets grows.
“One of the things that we will be accelerating with the funding is our agentic product roadmap,” CEO Simone Maini told CoinDesk. “What that means is building and launching agents that sit on top of Elliptic’s dataset to be able to automate a lot of what is otherwise highly manual, repetitive tasks performed by compliance analysts.
“That means those that that those precious resources can be redeployed to deep diving and investigating financial crime where they need to,” she said.


BlackRock has filed for a new tokenized fund structure with the SEC, selecting Securitize infrastructure for the second time after BUIDL’s $2.3B success.
Crypto World
The battle for the digital euro is heating up as central bankers clash over how to take on Tether


France’s central bank deputy governor called Tuesday for the “mobilization of all relevant European players, public and private,” to develop tokenized money.
Beau’s comments are in stark contrast with European Central Bank (ECB) President Christine Lagarde’s recent speech in which she said that “the case for promoting euro-denominated stablecoins is far weaker than it appears.”
While Lagarde described the $310 billion privately-issued stablecoin market, currently dominated by Tether’s USDT and Circle’s USDC, as instruments that “risk amplifying the very vulnerabilities we are trying to overcome,” Beau told CoinDesk that private sector solutions are necessary for the region’s economic development.
The different views, however, reveal a growing concern in Europe over the “digital dollarization.” With a stablecoin sector projected to rise to the trillions of dollars in the coming years, a lack of euro-pegged currencies could force European capital into dollar-backed assets, potentially eroding the euro’s global influence and monetary sovereignty.
“To ensure a sound development of tokenized finance in Europe, its payment and settlement asset pillar should be in euro and build on the solid foundation of our current two-tier monetary system,” Beau said in an interview with CoinDesk.
The central banker outlined a “triple objective” for the region, which requires the European Union (EU) to adapt central bank money services, develop “pan-European solutions in tokenized private money issued by regulated financial institutions,” and strengthen the bloc’s Markets in Crypto-Assets Regulation (MiCA).
Beau’s stance aligns with Qivalis
Beau’s stance aligns with Qivalis, a group of 12 major European banks, including ING, BBVA, and BNP Paribas, which plans to launch a private digital euro later this year.
Qivalis CEO Jan-Oliver Sell recently told CoinDesk that without a liquid onchain euro, “the only alternative is the U.S. dollar,” which he described as a “risk to Europe’s financial and digital sovereignty.”
Lagarde agrees with the need for digital asset alternatives to dollar-pegged stablecoins, warning that USDT and USDC pose “financial stability risks” for Europe and could “transmit stress to the underlying asset markets during periods of turmoil.”
However, while Beau advocates for immediate private-sector mobilization to capture market share, Lagarde favors a central bank digital euro, which in previous statements she suggested would be ready by 2029.
Beau noted that the Eurosystem is already moving to provide native settlement options. “A first deliverable will become available by the end of this year, with the opening of our wholesale central bank money service in tokenized form,” he said, referencing projects such as Pontes.
The opposing views between Lagarde and Beau come as U.S. dollar-pegged tokens account for 98% of the stablecoin market.
While Lagarde argues that stablecoins, “do not confer the unconditional finality that central money does,” Beau maintains that public and private efforts “should complement and support each other” to ensure the euro remains a viable settlement instrument in an increasingly tokenized global economy.

Zendaya Was ‘Buried Up To Her Neck’ For Dramatic Euphoria Season 3 Stunt

MOSH raises $13 million
Labor Groups Sound Alarm: Crypto Legislation Threatens Worker Retirement Funds
Manchester United reach agreement with Casemiro over contract clause amid transfer speculation

US brings back mandatory military draft registration

Steven Gerrard disagrees with Gary Neville over ‘shock’ Chelsea and Arsenal claim | Football


-
 Crypto World4 days ago
HarrisX Poll Found 52% of Registered Voters Support the CLARITY Act
-

 Fashion4 days ago
Weekend Open Thread: Marianne Dress
-

 Crypto World5 days ago
Upbit adds B3 Korean won pair as Base token gains Korea access
-
 NewsBeat5 days ago
NCP car park operator enters administration putting 340 UK sites at risk of closure
-

 Fashion21 hours ago
Coffee Break: Travel Steam Iron
-

 Fashion2 days ago
What to Know Before Buying a Curling Wand or Curling Iron
-

 Tech2 days ago
Auto Enthusiast Carves Functional Two-Stroke Engine from Solid Metal
-

 Politics17 hours ago
What to expect when you’re expecting a budget
-

 Politics3 days ago
Politics Home Article | Starmer Enters The Danger Zone
-
 Business3 days ago
Ignore market noise, India’s long-term story intact, say D-Street bulls Ramesh Damani and Sunil Singhania
-

 Tech1 day ago
GM Agrees To Pay $12.75 Million To Settle California Lawsuit Over Misuse Of Customers’ Driving Data
-

 Crypto World6 days ago
BlackRock CEO Larry Fink Discusses a New Asset Class
-

 Entertainment5 days ago
Sarah Paulson Called Out For Met Gala ‘Hypocrisy’
-
 Sports6 days ago
NBA playoff winners and losers: Austin Reaves is not loving Lakers vs. Thunder matchup, but Chet Holmgren is
-

 Entertainment6 days ago
Bold and Beautiful Early Spoilers May 11-15: Steffy Revolted & Liam Overjoyed!
-

 Entertainment5 days ago
General Hospital: Ric & Ava Bombshell – Ric’s Massive Secret Exposed!
-

 Crypto World5 days ago
Robinhood says Wall Street is building onchain
-

 Politics5 days ago
Simon Cowell Says He Was ‘Horrible’ To Susan Boyle During BGT Audition
-

 Sports5 days ago
UEFA Champions League final schedule, teams, venue, live time and streaming | Football News
-

 Tech7 days ago
Apple and Samsung are dominating smartphone sales so thoroughly that only one other company makes the top 10
You must be logged in to post a comment Login