

Crypto World
Aave community rallies behind V4 Ethereum deployment


Aave’s community has moved a step closer to launching V4 on Ethereum after a governance proposal won near-unanimous backing. The result points to broader support for the upgrade after several weeks of public tension inside the DAO and the exit plans of key contributors.
Summary
- Aave DAO strongly backed V4, moving the protocol closer to Ethereum mainnet deployment.
- The vote followed governance tension and exit plans from key Aave contributors recently.
- Aave V4 introduces modular hubs and spokes for shared liquidity and tailored risk.
A Snapshot vote on Monday showed more than 645,000 votes in favor of moving Aave V4 toward Ethereum mainnet deployment. Fewer than one vote opposed the plan, and there were no abstentions, according to reporting on the outcome.
The vote does not activate the system on its own. Aave founder Stani Kulechov said the proposal is expected to advance to an Aave Improvement Proposal, which would be the binding onchain vote needed to deploy and activate V4 on Ethereum.
Aave Labs presented V4 as a protocol built around a hub-and-spoke structure. Under that model, shared liquidity sits in “Hubs,” while “Spokes” define separate borrowing markets with their own limits and risk settings.
Aave Labs said this structure is meant to keep the benefits of shared liquidity while giving the protocol tighter control over risk across different markets. The design is also intended to support a wider range of use cases, including new collateral types and structured credit markets.
Governance tensions shaped the backdrop
The strong support for V4 follows a period of strain inside Aave governance. In a forum post published on February 20, BGD Labs said it would end its involvement with Aave after nearly four years, citing an “asymmetric organizational scenario” and what it called an “adversarial position” toward its work on V3.
That dispute widened in early March when the Aave Chan Initiative said it would not seek renewal of its engagement with the DAO. Marc Zeller wrote that ACI would wind down over four months after a clash over funding, governance standards, and voting dynamics.
In addition, the latest vote suggests the DAO is now more aligned on the path forward for V4. It also gives Aave Labs a clearer route to seek final approval for Ethereum mainnet activation through the next governance stage.

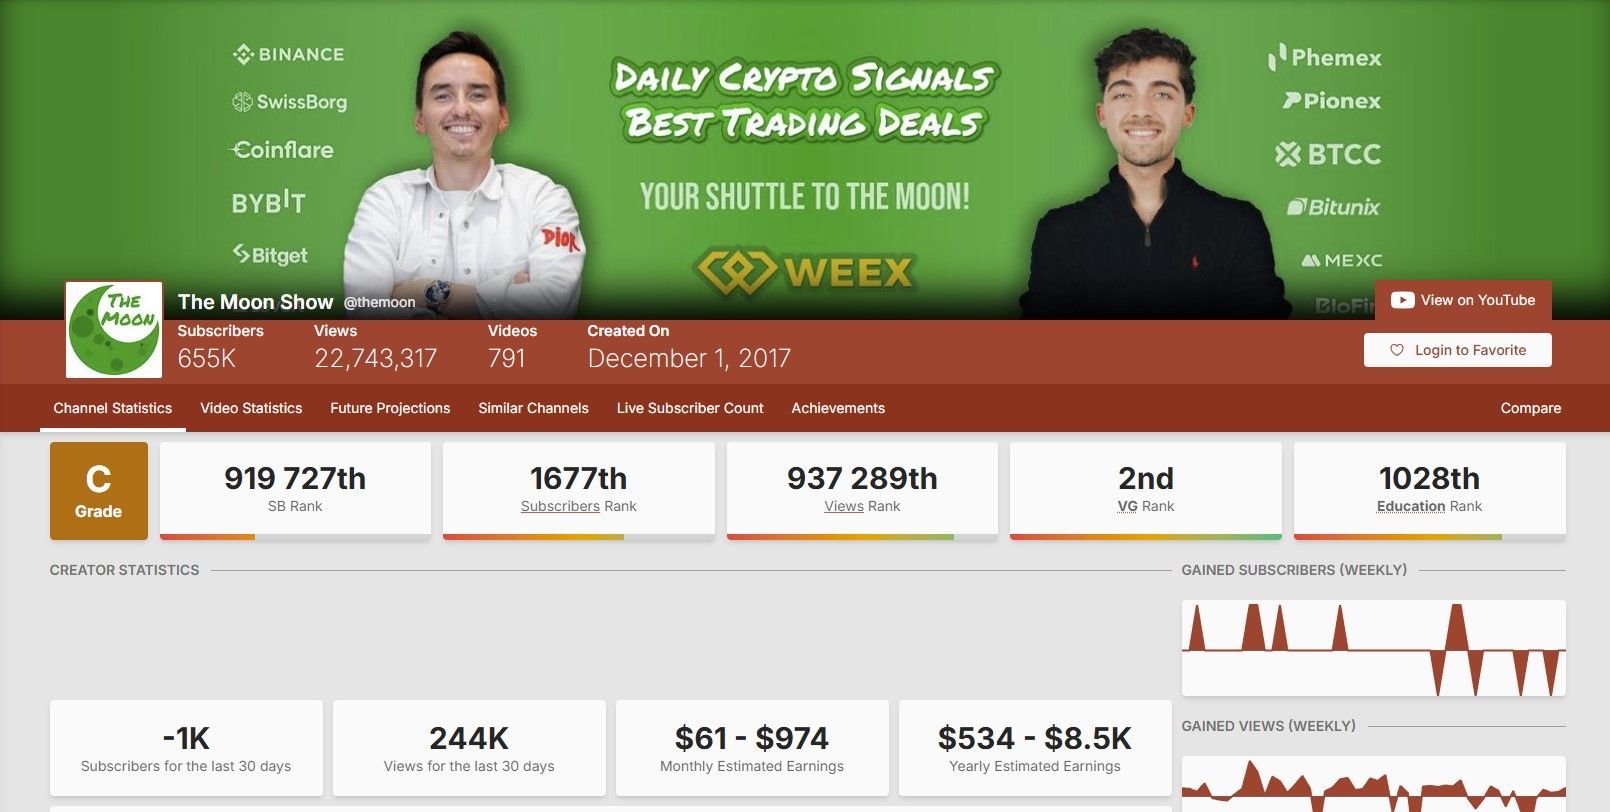
Carl Runefelt remembers a different YouTube. The Swedish creator, known to his 650,000 subscribers as Carl Moon, has been making crypto videos since 2017, and he says this bear market has produced a viewership collapse he could not have predicted.
In an interview with BeInCrypto, Runefelt described the moment plainly.
“Even like back in 2018 bear market, like at the low of the bear market, I had more than double the views that I have right now.”
That single line captures a structural reality that the entire crypto creator economy is now wrestling with. Crypto YouTube, once the dominant retail discovery channel for the asset class, is facing its worst crisis to date.
The numbers, platform behavior, industry layoffs, and search trend data all point in the same direction.
The Platform Turning Hostile
In April 2026, YouTube removed multiple crypto channels in a sweep that the platform justified as targeting “harmful and dangerous” content.
The purge wiped out roughly 35 million combined subscribers across affected creators, including Bitcoin.com’s flagship channel, which had been active since 2015.
For top creators still standing, the platform that built crypto YouTube is no longer a reliable home for it. Runefelt described the broader pattern.
“I’ve checked other channels and it seems to be the same across the board. Like it’s very few YouTube channels that are still actually pulling some good views.”
He emphasized that the squeeze is not isolated to his channel and that he has been making YouTube videos since 2017 across multiple cycles. None of his previous bear markets produced this kind of viewership collapse.
The View Collapse, in Numbers
In a separate appearance on the Matt Haycox Show podcast in late 2025, Runefelt put specific numbers to the decline. During the 2021 cycle peak, his videos routinely pulled 100,000 to 200,000 views each.
By early 2026, with Bitcoin trading near $76,500, that range had collapsed to roughly 15,000-20,000 views per upload.
For perspective, his views during the 2018 bear market low were more than twice what he records today, despite seven additional years of channel growth and subscriber accumulation. The trajectory is not typical for a bear market dip. It is a structural step down.

Carl’s Diversification
Faced with that landscape, Runefelt has been openly redirecting his attention. He told BeInCrypto he is now focusing significant energy on motorsport racing and music.
“I’m also focusing my energy on other things outside of crypto… motorsport racing nowadays. And I’m also focusing on my music because I love making music.”
The framing is not despair. It is adult triage.
“Life is too short to struggle bear markets, you know, 24/7. I’ve done a few of those already, and I want to also have fun before it gets too old.”
Runefelt is not leaving crypto. He still publishes regularly and continues to invest in startups through TheMoon Group, which has backed more than 350 projects. But after seven and a half years of channel growth that has now reversed, his decision to diversify his identity beyond crypto creator is the most honest data point in the entire interview.
Apathy as a Measurement
The view collapse is not just a vibes problem. It is now empirically measurable, and Benjamin Cowen, founder of Into The Cryptoverse, has been the loudest voice arguing the data.
Cowen’s Bitcoin Social Risk chart, published to his X account, color-codes Bitcoin price history by social engagement intensity.
In the 2017 and 2021 cycle tops, the chart prints in bright reds and oranges, signaling extreme retail engagement. The 2025 top, at much higher absolute Bitcoin prices, prints in cold blue, signaling low engagement.

As Cowen has framed it in his BeInCrypto coverage, this cycle topped on apathy rather than euphoria.
The implication for creators is direct. There was never an euphoric audience peak in this cycle, which means the views creators built their business plans around in 2021 may have been a historical anomaly, not a bear-market lull.
Google Trends data supports the same conclusion. Worldwide search interest in “Bitcoin” has trended near one-year lows for much of early 2026, despite spot prices well above $70,000.

The Industry-Wide Pain
Runefelt flagged a broader pattern in the interview that has since hardened into hard news.
“Even the exchanges, usually exchanges are the only ones making money, but I’ve seen even many exchanges are struggling, doing big layoffs and even a couple of them going bankrupt.”
The data quickly caught up to his observation.
In May 2026, Coinbase announced it would cut approximately 700 jobs, or 14% of its workforce, following a $667 million net loss in Q4 2025 and a 21.6% year-over-year revenue decline.
Crypto.com announced its own 12% workforce reduction in March 2026, eliminating roughly 180 positions. The smaller exchange, Bit.com, confirmed a phased shutdown from December 2025 to March 2026.
Beyond the trading platforms, the contraction has spread across the crypto labor market.
Crypto job postings have fallen approximately 80% year-over-year, with major announcements at Gemini, Algorand, Block, MARA Holdings, OKX, MANTRA, Polygon Labs, and Messari layered on top of the exchange cuts. The decline is structural, not seasonal.
David Wulschner’s Counter-View
David Wulschner, the host of the German-language Crypto Familie channel, sees the same conditions through a different lens. He launched his channel in mid-2022, near the bottom of the prior cycle.
“I just founded my channel mid of 2022, when we were really at the bottom of the cycle, and that was a lot of fun.”
The hardest challenge for newer creators in this bear market has not been view drops but community emotional pressure.
“What was really hard for me as a new content creator in that bear market was the emotions, the feedback, and that what you get thrown into your face by the community.”
Wulschner sees the bear market as the work phase, not the marketing phase.
“Profit is not done in the bull market. You set your goals, you set your foundation, you set your anchor positions in your portfolio in the bear market.”
That framing is not contradictory with Runefelt’s. The veteran and the newcomer have arrived at the same conclusion from opposite directions. Both treat the current environment as a reset rather than an ending.
The Shake-Out
In the interview, Runefelt did not present the crypto YouTube collapse as a tragedy. He framed it as a structural cleanse.
“That’s usually what we need to shake out all the bad stuff, all the scams, and all the people that are not here for the vision. They’re only here for the quick money. So getting rid of that before we go back up, it’s just part of the cycle.”
The creators who survive this cycle will likely be the ones who can adapt their business model below the 2018 baseline of views, broaden their content beyond price predictions and pump speculation, or, as Runefelt is doing, diversify their identity beyond the crypto-creator label.
Crypto YouTube is not dying. It is downsizing, and the shape that emerges on the other side will look very different from the cycle creators built businesses around four years ago.
Carl Moon, the man who turned a Stockholm supermarket job into one of the most-watched crypto channels in the world, will probably still be there. He will just be making music and racing cars on the side.
The post Crypto YouTube Crisis: “Even at the 2018 Bear Market, I Had Double the Views” appeared first on BeInCrypto.
Bitcoin held a delicate line at the start of the week, contending with a stubborn ceiling near $84,000 while trying to defend a crucial lower area around the 20-day exponential moving average. Bulls remain in command only so long as price sits above key support, but a pattern of risk emerging from the 200-day EMA adds a cautionary undertone. In a note that underscores the sentiment-versus-technical-signal tension, Santiment reported the bullish-to-bearish comment ratio on social media sits around 1.5 to 1, suggesting the rally could fade if confidence wanes. At the same time, investors have shown persistent interest in the space, with six straight weeks of net inflows into U.S. spot Bitcoin exchange-traded funds—the longest streak since August 2025—hinting that institutional buyers may be steadily re-engaging despite the near-term volatility.
Against this backdrop, traders are watching how Bitcoin’s price action interacts with a broader macro mosaic. The stock market has carried the risk-on mood, with the S&P 500 climbing to fresh highs, while the U.S. dollar index (DXY) has struggled to gain momentum, trading within a wide range and flirting with critical moving-average thresholds. The convergence of these dynamics—bullish liquidity for crypto influencers and a still-choppy macro environment—sets up a fragile equilibrium that could tip in either direction in the near term.
Key takeaways
- Bitcoin is testing resistance near $84,000 while its 20-day EMA sits around $78,852; a hold at the EMA keeps the bullish thesis intact, but a break could open a path toward the 50-day SMA at about $74,191.
- A rejection at the 200-day EMA around $82,039 has a historically sharp downside read, with prior rejections since November 2025 followed by drawdowns of 25%–36% and a notional risk of around a 30% slide toward $56,000 if history repeats.
- Six straight weeks of net inflows into U.S. spot BTC ETFs point to continued institutional interest, providing a counterweight to near-term volatility.
- S&P 500 has extended its uptrend to record levels, while the DXY remains range-bound; a sustained break above or below key levels could reframe risk sentiment and crypto correlations.
- Among the top altcoins, several charts imply a mix of potential breakouts and ongoing resistance: ETH faces continued headwinds under $2,465; XRP eyes a breakout above a downtrend line toward $1.61 and possibly $2; and SOL, BNB, DOGE, HYPE, and ADA each show critical thresholds that could define the next leg of moves.
Bitcoin charts: 84k resistance and the 20-day EMA under the spotlight
The BTC/USD pair has once again run into the overhead zone around $84,000, suggesting that the up-move lacks broad-based strength as bears defend higher levels. The immediate psychological and technical focal point remains the 20-day EMA, which sits near $78,852. A resilient bounce off this level would reinforce the notion that buyers still control the near-term trajectory and could pave the way for an uphill push toward $92,000, followed by a potential test of $97,924.
Beyond price action, a longer historical frame weighs on the risk narrative. Since November 2025, each rejection at the 200-day EMA has been followed by sizable drawdowns. If that pattern plays out again, a decline toward roughly $56,000 would be plausible, underscoring why traders are wary of assuming a quick, unimpeded recovery. The combination of a strong pro-bull sentiment in some quarters (as reflected by the six-week ETF inflow streak) with a potential macro-induced pullback creates a scenario where downside risk and upside potential are tightly balanced.
From a sentiment standpoint, the social-media signal remains a mixed guide. Santiment’s data highlighted a bullish-to-bearish commentary ratio of about 1.5:1, implying that enthusiasm could be prone to erosion should skepticism rise among traders and fund managers. In practical terms, the price action around the 20-day EMA and the sharpness of any subsequent move above or below $84,000 will likely determine whether the market transitions into another leg higher or retests lower-support zones.
Macro backdrop: SPX momentum and dollar dynamics in play
Equity markets added another chapter to the ongoing risk-on narrative, with the S&P 500 advancing to new highs. The strength in equities suggests a favorable environment for risk assets, including crypto, at least in the near term. Yet the breadth and sustainability of this trend depend on several checks: the RSI signals that the move may be entering an overbought phase, while price action remains vulnerable near key moving-average horizons that can trigger pullbacks if broken.
On the currency front, the U.S. Dollar Index has yet to decisively push higher, failing to clear the 20-day moving-average threshold around 98.40. If selling pressure intensifies, a slide toward the 96.21 support level could unfold, potentially widening the range of 95.55 to 100.54 that has characterized DXY lately. Conversely, a decisive move above the 50-day simple moving average near 99 could renew a rally toward the 100.54 ceiling, implying a broader pullback in risk assets and a renewed test for crypto markets that often act inversely to the dollar.
Investors should watch how these macro cues intersect with crypto-specific catalysts. The potency of ETF inflows, the pace of any global liquidity shifts, and evolving regulatory signals will collectively shape whether Bitcoin and its peers can sustain momentum or succumb to profit-taking in the weeks ahead.
Altcoin snapshot: near-term charts and thresholds to watch
ETH, XRP, BNB, SOL, DOGE, HYPE and ADA each present clear levels that could influence the next wave of price action, even as Bitcoin wobbles at major zones.
Ethereum (ETH) has struggled to push through the prevailing ceiling near $2,465, signaling constrained demand at higher levels. The ether market will likely hinge on momentum-driven moves and the ability to sustain prices above nearby moving averages. A breakout above the $2,465 level would set the stage for revisiting the immediate resistance frontier, while a slide below key averages could pull ETH toward the lower end of its current setup.
XRP has become a focal point for a potential trend shift. The price has turned away from a downtrend line, and a bullish signal will emerge if demand persists on dips and the pair can climb above the downtrend line toward the $1.61 resistance. If cleared, targets near $2 become plausible. On the downside, breaking below the moving averages could expose a path toward $1.27, with a deeper drop toward $1.11 possible if selling accelerates through support zones.
BNB has rolled over from a $666 peak, with bears standing guard around the $687 resistance. The 20-day EMA at about $635 provides a critical baseline. A sustained bounce off that line could propel the pair above $687 toward $730 and eventually $790. The market could remain range-bound between roughly $570 and $687 if selling pressure resumes and buyers fail to gain traction above the EMA.
Solana is flirting with the $98 hurdle after a recent contact with the zone. A move above the 20-day EMA near $88 would signal improved tenor, enabling a renewed attempt at crossing $98. If successful, a run toward $117 could unfold, with resistance at $106 expected to hold in the near term. Failure to gain traction could keep SOL oscillating in a $76–$98 band for longer.
Dogecoin’s immediate direction remains tied to a battle around the $0.12 mark. A close above that threshold could accelerate gains toward $0.14 and then $0.16, while a break below $0.09 would open the door to a drop toward $0.08 and potentially $0.06 if selling intensifies. The next big move hinges on whether bulls can sustain a break above resistance or bulls relent at support.
Hyperliquid (HYPE) continues to grapple with the zone between $43.76 and $45.77, where sellers are actively defending. The 50-day moving average at $40.50 marks a critical support level; a break below this line could deepen the correction to roughly $38.70 and then $35.75, hinting at a possible topping scenario in the short term. A sustained move above the zone would be a signal for a resumption of the uptrend toward $50 and beyond to around $51.43.
Cardano (ADA) has paused within a broad range, oscillating between roughly $0.22 and $0.31. The 20-day EMA sits near $0.26 and is likely to act as a near-term springboard. A bounce off the EMA could push ADA toward $0.31, potentially signaling a fresh uptrend if buyers can clear that level. Conversely, a breakdown through the moving averages could extend the range for several more sessions, delaying a decisive directional move.
Taken together, the current landscape emphasizes thresholds to monitor rather than broad, uniform momentum. Traders may find opportunities if they can align with clear breakouts beyond specific moving-average tests, while risk remains elevated around major resistance zones and during periods of macro-driven volatility.
What readers should watch next is how Bitcoin behaves around the 84,000 hurdle and the 20-day EMA, whether the ETF inflow trend persists, and how XRP, ETH, and other top assets respond to their key breakpoints. The coming weeks will test whether the current mix of bullish sentiment and macro headwinds can coexist with a durable crypto rally or if risk-off episodes gain traction once more.

Keith Gill’s verified X (Twitter) account, known to 1.6 million followers as Roaring Kitty, posted a Solana Pump.fun contract address on Monday after 16 months of silence, prompting near-universal calls from traders that the handle has been compromised.
The May 11 post carried no caption beyond the token address and a short cartoon clip. The format sharply breaks from Gill’s history of long GameStop livestreams and detailed market commentary.
A 16-Month Silence Ended by a Pump.fun Token
The post appeared at 21:13 GMT and pointed to a freshly launched Solana meme coin called Red Kitten Crew (RKC). The same account followed within minutes with an image and the text “red bandit crew 4 life”.

The posts have since been deleted.
He also indicated that he held GameStop (GME) and RKC, causing a 25% surge in the RockyCat price.

Notably, the two RKC tokens share only a similar ticker and cat theme. The Solana Red Kitten Crew (new Pump.fun launch today) exploits Roaring Kitty hype via the suspected hacked account.
The older BNB Chain RockyCat is an established, unrelated community underdog meme project with its own fair-launch narrative. No affiliation, shared team, or connection exists. Pure name collision for opportunistic pumps.
RKC graduated from Pump.fun’s bonding curve to Raydium within minutes. The token peaked at a $5.97 million market cap before easing to roughly $4 million. Trading volume hit $2.55 million over 24 hours.

Gill’s previous activity centered on his GameStop position, including the $180 million bet he disclosed in June 2024. He has never publicly promoted a meme coin or used Pump.fun.
His public footprint has centered on options trading, value investing themes, and ad hoc YouTube livestreams.
Why Traders Are Calling the Post a Hack
GameStop holders and on-chain analysts flagged the post almost immediately. They cited the abrupt return and the lack of any explanation. The choice of a fresh Pump.fun launch also broke from Gill’s content history.
The pattern mirrors recent takeovers of high-profile crypto accounts. Examples include the breach of Michael Saylor’s MicroStrategy handle. Hackers also seized Kylian Mbappe’s X profile last year to push a meme token.
Pump.fun itself has been a recurring vector. Research suggests 98.6% of tokens launched there carry scam or wash-trading characteristics.
Gill has not addressed the post on any other channel. Until he does, traders are treating RKC as an unverified, high-risk asset tied to a suspected account compromise.

GameStop shares have also turned negative after gaining as much as 13% the same day. As of this writing, GME was trading for $23.19.
The post RKC Price Rallies 25% As Roaring Kitty Returns After 16 Months appeared first on BeInCrypto.

IREN has signed a $3.4 billion IREN Nvidia deal to deploy up to 5 gigawatts of AI infrastructure over five years.
Summary
- IREN will provide Nvidia with managed GPU cloud services worth $3.4 billion over five years for the chipmaker’s internal AI and research workloads.
- Nvidia received a five-year warrant to purchase up to 30 million IREN shares at $70 each, representing a potential $2.1 billion equity stake.
- The partnership builds on IREN’s prior $9.7 billion agreement with Microsoft, pushing the company’s total committed revenue past $15 billion.
Bitcoin miner turned AI infrastructure provider IREN has announced a five-year, $3.4 billion AI cloud contract with Nvidia, alongside a broader strategic partnership to build out 5 gigawatts of next-generation infrastructure. The deal was disclosed alongside IREN’s third-quarter FY2026 earnings on May 7.
IREN will provide Nvidia with managed GPU cloud services for its internal AI and research workloads. The partnership centres on deploying Nvidia’s DSX architecture across IREN’s global data center pipeline, starting at its 2-gigawatt Sweetwater campus in Texas.
What the Nvidia warrant means
As part of the deal, Nvidia received a five-year warrant to purchase up to 30 million IREN ordinary shares at $70 each. If fully exercised, that represents a potential equity investment of $2.1 billion, subject to regulatory approvals and GPU delivery milestones.
IREN co-founder and co-CEO Daniel Roberts said the partnership “combines Nvidia’s AI systems and architecture leadership with IREN’s expertise across power, land, data centers, GPU deployment, and infrastructure operations.”
IREN stock surged as much as 27% in after-hours trading following the announcement, extending a run that has seen the stock climb more than 71% over the past month. IREN shares jumped sharply in 2025 as the company first disclosed its pivot toward AI cloud revenue.
Scale and what comes next
The Nvidia deal follows IREN’s November 2025 agreement with Microsoft for $9.7 billion in GPU cloud infrastructure at its Childress, Texas data center. With commitments now exceeding $15 billion across both partnerships, IREN has positioned itself as a major AI infrastructure operator.
IREN is targeting $3.7 billion in annual recurring revenue by end of 2026 and 480 megawatts of capacity with 150,000 GPUs deployed. A further expansion to 1.2 gigawatts is already in build for 2027, with longer-term development across Texas, Spain, and Australia advancing toward the 5-gigawatt target.
Bitcoin (BTC) starts a new week in fighting form as $80,000 support survives a volatile weekly close.
Key points:
- Bitcoin preserves the potential for upside continuation as one trader pencils in $85,000 for the coming days.
- Consolidation is also a popular prediction as BTC/USD surfs CME futures gaps and grabs liquidity.
- The US-Iran war continues to provide snap market turbulence across crypto and risk assets.
- Buyer commitment to BTC leads analysis to forecast a longer-term uptrend.
- Two Bitcoin price metrics are about to deliver their first “golden cross” in nearly three years.
Latest BTC price targets include $85,000
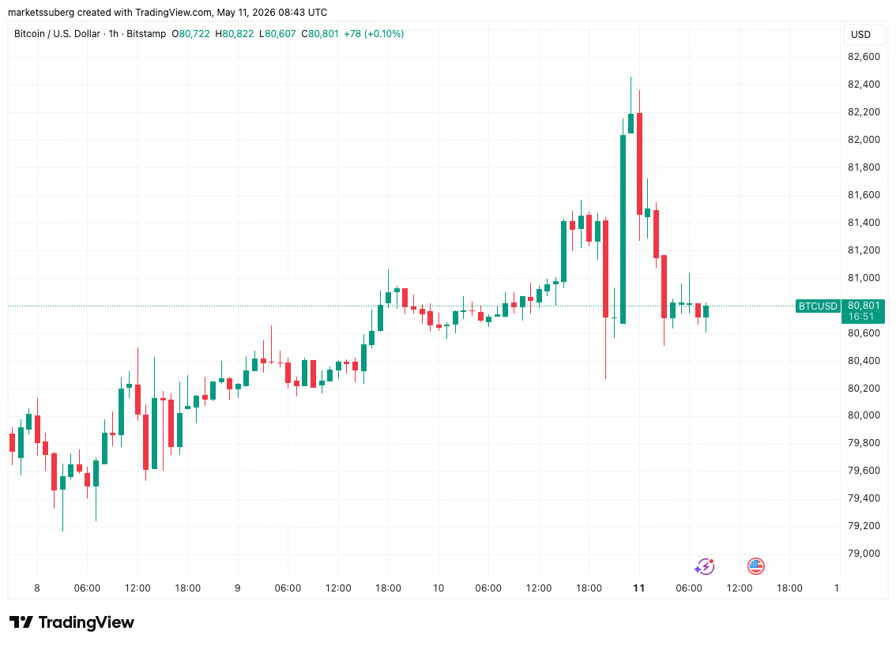
Bitcoin saw classic end-of-week volatility thanks to geopolitical developments as price briefly passed $82,000.
Data from TradingView showed that the move was short-lived, however, with BTC/USD quickly dropping back toward the $80,000 mark.

BTC/USD one-hour chart. Source: Cointelegraph/TradingView
The result was liquidity grabs that neutralized both long and short BTC positions on exchange order books. Data from CoinGlass puts the 24-hour crypto liquidation total at more than $400 million.

Crypto liquidation history (screenshot). Source: CoinGlass
“The Liquidation Heatmap on $BTC is currently looking STACKED with liquidity,” X trading account Cryptic Trades commented in a post just before the volatility hit.
“Both sides are filled with liquidity on both sides, which is why I believe that market makers are going to flush out both sides before there’s a bigger directional move out of this range.”

Binance BTC/USDT liquidation heatmap. Source: CoinGlass
Bitcoin is not without its bullish targets, however, as the mid-$80,000 range comes into view.
In an X thread mapping out the week’s potential price moves, trader CrypNuevo argued that BTC/USD holding $80,000 as support was the ideal foundation for continuation higher.
“Price has found acceptance above $81k and the EMAs have caught up,” he wrote, referring to moving averages (MAs) on daily time frames.
“Therefore, we’re expecting price to potentially push higher to $84k-$85k next week.”

BTC/USDT four-hour chart. Source: CrypNuevo/X
Crypto trader and analyst Michaël van de Poppe continued the bullish sentiment, saying that the “trend remains upward.”
“The 21-MA is below the current price; there’s still a lot of momentum, and there’s no breakdown of the higher-high, higher-low structure at all,” he told X followers on Monday.
“There’s no reason to believe that we’re stalling soon.”

BTC/USDT one-day chart. Source: Michaël van de Poppe/X
Bitcoin lacks futures “trigger” to break consolidation
Some market participants believe that conditions are not yet right for a decisive BTC price breakout.
Trader and analyst Rekt Capital is one of them, pointing to nearby “gaps” in CME Group’s Bitcoin futures.
These gaps, which are created when BTC/USD sees weekend volatility, often act as short-term BTC price magnets.
“Bitcoin has reached its CME Gap (red). BTC is holding the bottom of it as support but rejecting from the top of it,” Rekt Capital told X followers while analyzing the weekly futures chart.
“Price will need to Weekly Close above the top of this area if it wants to rally higher. Until that trigger is in -> consolidation.”

CME Bitcoin futures one-week chart. Source: Rekt Capital/X
Trader Daan Crypto Trades revealed other gaps around the spot price.
“We now have a few gaps left in close proximity: $78K, $80.3K & $84K,” he confirmed, with the highest gap capping recent local highs.

CME Bitcoin futures one-hour chart. Source: Daan Crypto Trades/X
Elsewhere, Cryptic Trades argued that the combination of declining open interest and rising price should deliver similar range-bound trading conditions for now.
“Because of this, I believe the most likely short-term outcome remains further consolidation, with both longs and shorts getting flushed before the market makes a larger directional move out of this range,” it concluded.
CPI leads key inflation week for Fed
The US-Iran war continues to be the main source of flash volatility for crypto and risk assets this week.
Bitcoin’s weekly close was marked by reactionary behavior as markets digested the latest developments in peace negotiations.
After trading terms back and forth — which had given markets reason for optimism last week — US President Donald Trump said that he did not “like” Iran’s latest proposals.
In a post on Truth Social, Trump called the terms “totally unacceptable.”

Source: Truth Social
The result was WTI crude oil quickly heading back above $100, while BTC/USD spiked to near $82,500 before giving back all its gains.

CFDs on WTI crude oil one-hour chart. Source: Cointelegraph/TradingView
“US-Iran peace talks are being priced-out again,” trading resource The Kobeissi Letter wrote in a response on X.
Oil prices will remain in the spotlight as new US Consumer Price Index (CPI) data is released. As Cointelegraph reported, this inflation gauge is particularly sensitive to oil-market volatility.
The April Producer Price Index (PPI) release will follow on Wednesday.

Source: Cointelegraph/X
Commenting, investment manager Peter Tarr highlighted the implications of the data for Kevin Warsh, President Trump’s nominee to chair the Federal Reserve
“Elevated oil prices will show impact reports. Important report for Warsh era Fed and markets,” he wrote on X.
Trump last month said that he “would” be disappointed if Warsh failed to cut interest rates at the Fed’s June meeting. The latest data from CME Group’s FedWatch Tool, however, shows that markets see only a 4.2% chance of that outcome.

Fed target-rate probabilities for June 17 FOMC meeting (screenshot). Source: CME Group
While this could be a headwind for crypto, traders believe that the CPI result itself is already “priced in” to BTC price action.
Analysis sees “sustainable uptrend” for Bitcoin
The latest Bitcoin analysis remains hopeful that a “sustained” market rebound is around the corner.
In one of its QuickTake blog posts on Sunday, onchain analytics platform CryptoQuant flagged positive changes in exchange-trader behavior.
“Looking at the $BTC Spot Taker CVD (90-day) chart on CryptoQuant, we are seeing a significant shift in capital flow structure,” contributor Researcher Rei summarized.
Rei referred to cumulative volume delta (CVD) data, which records the difference between buy and sell volume at given price points over time.
“Following a neutral accumulation phase, the indicator has turned Green. This means Buyers are no longer waiting at lower price levels (Limit Orders) but have started “sweeping” the order book directly (Market Buy),” he continued.
The data implies that large-volume investors have flipped from speculation to a hodl-based mentality, while macro conditions support the return of liquidity to crypto.
Rei described Bitcoin as a “top-tier growth asset.”
“Real demand has prevailed,” he concluded.
“When bulls are willing to pay higher prices to own $BTC, a sustainable uptrend usually follows.”

Bitcoin spot taker CVD (screenshot). Source: CryptoQuant
Onchain metrics prepare rare golden cross
More good news comes from two other BTC price metrics about to perform their first “golden cross” since mid-2023.
Related: Bitcoin Bollinger Bands push key breakout as creator acts on positive signal
Bitcoin’s market value to realized value (MVRV) ratio, which compares Bitcoin’s market cap to the price at which the supply last moved, also known as its “realized cap,” is one of them.
Recently, MVRV has rebounded from local lows to record some of its highest readings of 2026.
“This signal reflects a clear improvement in Bitcoin’s market valuation relative to its realized value, suggesting that the market has begun to regain an important portion of its momentum following a period of decline and rebalancing during the first months of the year,” CryptoQuant commented last week.

Bitcoin MVRV ratio. Source: CryptoQuant
Now, MVRV is about to cross the 200-day exponential moving average (EMA) for the first time in nearly three years. Data shows that past golden crosses have preceded snap BTC price upside.
“This signal is a representative trend reversal signal and is a bullish indicator,” CryptoQuant contributor CW8900 confirmed on Sunday.

BTC/USD chart with MVRV data (screenshot). Source: CryptoQuant


American Bitcoin mined coins at $36,200 each in Q1 2026, cutting costs 23% and posting a 50% gross margin.
Summary
- American Bitcoin cut its cost to produce one bitcoin by 23% to roughly $36,200 in Q1 2026, down from $46,900 in Q4 2025.
- The Trump family-linked miner posted a gross mining margin above 50% while most publicly listed rivals pivot capital toward AI infrastructure.
- Total fleet capacity reached 28.1 exahash by quarter-end, with the company holding roughly 7,021 BTC in its strategic reserve.
American Bitcoin (ABTC), the Bitcoin mining company backed by the Trump family, cut its cost per coin 23% to roughly $36,200 in the first quarter of 2026, placing it among the lowest-cost public miners in the US. The company reported a gross mining margin above 50% alongside an $81.8 million net loss driven largely by a $117 million non-cash impairment on its bitcoin holdings.
The improvement in cost came from spreading higher production volume across a stable fixed-cost base, combined with what management called “continued energy pricing discipline.” The Drumheller site in Alberta, activated in late March, added roughly 3.05 exahash of computing power.
How American Bitcoin compares to the field
Total fleet capacity reached 28.1 exahash by quarter-end across roughly 89,000 mining machines. Eric Trump, co-founder and chief strategy officer, has consistently framed the company’s strategy around scale and low-cost production rather than the AI pivot pursued by rivals.
“Scaling hashrate is one of the ways we strengthen our position in Bitcoin,” Trump said in a recent statement. Public miners have collectively signed more than $70 billion in AI infrastructure contracts and reduced their bitcoin treasuries by over 15,000 BTC since late 2024 to fund the transition. American Bitcoin is taking the opposite approach.
American Bitcoin added 1,620 bitcoin to its strategic reserve in the quarter, pushing holdings to roughly 7,021 BTC, a 30% increase from the prior period. Of that, 817 came from mining and 803 from open-market purchases.
Mining economics and what makes it cheap
US miners broadly face rising pressure from surging tariffs on ASIC hardware from Southeast Asia and on steel and copper used in mining containers. American Bitcoin’s low electricity costs, estimated at well below $0.05 per kilowatt-hour at its key sites, give it a structural cost advantage over operators on older hardware or higher-cost power.
At $36,200 per coin against a Bitcoin price hovering near $80,000 during the quarter, that margin gives American Bitcoin significantly more room to hold rather than sell its production, supporting its long-term treasury accumulation strategy.
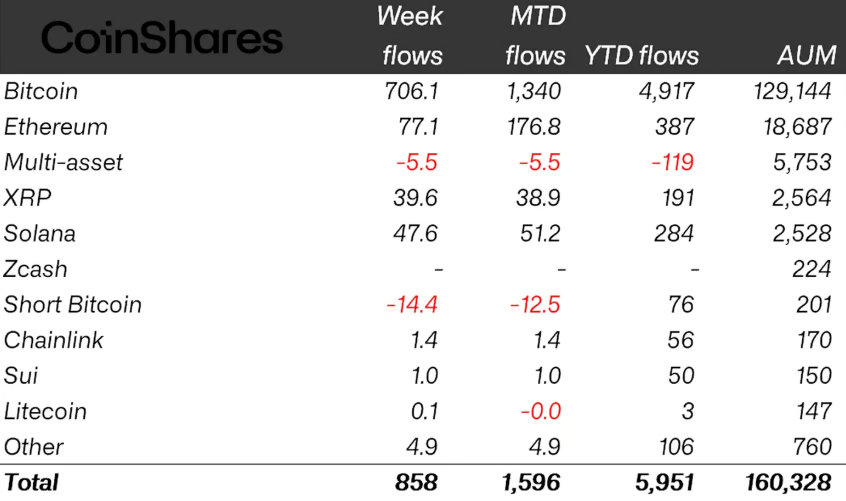
Cryptocurrency investment products recorded a sixth straight week of inflows in their longest streak since April to July 2025, totaling $4.9 billion, as improving sentiment around US crypto legislation helped push Bitcoin above $80,000 and lift assets under management to their highest level since February.
Crypto exchange-traded products (ETPs) posted around $858 million in inflows last week, sharply up from $118 million in inflows the previous week, CoinShares reported Monday.
The gains were likely supported by developments around the US CLARITY Act, said CoinShares head of research James Butterfill, referring to a final compromise proposal regarding stablecoin yields released on May 1.
Amid the positive trend, Bitcoin broke above $80,000 last week, lifting total assets under management in crypto ETPs past $160 billion, the highest since February.
Bitcoin leads inflows, while short-BTC funds see the largest outflows year-to-date
Bitcoin (BTC) investment products led the show last week, attracting $706 million in inflows and bringing year-to-date flows to $4.9 billion.
In line with the improving sentiment, short-Bitcoin ETPs saw their largest weekly outflow of the year at $14 million, suggesting investors are pulling back from bets against BTC as confidence in the rally grows.

Crypto ETP flows by asset (in millions of US dollars). Source: CoinShares
Ether (ETH) ETFs saw $77 million in inflows, reversing the $81 million in outflows recorded the previous week. Solana (SOL) and XRP (XRP) also posted notable gains, with inflows of about $48 million and $40 million, respectively.
Late-week profit-taking holds back the rally
Last week’s inflows came despite significant selling later in the week as Bitcoin briefly dipped below $80,000 on Thursday.
On Thursday and Friday, US-listed spot Bitcoin exchange-traded funds saw $423 million in outflows, reducing net weekly inflows to about $623 million, according to SoSoValue.

Bitcoin (BTC) seven-day price chart. Source: CoinGecko
Onchain analytics platform CryptoQuant pointed to realized profits totaling 14,600 BTC, or $1.1 billion, on Monday, the largest single-day profit-taking since Dec. 10, when Bitcoin was trading above $90,000. CryptoQuant’s Julio Moreno said rising realized profits could accelerate Bitcoin profit-taking as BTC climbs to three-month highs.
Related: Bitcoin rallies 2.3% after Trump calls Iran peace proposal ‘totally unacceptable’
“The rally started to stall from the middle of the week as investors quickly took profit on their positions,” Laser Digital’s derivatives trading desk said in a statement shared with Cointelegraph.
“Comments from DAT companies, whether it be selling or slowing purchases, didn’t help either. Given a lot of investors had pre-positioned for a move higher anticipating strong bid from MSTR this week, this has likely triggered some take-profit flows,” Laser Digital’s derivatives division added.
Magazine: XRP ‘probably going to $12,’ Bitcoin ETFs add $1B: Market Moves
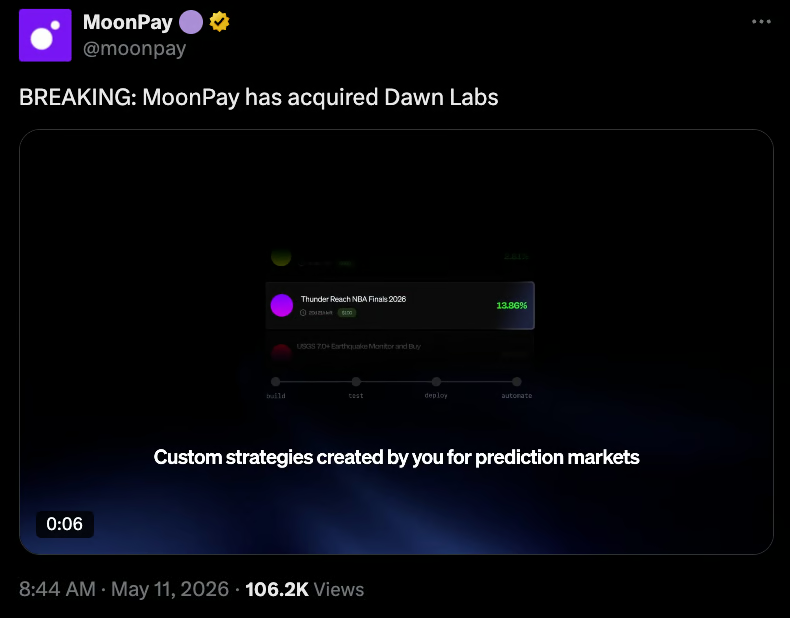
Financial technology company MoonPay announced the launch of an AI technology tool for trading strategies on prediction markets following its acquisition of Dawn Labs for an undisclosed amount.
MoonPay said Monday that it had launched Dawn CLI in an effort to facilitate trading strategies “in plain English,” citing activity on prediction market platforms like Polymarket and Kalshi. Dawn Labs founder Neeraj Prasad said the tool will democratize trading “by general intelligence.”
“Prediction markets are one of the fastest-growing categories, attracting a new generation of active traders across platforms like Polymarket and Kalshi,” MoonPay said in its announcement. “These traders use signals from social media, automated strategies and cross-platform positioning, but the infrastructure required for high performance remains fragmented, manual and technically demanding.”

Source: MoonPay
The move closer to prediction markets comes as Kalshi and Polymarket face several state-level lawsuits over allegations that the companies are illegally facilitating sports betting and other activities not permitted by state law. Until December 2025, Caroline Pham, MoonPay’s chief legal officer, was a commissioner and acting chair at the US Commodity Futures Trading Commission (CFTC), which has since claimed exclusive jurisdiction over prediction markets.
Related: MoonPay releases open-source wallet standard for AI agents
Trading on prediction markets continues to be under scrutiny by many US lawmakers and industry leaders given the platform’s models often allowing insider trading. In April, a soldier was charged with using classified information about the US military operation to capture former Venezuelan President Nicolás Maduro to make more than $400,000 through event contracts on Polymarket.
Kalshi increases valuation to $22 billion
MoonPay’s acquisition followed prediction markets platform Kalshi closing a $1 billion funding round last week, resulting in the company reaching a valuation of about $22 billion. The move effectively doubled Kalshi’s valuation in five months.
Magazine: Strategy reveals why they would sell BTC, Trump Media posts loss: Hodler’s Digest, May 3 – 9

Augustus, a payments group backed by Peter Thiel’s Valar Ventures, has received conditional approval from the U.S. Office of the Comptroller of the Currency (OCC) to charter a U.S. national bank focused on artificial intelligence and stablecoin-based payments. The decision marks a notable step in the ongoing push to modernize cross-border settlement infrastructure through tokenized dollars and blockchain-enabled rails, expanding Augustus’ European operations into the United States.
The approval, announced recently, would allow Augustus National Bank to proceed toward a fully chartered U.S. national bank, but only after meeting the OCC’s pre-opening requirements. The company describes the institution as “the first clearing bank for the AI era,” built on an AI- and stablecoin-native core intended to interface with machine agents at “the speed of compute,” reducing reliance on traditional batch processes and manual clerical work. This characterization comes from Augustus’ own materials accompanying the regulatory filing.
Founded in 2022, Augustus operates under European banking licenses and has reported serving institutional clients with significant flows, including cryptocurrency exchange Kraken. While the proposed U.S. national bank charter represents a major milestone, the OCC approval remains conditional until the pre-opening criteria are satisfied. In line with the OCC’s evolving approach to digital assets, the path to a federally chartered bank remains selective and tightly regulated.
Augustus secures OCC conditional approval. Source: PR Newswire
Related: Stablecoin issuer Circle faces lawsuit over Drift Protocol hack
Notably, Augustus joins a small cohort of digital-asset firms that have advanced to the more stringent federal chartering process. Other players, such as Ripple and Circle, have pursued national charter options under OCC oversight, but only a subset have reached advanced stages in the formal chartering process. The OCC’s conditional approval underscores a broader, ongoing debate about how digital-asset firms should be integrated into the U.S. banking system and supervised under traditional bank regulatory frameworks.
Key takeaways
- The OCC issued conditional approval for Augustus National Bank to pursue a U.S. national bank charter, contingent on meeting pre-opening requirements.
- Augustus aims to extend its European banking operations into the United States, framed around AI-enabled clearing and stablecoin-based settlement.
- The bank’s framework is described as “the first clearing bank for the AI era,” leveraging AI- and stablecoin-native core technology to interface with machine agents.
- Augustus operates with European licenses and reports institutional client activity, including services for Kraken; this U.S. charter would place it among a select group of firms progressing toward federally chartered status.
- Regulatory and policy context emphasizes a shift toward tokenized-dollar rails within regulated banking, intersecting with GENIUS Act provisions and ongoing cross-border settlement innovations (Circle–Finastra, Citi/HSBC tokenized deposits).
Regulatory milestone and charter dynamics
The OCC’s conditional green light reflects a deliberate approach to digital-asset and tokenized-payment initiatives within the U.S. banking system. While the OCC has signaled openness to “fintech-friendly” approaches and national-charter pathways for select firms, chartering remains contingent on robust compliance, capital, liquidity, and governance standards, as well as careful scrutiny of risk management, cyber resilience, and customer protection frameworks.
Industry observers note that, despite the broader trend toward modernization, only a handful of firms have progressed to advanced stages of federal chartering in recent years. The OCC has previously authorized banking charters or similar umbrellas for digital-asset firms and crypto-related ventures, but the process remains deliberately cautious and capability-driven. Augustus’ conditional status aligns with the OCC’s pattern of staged approvals that allow firms to demonstrate risk controls, integrations with existing operations, and compliance readiness before a full charter is granted.
From a regulatory policy perspective, the Augusts development sits at the intersection of traditional supervisory oversight and a rapidly evolving tokenized-payments ecosystem. In the U.S., the GENIUS Act framework for stablecoins and payments contributes to a regulatory backdrop that envisions fully reserved-dollar token issuance within insured banking rails. This regulatory context informs how Augustus’ proposed charter might be evaluated in relation to liquidity provisioning, reserve management, and consumer protections. For cross-border market participants and financial institutions, the act creates a pathway for stablecoin settlement to be integrated with conventional bank infrastructure, subject to rigorous supervision and compliance requirements. More on GENIUS Act guidance
AI-era clearing bank and tokenized payments infrastructure
The strategic concept behind Augustus National Bank centers on an AI-native payments core that operates in concert with stablecoins to fulfill real-time settlement objectives. The proposed model emphasizes direct interaction with machine agents at high speed, reducing latency and operational friction that characterize legacy payment rails. This architectural shift aligns with a broader industry push to industrialize cross-border settlements, minimize settlement risk, and improve transparency in tokenized-dollar flows.
Within the broader policy and market landscape, there has been steady progress in enabling tokenized-dollar settlements inside regulated banking rails. Circle’s collaboration with core banking provider Finastra aims to streamline stablecoin settlement through the Global PAYplus hub, enabling cross-border settlements in USDC. Separately, major banks such as Citi and HSBC have started to roll out live tokenized-deposit capabilities to support near real-time, 24/7 cross-border and interbank payments. These developments, highlighted in industry coverage, illustrate a tangible trend toward integrating tokenized-dollar mechanisms into traditional banking operations. Circle–Finastra collaboration, Citi and HSBC tokenized deposits
From a compliance and supervisory standpoint, the prospect of AI-assisted clearing raises questions about governance, data integrity, and model risk management. Regulators would likely evaluate how AI systems influence settlement decisions, the controls around algorithmic decision-making, and the safeguards ensuring that tokenized assets remain fully backed and auditable. The ASC (anti-money-laundering) and KYC (know-your-customer) frameworks will remain central to supervisory judgments as custody, settlement, and liquidity management move closer to automated, real-time processes.
Industry context and regulatory landscape
Augustus’ filing arrives amid a broader strategic push to modernize U.S. settlement layers and to situate stablecoins within formal banking rails. The GENIUS Act regime is cited as a key enabling framework for issuing fully reserved-dollar tokens by banks and trust companies, with market participants actively exploring cross-border settlement opportunities under compliant standards. In parallel, the U.S. regulatory environment remains vigilant about the separation between traditional banking and digital-asset activities, reinforcing the need for robust licensing, oversight, and risk management to mitigate potential financial crime and consumer protection issues.
Comparative regulatory dynamics abroad add depth to the discussion. In Europe, MiCA (Markets in Crypto-Assets Regulation) represents a broad attempt to harmonize crypto licensing and oversight, while the U.S. approach tends to emphasize bank-charter status and prudent supervision under the OCC and related agencies. The intersection of U.S. banking supervision and crypto innovation continues to shape how firms structure settlements, custody, and asset issuance across borders, with Augustus’ case illustrating a potential template for enterprise-scale, AI-driven, tokenized-payments operations within a federally chartered framework.
Augustus’ backers—Valar Ventures, Creandum, and founders of Ramp and Deel—have positioned the group at the intersection of fintech, institutional custody, and regulated payments. With the company reporting several billion dollars in processed flows for institutional clients, the U.S. charter path could influence fiduciary, liquidity, and risk-management standards for similarly situated firms seeking to operate at scale within U.S. banking rails. The broader regulatory narrative remains uncertain, but the convergence of artificial intelligence, stablecoins, and bank charters is increasingly plausible within a structured, compliant framework.
Closing perspective
As Augustus advances through the pre-opening phase toward a fully authorized U.S. national bank, observers will be watching closely how the institution navigates the intersection of AI-enabled settlement, stablecoin governance, and the evolving U.S. regulatory regime. The outcome could have meaningful implications for banks, exchanges, and institutional users seeking compliant, real-time cross-border settlement capabilities in a digitized dollar economy.

Augustus, a payments startup backed by Peter Thiel’s Valar Ventures, announced Monday that the US Office of the Comptroller of the Currency had granted conditional approval to charter a U.S. national bank built around artificial intelligence and stablecoin-based payments. The plan would extend Augustus’ European banking footprint into the United States and explore faster, tokenized settlement rails that could reshape cross-border finance.
The company describes Augustus National Bank as “the first clearing bank for the AI era,” founded on an AI- and stablecoin-native core that could interact with machine agents at “the speed of compute” rather than relying on traditional batch processes and human clerks. The OCC approval is conditional, meaning the charter would become effective only after the agency’s pre-opening requirements are satisfied.
Key takeaways
- The OCC issues conditional approval for Augustus to charter a U.S. national bank focused on AI-driven, stablecoin-based payments, with full authorization contingent on pre-opening steps.
- Augustus envisions a native core that interacts with machine agents in real time, aiming to modernize clearing and settlement beyond conventional rails.
- The European-licensed firm already serves institutional clients and processes billions in transactions, including work for Kraken, signaling practical scale behind the project.
- Regulatory and industry context for tokenized-dollar settlement is evolving under regimes like GENIUS, with wide-ranging collaborations among Circle, banks, and core-payments providers increasingly testing cross-border, real-time tokenized settlements.
OCC nod and the AI-era clearing bank
The OCC’s conditional green light signals a notable shift in the federal filing landscape for digital-asset-adjacent firms seeking a national charter. Augustus positions itself as a pioneer by promising a banking core built to accommodate AI-enabled workflows and stablecoin-based settlement, potentially enabling faster, more programmable transfers across borders. The Augusts plan would let the bank operate with a technology stack designed to interface directly with autonomous agents and other AI systems, a departure from the legacy rails that rely on batch processing and manual intervention.
Nonetheless, the approval is not final. The OCC outlined that the charter will only take effect once the remaining pre-opening requirements are met, a process that can involve rigorous governance, risk, and compliance checks given the regulatory sensitivity around digital assets and fintech infrastructures. If successful, Augustus would join a select group of firms advancing toward a federal banking charter in the digital-asset era, a trajectory that remains carefully navigated amid evolving supervision and standards.
Navigating a broader payments-technology race
The Augustus development sits within a broader push to modernize cross-border payments and stablecoin settlement infrastructure in the United States. Under frameworks associated with the GENIUS Act, banks and trust companies may issue fully reserved dollar tokens, expanding the set of regulated rails on which tokenized currencies can circulate. The policy environment is encouraging experimentation with tokenized-dollar flows integrated into traditional banking rails, a trend reinforced by recent industry partnerships and pilot programs.
In this evolving landscape, Circle has moved to deepen its role in on-ramps for stablecoins within conventional banking infrastructure. A collaboration announced in 2025 with core banking provider Finastra aims to enable banks to settle cross-border payments in USDC via Finastra’s Global PAYplus hub. Separately, Citi and HSBC have begun offering tokenized deposits for 24/7 cross-border and interbank payments, signaling that mainstream banks are actively testing tokenized-dollar settlements at scale. These developments underscore the growing plausibility of AI-native, token-based settlement becoming a standard option for regulated banks in the near term.
Augustus: European footprint, ambitious leadership, and funding
Founded in 2022, Augustus operates under European banking licenses and says it already processes billions of dollars in transactions for institutional clients, including major crypto exchange Kraken. The company has attracted investors such as Peter Thiel’s Valar Ventures, alongside Creandum and founders of Ramp and Deel, and has reportedly raised around $40 million to date. If the U.S. charter progresses to full approval, Augustus would advance one of the most ambitious attempts to integrate artificial intelligence and tokenized money into a federally regulated banking framework.
According to Augustus, its U.S. venture would be steered by a notably young leadership profile. The company’s chief executive officer, described as 25 years old, would be among the youngest to lead a federally chartered bank in more than a century—an fact that has drawn attention to the speed of its regulatory timeline and the potential cultural shift within traditional financial institutions.
Crypto industry watchers note that the path from conditional approval to a fully functioning national bank charter hinges on meeting stringent pre-opening criteria, from liquidity and governance standards to risk controls and consumer protections. While the current status marks a meaningful milestone, observers will be watching closely how Augustus aligns its AI-native architecture with U.S. banking expectations and compliance obligations.
For readers tracking the regulatory frontier of AI-driven finance, this move underscores a broader appetite among fintechs and digital-asset firms to utilize federal charters as a path to scale, credibility, and access to regulated payment rails. As such, Augustus’ progress will likely influence subsequent applications and pilots across the sector, particularly as major players continue to test tokenized settlement interfaces, cross-border liquidity, and machine-enabled settlement workflows.
As the next steps unfold, market participants will be watching for the specifics of the pre-opening requirements, the timeline for meeting them, and how Augustus articulates its risk management, governance, and consumer protections in a U.S. context. The episode also invites a closer look at how the GENIUS Act and related regulatory developments might shape the competitive landscape for banks seeking to leverage stablecoins and AI-enabled settlement in a federally regulated framework.
Asia Express: North Korea denies crypto hacks, Upbit’s bank tests Ripple Asia Express.
Sources: Augustus’ conditional-approval announcement via PR Newswire; GENIUS Act framework via Richmond Fed materials; Circle–Finastra cross-border settlement initiative; Citi and HSBC tokenized deposit programs.

Navitas Semiconductor Stock Explodes 25% on Surging AI Data Center Demand and Strong Q1 Results

Crypto YouTube Crisis: “Even at the 2018 Bear Market, I Had Double the Views”

The geopolitics behind the UK’s South Atlantic hantavirus rescue mission
Manchester United reach agreement with Casemiro over contract clause amid transfer speculation

US brings back mandatory military draft registration

Steven Gerrard disagrees with Gary Neville over ‘shock’ Chelsea and Arsenal claim | Football


-
 Crypto World4 days ago
HarrisX Poll Found 52% of Registered Voters Support the CLARITY Act
-

 Fashion3 days ago
Weekend Open Thread: Marianne Dress
-

 Crypto World5 days ago
Upbit adds B3 Korean won pair as Base token gains Korea access
-
 NewsBeat5 days ago
NCP car park operator enters administration putting 340 UK sites at risk of closure
-

 Tech2 days ago
Auto Enthusiast Carves Functional Two-Stroke Engine from Solid Metal
-

 Politics3 days ago
Politics Home Article | Starmer Enters The Danger Zone
-
 Business2 days ago
Ignore market noise, India’s long-term story intact, say D-Street bulls Ramesh Damani and Sunil Singhania
-

 Crypto World6 days ago
UAE Free Zone Deploys Blockchain IDs to Verify Registered Firms
-

 Tech16 hours ago
GM Agrees To Pay $12.75 Million To Settle California Lawsuit Over Misuse Of Customers’ Driving Data
-

 Crypto World5 days ago
BlackRock CEO Larry Fink Discusses a New Asset Class
-

 Crypto World5 days ago
Robinhood says Wall Street is building onchain
-

 Entertainment5 days ago
Sarah Paulson Called Out For Met Gala ‘Hypocrisy’
-

 Tech6 days ago
Apple and Samsung are dominating smartphone sales so thoroughly that only one other company makes the top 10
-
Entertainment7 days ago
Serena Williams hits Met Gala in metallic dress after GLP-1 reveal
-

 Tech6 days ago
I tested the Xiaomi 17 Ultra’s camera and I don’t think I’ll ever go back to an iPhone
-

 Fashion5 days ago
The Best Work Pants for Women in 2026
-

 Fashion5 hours ago
Coffee Break: Travel Steam Iron
-
 Sports7 days ago
Everton v Man City LIVE: Haaland’s two-word response as visitors collapse to hand Arsenal advantage in Premier League title race
-
 Sports5 days ago
NBA playoff winners and losers: Austin Reaves is not loving Lakers vs. Thunder matchup, but Chet Holmgren is
-
 Tech5 days ago
AI agents are missing all the discussions your team is having. SageOX has an answer: agentic context infrastructure
You must be logged in to post a comment Login