
Crypto World
AAVE price risks fresh plunge under $100, bears eye 2-year lows


- Aave price could plummet under $100 and risk new multi-year lows.
- Bears can decisively take out the psychological level and test the $75-$80 range.
- However, dips can offer a buy-the-dip opportunity before a sharp rebound.
Aave fell to around $108 as decentralised finance tokens broadly moved into negative territory.
With broader market pressures weighing on sentiment, AAVE faces rising downside risks and is at risk of slipping below the key $100 support level.
The outlook reflects continued volatility across the sector, with a notable decline in total value locked, highlighting growing vulnerability to further price weakness.
Aave price retests $108
Aave’s AAVE token was trading near $370 in August 2025 but has since declined sharply amid persistent bearish sentiment across the crypto market.
Prices fell steadily through late 2025 before sliding more aggressively toward the $100 zone.
A double-top pattern formed in the latter months of last year, and the subsequent drop to around $95 last week marked a significant downturn for the DeFi token.
Although AAVE rebounded briefly to about $120, selling pressure has remained strong, with prices retesting the $108 support level.
The token is down roughly 15% over the past week and about 25% year-to-date.
It has also fallen around 67% since August 2025 and more than 80% from its all-time high above $667 in 2021.
The price weakness has coincided with a sharp decline in Aave’s total value locked, reflecting reduced liquidity and softer protocol revenues.
AAVE price forecast: bears eye 2-year lows
Bulls are not completely out of the picture despite the recent bloodbath.
However, sentiment is battered, and momentum is with bears.
For Aave, technical indicators signal this increasing bearish momentum.
While momentum oscillators remain in neutral territory and point to the possibility of a short-term bullish shift, moving averages continue to signal strong selling pressure for Aave.
A slide toward the psychologically important $100 level, after the token fails to hold above the $112 support zone, will reinforce this bearish outlook.
As reflected on the daily chart, a breakdown similar to the pattern that has defined AAVE’s price action since late 2025 could accelerate seller dominance and deepen near-term downside risks.

The current downturn could push the price toward the $75–$80 demand zone in the near term, an area that aligns with a key Fibonacci retracement level.
A move into this range would place Aave back at levels last seen in early 2024.
On the upside, renewed momentum would likely require a sustained weekly close above $140.
Such a move would depend on rising trading volumes, with $120 acting as initial support and $144 as a secondary resistance level before higher targets come into view.
Meanwhile, the daily Relative Strength Index is hovering near neutral territory around 34, giving sellers some room to maintain pressure.
Analysts note this setup could increase the risk of a short-term false breakout before a clearer directional move emerges.


Hedera price has been in a downtrend over the past month as the token continues to be bruised by the geopolitical concerns that have pushed investors away from risk assets.
Summary
- Hedera price dropped to a six-week low of $0.083, down over 12% in a month amid weak market sentiment and geopolitical tensions.
- On-chain activity declined, with DeFi app revenue falling nearly 70% and stablecoin supply dropping 6%, signaling reduced network usage and liquidity.
- Technical indicators remain bearish, with price trading in a descending channel and key support seen at $0.087.
According to data from crypto.news, Hedera (HBAR) price fell to a six-week low of $0.083 on Tuesday, down over 12% in the past month and over 20% from its year-to-date high.
Hedera price fell amid weakness in its underlying ecosystem activity as key performance indicators started to flash red. Data from DeFiLlama shows that revenue generated by DeFi apps on the network had slumped nearly 70% from the previous month’s high.
A drop in app revenue means that a lower number of users are interacting with the Hedera ecosystem, signaling weakening demand for its decentralized applications and reduced overall network usage.
Third-party data also show that the total supply of stablecoins on the network has fallen 6% over the past 7 days to $52.71 million. Declining stablecoin supply typically reflects reduced liquidity and capital inflows on the network, further reinforcing signs of slowing activity.
Hedera price has also remained in a downtrend due to reduced investor appetite for risk assets amid the ongoing U.S.-Iran war that has led to a flight to more traditional safe-haven assets such as gold and U.S. equities.
On the daily chart, Hedera price has been trading within a descending parallel channel pattern, a formation where the asset consistently makes lower highs and lower lows. As long as an asset trades within such a pattern, it will likely continue to face persistent selling pressure as it bounces between the upper and lower boundaries.
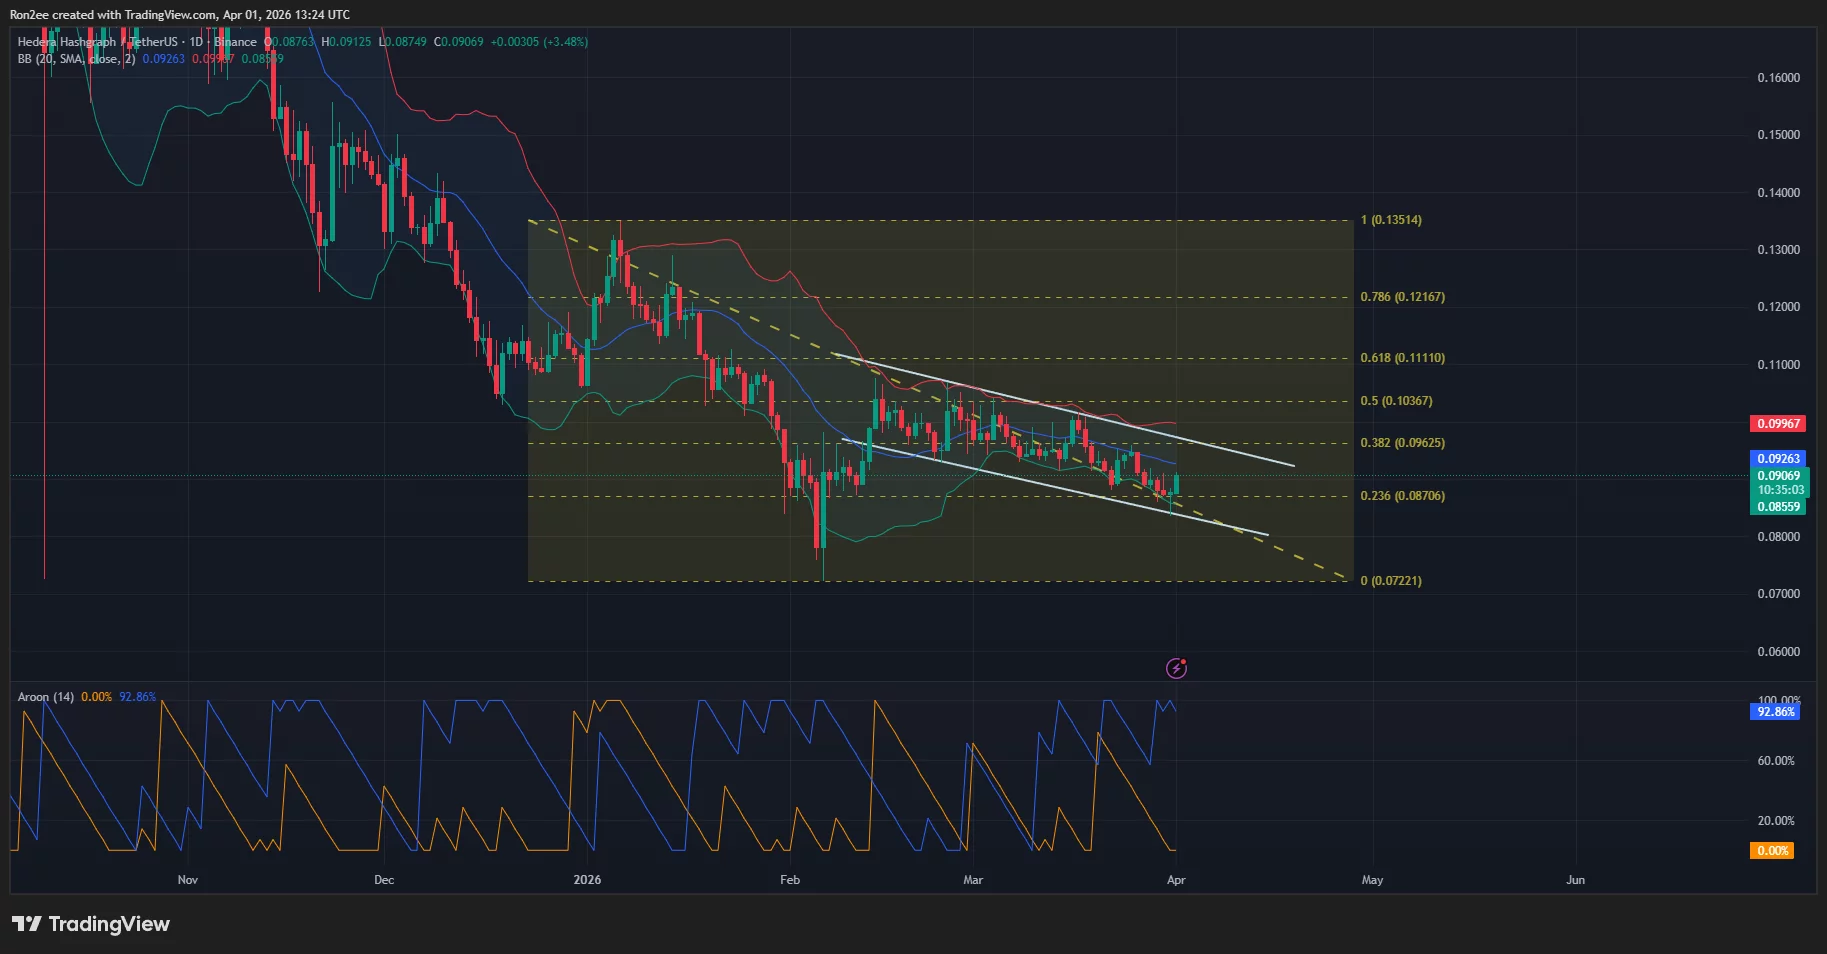
Technical indicators also appear to portray a bearish outlook for Hedera price in the upcoming sessions. Notably, the Bollinger Bands have begun to narrow, with the price trading below the middle band, suggesting contracting volatility while the short-term trend remains tilted to the downside.
The Aroon Down is at 92.86% while the Aroon Up remains at 0%, indicating strong downward momentum and that a recent low has likely been established within the current trend.
For now, the immediate support level for Hedera price lies at $0.087, which aligns with the 23.6% Fibonacci retracement level. A drop below this level could increase selling pressure and open the door for a move toward lower support zones.
Disclosure: This article does not represent investment advice. The content and materials featured on this page are for educational purposes only.


Coinbase is folding regulated prediction markets into its “everything exchange” vision, using The Clearing Company to clear on‑chain event contracts beside crypto and stocks.
Summary
- Coinbase is moving prediction markets from a Kalshi integration toward an on‑chain, in‑house stack after acquiring The Clearing Company, aiming to keep them inside a regulated perimeter.
- In Europe, financial‑underlying prediction markets fall under MiFID while politics and sports are pushed into fragmented national gambling regimes, leaving most current on‑chain volume in regulatory limbo.
- Coinbase is already experimenting with cross‑margining via perpetual futures and sees long‑term scope to extend collateral efficiency across prediction markets, crypto, and tokenized assets on a single venue.
Coinbase’s push to become an “everything exchange” will increasingly run through regulated prediction markets rather than just spot crypto, according to Côme Prost‑Boucle, the exchange’s head of international listings, speaking with crypto.news at ETHGlobal Cannes on March 31.
For Prost‑Boucle, prediction markets are not a novelty bolt‑on. They sit at the core of Coinbase’s plan to become what he calls an “everything exchange.” “The whole strategy is pretty simple,” he told crypto.news.
“We want to build the everything exchange with Coinbase, meaning that we want to bring under one regulated umbrella all of the asset classes that you can imagine and offer this to both our retail customers and our institutional customers.”
Coinbase leading the way to become an ‘Everything Exchange’
That umbrella now stretches beyond spot crypto into derivatives, options, tokenized stocks and equities, token sales and, crucially, event‑based contracts that let users trade on future outcomes. “We have this whole breadth of different products that we’re bringing into one umbrella, which is Coinbase,” he said. “Our goal is to push this to as many users as possible across the world, and the reaction has been pretty tremendous so far.”
Coinbase’s debut in prediction markets was deliberately conservative. The initial launch in the U.S. leaned on Kalshi, the CFTC‑regulated event‑contract venue, giving the product an immediate regulatory backbone but also clear constraints on geography and design.
“The first iteration of the product is available in the US and in a couple of regions, but for instance, it’s not available in Europe because of lack of regulatory clarity,” Prost‑Boucle said. That version effectively pipes Kalshi’s markets into the Coinbase interface, letting users trade small‑ticket contracts on elections, sports, macro data and other real‑world events while staying inside a U.S. event‑contract framework.
The second phase is more aggressive. In December, Coinbase agreed to acquire The Clearing Company, a specialist prediction‑market clearing startup with roots in the existing event‑contract ecosystem.
Prost‑Boucle referred to it in the interview as “a company called The Clearing House,” but the strategic intent is clear. “The goal is for us to bring these capacities internally so that we can develop this product on chain and we can develop with the DNA that we have to bring all asset classes on chain,” he said. In effect, Coinbase is moving from renting regulated rails to owning the clearing and risk stack, and then pushing more of the lifecycle on‑chain while staying within the event‑contract perimeter. That stands in contrast to crypto‑native venues such as Polymarket, which prioritizes unconstrained on‑chain liquidity first and only later began to grapple with regulatory structure.
Prediction markets dominate conversation at ETHGlobal
If prediction markets are to sit alongside crypto, derivatives and tokenized stocks in a single app, collateral efficiency will determine whether users actually route meaningful size through Coinbase. Here, Prost‑Boucle says institutional desks are already applying pressure. “That’s also something that institutional clients have been pushing for,” he noted when asked about cross‑margining prediction markets with other Coinbase products. “We’re currently doing cross‑margining for our perpetual futures product, and that’s something that our institutional clients have been craving,” he added, pointing to demand for “always‑on exposure possibilities, weekend hedging, all of this that perpetual futures have as internal features.” The logical goal is to have a single collateral pool backing BTC perpetuals, tokenized equity and a portfolio of geopolitical or macro event contracts, rather than trapping capital in isolated silos across venues. “At the moment we’re working on this product,” he said of cross‑margining, “but I think that’s a good vision for us in the longer term—to have cross‑margining across the different asset classes, I guess.”
The main structural obstacle to that vision is Europe. “Prediction markets in the EU are pretty difficult to apprehend because there’s no unified regulatory framework,” Prost‑Boucle said. “It all depends on what you have as an underlying asset.” He draws a sharp line that mirrors emerging legal commentary: a contract on the future price of Bitcoin is treated as a financial derivative under MiFID, while a contract on an election or football match is pushed into gambling. “If the contract lies on a financial underlying asset, that would be regulated by MiFID,” he explained. “But all of the other classes, where currently all of the volumes are—on politics, on sports, this would be regulated under gambling laws in Europe.”
That split leaves most of today’s on‑chain volume—heavily skewed toward politics and sports—in regulatory limbo from the perspective of a regulated exchange. Any operator that wants to offer political or sports markets across the bloc has to navigate a patchwork of national gambling regimes, each with its own licensing, consumer rules and, in some cases, state monopolies. “It means you would have to go for every single European gambling law, because there is no unified regulatory framework,” Prost‑Boucle said. “These laws are pretty national, they’re quite country‑specific and they’re quite hard to get.” Despite that, he is not writing off the region. “I guess we’re still hopeful that at some point we’re going to have regulatory clarity on prediction markets and a better structure in Europe that enables this type of contract to flourish as well,” he said.
Beyond trading revenues, Coinbase clearly sees prediction markets as an information layer that competes with polling, research, and even traditional media. Prost‑Boucle points to cases in the U.S. where broadcasters are already embedding live market odds, such as CNBC, CNN, the Dow Jones and other media recently integrating Polymarket odds into the ‘traditional’ newscycle.
That, in turn, brings the problem of truth into focus. Once markets start pricing geopolitics, conflicts, and leadership changes, disputes over what actually happened can become payout disputes. That means oracles used to resolve contracts may be facing increasing scrutiny from not only bettors, but also regulators.
Prost‑Boucle argues that most of the damage begins with poor contract design. “It’s crucial when you enter a contract to look at what the event criteria are,” he said. “Obviously you want to diversify sources of truth and have kind of fixed criteria to make sure there is no ambiguity when an event like this happens,” he added. Asked whether AI agents could help by aggregating across outlets and delivering a consolidated verdict, he is open but cautious. “Potentially, AI could be helping with sorting out across different sources‑of‑truth venues and making sure that we have a consolidated view and a fixed view that is not biased by any specific media or even a group of people,” he said.
For now, Coinbase’s approach is less about chasing the wildest version of prediction markets and more about proving they can live inside the same rule‑set as everything else on the platform: keep them in a regulated perimeter, pull clearing and risk in‑house via The Clearing Company, and wire the whole thing into a broader multi‑asset venue where collateral actually earns its keep across products. As Brian Armstrong has put it in other contexts, Coinbase wants to be “the most trusted bridge” into the crypto economy, and in that frame, everything else—from MiFID hair‑splitting in Brussels to the next generation of AI‑driven oracles—is just another set of constraints to engineer around, not a reason to sit out a market.
CoinShares, a European-based digital asset manager, is slated to make its US public markets debut today following the completion of a special purpose acquisition company (SPAC) merger, highlighting the crypto industry’s deepening ties with public markets.
The company announced Wednesday that it had finalized a previously announced business combination with Vine Hill Capital Investment Corp., resulting in the formation of a new holding entity, CoinShares PLC. The combined company begins trading on the Nasdaq on Wednesday under the ticker symbol CSHR.
The transaction, first unveiled in September, values CoinShares at approximately $1.2 billion and includes a $50 million capital commitment from institutional investors.
Although the Nasdaq debut marks CoinShares’ entry into US public markets, the company was already publicly traded in Europe prior to the listing.
A US listing aims to attract institutional capital, wider analyst coverage and increased visibility, while positioning CoinShares to expand its footprint in the world’s largest financial market. The move also comes as the regulatory backdrop for digital assets in the United States continues to evolve.
CoinShares manages more than $6 billion in assets and is one of Europe’s largest crypto-focused investment firms. It is best known for its crypto exchange-traded products (ETPs), which are listed on European exchanges.

A tougher backdrop for crypto stocks
The backdrop for digital asset companies has shifted dramatically since September, when CoinShares’ SPAC deal was first announced.
The exchange-traded fund issuer’s CoinShares Bitcoin Mining ETF (WGMI) is down more than 22% in the last six months, Yahoo Finance data shows.
The crypto market has since lost more than half its value, following a broad correction in digital asset prices, declining trading volumes and the fallout from the Oct. 10 crypto liquidation event that triggered widespread deleveraging, alongside a more volatile environment for capital raising and investors.
Crypto-linked equities have been among the hardest hit. Companies such as Coinbase, Gemini and Figure Technologies are down sharply this year, while Circle has bucked the trend amid continued growth in stablecoins.

However, analysts at Bernstein don’t expect the downturn to persist. In a recent note, they said crypto-related stocks could be nearing a bottom heading into first-quarter earnings, which are widely expected to reflect weak performance.
Related: Circle plunged on CLARITY Act fears, but fundamentals unchanged — Bernstein


At Kaiko’s Cannes conference, S&P DJI and Kaiko unveiled plans to tokenize the iBoxx U.S. Treasury index on Canton, turning it into programmable on-chain IP.
Summary
- iBoxx U.S. Treasuries is being brought natively on Canton alongside DTCC’s on-chain Treasuries to support index-linked product issuance on the same infrastructure.
- S&P will distribute the index as a smart contract token embedding full index data, IP rights, licensing terms, fees and access controls.
- The model treats index data “like a financial asset,” enabling traceability, automated fee collection and reusable, scalable licensing on-chain.
At the Agora Kaiko conference in Cannes on March 31, S&P Dow Jones Indices’ Chief Product and Operations Officer Cameron Drinkwater and Kaiko CEO Ambre Soubiran unveiled a partnership to tokenize one of S&P’s flagship fixed-income benchmarks, the iBoxx U.S. Treasury index, on the Canton network, turning the index itself into a programmable on-chain IP product rather than a simple price feed.
New Canton, Kaiko and S&P DGI partnership announced
Kaiko CEO Ambre Soubiran announced that “Kaiko and S&P DGI, we’ve been partnering now in tokenizing one of the biggest S&P benchmarks, the iBoxx index, and bringing that onto the Canton Network.” The move follows DTCC’s decision to bring U.S. Treasuries natively onto Canton (CC), which Drinkwater described as “a natural opportunity for us to bring the iBoxx Treasury index also on Canton to give product developers or counterparties a tool to use with the physical underlying also on that chain.”
Soubiran emphasized this is “not just publishing the price of the benchmark on the network.” Instead, S&P is “actually creating a smart contract token that contains all of the index data,” so that clients receive “a smart contract containing the index data but also explicitly having licensing and fees and access control all embedded into a smart contract.” She framed it as “more about a distribution play rather than a data play,” delivering the full index product on-chain.
Drinkwater said choosing iBoxx was a “total no-brainer” because with DTCC putting U.S. Treasuries on Canton, “you have the underlying” and “a very active kind of treasury institutional trade landscape on Canton” plus “real demand for the iBoxx Treasury index to be used as a underlying for product issuance on the Canton chain.”
On-chain IP and data-as-asset
For S&P, tokenizing indices as full IP products changes how licensing and economics work. Drinkwater argued that “one of the great advantages for an IP issuer like ourselves on chain is we actually have better auditability, visibility in how IP is being used, reporting on that use case and… instantaneous reporting and potentially commercial exchange based on that smart contract.” In traditional markets, he noted, S&P is “dependent on delayed reporting on volumes,” often disputed, followed by “multiple months on contract settlement,” whereas on chain “the whole timeline pulls in quite considerably” with “far less opportunity for dispute.”
Soubiran linked this to a broader shift: “the more we bring capital markets applications on chain, the more we bring data on chain, especially private and IP protected data, the more we need to treat data like a financial asset.” Blockchain infrastructure, she said, enables “traceability of data and treat data like a financial asset and trace where that data goes,” which is “great from a IP protection standpoint” and for “programmatically” managing monetization of IP in financial products.
Drawing on Kaiko’s own index business, she noted that many index fee arrangements are tied to AUM and turnover, with end-of-year reconciliations still “quite heavily manual.” Moving indices on-chain allows firms to “on chain verify what is the AUM related to the financial product that is linked to your index or your benchmark” and enable “daily fee collection based on daily turnover.” It is, she said, “not necessarily a novel product, it’s just a novel way of distributing” existing benchmarks.
Composability, evergreen contracts and Canton
Both speakers highlighted composability as a key benefit of this design. “The idea of tokenizing an index is for product issuers… to consume that index product natively on chain and wrap it into a index-linked financial product,” Soubiran explained, calling the application of composability to data products “extremely new and powerful.”
Drinkwater described the structure as layered: “you can think of the token being the index and then the smart contract being wrapped around it and that’s the use case, the use case specific terms and conditions, audit rights, etc.” That wrapper “can be tailored to whatever use case clients come to us for, but then it’s repeatedly usable. It’s evergreen. It’s on chain.” Compared with today’s model, where “clients have to come to us for every use case, it’s a new schedule on their MSA,” he said this offers “a very frictionless process of getting new product issued on chain, massively speeding up timelines,” and a “reusable infrastructure that really benefits all parties.”
On why Canton matters, Drinkwater pointed to its ability to straddle public and private workflows. On fully public chains like Ethereum, “that reporting is going to be public,” which does not fit “a lot of our use cases” such as “private exchange swaps… between institutions and they don’t want that public.” Canton’s setup, he said, lets reporting be “private when it needs to be private, public where it can be public, but back to us nonetheless,” unifying reporting across use cases in a way that “in TradFi is not the case.”
Soubiran framed the broader aim as servicing “almost a new addressable market that is your existing clients moving to an infrastructure that is programmatic and a little bit more disintermediated,” stressing that “a lot of great things exist in our current financial system,” but that the opportunity lies in “making things more automated… more programmatic in the transfer of information, the transfer of data.”
S&P’s broader digital roadmap
Drinkwater placed the Kaiko and Canton partnership within S&P’s longer digital asset strategy. He recalled that SPY “was not SPY for the first decade of its life, but it flag planted,” and said S&P understands “the power of moving first and establishing real use cases in new technology.” With a brand “known and trusted by institutions and retail alike,” S&P wants “to move first and early when we have conviction in new products and new technologies because we need our brand to be firmly planted there as an established entity.”
Over the last year, he said, S&P has “very selectively” chosen “high quality players as partners and putting IP on chain where we saw very discrete and tangible use cases,” citing the on-chain S&P 500 token with Centrifuge and the Digital Markets 50 index with Genari that bundles blockchain-exposed equities and cryptocurrencies in a structure “hard to replicate in TradFi.” Even so, he signaled he is “most excited about the innovation that we’re pushing today” with tokens wrapped in smart contracts that are “tailored to use cases, but extensible and evergreen on chain,” because this “unlocks so many use cases and scalability of our IP.”
The US Senate could soon hear testimony to confirm financier Kevin Warsh as the new chair of the Federal Reserve.
Warsh, who previously served on the Fed’s Board of Governors from 2006 to 2011, has criticized the central bank’s policies under current chair Jerome Powell. Warsh has called for “regime change” and lower interest rates.
Regarding crypto, Warsh has a somewhat nuanced approach. He hails Bitcoin as a sustainable store of value, but claims it doesn’t function as money.
Lower interest rates and a fairly open attitude toward crypto could be good news for digital asset prices, which most investors perceive as risk-on. But even if Warsh passes his nomination, there’s no guarantee he’ll affect the changes expected.
Warsh wants to lower Fed interest rates, but can he?
Warsh, a graduate of Stanford and Harvard, started his career at Morgan Stanley, where he eventually became a VP and executive director. He then served as an executive secretary of the White House National Economic Council under President George W. Bush.
Bush nominated him to the Board of Governors of the Federal Reserve in 2006, where his hawkish views on inflation often differed from his colleagues. He was critical of the aggressive use of its balance sheet, which he said led to a period of “monetary dominance” that artificially depressed rates.
Some of this appears to have changed in recent years. In a November 2025 op-ed for the Wall Street Journal, Warsh criticized Powell’s leadership at the Fed, claiming that “inflation is a choice, and the Fed’s track record under Chairman Jerome Powell is one of unwise choices.”
He said “credit on Main Street is too tight” and that the Fed’s balance sheet, which is “bloated” due to past crisis-management efforts, “can be reduced significantly.”

“That largesse can be redeployed in the form of lower interest rates to support households and small and medium-size businesses,” he said.
Plans for cutting interest rates come at an economically fraught time. The US and Israel’s joint attack on Iran, which could soon escalate into an invasion if US President Donald Trump so decides, has wreaked havoc on oil prices.
Increasing oil prices had a direct effect on the core inflation metrics the Federal Reserve uses when considering rate changes. This could put the damper on any plans for rate cuts, at least certainly under Powell.
Warsh told Barron’s that the “core theory of inflation that the Fed is using” is “mistaken.” He said that “we need to fundamentally rethink macro, which is a fundamental rethink of the core economic models that the Fed is using.”
In his accounting, rising wages and commodity prices are not to blame for inflation. Rather, “at the core, I think inflation comes about when the government spends too much and prints too much.”
Returning to monetarism, as well as dumping some of the debt held by the Federal Reserve, could help address inflation concerns, in his view.
Bankers and former Bush administration officials have congratulated Warsh on the nomination. Former US Secretary of State Condoleezza Rice said the Fed would “benefit from his steady, principled leadership.”
“He understands the central bank’s key role for the United States and our allies around the world,” she said.
Bank of England Governor Andrew Bailey has also welcomed Warsh’s nomination. He said that he knew both Powell and Warsh well, and that “They’re both very qualified.”
Qualifications aside, Warsh may find it difficult to enact his preferred policies.
Roger W. Ferguson Jr., the Steven A. Tananbaum Distinguished Fellow for International Economics at the Council on Foreign Relations (CFR), and Maximilian Hippold, a research associate for international economics at CFR, wrote that Warsh won’t revolutionize the Fed.
They said that the chair alone does not make inflation rate decisions. “They are determined by the Federal Open Market Committee (FOMC), a twelve-member body that includes seven Fed governors and five regional Fed presidents.” The chair can’t change policy without convincing a majority.

Others argue that Warsh’s interest in lowering interest rates is a recent pivot and may not be a core conviction around which he will focus central bank policy. A December 2025 analysis from Deutsche Bank noted Warsh’s response to the global financial crisis in 2008, when he was a Governor at the Fed.
“His views while he was a Governor around the GFC [global financial crisis] at times skewed more hawkish than his colleagues,” the report read. “Although Warsh has argued for lower rates recently, we do not view him as structurally dovish.”
They further questioned Warsh’s plans to lower interest rates and cut assets on the Fed balance sheet. “This trade-off would only be feasible if regulatory changes are made that lower banks’ demand for reserves. While several Fed officials have made this argument recently, including Vice Chair of Supervision Bowman and Governor Miran, it is not obvious these changes are realistic in the near-term.”
“The chair has just one vote amongst a particularly divided committee.”
Warsh’s nomination and Fed independence
Commentators have also drawn attention to Warsh’s connection to the Trump administration. Warsh’s father-in-law, Ronald Lauder, is a classmate of Trump and a major donor to his political campaigns.
His relatively recent opinions on low interest rates also make him uniquely suited to the role, at least in Trump’s eyes. Ferguson and Hippold wrote, “Trump believes he has found a successor who will align with his economic priorities in Warsh.”
The president has long bemoaned Fed officials who supposedly promise rate cuts, but then raise them once in office. “It’s too bad, sort of disloyalty, but they got to do what they think is right,” he said in a speech at Davos last year.
Trump has long pushed for lower interest rates, claiming that they are needed to spur his economic development plans. Powell’s refusal to acquiesce to the White House’s request led to political scandal.
Last year, the Department of Justice (DoJ) opened a criminal investigation into Powell, alleging that he misappropriated billions of dollars for new offices for the Federal Reserve.
A federal judge recently quashed the DoJ’s subpoenas in the case. Judge James Boasberg wrote in a memorandum opinion, “A mountain of evidence suggests that the dominant purpose is to harass Powell to pressure him to lower rates. For years, the President has publicly targeted Powell because the Fed is not delivering the low rates that Trump demands.”

Regarding his pick, Trump said in a January press event in the Oval Office that it would be “inappropriate” to ask Warsh about his stance on interest rates. “I want to keep it nice and pure, but he certainly wants to cut rates, I’ve been watching him for a long time.”
Just a couple of weeks later, in an interview with NBC, Trump said Warsh understands that he wants to lower interest rates. “But I think he wants to anyway. If he came in and said ‘I want to raise them’ […] he would not have gotten the job.”
But Warsh hasn’t “gotten the job,” at least not yet. He will face tough questioning from Democrats on the Senate Banking Committee, possibly as soon as April 13.
In a letter lambasting Warsh’s role in bailing out banks in 2008, Senator Elizabeth Warren, who serves on the committee, said, “I have no doubt that you will serve as a rubber stamp on President Trump’s Wall Street First agenda.”
Warren expected written responses to this, and to Warsh’s opinion about Trump’s “witch hunts” against Powell and Fed Governor Lisa Cook, by April 2.
Magazine: Nobody knows if quantum secure cryptography will even work

Hong Kong’s first stablecoin licences failed to materialize by the expected end of March target, with the HKMA saying only that it is still advancing the process.
Hong Kong has missed an earlier end of March target for awarding its first stablecoin licences, with the Hong Kong Monetary Authority saying only that the licensing process is advancing and decisions will be announced shortly.
A spokesperson for the Hong Kong Monetary Authority (HKMA) told Cointelegraph that the HKMA is “actively taking forward the licensing matter and will announce further details in due course,” without offering a revised timetable.
The HKMA’s public register still showed no licensed stablecoin issuers at the time of writing.
The March timetable had been set out earlier by HKMA chief executive Eddie Yue, who reportedly told lawmakers in February that only a very small number of issuers would be approved initially and that reviews were focusing on use cases, risk management, anti-money laundering controls and backing assets.
HKMA misses March stablecoin target
Earlier reports indicated that global banking giants HSBC and a Standard Chartered-backed venture were among the frontrunners to receive approvals in the initial cohort, although the HKMA did not confirm the names of any successful applicants.
Hong Kong’s caution is partly a function of how strict the regime is. Cointelegraph previously reported that the city’s stablecoin framework requires issuers to fully back tokens with high-quality liquid reserves, process redemptions within one business day and maintain a physical presence in Hong Kong, alongside broader Know Your Customer and transaction monitoring controls.

The missed deadline comes as Hong Kong places stablecoin regulation at the heart of its strategy to become a global crypto and fintech hub.
China pressure clouds Hong Kong rollout
Cointelegraph previously reported that major fintech players, including Ant International, were preparing to seek Hong Kong stablecoin licenses as the city rolled out its new regime.
Related: How Hong Kong is turning tokenized bonds into real market infrastructure
In October 2025, the FT reported that Ant Group and JD.com had paused their Hong Kong stablecoin plans after regulators in mainland China, including the People’s Bank of China and the Cyberspace Administration of China, raised concerns about privately controlled digital currencies.
Big Questions: Is China hoarding gold so yuan becomes global reserve instead of USD?
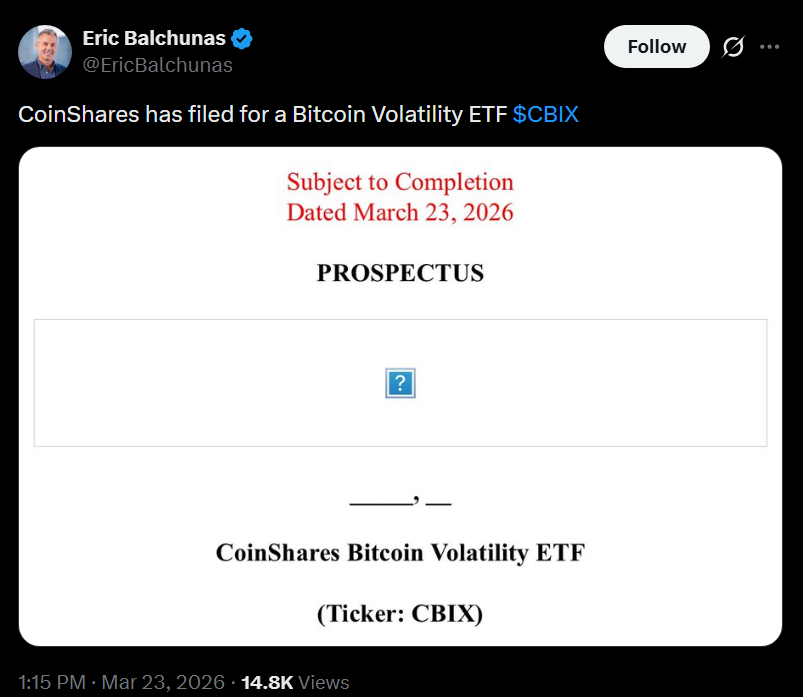
Michael Saylor’s Strategy (MSTR) looks set to restart its Bitcoin (BTC) accumulation engine after a short pause, with its STRC preferred stock likely funding fresh crypto purchases this week.
Key takeaways:
-
Strategy may purchase at least $76.25 million in Bitcoin this week.
-
Combined with a technical setup, Bitcoin may rise to $80,000 in April.
Strategy may buy at least 1,111 BTC this week
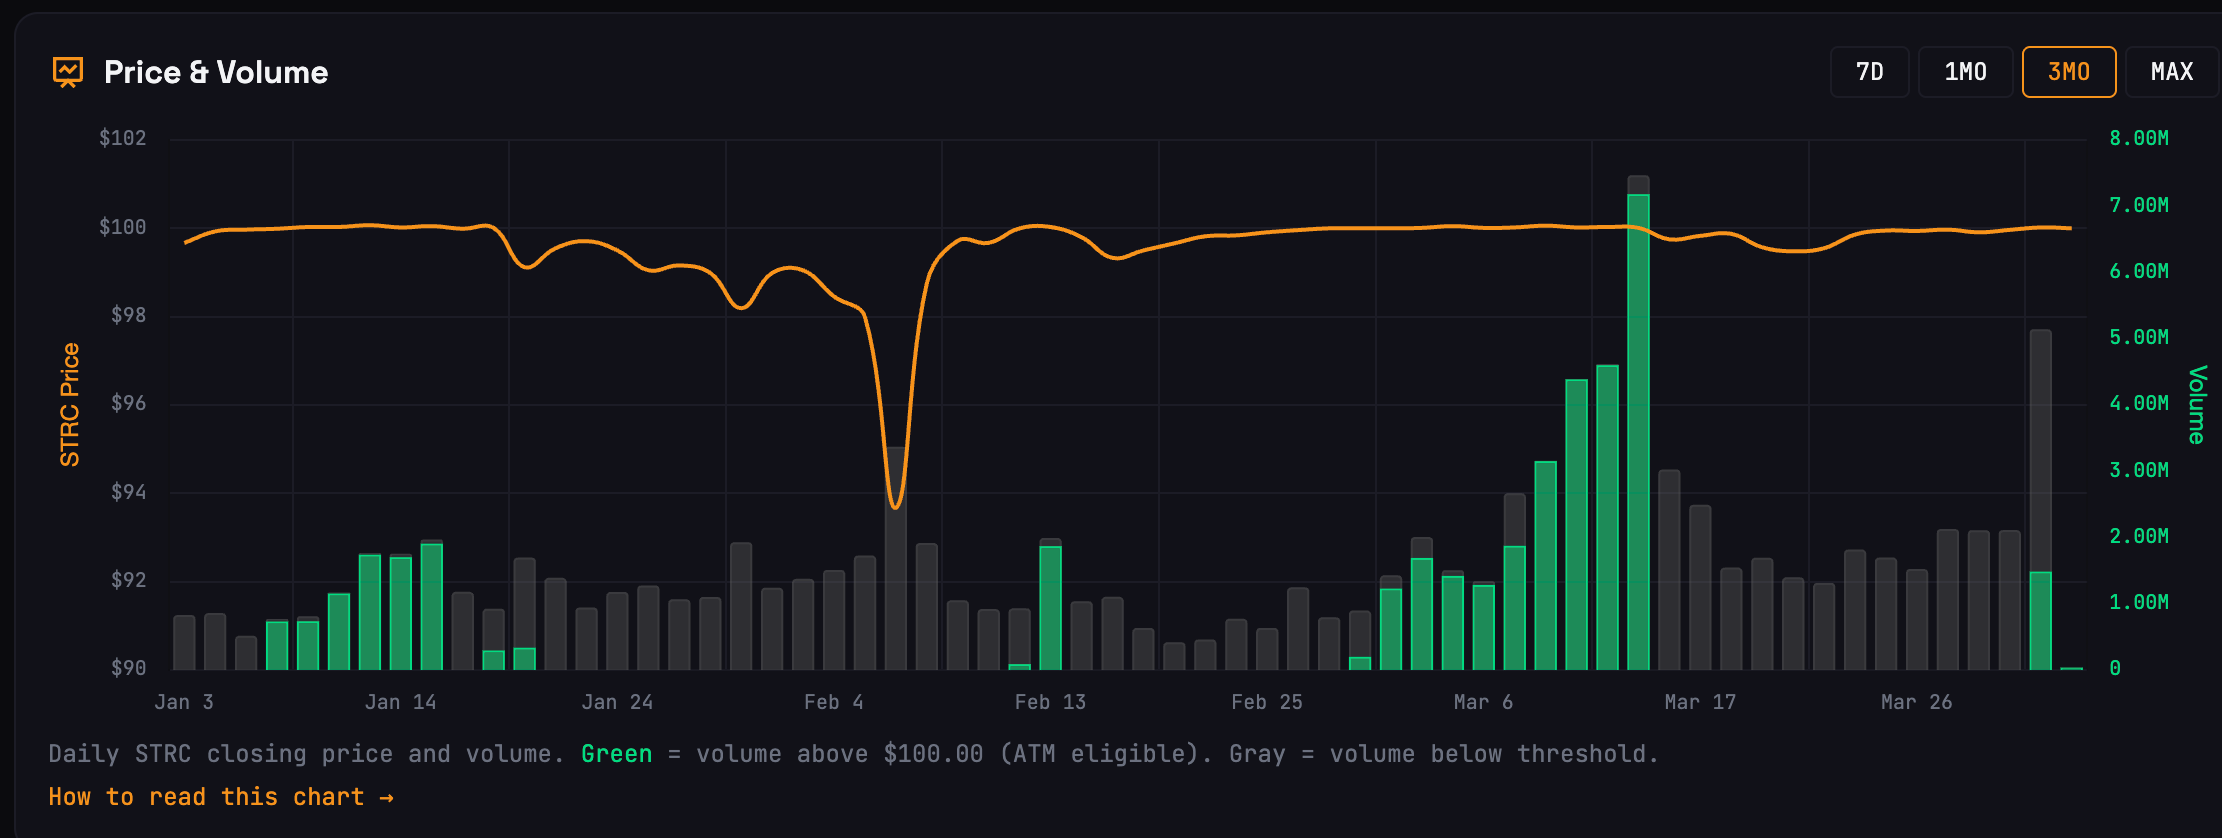
On Tuesday, STRC closed at $100.02, just above its $100 par value. Trading at or above par gives Strategy room to issue new shares, raise fresh capital and deploy the proceeds into Bitcoin.

Estimates from STRC.LIVE suggest Strategy had raised enough by Tuesday’s close to fund the purchase of more than 1,085 BTC, with the weekly total rising to over 1,111 BTC. That is equivalent to around $76.25 million.

This is a shift from the previous week, when STRC traded mostly below par and generated no estimated BTC purchases.
As of late March, the company held 762,099 BTC at an average acquisition price of about $75,694, according to its latest filings.
BTC rebounds as Strategy’s buying window reopens
The renewed buying window has coincided with a bounce in Bitcoin prices.
Since Tuesday, BTC/USD has climbed more than 5%, briefly reaching nearly $69,300. The move mirrors earlier gains seen during periods when Strategy was actively raising capital through STRC to buy Bitcoin.

One example came in the week ending March 15, when Bitcoin rose more than 10% despite weak broader risk sentiment. Over the same period, Strategy purchased 22,337 BTC worth about $1.57 billion.
The opposite dynamic emerged afterward. Bitcoin fell 14.55% over the next two weeks, roughly aligning with Strategy’s pause in purchases as STRC slipped below its $100 par value.
On March 23, Strategy unveiled a $44.1 billion capital-raising capacity to buy more Bitcoin via the sales of STRC and other preferred stocks, indicating that it would remain a meaningful source of Bitcoin demand in the coming months.
Stretch Dividend Rate maintained at 11.50% for April 2026. $STRC pic.twitter.com/8Jl0QlfNhK
— Michael Saylor (@saylor) April 1, 2026
Bitcoin eyes $80K after bouncing from flag support
From a technical standpoint, Bitcoin’s rebound began after it retested the lower boundary of its prevailing bear flag pattern as support.
BTC could advance toward the flag’s upper trendline near $80,000 in April if the recovery gains further traction, particularly if boosted by renewed Strategy buying and signs of easing Iran war tensions.

The $80,000 upside target also aligns with the 50-period exponential moving average on the three-day chart, making the area a key near-term resistance zone.
Related: Bitcoin ETFs post $1.3B in March inflows, first monthly gain of 2026
Conversely, Bitcoin risks losing the flag’s lower trendline support and confirming the pattern’s typical bearish breakdown if those supportive catalysts fade.
In that scenario, the measured downside target would come in near the $49,000–$50,000 zone. That aligns with the downside projections shared by multiple analysts in the past.
This article is produced in accordance with Cointelegraph’s Editorial Policy and is intended for informational purposes only. It does not constitute investment advice or recommendations. All investments and trades carry risk; readers are encouraged to conduct independent research before making any decisions. Cointelegraph makes no guarantees regarding the accuracy or completeness of the information presented, including forward-looking statements, and will not be liable for any loss or damage arising from reliance on this content.
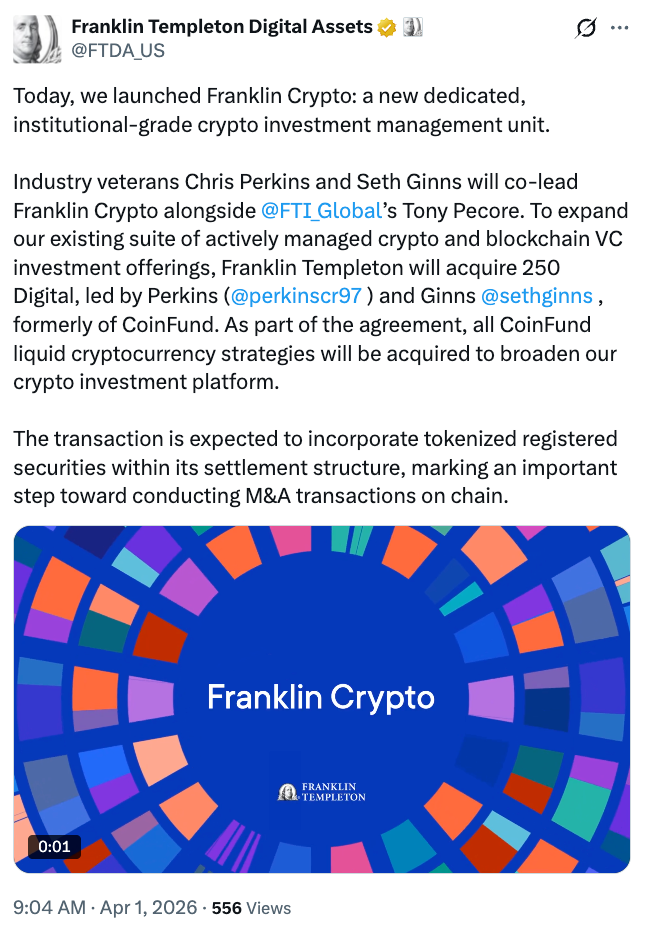
Global asset manager Franklin Templeton is set to expand its crypto footprint by acquiring a spinoff of the crypto-native investment firm CoinFund.
Franklin Templeton said Wednesday it plans to acquire 250 Digital, a CoinFund spinoff that runs liquid crypto investment strategies, expanding the asset manager’s digital asset business. The deal will form part of a new unit called Franklin Crypto once it closes.
The move follows CoinFund’s decision earlier this year to spin out its liquid strategies business into 250 Digital as the company sharpened its focus on venture investing.
Christopher Perkins will lead the new Franklin Crypto, and Seth Ginns will serve as chief investment officer alongside Franklin Templeton digital assets veteran Tony Pecore, as the company broadens its crypto investment platform for institutional clients.
The deal will incorporate BENJI tokens, which represent ownership shares in the Franklin OnChain US Government Money Fund (FOBXX), a regulated money market fund tokenized by Franklin Templeton in 2021.
Acquisition involves all liquid strategies previously run by CoinFund
Franklin said the undisclosed transaction includes the 250 Digital investment team and all liquid cryptocurrency strategies previously run by CoinFund, and that it will also invest in those strategies as part of the agreement.
The transaction is expected to close in the second quarter of 2026, subject to the execution of definitive transaction agreements, client consents and other customary closing conditions.

Franklin Templeton’s digital asset arm manages around $1.8 billion in assets and is a major institutional player in the crypto industry, where it has been building a presence since 2018.
The company is known for being one of the first to launch a US-listed spot Bitcoin ETF alongside other major asset managers such as BlackRock in 2024.
Related: Franklin Templeton, Ondo to launch tokenized ETFs with 24/7 trading via crypto wallets
The acquisition comes during a prolonged slump in the crypto market, with Bitcoin down around 45% from its peak above $126,000 recorded in October 2025.
However, Franklin Templeton says the environment is attracting talent and creating opportunities to build long-term infrastructure.
Franklin’s head of innovation, Sandy Kaul, told The Wall Street Journal the recent market selloff helped create an opening to expand.
“This big selloff that we had in the crypto markets is creating a very unique opportunity that really made us all decide that this is the right time to pull the trigger,” Kaul said.


Ripple has added digital asset capabilities to its treasury management platform, allowing corporate finance teams to hold, track and manage cryptocurrencies and fiat balances within a single system, the company said.
According to a company announcement, the update introduces Digital Asset Accounts and a unified dashboard that aggregates balances across bank accounts, custody providers and onchain wallets, giving treasury teams real-time visibility into both cash and digital assets.
The system supports assets including XRP (XRP) and Ripple USD (RLUSD), with balances updated in real time and recorded alongside fiat transactions. APIs connect external custodians and sync activity into the platform, according to Ripple.
Ripple said the update embeds digital asset functionality directly into its treasury system, rather than requiring separate crypto platforms. The company said this could reduce reliance on manual reconciliation and fragmented reporting across banking and custody systems.
Mark Johnson, chief product officer at Ripple, told Cointelegraph the shift is about making digital assets “a core part of treasury operations,” allowing companies to manage them alongside traditional balances while enabling use cases such as stablecoin settlement and yield on idle cash.
The launch follows Ripple’s October acquisition of GTreasury for $1 billion. The company said the product is already live for customers in beta ahead of a broader rollout, with availability varying by jurisdiction depending on regulatory requirements and geography.
Related: Ripple CEO says stablecoins could be crypto’s ‘ChatGPT moment’ for businesses
Digital assets move into financial infrastructure
A survey published by Ripple in March found that 72% of more than 1,000 global finance leaders believe companies must offer digital asset solutions to remain competitive, reflecting growing focus on custody, security and infrastructure.
The findings point to a broader shift from adoption to integration, as institutions look to incorporate these assets into existing financial systems rather than manage them separately.
That transition is driving increased activity across financial infrastructure. In July, Visa expanded its settlement platform to support additional stablecoins and blockchain networks, building on its initial use of USDC (USDC) for settlement in 2021.
Banks have also begun integrating tokenized money into their operations. In November, JPMorgan expanded access to its JPM Coin deposit token, allowing institutional clients to move funds on blockchain networks for real-time settlement.
Similar efforts are emerging in credit and capital markets. In October, Securitize and BNY said they would collaborate to bring instruments such as collateralized loan obligations onchain.
Magazine: XRP yet to ‘price in’ 3 bullish catalysts, Bitcoin to $80K? Trade Secrets
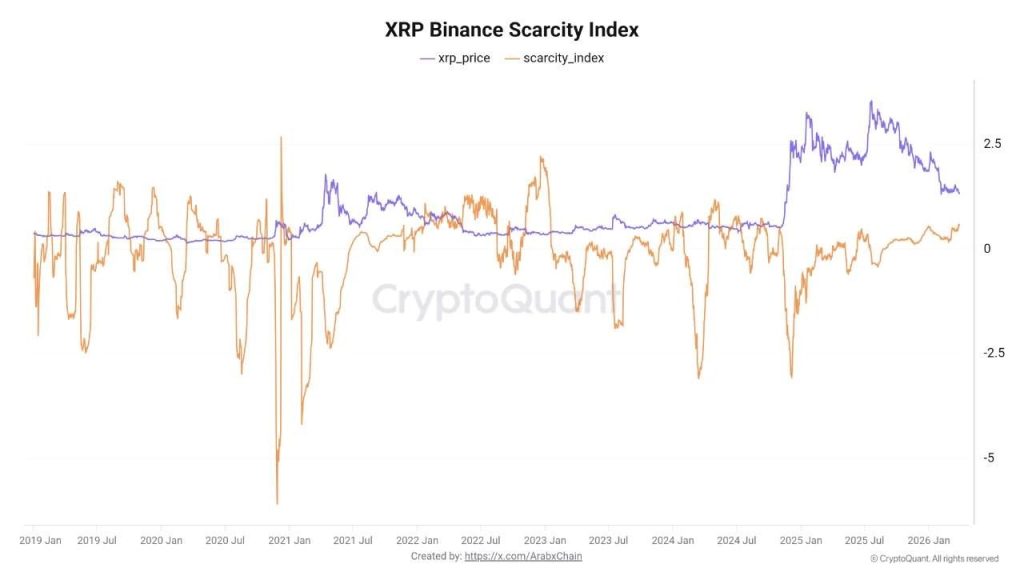
XRP crypto is trading at $1.32, and while the price chart looks fragile, the on-chain data underneath it is telling a different story.
Chain’s scarcity indicator for XRP on Binance has hit 0.59 – its highest reading since 2024 – as coins leave exchanges at a pace that is mechanically compressing the available sell-side pool.
The magnitude is not subtle. On March 10 alone, approximately $738 million worth of XRP was withdrawn from major platforms in a single 24-hour window, described by analysts as one of the most substantial single-day net outflows recorded year-to-date.

February saw 7.03 billion XRP exit centralized exchanges entirely, with Binance accounting for roughly 3.38 billion of that volume. The supply mechanics are shifting – but the price hasn’t fully priced it in yet.
Discover: The best pre-launch token sales
XRP Crypto Price Prediction: Can $1.40 Hold as Exchange Balances Drop?
XRP is pressing against the $1.40 resistance zone that analysts have flagged as the critical battleground. Below it, the $1.27–$1.30 band represents the next meaningful support cluster.
The RSI on the daily is hovering near 42 – not oversold, but not generating momentum signals either. The 50-day EMA sits just above spot price, capping intraday recovery attempts.
The on-chain divergence is the real tension here. Whale wallets accumulated approximately 40 million XRP in March even as US-listed XRP spot ETFs – now holding a combined $1.02 billion in assets – recorded $30.12 million in net outflows over the same period.
CoinShares data puts global XRP fund outflows at $130 million for the month. Institutional selling and whale buying are colliding directly at $1.40.
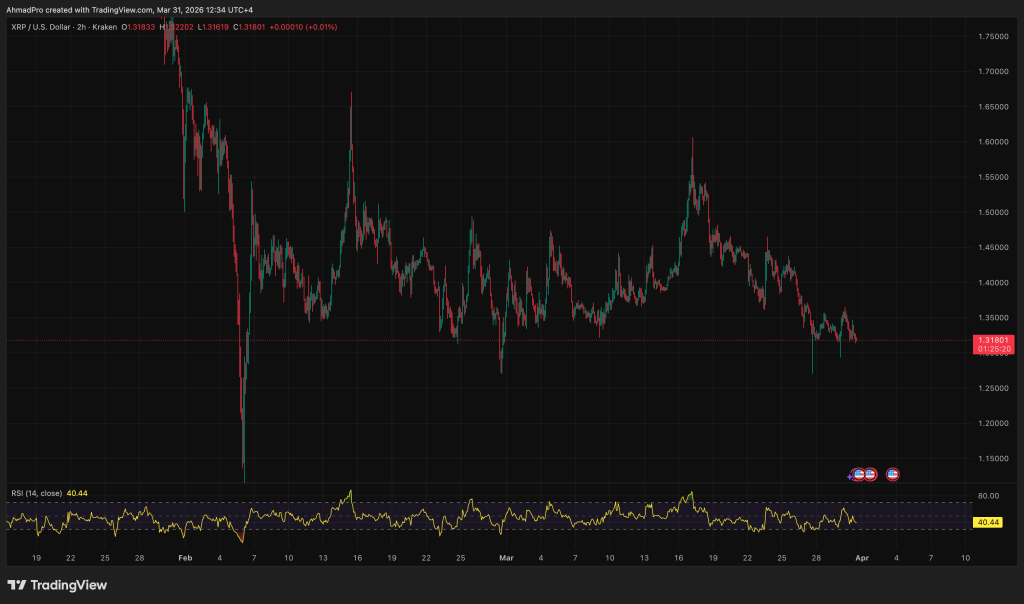
On the chart, $1.27 is the line that really matters, because as long as price holds above it, the accumulation story stays intact, especially with whales stepping in and ETF flows starting to stabilize, which could open the door for a push through $1.40 and a move higher if momentum follows.
But right now it is more of a tug of war, with XRP likely chopping between $1.27 and $1.40 while the market figures itself out, because you have strong accumulation on one side and lingering sell pressure on the other, and neither has fully taken control yet.
If that $1.27 level breaks clean with volume, the whole setup starts to fall apart fast and opens the door for a deeper pullback, because at that point price is no longer respecting the accumulation zone, and that always takes priority over any on chain signal.
What makes this cycle different is the institutional layer, with players like Bitwise holding massive chunks of XRP through ETF products, meaning even small outflows can hit the order book hard, while Ripple keeps building out its infrastructure in the background, which is exactly the kind of long term story bigger players tend to front run.
Explore: Best crypto assets to diversify your portfolio
The post XRP Crypto Holders Pull Coins Off Exchanges, On-Chain Data Signals Supply Shock appeared first on Cryptonews.

Will Hedera price crash as stablecoin supply and app revenue decline?

Russell Crowe’s WWII Thriller Is Still One of the Most Addictive War Dramas on Netflix

Money Has Many Names | But One Truth #shorts#youtubeshorts


-

 Business6 days ago
Instagram, YouTube Found Responsible for Teen’s Mental Health Struggle in Historic Ruling
-
 Tech6 days ago
Intercom’s new post-trained Fin Apex 1.0 beats GPT-5.4 and Claude Sonnet 4.6 at customer service resolutions
-

 NewsBeat5 days ago
The Story hosts event on Durham’s historic registers
-

 Sports5 days ago
Sweet Sixteen Game Thread: Tide vs Michigan
-
Entertainment2 days ago
Fans slam 'heartbreaking' Barbie Dream Fest convention debacle with 'cardboard cutout' experience
-
 Entertainment4 days ago
Lana Del Rey Celebrates Her Husband’s 51st Birthday In New Post
-
Crypto World2 days ago
Dems press CFTC, ethics board on prediction-market insider trades
-

 Tech3 days ago
The Pixel 10a doesn’t have a camera bump, and it’s great
-

 Crypto World5 hours ago
Gold Price Prediction: Worst Month in 17 Years fo Save Haven Rock
-

 Sports1 day ago
Tallest college basketball player ever, standing at 7-foot-9, entering transfer portal
-

 Tech2 days ago
EE TV is using AI to help you find something to watch
-

 Tech2 days ago
Apple will hide your email address from apps and websites, but not cops
-

 Entertainment7 days ago
HBO’s Harry Potter Series Will Definitely Fail For One Big Reason, And It’s Not J.K. Rowling Or Snape
-

 Tech2 days ago
How to back up your iPhone & iPad to your Mac before something goes wrong
-

 Tech2 days ago
Flipsnack and the shift toward motion-first business content with living visuals
-

 Fashion6 days ago
En Vogue in Brown Leather and Tailored Neutrals by Atelier Savoir, Styled by J Bolin
-

 Politics2 days ago
Should Trump Be Scared Strait?
-

 Crypto World2 days ago
U.S. rule change may open trillions in 401(k) funds to crypto
-

 Fashion6 days ago
What Are Your Favorite T-Shirts for the Weekend?
-

 Fashion5 days ago
Weekly News Update, 3.27.26 – Corporette.com
You must be logged in to post a comment Login