
Crypto World
Allbirds rides the AI compute wave


Allbirds (BIRD) surged as much as 400% after saying it will pivot from making sneakers into AI computation services, underscoring one of the market’s dominant themes: the race to secure scarce AI infrastructure.
The company said it agreed to sell its footwear brand to American Exchange Group (AXNY) and reinvent itself as NewBird AI, backed by a $50 million convertible financing facility to acquire processing units and build AI infrastructure.
The loan is roughly double the company’s $22 million pre-announcement market cap.
Demand for computing power to support AI is surging, while supply remains constrained. The scarcity has already prompted bitcoin miners such as Bitfarms, now renamed Keel (KEEL), and MARA Holdings (MARA) to reduce or abandon their crypto aspirations and switch their computing resources into supporting the AI industry.
Now, echoing the headlong rush into blockchain technology that engulfed companies such as Long Island Iced Tea Corp. in 2017, it seems even small-cap companies are attempting to position themselves to capture the AI opportunity.
Allbirds’ pivot comes after a steep decline in its core business, with the stock down roughly 99% from its peak. The shares, which closed $2.49 on Tuesday, surged to as high as $12.72 and were recently trading around $11.
Convertible financing means the investor initially provides capital to the company as debt, and can later convert it into equity, often at a discount, which can lead to significant dilution for existing shareholders.
UPDATE (April 15, 14:34 UTC): Updates share price move, adds bitcoin miners in fourth paragraph, Long Island Iced Tea in fifth.


Australian rapper Iggy Azalea has been hit with a class action lawsuit accusing her of falsely promoting the use cases of her cryptocurrency MOTHER and causing investors financial losses.
Azalea, real name is Amethyst Amelia Kelly, was named today by crypto legal firm Burwick Law in a suit filed in the New York Southern District Court.
The suit details how the rapper promoted MOTHER as an exclusive means of accessing her online casino, MOTHERLAND, and as a means of securing discounts with mobile firm Unreal Mobile.
However, it claims that the casino was never entirely dependent on MOTHER, and often dealt with stablecoin tether (USDT). It also notes that the Unreal Mobile MOTHER integration never occurred.
Read more: N3on promised ‘up, up, up’ memecoin without any risk — it’s down 96%
Another luxury marketplace launched by Kelly, Dream Vault, made similar exclusivity promises regarding MOTHER’s usage, but these were never present, according to the lawsuit.
Overall, the lawsuit alleges that the promises surrounding MOTHER’s utility uses, market support, and access rights were “limited, incomplete, contradicted, temporary, or not delivered.”
It also claims that buyers were misled, and that Kelly misrepresented the token’s economics and the amount of tokens owned by insiders. She claimed to only hold 3% of the supply.
However, crypto analysts like Bubblemaps noted that 20% of the supply was bought by insiders before Kelly’s public launch, and they sold their holdings for $2 million.
The lawsuit’s various claims for relief accuse the defendants of deceptive practices, false advertising, negligent misrepresentation, and unjust enrichment. It seeks various compensatory damages to cover the losses the victims have allegedly suffered.
Burwick Law’s Azalea suit shows signs of AI usage
Burwick Law was recently forced to apologise for and correct various citations and grammatical errors, including multiple misplaced quotation marks, in its lawsuit against memecoin platform Pump Fun.
The firm wrote that the errors “do not affect any substantive legal argument in the opposition,” and that it “regrets these errors and any inconvenience to the court or opposing counsel.”
However, these flaws could point to signs of potential AI usage, something which also appears to be present in its Azeala lawsuit.
Read more: ‘Hawk Tuah’ star pulled into expanding memecoin lawsuit
Indeed, the suit is littered with complex sentence structures, colons, and em dashes. There are also multiple short sentences that open paragraphs while adding little to no extra information.
Protos has reached out to Burwick Law and Azalea’s talent agency, United Talent Agency, for comment and will update this piece should we hear anything back.
Got a tip? Send us an email securely via Protos Leaks. For more informed news and investigations, follow us on X, Bluesky, and Google News, or subscribe to our YouTube channel.
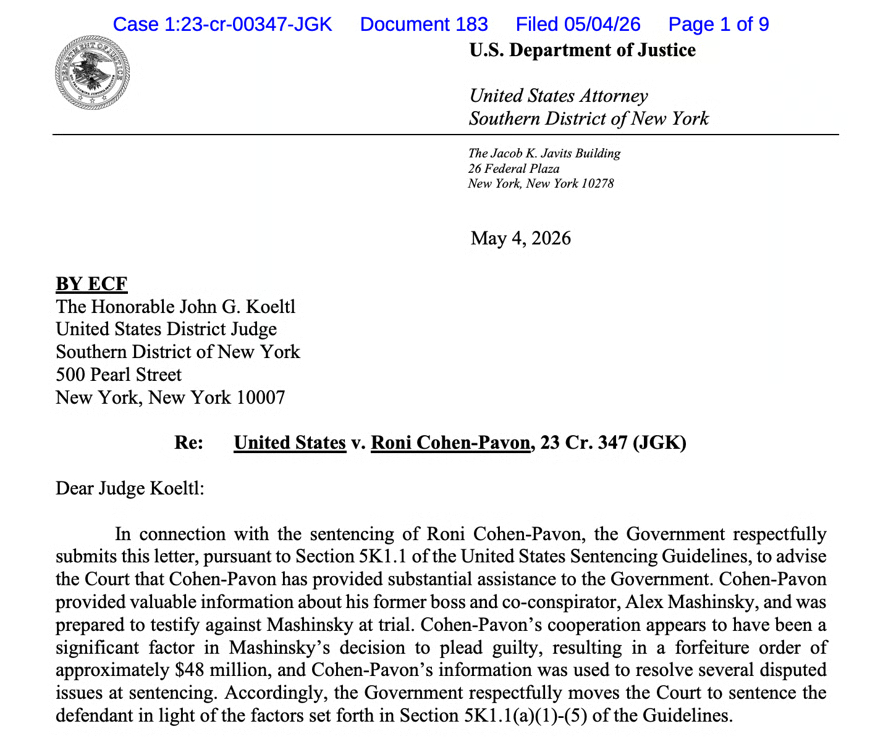
Federal prosecutors are recommending a light sentence for Roni Cohen-Pavon, the former chief revenue officer of defunct cryptocurrency lending platform Celsius.
In a Monday letter filed in the US District Court for the Southern District of New York (SDNY), US Attorney Jay Clayton cited Cohen-Pavon’s “substantial assistance” to the government, by being prepared to testify against former Celsius CEO Alex Mashinsky.
Prosecutors did not request a specific amount of time for the former chief revenue officer to spend in prison, instead asking the judge to consider the sentencing guidelines for an “appropriate sentencing reduction for a defendant who has rendered substantial assistance.”
“As soon as he pled guilty, Cohen-Pavon’s cooperation was public and known to Mashinsky,” said Clayton. “Cohen-Pavon’s cooperation was likely a significant factor in Mashinsky’s decision to plead guilty a few months prior to his January 2025 trial date.”
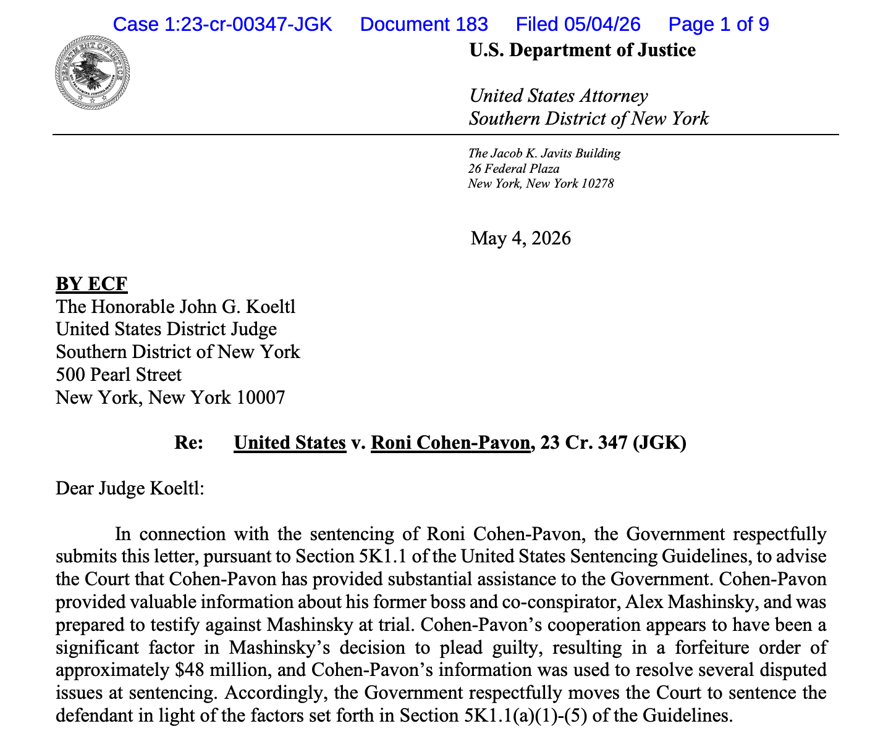
Excerpt from US Attorney’s letter in Cohen-Pavon sentencing. Source: PACER
Cohen-Pavon pleaded guilty to fraud and conspiracy to commit price manipulation related to Celsius’s CEL token in September 2023 as part of his role in the crypto lending platform’s activities that led to the loss of billions of dollars when the company collapsed in 2022. He had been scheduled to be sentenced before Judge John Koeltl on May 7, but on Monday the judge moved the sentencing hearing to May 13.
Related: Celsius founder Alex Mashinsky settles FTC case with $10M payment
Mashinsky, the public face of Celsius and one of the most prominent figures in the cryptocurrency industry at the time, was sentenced to 12 years in prison in May 2025 after pleading guilty to commodities and securities fraud. Many experts saw the fall of Celsius as intertwined with the 2022 crypto market downturn that resulted in the collapse of several exchanges, including FTX and Voyager Digital.
Cohen-Pavon’s lawyers asked for time served ahead of his sentencing hearing, saying that the former Celsius executive took “full responsibility for his conduct and the harms caused by his participation in the CEL token manipulation scheme.”
No new trial for former FTX CEO
The sentencing hearing, expected to wrap up the criminal cases associated with Celsius, will come after another SDNY federal judge denied former FTX CEO Sam Bankman-Fried’s request for a new trial. Bankman-Fried, also known as SBF, asked for a new trial by claiming that the judge overseeing his 2023 trial, Lewis Kaplan, showed “manifest prejudice” during the proceedings. He still awaits the results of a motion to overturn his conviction and sentence in appellate court.
Magazine: How to fix suspected insider trading on Polymarket and Kalshi

The Crypto Fear and Greed Index hit 50 on Tuesday, measuring “neutral” for the first time since Jan. 17. This shift ended a 108-day stretch dominated by negative sentiment. The index gauges market sentiment using volatility, momentum, trading volume, and social signals. A score below 25 signals “extreme fear” or risk aversion, while 26–49 reflects cautious positioning or “fear,” with higher readings indicating improving investor confidence.
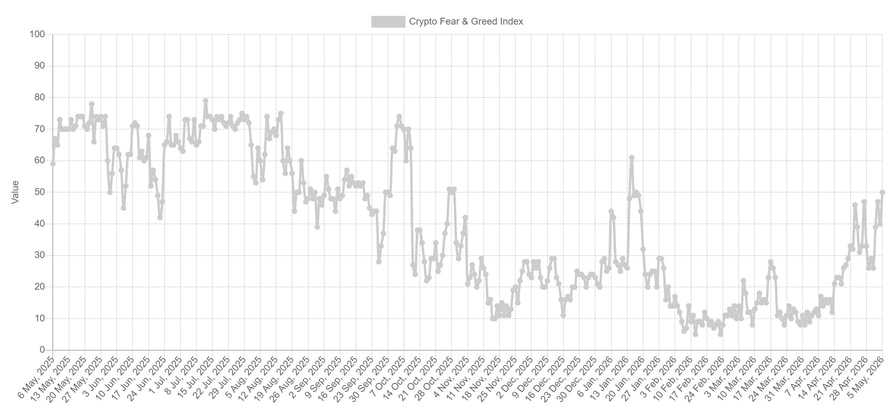
Crypto Fear and Greed Index. Source: Alternative.me
The index’s move to 50 marks its first neutral score since mid-January and follows a steady recovery in the total crypto market capitalization, which rose 5.45% in May. Since March, the market has expanded by 16.51%, climbing to $2.66 trillion from $2.28 trillion.
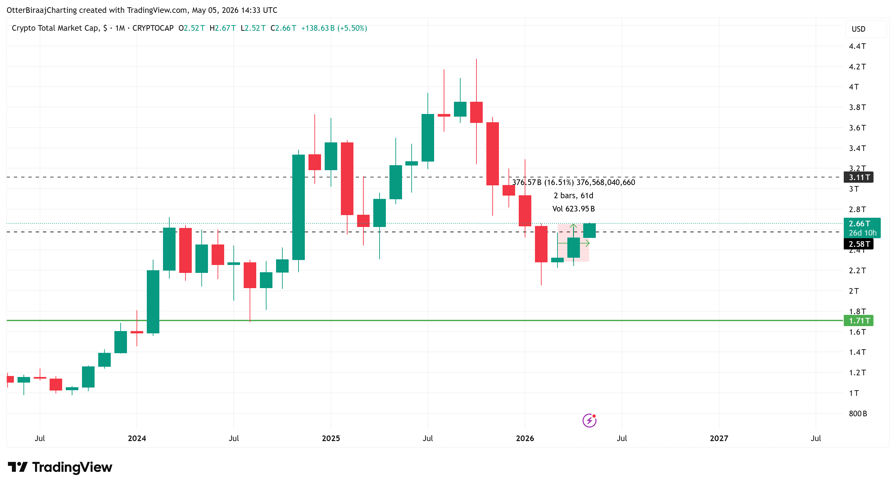
TOTAL market cap on the one-month chart. Source: Cointelegraph/TradingView
The positive shift in sentiment aligns with Bitcoin’s attempt to stabilize above the $81,000 level. Crypto analyst Darkfost noted that BTC sentiment is turning more constructive as the price tests higher levels. The analyst added that a separate sentiment index, ranging from -100 to +100, has also edged into the greed zone. This indicates that investor confidence is improving, with a growing preference to hold BTC rather than exiting positions.
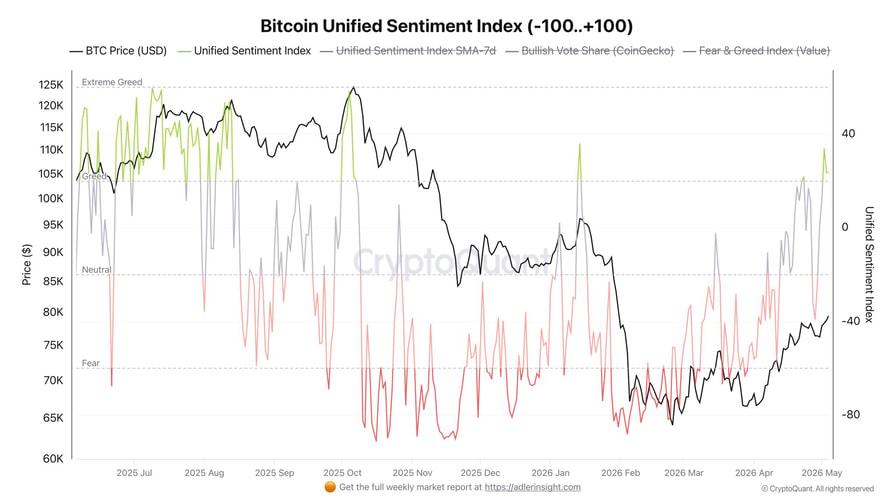
Bitcoin unified sentiment index. Source: CryptoQuant
January showed a similar shift in sentiment before the momentum faded. Darkfost pointed to the current phase as a potential pivot, with investor behavior shaping the next move.
Related: Bitcoin ‘supercycle’ or a bear market rally? BTC breaking $81K has traders at odds
Stablecoin outflows may stall momentum
Binance stablecoin netflows have recorded a cumulative outflow of $11.8 billion since April 25. This metric tracks the movement of stablecoins into and out of the exchange and is often used as a proxy for available buying power.
Positive net flows signal capital entering the exchanges, often associated with accumulation. A negative net flow indicates capital leaving, which can reduce liquidity for spot crypto purchases.
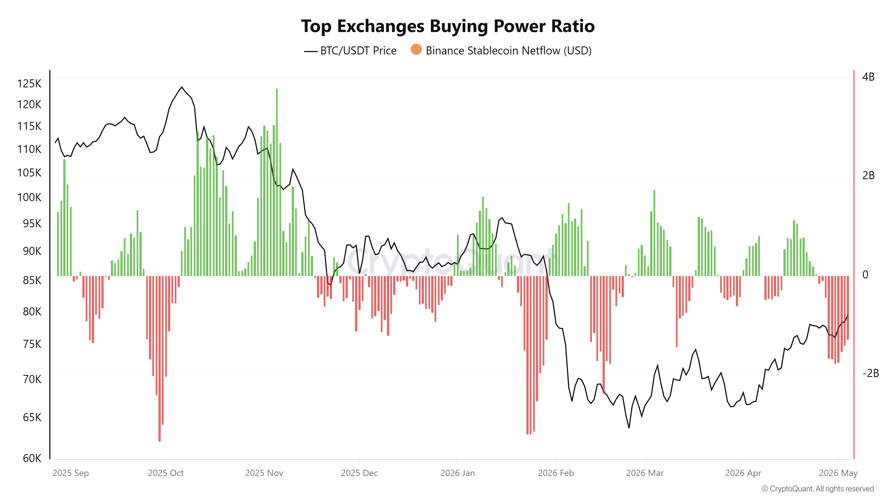
Binance stablecoin netflows. Source: CryptoQuant
Recent data shows a sustained drainage phase, with daily outflows exceeding $1.5 billion across multiple sessions. Earlier in April, Binance saw consistent inflows as Bitcoin climbed from $74,000 toward $78,000. That inflow cycle has now reversed.
Market analyst Crazzyblockk noted that the earlier buildup of stablecoin reserves helped fuel the upward movement. The current outflow trend suggests this pool of deployable capital has thinned in the short term, potentially tempering the bullish momentum for BTC and other crypto assets.
Related: Crypto products post 5th straight week of inflows despite mid-week selloff

The Tennessee Bankers Association (TBA), a trade group representing the state’s commercial banks, has selected Stablecore as a preferred technology provider for digital asset services, highlighting growing interest among regional lenders in crypto infrastructure.
In a Tuesday announcement, the TBA said Stablecore will provide infrastructure that enables community and regional banks to offer products such as stablecoins, tokenized deposits and digital asset-backed lending through their existing systems.
The endorsement gives Stablecore exposure to the association’s roughly 175 member institutions, potentially accelerating adoption among smaller banks that lack in-house digital asset capabilities.
The partnership reflects a broader trend among traditional financial institutions of seeking third-party providers to integrate crypto-related services rather than building the infrastructure internally.
Stablecore develops backend infrastructure that allows banks to issue and manage tokenized assets, including stablecoins and deposit tokens, while handling compliance and integration with core banking systems.
As previously reported by Cointelegraph, Stablecore recently joined the Jack Henry Integration Network, which provides digital banking technology to around 1,670 banks and credit unions across the United States.
Related: Crypto Biz: Capital has no consensus
Banks eye digital assets as US lawmakers debate market structure rules
TSA’s endorsement of Stablecore comes as more regional lenders look to roll out digital asset services, even as US lawmakers continue to debate the regulatory framework.
Tennessee’s junior US Senator Bill Hagerty, a member of the Senate Banking Committee, said last month that there is “still a lot more work to do” before Congress can advance comprehensive market structure legislation.
Meanwhile, Senator Thom Tillis told reporters last week that he plans to push the Senate Banking panel to take up crypto market-structure legislation when lawmakers return to session on May 11.
Proposed bills aim to clarify how stablecoins are issued and supervised, which could give banks a clearer path to offering tokenized deposits and related services.
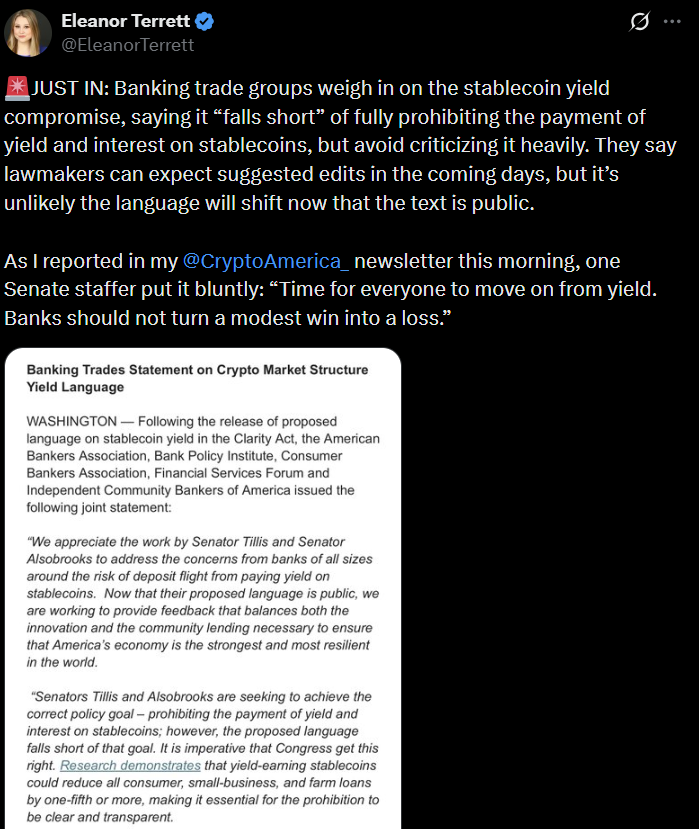
Source: Eleanor Terrett
At the same time, banking groups continue to raise concerns about stablecoin design, particularly whether issuers should be allowed to offer yield or interest. Industry advocates argue that recent compromises fall short of fully restricting yield-bearing stablecoins, potentially blurring the line between bank deposits and digital assets.
The Independent Community Bankers of America last month called on Congress to ensure the measure addresses concerns with what it called “the harmful impact on local economies of allowing crypto exchanges and other intermediaries to pay interest or yield on payment stablecoins.”
Related: Key US senator lifts block on Trump’s Fed pick Kevin Warsh


The Bullish acquisition of Equiniti, announced today, values the transfer agent at $4.2 billion
Summary
- Bullish will acquire Equiniti, a transfer agent serving 3,000 major companies and 20 million shareholders, for $4.2 billion.
- The deal positions Bullish as the global infrastructure provider for tokenized securities at institutional scale.
- Equiniti’s existing shareholder registry network gives Bullish immediate reach into the ownership data that tokenized securities require.
The Bullish acquisition of Equiniti, announced on May 5, positions the crypto exchange as a core piece of infrastructure for tokenized securities markets. Equiniti currently serves as a transfer agent for 3,000 major companies and manages records for approximately 20 million shareholders, giving Bullish immediate access to the institutional backbone of traditional equity markets. Bullish described the deal as creating “the global transfer agent for tokenized securities.”
Transfer agents occupy a critical position in capital markets. They maintain official records of share ownership, process dividend payments, and manage corporate actions like stock splits. Acquiring one at Equiniti’s scale gives Bullish a direct line into the ownership data that tokenized securities need to function at institutional grade.
What Equiniti’s client base means at scale
The deal arrives as the regulatory and institutional infrastructure for tokenized securities is rapidly taking shape. Nasdaq won SEC approval to trial tokenized stock trading in March 2026, and the Federal Reserve issued guidance on how banks should treat tokenized securities, establishing the regulatory framework that makes deals like this commercially viable.
Bullish’s move is larger in ambition than either of those. Buying a traditional financial infrastructure firm and reorienting it around tokenization is a bet that the next phase of capital markets runs on blockchain rails, and that owning the transfer agent layer is the most defensible position in that transition.
A transfer agent that handles 20 million shareholders does not just hold records. It holds the relationships, the legal registrations, and the operational history that tokenized equity issuers will need to port onto blockchain infrastructure with regulatory confidence.
Tokenized stocks have already reached a $1.2 billion market cap as institutional interest accelerates, with Nasdaq, Securitize, and Ondo Finance all building competing infrastructure. Bullish’s acquisition of Equiniti gives it a structural advantage none of those competitors can replicate quickly: a working transfer agent with 3,000 existing corporate clients and 20 million shareholder records already in place.
XRP price is just getting a direct challenge as three of the world’s most-used AI models analysis have more than a $4 gap against an analyst. Finance commentator Austin Hilton reviewed predictions from ChatGPT, Grok, and Google Gemini and rejected all three. His counter-target: $4 to $7 by end-2026.
Hilton laid out his case as ChatGPT pegs XRP at $2.15. Google Gemini lands at $3.15. Grok goes the highest among the AI trio at $3.50. Hilton’s critique is about assumptions. The models, he argues, are “dramatically too low” because they fail to price in a wave of institutional capital he expects to flood Bitcoin, Ethereum, and XRP before year-end.
He also identifies Q4 2026 as the decisive window, contingent on two macro triggers: passage of the CLARITY Act and a de-escalation of Iran-U.S. tensions, both of which, he notes, are showing early signs of progress.
Discover: The best crypto to diversify your portfolio with
XRP Price Analysis: $7 Before 2027 Plausible?
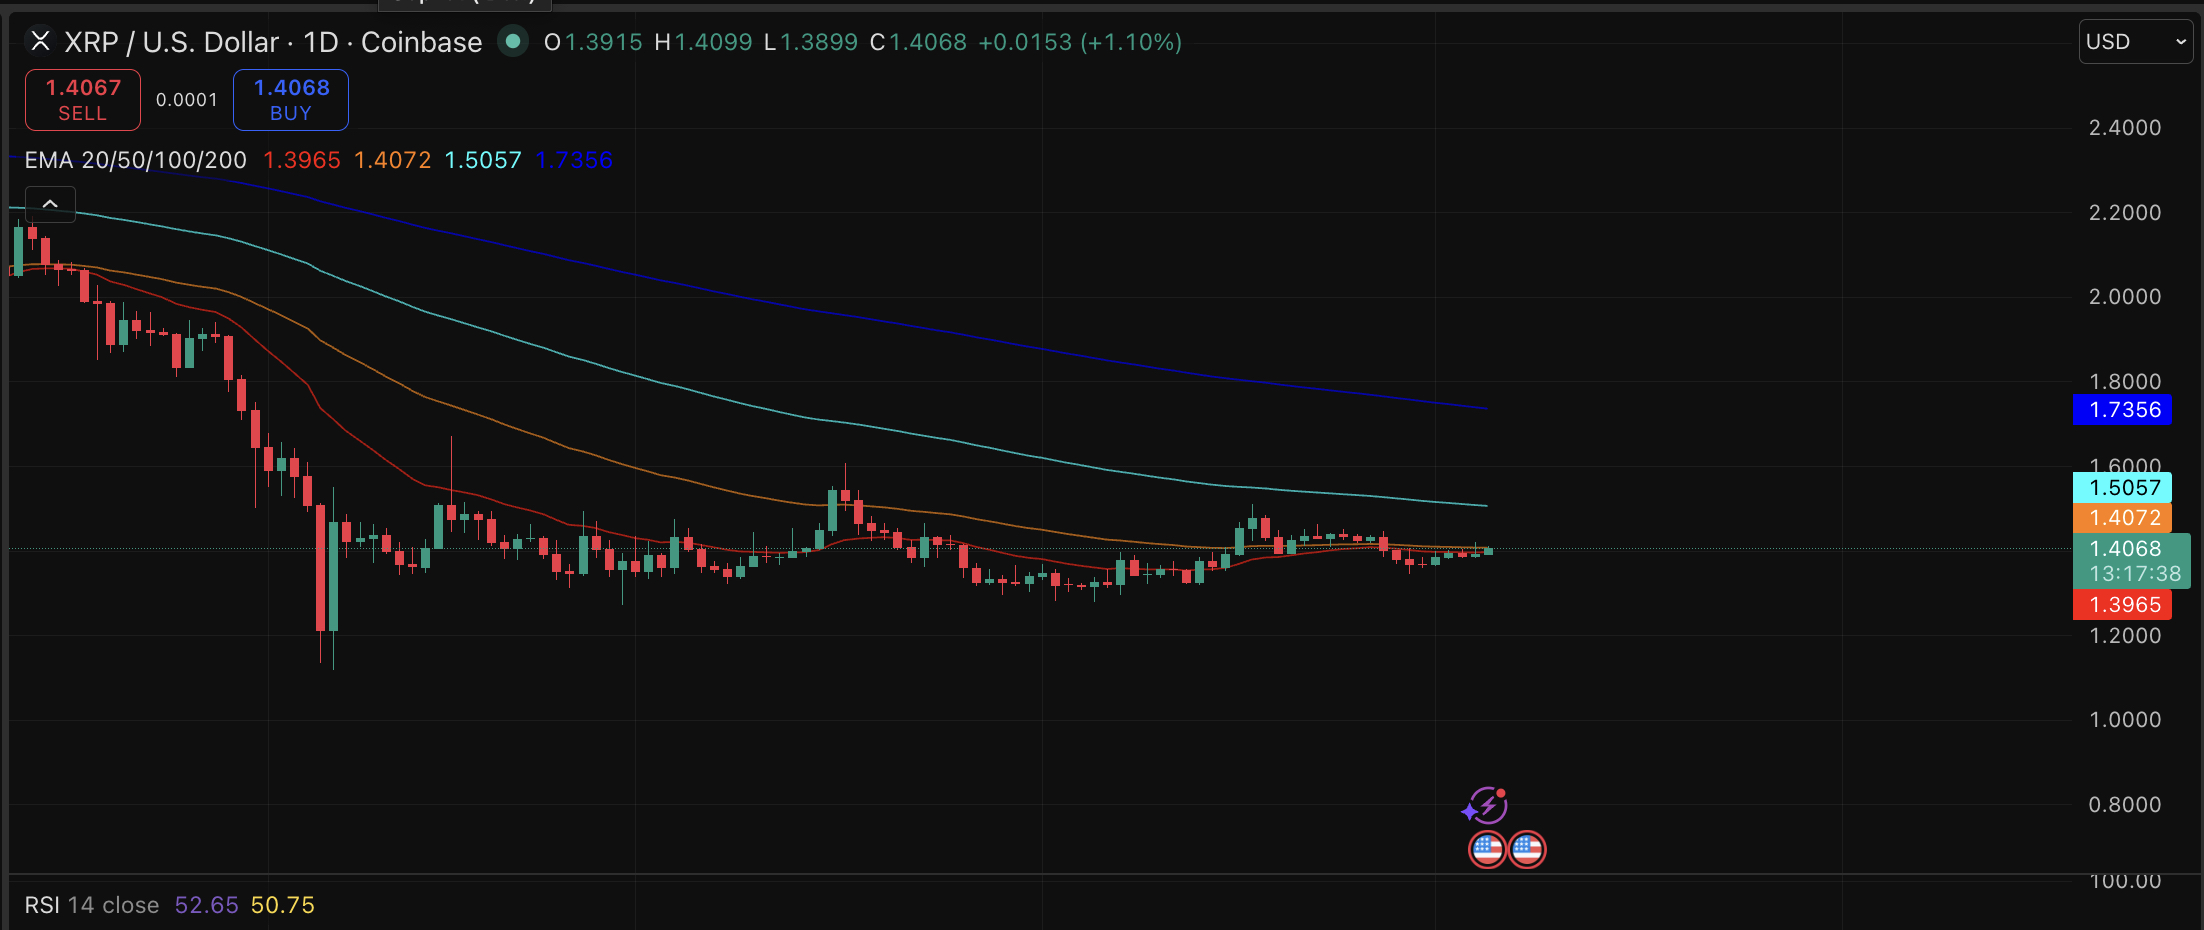
XRP’s technical picture is one of post-peak consolidation. The asset hit an all-time high of $3.65 last year and has since pulled back since then. The 24-hour range of $1.40 reflects tight compression, often a precursor to a directional move.
Key supports sit at $1.35 and $1.28 in the event of a deep correction following Ripple’s 1 billion XRP unlock, though near-term traders are watching the $1.38 level as the more immediate floor.

The best-case scenario for XRP can happen if the CLARITY Act clears Congress, followed by accelerating institutional inflows. In that scenario, price might retest $2 and target Hilton’s $4–$7 range in the long run.
Liquidity dynamics on Binance remain a critical variable. Other AI models have also weighed in on XRP’s trajectory — with similarly conservative outputs that analysts like Hilton continue to contest.
Discover: The best pre-launch token sales
Bitcoin Hyper Targets Early Mover Upside as XRP Stuck
XRP offers real upside, but Hilton’s own $7 target implies roughly less than 5x from here. That’s the ceiling on a best-case scenario for an already-established asset. Early-stage infrastructure plays work differently. The profit math is more aggressive.
Bitcoin Hyper ($HYPER) is positioning as the first Bitcoin Layer 2 with Solana Virtual Machine (SVM) integration, a technical combination that addresses Bitcoin’s three core limitations simultaneously. No more slow transactions, high fees, and the absence of programmable smart contracts.
The presale has raised $32.5 million at a current price of just $0.013, with staking available for early participants at a big 36% APY. The SVM integration is the differentiator. It’s not just faster than Bitcoin’s base layer, but engineered to outperform Solana’s own throughput while preserving Bitcoin’s security model.
Research Bitcoin Hyper Here.
The post XRP Price Analysis: AI Predictions Are Wrong Says Analyst appeared first on Cryptonews.


Bitcoin Core developers today disclosed a bug that has allowed miners to remotely crash and execute code on other people’s nodes.
The vulnerability, CVE-2024-52911, has affected Bitcoin Core 0.14.1 through 28.4. Developer Cory Fields responsibly disclosed and helped patch the high severity error via Pull Request (PR) 31112.
Had a miner wanted to utilize the dark trick, they could have executed software code on assorted nodes across the globe.
Fortunately, the bug remained obscure and likely not utilized due to its incredibly expensive attack vector.
Specifically, the attack required a miner to direct electricity-guzzling hashpower toward mining special types of blocks. A guaranteed opportunity cost, these invalid blocks could not become eligible for an actual coinbase reward to recoup the miners’ electricity costs.
Still, the mechanism of attack is easy to understand, albeit expensive to conduct.
A miner that produced a specially crafted block with sufficient proof-of-work could either crash victim nodes and/or use the crash to overtake its memory for remote code execution.
Bitcoin Core admitted that remote code execution was possible, although it did not cite specific examples of it occurring. It highlighted not only its cost and old age, but also the constraints on block data that have made it historically unlikely that miners engaged in meaningful episodes of puppeteering.
Old Bitcoin nodes still at risk of bug
Bitcoin Core’s advisory describes the bug as a script interpreter crash. During block validation, Bitcoin Core software pre-calculates and caches transaction input data, then dispatches script validation work to background threads that use computer memory.
If subjected to a CVE-2024-52911 attack, the node could keep reading from its cached memory after that data had already been freed from memory by another process.
Because this attack is a use-after-free memory bug, remote code execution is possible during this abnormal memory state.
In particular, remote code execution could occur when the node’s background script thread read cached, precomputed transaction data after it had been destroyed by a script validation, CScriptCheck.
Because upgrading a Bitcoin full node is voluntary and software updates are not automatic, a not insignificant minority of the network has delayed upgrading to version 29 (v29) or above.
Specifically, according to one popular estimate, as much as 43% of Bitcoin nodes are still running vulnerable full node software based on pre-v29 code.
Read more: Bitcoin Core devs finally patch 5-year old disk fill bug
Responsible disclosure in 2024
As early as November 2024, Cory Fields detected and privately reported the bug.
Four days after detection, Pieter Wuille pushed a fix proposal as PR 31112, titled “Improve parallel script validation error debug logging.”
The advisory purposefully read like a mundane, maintenance-style plumbing fix. Raising no alarm bells, it fixed Bitcoin Core’s check queue return handling and script validations.
Quickly, the PR by Fields and Wuille gained technical consensus for a merge into production by December 2024. Bitcoin Core 29.0 shipped with the fix by April 2025, and the final vulnerable release line, versions 28.x, reached end-of-life on April 19, 2026.
Now that node operators have had many months to upgrade, and in keeping with a policy in recent years of publicly disclosing old, previously secret bug fixes, Bitcoin Core finally announced the bug today on its website.
Bitcoin Core developer Niklas Gögge correctly noted that this is “the first ever memory safety issue” bug in Bitcoin Core. He thanked Fields for his responsible disclosure.
Bitcoin’s consensus rules were not changed by the bug fix. The bug was in node software and its use of computer memory checks, and the fix is already in current Bitcoin Core releases v29 and later.
Got a tip? Send us an email securely via Protos Leaks. For more informed news, follow us on X, Bluesky, and Google News, or subscribe to our YouTube channel.


K Wave Media reversed its $485 million Bitcoin treasury plan today, redirecting funds to AI data centres and GPUs
Summary
- K Wave Media scrapped its $500 million Bitcoin treasury strategy and redirected approximately $485 million to AI data centres and GPU infrastructure.
- Shares fell 24% on the announcement, which also came with a company rebrand to Talivar Technologies, pending shareholder approval.
- CEO Ted Kim called the reversal “a defining inflection point,” making K Wave one of the most abrupt corporate Bitcoin strategy pivots on record.
K Wave Media scrapped its Bitcoin treasury strategy on May 5 and redirected the capital to AI data centres and GPU infrastructure. The Nasdaq-listed company had been preparing a $500 million Bitcoin acquisition plan, with approximately $485 million committed.
Chief executive Ted Kim said “this marks a defining inflection point for KWM,” framing the reversal as a deliberate strategic pivot rather than a market-driven retreat.
The company also announced a rebrand to Talivar Technologies, subject to shareholder approval at its annual meeting in early July 2026. Shares fell 24% on the news, a reaction that reflects investor surprise and uncertainty about whether an AI data centre thesis offers the same clean exposure that a Bitcoin treasury position does for investors seeking digital asset access.
Why this reversal matters beyond K Wave
Corporate Bitcoin treasury adoption was one of the defining institutional stories of the past three years. As crypto.news reported, Asian companies including Top Win, Quantum Solutions, and K Wave Media all raised capital in late 2025 to expand their Bitcoin positions. K Wave’s reversal is a public repudiation of that playbook by one of the companies that had most recently committed to it.
The pivot to AI infrastructure follows a wider pattern. Several major crypto companies cited AI as a driver of capital changes in early 2026, as crypto.news documented.
Bitcoin miner Hut 8 secured $150 million from Coatue in 2024 to build an AI infrastructure platform, and K Wave is now pursuing a similar direction through data centres and acquisitions.
Coinbase announced the same day that it was cutting 700 jobs, with CEO Brian Armstrong directly attributing the reduction to AI making teams more productive.
Coinbase’s testing of AI agents inside its own operations reflects the same directional shift K Wave has now made at the capital allocation level. The 24% share price decline suggests investors are watching whether the Talivar Technologies rebrand can build a credible new thesis from scratch.
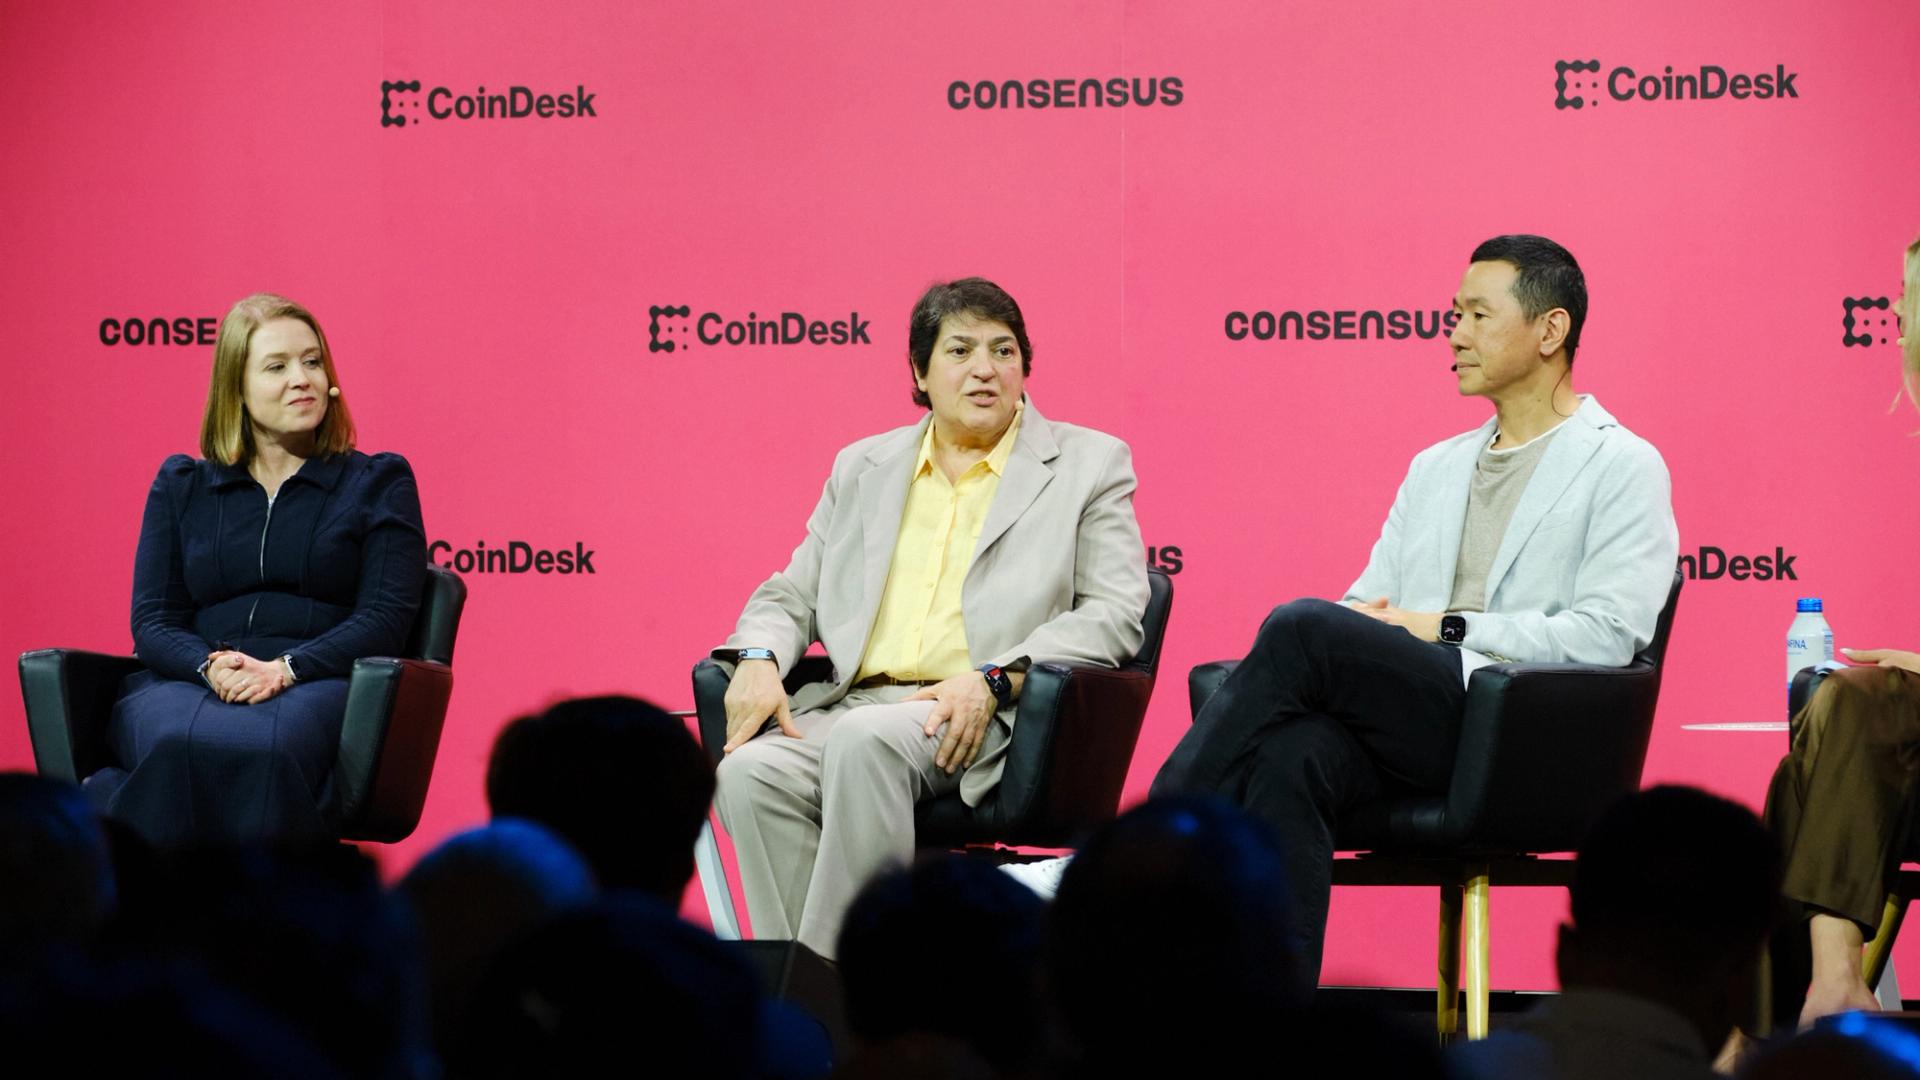

Miami Beach, FL — Tokenization is not replacing the system overnight, but it is steadily reshaping the plumbing underneath, Wall Street executives said at Consensus 2026 in Miami.
Digital asset leaders from Citi, JPMorgan and DTCC said during a panel discussion that blockchain-based rails are moving into production, with real volumes and real clients shaping how the technology is deployed.
A year ago, Citi’s tokenized deposit system was handling millions. “Now we’re moving billions,” said Ryan Rugg, who leads digital assets for the bank’s treasury and trade solutions unit.
The demand, she said, is coming from clients who want to move money around the clock, not just during banking hours.
JPMorgan is seeing a similar pattern. Its blockchain platform, Kinexys, has processed more than $1 trillion in transactions, said Kara Kennedy, who leads market development for the bank’s digital assets unit.
The focus is less on building parallel systems and more on stitching blockchain rails into existing infrastructure to enable faster settlement and continuous operations, she said.
DTCC, which sits at the center of U.S. market plumbing, is taking a longer view. The firm is working to bring parts of its $150 trillion securities infrastructure onto a shared digital layer, with initial rollout plans already underway.
“You can’t just replace what exists,” said Nadine Chakar, who heads digital assets at DTCC. “This is an evolution.”
That approach reflects a broader shift in the market. Early tokenization efforts often looked for problems to solve. Now, firms are targeting specific pain points, especially in areas such as collateral, cross-border payments, and liquidity management.
For large corporations, the ability to move funds in real time — across time zones and holidays — is changing how treasury functions operate. Instead of pre-positioning cash days in advance, firms can react instantly to margin calls or investment opportunities.
Still, the panelists pushed back on the idea that blockchain will remove intermediaries altogether. Core functions like risk management, compliance and settlement guarantees remain hard to replicate in fully decentralized systems.
“We will always need some level of intermediation,” Chakar said.
Crypto-native players, however, see a longer arc. Evan Auyang, president at Animoca Brands, said the industry is still in a transition phase, with blockchain gradually proving its efficiency before a bigger structural change.
“The nature of blockchain is that it’s transformative,” Auyang said, pointing to faster processes like loan approvals that can shrink from weeks to days. But he added that fully native onchain markets are “not ready yet,” given the scale of existing systems and regulatory constraints.
At the same time, he argued, the direction is hard to ignore. “If there’s efficiency and cost savings, it will be adopted,” he said, adding that traditional finance and decentralized systems are now “converging.”


Drift Protocol announced Tuesday the implementation of a recovery plan for users affected by a $295 million exploit on April 1, which it attributed to the North Korea state-backed DPRK hacking group identified by forensic firm Mandiant.
The attack led the protocol to suspend trading and borrowing immediately after the exploit. Drift said “the majority of stolen assets remain traceable and contained with limited successful off-ramping by the attacker,” with about 130,259 ETH (roughly $31 million) concentrated across four monitored wallets.
Drift’s statement explains that the recovery framework centers on issuing a token representing verified user losses. “Each recovery token represents $1 of verified loss,” Drift said, adding that holders would be able to redeem based on the value of a recovery pool funded over time.
That pool starts with roughly $3.8 million in remaining protocol assets and is expected to grow through exchange revenue, up to $127.5 million in support from Tether tied to performance, and up to $20 million from partners, Drift said. The pool will accrue until it matches total losses of about $295.4 million, at which point tokens can be redeemed at full value, it added.
Drift also said some funds have already been frozen, including about $3.36 million in USDC, while additional assets remain delayed in cross-chain transfers. Legal efforts to seize and reissue funds are ongoing, it said. The protocol also launched a public bounty offering 10% of recovered assets.
Drift plans to relaunch in the second quarter as a “security-first” exchange with changes including new multisig controls, time-locked operations, key rotation and reduced product scope focused on perpetuals trading.
“The Drift team is taking considered measures to ensure that users are made whole,” the team said, adding that final decisions will be subject to governance votes.
Drift’s recovery plan announcement comes a week after Aave said it was spearheading a coordinated DeFi recovery effort to rescue Kelp DAO, the second largest DeFi exploit this year, which was also carried out by North Korean-backed hackers. The so-called Lazarus group drained nearly $280 million. In this case, Aave has been able to garner span donations, deposits, and credit lines from across the crypto space.
How to get 40% off one of Cardiff’s best Indian restaurants
Jefferies lowers Shopify stock price target to $140 on deceleration concerns

Iggy Azalea allegedly mis-sold MOTHER, leading to investor losses
Manchester United reach agreement with Casemiro over contract clause amid transfer speculation

US brings back mandatory military draft registration

Steven Gerrard disagrees with Gary Neville over ‘shock’ Chelsea and Arsenal claim | Football


-

 Business7 days ago
Most Commercial Energy Audits Miss the Real Losses
-

 NewsBeat2 days ago
Channel 5 – All Creatures Great and Small series 7 new post
-

 Fashion7 days ago
Kylie Jenner’s KHY Enters a New Era with ‘Born in LA’
-
 Tech4 days ago
Trump’s 25% EU auto tariff breaches Turnberry Agreement that also covers semiconductors and digital trade
-
 Sports4 days ago
Paul Scholes issues Marcus Rashford reality check as agreement emerges over Man United star
-

 Business6 days ago
Barclay Brothers Avoid Bankruptcy: HSBC Drops High Court Petitions After IVA Deal
-
 Business6 days ago
Tesla Officially Registers Elon Musk’s Stock: What Investors Need to Know
-

 Entertainment6 days ago
Celebrities Who Are Attending the 2026 Met Gala Event
-

 Entertainment4 days ago
Met Gala 2026 Rumored Guest List Is Turning Heads
-

 Tech6 days ago
Texas Instruments made a new flagship graphing calculator: the TI-84 Evo
-

 Business5 days ago
Two Powerball Tickets Split $143 Million Jackpot in Indiana and Kansas
-

 Entertainment6 days ago
Insider Claims Reason Behind Key & Peele Split
-
Business2 days ago
Winning Numbers Drawn as Jackpot Resets to $20 Million
-

 Crypto World6 days ago
Meta (META) starts stablecoin payout to creators in Circle’s USDC on Polygon, Solana via Stripe
-

 Business6 days ago
Strait of Hormuz Remains Heavily Restricted on April 29 Amid Iran Conflict
-
 Crypto World5 days ago
CoreWeave (CRWV) Stock Climbs 8% Despite $45M Insider Share Dump
-
 Crypto World6 days ago
Securitize and Computershare Enable Tokenized Equity Issuance for Over 25,000 U.S.-Listed Stocks
-

 Entertainment4 days ago
Kylie Jenner Hit With Second Lawsuit From Ex-Housekeeper
-

 Crypto World6 days ago
Gibraltar Proposes Tokenized Funds Regulation to Bolster Compliance
-

 Sports6 days ago
Saudi Arabia set to withdraw LIV Golf funding after 2026 season, per reports
You must be logged in to post a comment Login