
Crypto World
Analytical Apple Stock Price Prediction for 2026-2030

Apple’s outlook looks materially different from the one traders were pricing a year ago. After delivering $416.2 billion in FY2025 net sales and a record $143.8 billion revenue in fiscal 2026 1Q, AAPL enters mid-2026 tied to three themes: whether the foldable iPhone expands the addressable market, whether Apple Intelligence translates into measurable Services growth, and whether a 29x forward multiple holds up if macro conditions weaken.
Analytical Apple Stock Price Prediction: Quick Answer
AAPL trades near $260 as of 6th April 2026, somewhat below its all-time high of $288.62 made in December 2025. The 12-month analyst consensus averages $304.40 across 24 analysts tracked by TipRanks, with targets ranging from $248 (Barclays) to $350 (Wedbush). MarketBeat’s average sits at $297.58.
The stock trades at approximately 29x forward earnings on consensus FY2026 EPS of $8.60–$8.80, which assumes that continued Services momentum, a full iPhone 18 and foldable launch cycle and no major tariff escalation further support AAPL’s price trajectory.
Recent Price History of AAPL
AAPL traded in a wide range over the past twelve months, swinging from around $169 near its April 2025 low to an all-time high of $288.62 in early December 2025. That represents a move of roughly 70% from trough to peak. As of 6th April 2026, AAPL is priced at around $260, having oscillated between $243 and $280 since the start of the year.
Several catalysts drove the rally. A 90-day tariff pause in April 2025 triggered an immediate bounce. Strong quarterly earnings through mid-2025 kept momentum building, and the iPhone 17 launch in September added fresh demand. Apple’s $100 billion US investment pledge in August also lifted sentiment.
The sharp swings reflected how sensitive AAPL had become to trade policy and macro headlines. In early April 2025, the stock lost over $770 billion in market capitalisation across four sessions. The recovery was equally aggressive once tariff fears eased and earnings came through.
Key Drivers Behind the Apple Stock Forecast in 2026
Several factors are driving expectations for Apple in 2026.
Services Growth
Services is now Apple’s second-largest revenue stream and its highest-margin segment. In FY2025, Services revenue set a new record of ~$109.16 billion, growing approximately 13.5%-14% year-over-year. iPhone revenue grew 4% to $209.6 billion. Fiscal Q1 2026 pushed Services to a quarterly record of $30.0 billion. Advertising, payments and cloud all set new highs. CFO Kevan Parekh has guided FY2026 Services growth at a similar rate to FY2025, pointing towards roughly $123 billion for the full year.
Greater China, Tariffs and Supply Chain Diversification
Greater China remained a pressure point in FY2025, with net sales down 4% year on year, while Europe, Japan and Rest of Asia Pacific all grew. However, Q1 FY2026 saw a sharp reversal: Greater China revenue jumped 38% to $25.5 billion. On tariffs, the US Supreme Court struck down IEEPA tariffs in February 2026, though a 10% Section 122 surcharge remains in place.
iPhone Upgrade Cycle
The iPhone 17 drove Q1 FY2026 iPhone revenue up 23% to $85.3 billion. Morgan Stanley estimates around 550 million active iPhones cannot run Apple Intelligence, highlighting a sizable installed base that may require hardware upgrades over time, potentially supporting future iPhone demand. A foldable iPhone is expected in late 2026, priced between $1,800 and $2,500.
Apple Intelligence
Apple Intelligence is live across 16+ languages on iPhone 15 Pro and newer devices. The full conversational Siri overhaul, powered by Google’s Gemini AI model, remains delayed, with a phased rollout now expected through late 2026.
Capital Returns
Apple authorised an additional $100 billion repurchase programme in May 2025 and bought back $90.7 billion of common stock during FY2025. Buybacks reduce the share count and directly support diluted EPS, which rose 19% to $2.84 in Q1 FY2026 on revenue of $143.8 billion.
Traders may keep up to date with AAPL CFD price movements in FXOpen’s TickTrader platform.
Analytical Bull, Base and Bear Scenarios for AAPL (12-Month Outlook)
In a base case, Apple keeps expanding Services, protects margins and posts steady EPS growth, supporting a gradual re-rating. In a bull case, the foldable iPhone, Apple Intelligence adoption and Greater China momentum lift the revenue mix and justify a richer multiple. In a bear case, softer consumer spending, tariff escalation and slower AI execution cap earnings.
These Apple target prices for 2026 are based on publicly available analyst consensus data from TipRanks, accessed April 2026 (24 analysts). Published values: average $304.40, high $350.00, low $248.00.
Other aggregators, including MarketBeat (average $297.58) and Ticker Nerd (median $300.00 across 77 analysts), show a broadly similar range, although exact figures vary due to differences in analyst coverage, sample windows and update frequency.
Analytical Long-Term Outlook for AAPL (2027–2030)
Projecting precise Apple stock forecasts for 2027 and beyond is difficult, especially given its 30x+ forward earnings. A more practical approach is to identify what would need to happen for AAPL to move materially higher or lower from current levels.
New Device Categories and Form Factors
The foldable iPhone, expected in late 2026, opens a price tier Apple has never occupied. If it succeeds, it adds a $1,800–$2,500 product to the lineup and lifts average selling prices. Beyond that, smart glasses (rumoured for 2027) and AI-enabled wearables could create new revenue streams. Vision Pro has underperformed commercially, so execution here is not guaranteed to lift Apple stock price predictions in 2027 and later.
AI Platform Maturity
Apple Intelligence needs to evolve from a feature set into a genuine platform by 2027–2028. If on-device AI drives measurably higher engagement, App Store spending and Services attach rates, it supports both revenue growth and a premium multiple. If Siri remains behind other voice assistants, the narrative weakens.
Regulatory Pressure on Services Economics
The EU Digital Markets Act, US DOJ antitrust trial (expected 2027), and ongoing App Store commission disputes pose structural risk to Services margins. A forced reduction in commission rates from 30% to 20% or lower would compress the segment’s contribution meaningfully over this period.
Valuation Sustainability
AAPL’s current forward P/E of roughly 29x assumes continued double-digit EPS growth. If earnings were to compound between 10% and 12% annually through 2030, the stock could continue to rate higher. If growth slows to mid-single digits, multiple compression pulls it back. Buybacks will continue to support per-share metrics, but they cannot offset a fundamental slowdown indefinitely.
How Traders Can Evaluate the Apple Stock Outlook
Traders typically break an AAPL analysis into a few core steps.
- Starting with earnings and valuation, traders check the trailing and forward P/E ratio against Apple’s five-year average and the broader S&P 500. If the premium is widening without a corresponding acceleration in EPS growth, the risk/reward shifts.
- Tracking Services momentum. Services revenue and its growth rate are the clearest signal of whether Apple is becoming a higher-margin business or staying hardware-dependent. Quarterly earnings releases break this out directly.
- Monitoring the product cycle calendar. iPhone launch quarters consistently drive the largest revenue beats. Traders check when new models ship and whether supply chain reports suggest strong or constrained demand.
- Watching macro and trade policy. AAPL’s sensitivity to tariff headlines and consumer confidence was on full display in 2025. Interest rate direction and trade policy shifts remain key swing factors.
Risks That Could Cap the Upside
China Exposure
Greater China accounts for roughly 15% of Apple’s revenue. A renewed demand slowdown or market share gains from Huawei could reverse the Q1 FY2026 recovery quickly. Geopolitical tensions add an unpredictable layer.
Valuation Compression
AAPL trades at around 29x forward earnings. That multiple leaves little room for disappointment. Any earnings miss or guidance cut would likely trigger a sharper drawdown than for a stock on a lower multiple.
Macro and Consumer Weakness
US consumer confidence sits near recessionary levels. If household spending weakens further or rate cuts stall, demand for premium devices softens. Launching a $2,000+ foldable into that environment carries timing risk.
AI Execution Gap
Google, Samsung, and Meta are shipping competitive AI features now. If the delayed Siri overhaul underwhelms when it arrives, the AI premium embedded in the stock fades and AAPL loses a key part of the upgrade narrative.
Regulatory Drag on Services
The EU DMA review report lands in May 2026 and the US DOJ antitrust trial is expected in 2027. Forced commission cuts or sideloading mandates would directly compress Apple’s margins.
Final Thoughts
Apple’s financial performance heading into 2026 is strong by any measure. Record revenue, accelerating Services growth and a large upgrade base give the stock a solid fundamental floor. But the valuation already reflects much of that strength. The path for Apple’s stock in 5 years depends on whether Apple Intelligence delivers real differentiation, whether the foldable iPhone expands the addressable market and whether macro conditions hold up.
Traders looking to explore AAPL and other stock CFDs may consider opening an FXOpen account and using the TickTrader platform for charting and analysis.
FAQ
What Is the Apple Stock Forecast for 2026?
The Apple stock prediction 2026 consensus averages $304.40 across 24 analysts on TipRanks, with a low of $248.00 and a high of $350.00. MarketBeat puts the average at $297.58, while Ticker Nerd‘s median across 77 analysts is $300.00. The spread reflects ongoing disagreement over AI execution, tariff risk, and the foldable iPhone’s impact.
What Could Push AAPL Higher?
A foldable iPhone super-cycle, faster-than-expected Apple Intelligence adoption, continued Services growth, and sustained Greater China recovery are seen as the primary upside drivers.
How Much Will Apple Stock Be Worth in 10 Years?
Analytical Apple stock predictions in 10 years are highly uncertain. The outcome depends on revenue growth, margin trajectory, new product categories and the broader market environment. Apple’s track record of compounding earnings is strong, but past returns do not guarantee future performance.
What Will Apple Stock Be Worth in 2030?
Rather than target a specific analytical Apple stock forecast for 2030, traders typically focus on what would need to go right or wrong. Sustained 10%–12% annual EPS growth and new device categories would support a higher share price. Slower growth, regulatory headwinds or multiple compression would cap analytical Apple stock price predictions for 2030.
Will Apple Stock Ever Reach $1,000?
Reaching $1,000 from roughly $255 would require a near-fourfold increase. At 12% annual EPS growth with a steady multiple, that could take well over a decade. A stock split, new revenue streams or a structural re-rating could shorten this Apple stock forecast to 5 years or more, but less than 10.
How High is Apple Stock Expected to Go?
The current Street-high 12-month target is $350, set by Wedbush analyst Dan Ives. Beyond that, longer-range projections vary widely and carry low reliability. Most analysts anchor their outlook to earnings visibility one to two years ahead.
This article represents the opinion of the Companies operating under the FXOpen brand only. It is not to be construed as an offer, solicitation, or recommendation with respect to products and services provided by the Companies operating under the FXOpen brand, nor is it to be considered financial advice.

Iran told tanker operators on Wednesday that they must pay bitcoin (BTC) to pass through the Strait of Hormuz.
The use of BTC, mentioned by name by Hamid Hosseini, a spokesman for the country’s oil exporters’ union, ensures payments “can’t be traced or confiscated due to sanctions,” even though the first part of that quote is certainly inaccurate.
Moreover, there will be “a few seconds” to pay, according to the spokesman.
All BTC can be traced on-chain, and the US Treasury has sanctioned Iranian BTC wallet addresses since at least 2018.
Even more embarrassingly, the spokesman claimed that BTC payments will complete within seconds, even though BTC transactions normally require several minutes to settle.
Anyway, Hosseini claims that oil tankers will somehow email Iranian authorities about cargo, submit to an inspection, and then pay a toll of $1 per barrel of oil in BTC.
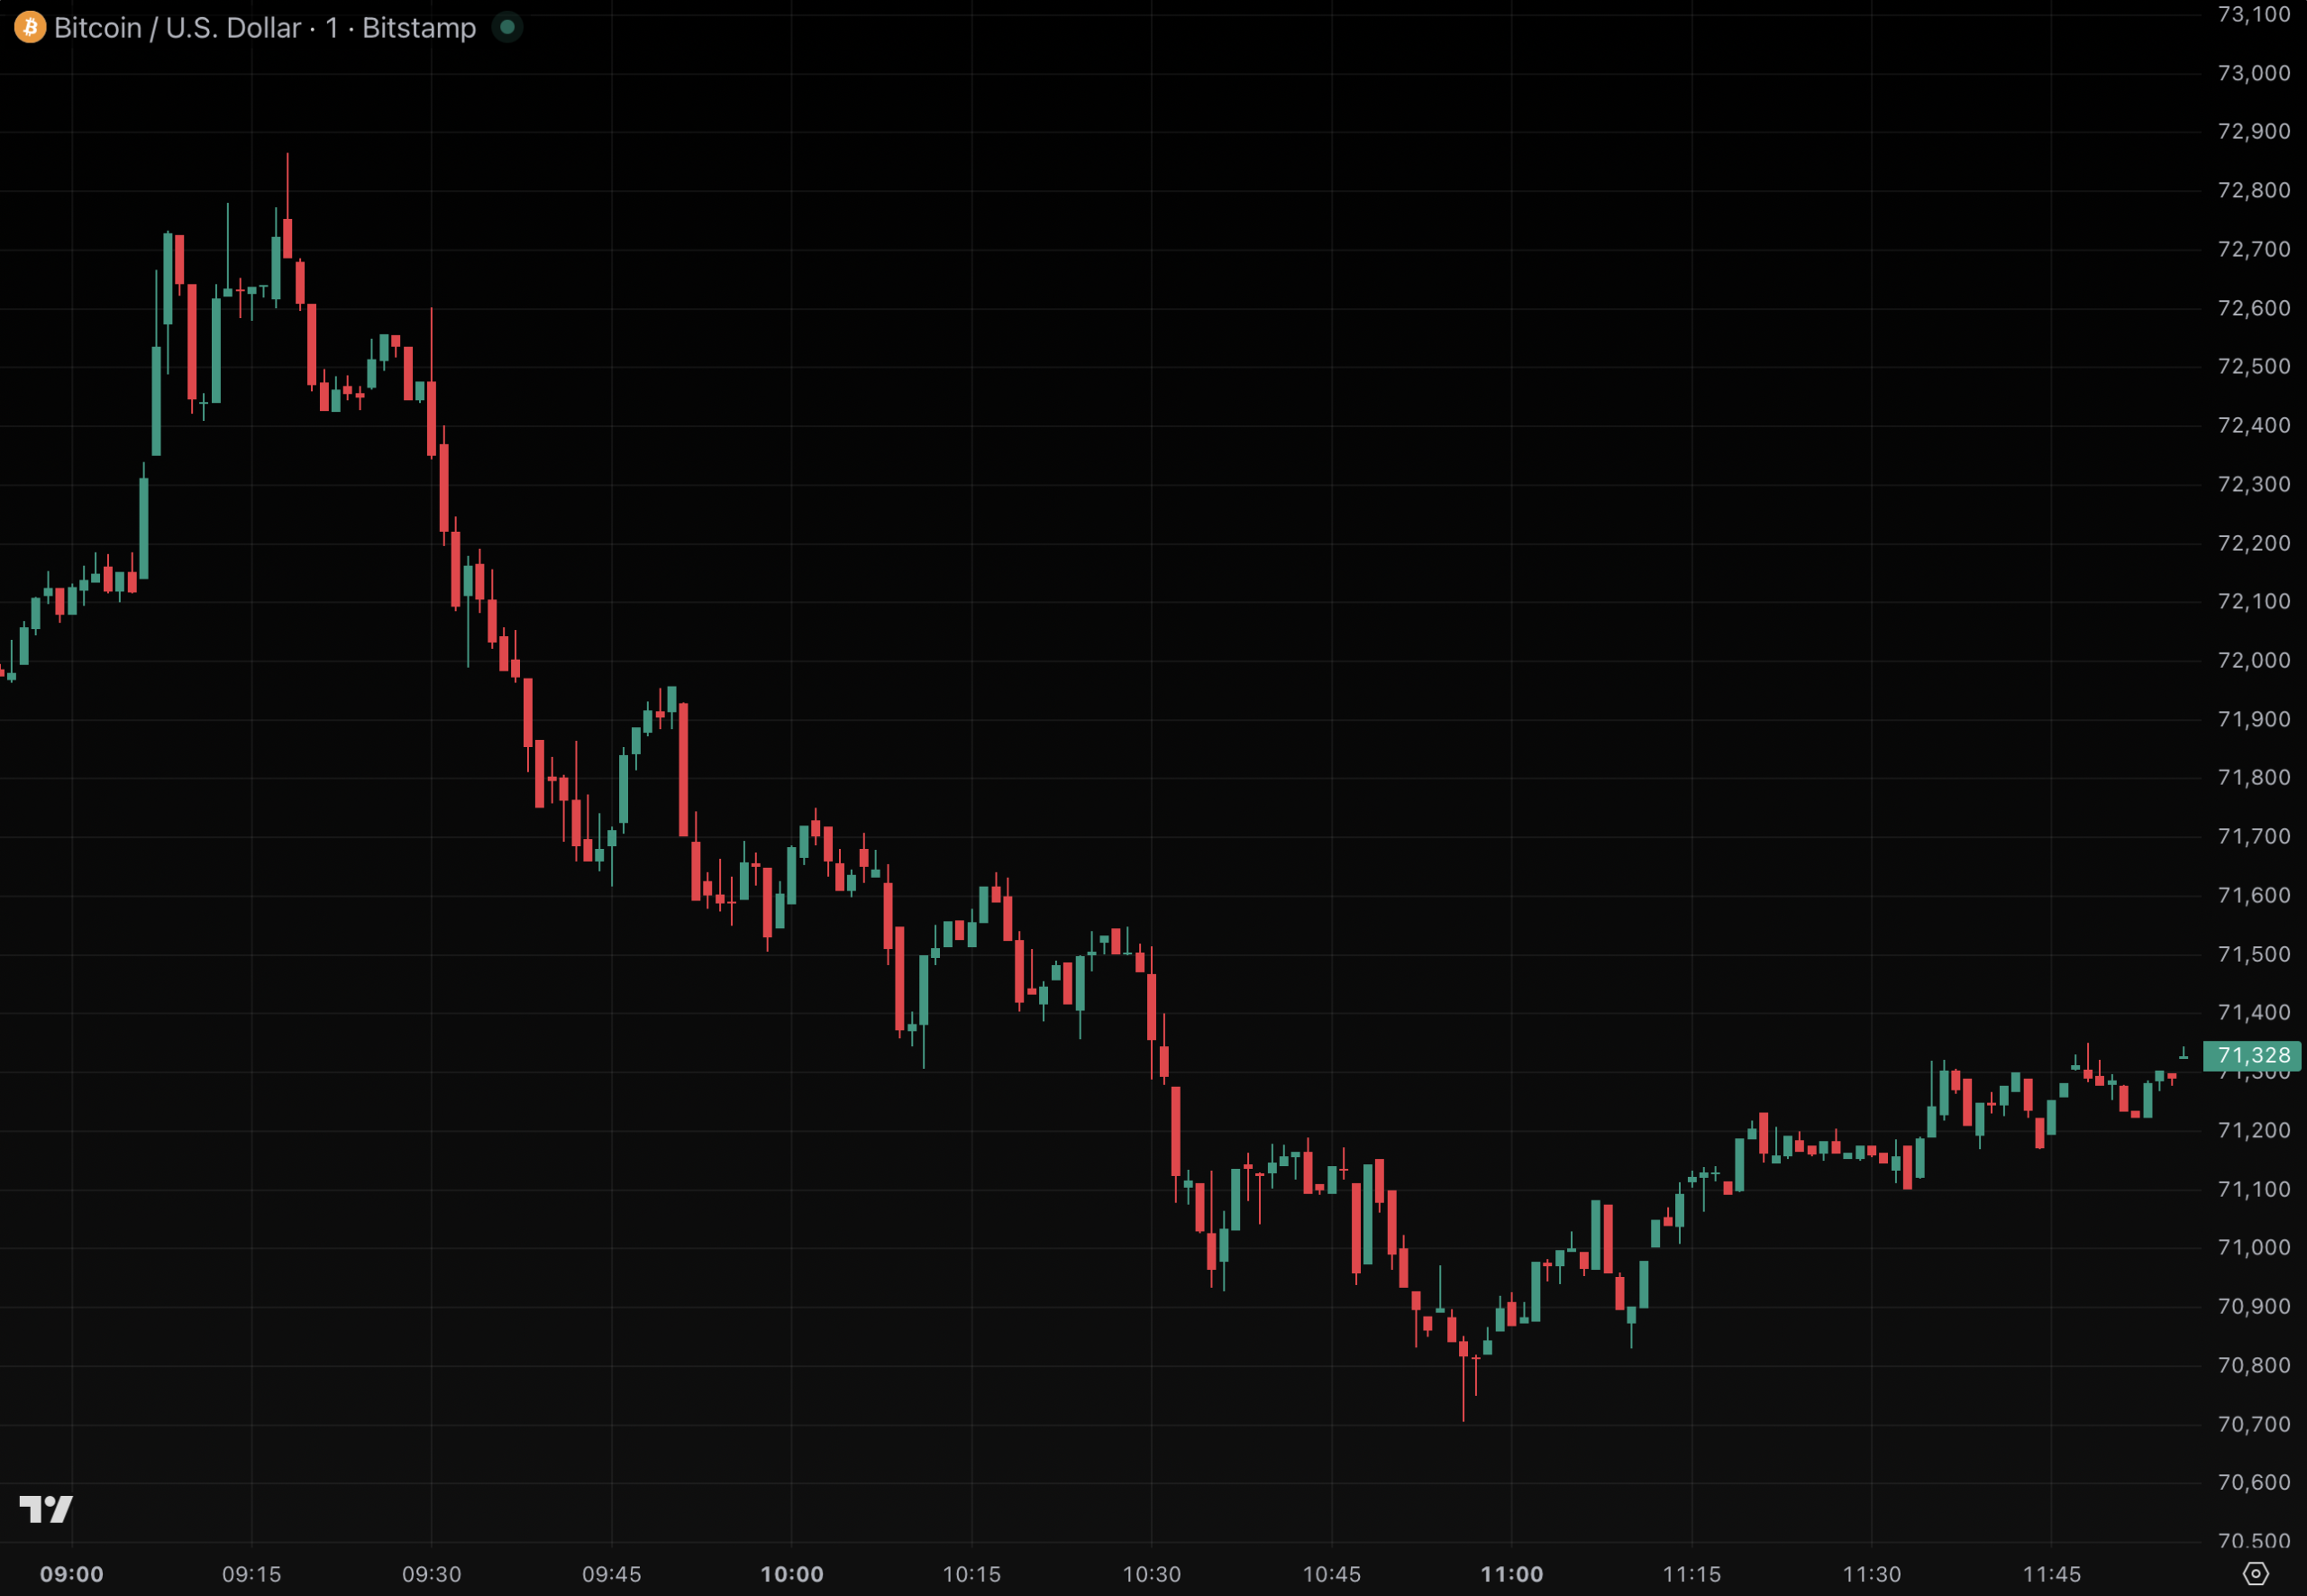
FT published the news at 8:57am New York time. Whether on that news or for unrelated reasons, BTC rallied from $72,000 to $72,865 within 20 minutes. BTC then retraced that rally entirely, dipping back below $92,000 within half an hour.
Prior to the news last night, BTC rallied substantially, gaining about 6% on ceasefire discussions between the US and Iran.
Iran’s bitcoin rationale is half-right
Although BTC is easy to trace, the unfreezable half of Hosseini’s logic is technically defensible.
Unlike BTC, most major stablecoins can be frozen. Blockchain analytics firm Elliptic found Iran’s central bank accumulated over $500 million worth of tether (USDT) in 2025. In June of that year, Tether froze $37 million in wallets linked to the central bank.
In March 2026, Tether froze another $6.7 million tied to IRGC and Houthi-linked networks.
Unlike BTC which settles over several minutes, USDT can settle within seconds. The stablecoin served as Iran’s preferred oil settlement rail, until Tether started blacklisting its wallets.
Read more: US hits Iran’s ‘shadow banking’ network in Hong Kong, UAE
Sanctioning Iranian BTC wallets
Although no company can freeze BTC, the US Office of Foreign Assets Control (OFAC) sanctioned Iranian BTC wallets on ransomware allegations in November 2018.
Since then, Chainalysis, Elliptic, and TRM Labs have built entire product lines around mapping Iranian-linked BTC and crypto flows.
In January 2026, OFAC designated UK-registered exchanges Zedcex and Zedxion for processing crypto assets for Iran’s IRGC, attaching crypto wallet addresses to that action.
According to the Chainalysis 2026 Crypto Crime Report, IRGC-linked addresses accounted for more than 50% of all value flowing into Iran’s crypto ecosystem in Q4 2025.
Over the full year, those addresses received at least $3 billion.
Any company that does pay the toll without US approval faces another problem. US, EU, and UK sanctions generally prohibit transactions with IRGC-affiliated entities.
OFAC’s interpretation of the International Emergency Economic Powers Act applies equally to BTC transfers as it does wire payments.
Specifically, a 2022 federal case in Washington DC established precedent that advertising crypto services as “designed to evade US sanctions” can serve as evidence of a sanctions-evasion conspiracy.
Got a tip? Send us an email securely via Protos Leaks. For more informed news, follow us on X, Bluesky, and Google News, or subscribe to our YouTube channel.
Crypto World
Securitize Partners with Currenc Group to Tokenize Shares on Ethereum and Solana: Securitize


Tokenization firm Securitize has partnered with Nasdaq-listed Currenc Group to tokenize its ordinary shares on Ethereum and Solana blockchains.
Securitize announced a partnership with Currenc Group (Nasdaq: CURR) to tokenize the company’s ordinary shares on Ethereum and Solana. The move comes as Securitize was recently named the first digital transfer agent in the NYSE’s onchain securities initiative. Tokenized shares will enable 24/7 trading, lower costs, fractional ownership, and DeFi integration.
The partnership represents a continuation of efforts to bring traditional equities onto blockchain infrastructure. Securitize’s designation as a digital transfer agent by the NYSE signals institutional momentum behind onchain securities infrastructure. The tokenization of Currenc Group’s shares demonstrates practical implementation of blockchain-based equity trading for publicly listed companies.
Sources: Securitize (Twitter/X)
This article was generated automatically by The Defiant’s AI news system from publicly available sources.
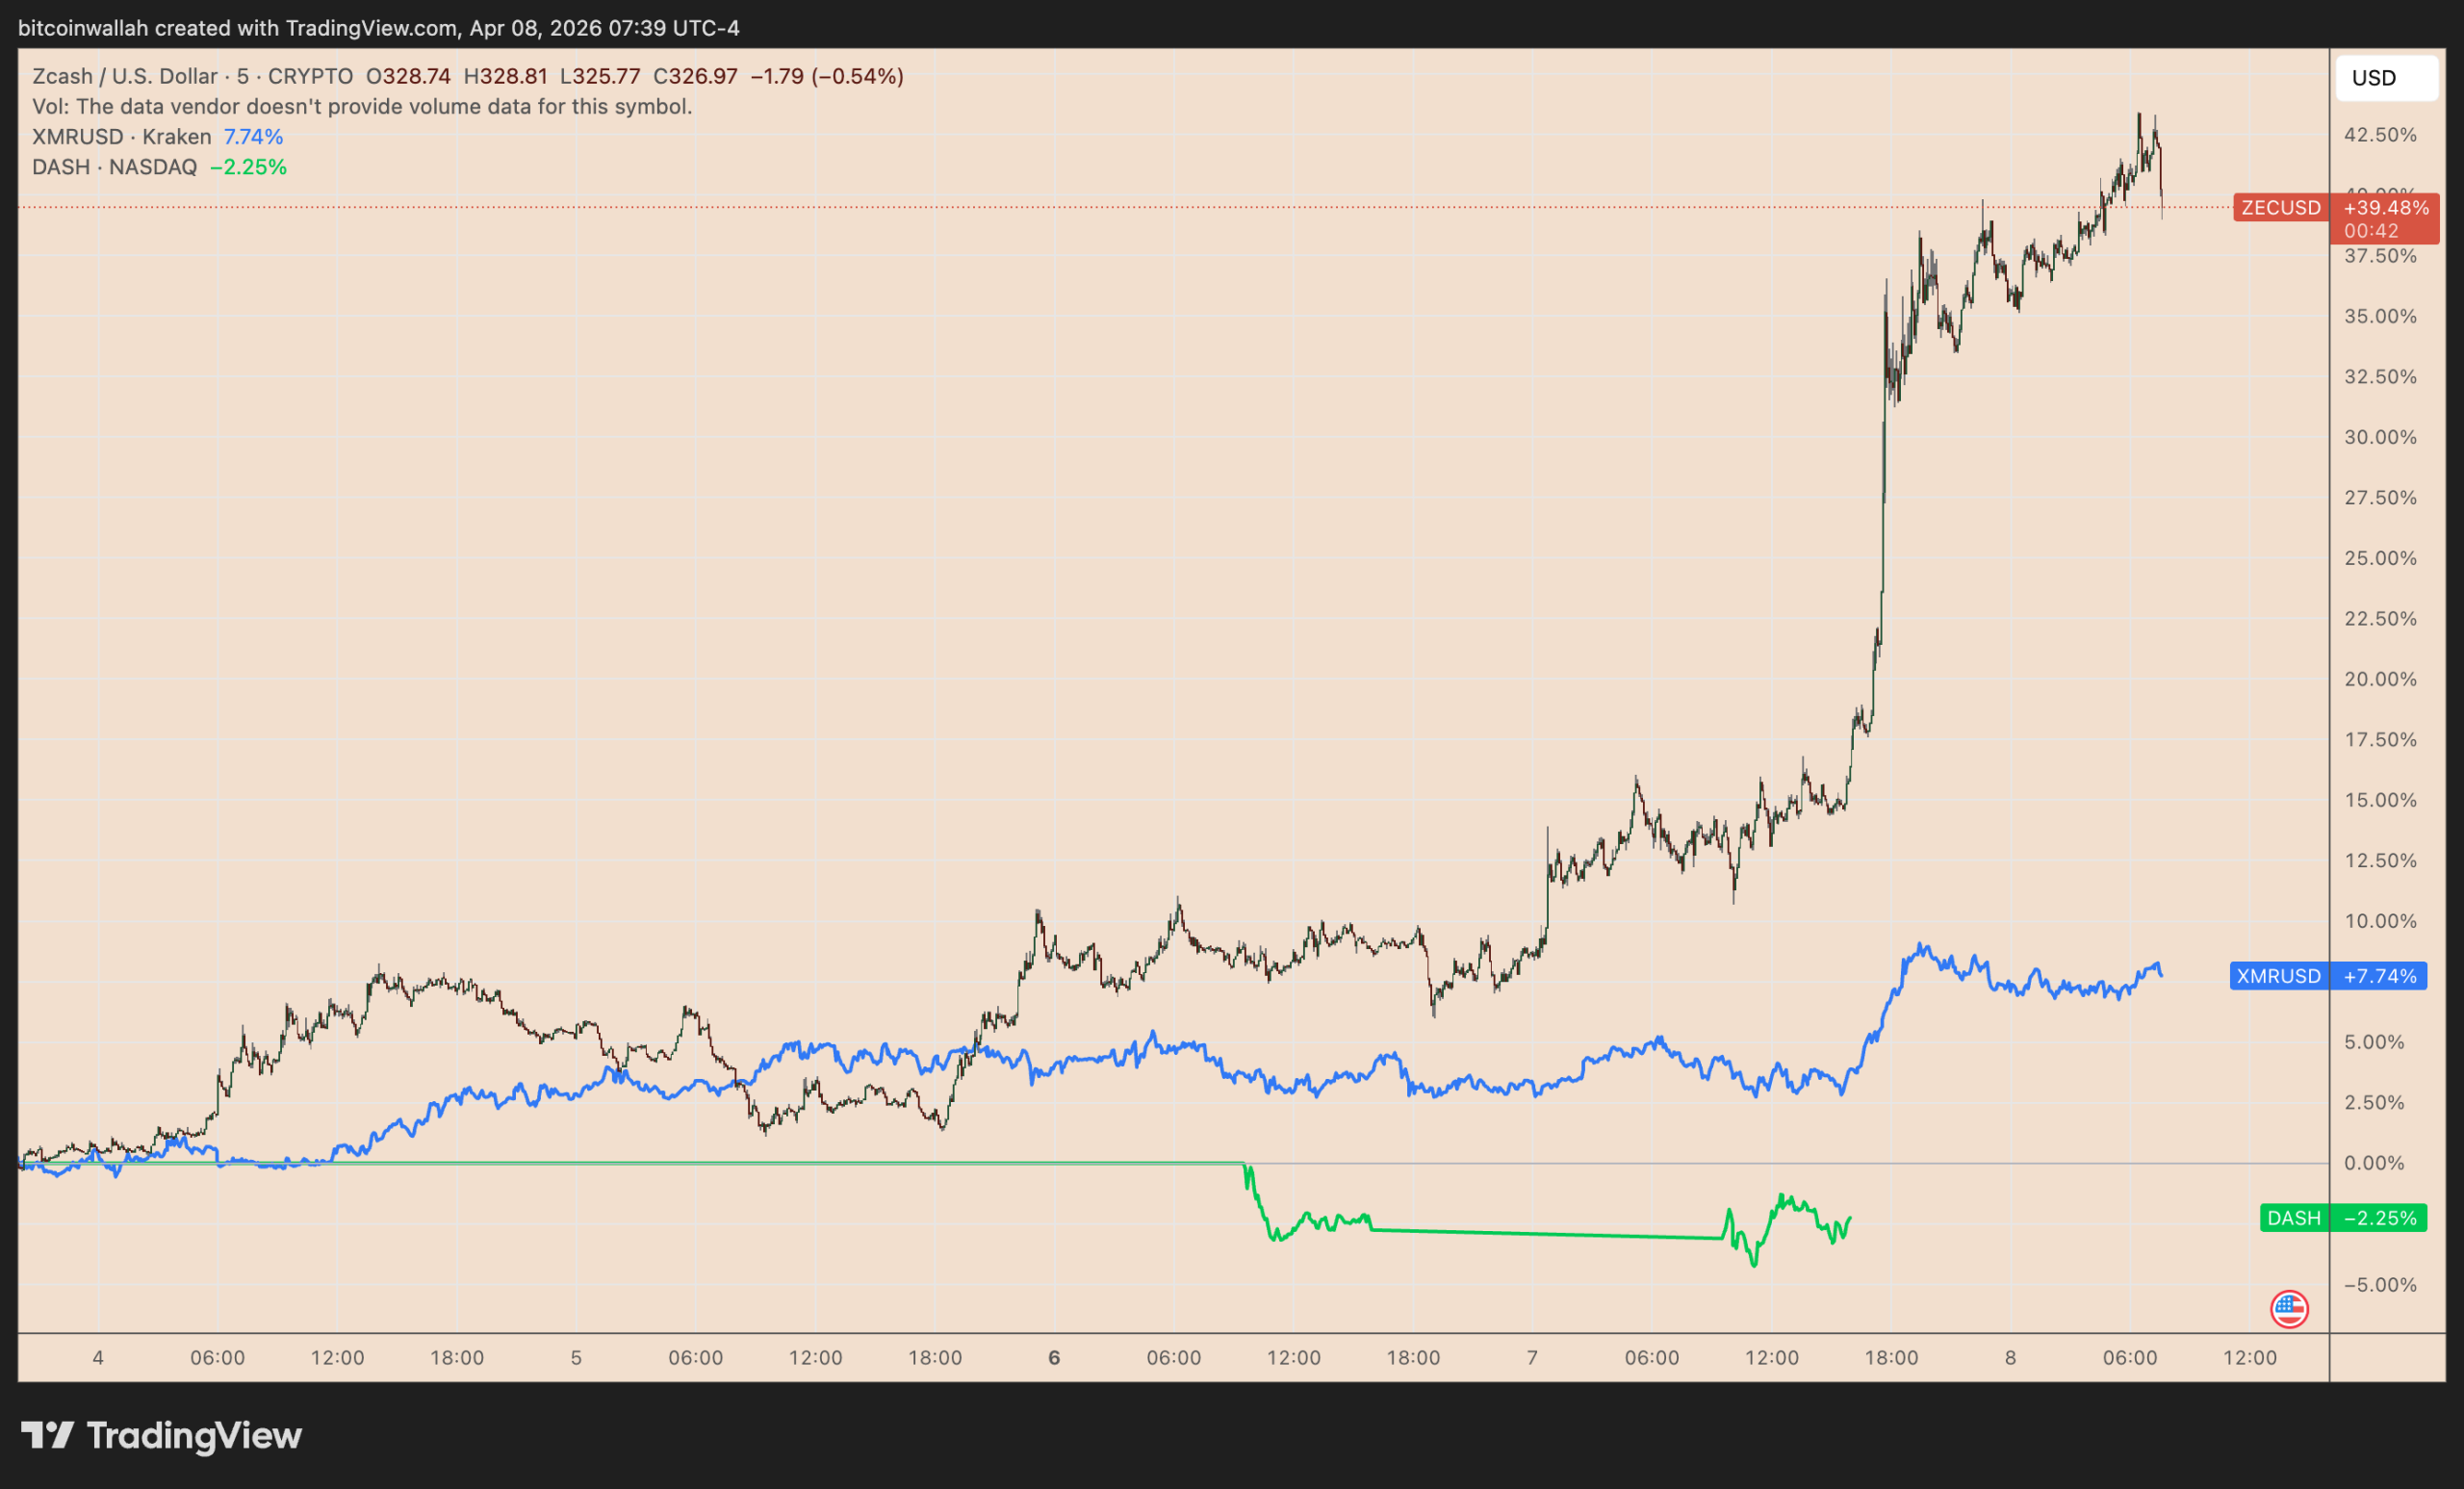
Zcash (ZEC) rallied after President Donald Trump announced a two-week ceasefire deal with Iran, leading gains in a broader relief rally across global risk markets.
Key takeaways:
-
A 2021-style fractal warns ZEC price could fall 40% toward in the coming weeks.
-
Over $50 million in long leverage sits below current prices, leaving ZEC exposed to a possible crash.

ZEC rally risks becoming a 2021-style bull trap
The privacy coin rose over 30% in the past 24 hours to $336.50 on Tuesday, its highest level since January. Its top rivals also climbed, with Monero (XMR) up 3% and Dash (DASH) up 8%.
ZEC’s latest rebound is starting to resemble the setup that followed its 2021 peak. Back then, it entered a prolonged bear cycle after peaking near $392.
During this correction, ZEC underwent multiple sharp bounces after testing its 0.238 Fibonacci retracement line at around $85, only to see its upside momentum weakening underneath a descending trendline resistance.

Zcash’s current setup looks similar. Its 0.236 Fib level near $197 is again acting as strong support, while a descending trendline continues to cap upside attempts.

A continued rebound could lift ZEC toward its 0.5 Fibonacci retracement level near $370, which also lines up with the descending trendline resistance.
But the rally could lose steam if bulls fail to break above the trend line, raising the risk of a pullback toward the $197–$200 support zone. In that case, the current move may start to look like the 2021 bull trap setup.
Related: Zcash devs raise $25M from major VCs months after ECC split
Conversely, a decisive breakout above the trendline may trigger a falling wedge breakout setup, with a measured upside target at around $1,200.

In the past, multiple analysts, including BitMEX co-founder Arthur Hayes and Alphractal CEO and Co-Founder Joao Wedson, have predicted the ZEC price to reach $1,000 or higher.
ZEC liquidation data raises downside risks
Zcash’s liquidation heatmap points to greater downside risk in the coming weeks.
For instance, Binance’s ZEC/USDT contracts may see $3.81 million worth of cumulative short liquidations if the price rallies above $380 in the coming weeks.

In comparison, roughly $50.56 million in cumulative long positions could be wiped out if the price drops below $260.
Markets tend to move toward zones where many leveraged positions are concentrated. In ZEC’s case, the larger concentration sits below the current price, where long liquidations far exceed potential short liquidations above.
The heatmap also highlights $305–$306 as the largest single liquidation pocket, with about $1.76 million in leveraged positions clustered in that range. That makes it an important near-term level to watch.
This article is produced in accordance with Cointelegraph’s Editorial Policy and is intended for informational purposes only. It does not constitute investment advice or recommendations. All investments and trades carry risk; readers are encouraged to conduct independent research before making any decisions. Cointelegraph makes no guarantees regarding the accuracy or completeness of the information presented, including forward-looking statements, and will not be liable for any loss or damage arising from reliance on this content.


On-chain AI agents are increasingly capable of reasoning through complex DeFi strategies, but ERC-8211’s devs say a shared on-chain execution layer was lacking.
Blockchain infrastructure company Biconomy has unveiled ERC-8211, an execution standard for on-chain AI agents, co-developed with the Ethereum Foundation, per an X post on April 7. The development falls under the EF’s Improve UX initiative.
The new standard — referred to as “smart batching” — lets AI agents carry out complex, multi-step DeFi strategies without pre-encoding every parameter at signing time. The specification was published on April 6 alongside an open-source reference implementation and a live demo.
The proposal lists four authors, primarily current and former Biconomy engineers: Mislav Javor, Filip Dujmušić, Filipp Makarov, and Venkatesh Rajendran.
According to Biconomy’s X post announcing the development, the core issue facing on-chain agent interaction with protocols is that current batch execution on Ethereum is static and locks in calldata before a transaction hits the chain. But DeFi is dynamic: swap outputs shift with slippage, bridge fees fluctuate, and lending vault ratios change block by block.
The post illustrates the issue with an example of an agent trying to swap ETH for USDC on Ethereum, and then deposit the USDC to a DeFi lending protocol like Aave. The agent in that case has to estimate the swap output in advance. Estimate too high and the batch reverts, estimate too low and funds sit idle.
“Static batching forces a bad choice: hardcode an optimistic amount and risk a revert, or underestimate conservatively and leave value stranded,” the X post reads.
ERC-8211’s smart batching introduces three “building blocks” to address the issues around static batching: fetchers that read live on-chain state at execution time, constraints that validate resolved values before each call proceeds, and predicate entries — a way to check whether on-chain conditions are met.
As Ethereum’s official account put it in an X post today, the standard “allows users and agents to express multi-step composable actions as a simple off-chain script with built-in safety.”
Per Biconomy’s announcement post, the standard is account-agnostic, and compatible with ERC-7683, ERC-4337, and interoperability standards that are supported by the Ethereum Foundation Protocol’s Improve UX track.
The authors also note that the standard is designed to complement the broader agent infrastructure stack on Ethereum, namely ERC-8004 for agent identification and reputation, ERC-8183 for agent-to-agent commerce, and Coinbase-developed agent payment protocol x402.
An Ethereum Magicians discussion thread for the new standard is open for technical feedback, the announcement notes.
As The Defiant reported last month, the number of ERC-8004 AI agents registered across blockchain networks has grown sharply this year, with the largest number of agents using the standard on BNB Smart Chain. Yet most remain limited to basic swaps and transfers.
On the infrastructure side, the Ethereum Foundation has also recently set up a dedicated “dAI Team” aimed at making Ethereum the preferred settlement layer for AI agents and the machine economy, as The Defiant reported.
This article was written with the assistance of AI workflows. All our stories are curated, edited and fact-checked by a human.
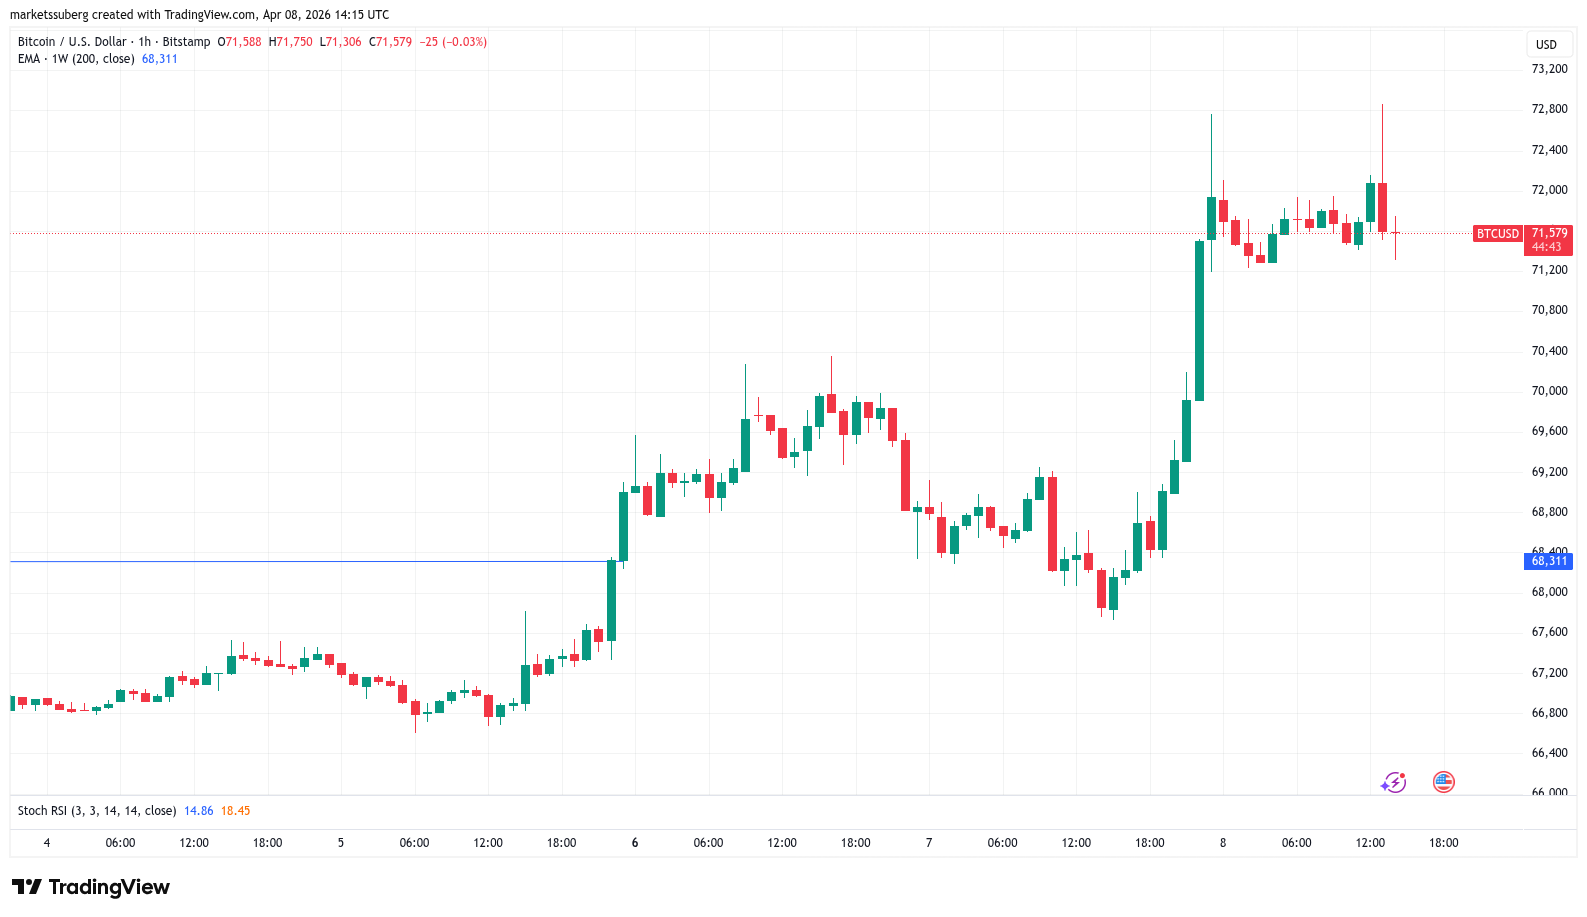
Bitcoin bulls failed to stay above $72,000 for long as BTC price action already began to discount the impact of a US-Iran ceasefire agreement.
Bitcoin (BTC) hit new three-week highs into Wednesday’s Wall Street open as stocks surged on a US-Iran ceasefire.
Key points:
-
Bitcoin briefly hits new three-week highs before round-tripping its gains.
-
Iran ceasefire relief fails to last as traders demand that bulls reclaim higher levels.
-
More volatility is due thanks to US inflation reports.
BTC price fails to stay above $72,000
Data from TradingView captured BTC/USD reaching $72,865 on Bitstamp before cooling the day’s gains.

News of a minimum two-week ceasefire between the US, Israel and Iran sent risk assets higher in an instant, with the S&P 500 up by more than 2.5% at the open.
WTI crude oil declined to as low as $91 per barrel as oil-supply crisis fears eased and traffic began to resume through the Strait of Hormuz. This came despite reports of an attack on a Saudi oil pipeline.

“The S&P 500 is now set to open above 6,800, trading just 2.9% away from a new record high. The index has added +$1.6 TRILLION today,” trading resource The Kobeissi Letter wrote in its latest market coverage on X.

Among Bitcoin market participants, the relief was also palpable.
“I mentioned earlier that a ceasefire would be a clear direction on the markets. It happened,” crypto trader Michaël Van de Poppe wrote in an X response.
“Bitcoin breaks through the crucial $71K level and builds a bullish structure. Oil is down and the Strait is open, which means that there’s a mean reversion play active on Bitcoin.”

Van de Poppe described the need to hold support at $69,500 as “crucial.”
“That would strengthen the entire theory of a higher lows, higher highs and continues the momentum upwards and is likely going to fall alongside a new all-time high on the Nasdaq,” he added.
More inflation volatility on the horizon
Trader Daan Crypto Trades meanwhile said that $72,000, a sticking point in recent weeks, needed to be cleared.
Related: Bitcoin RSI ‘nearly perfectly’ copying end of 2022 bear market: Analysis
“Another day another test of the $72K level. Let’s see if the bulls can push through this time around,” he told X followers.
“I want to see a clean break and hold above that area. Ideally for more than 1-2 days this time.”

Earlier, Cointelegraph reported on other traders’ concerns about overall BTC price strength, which argued that Bitcoin bulls “still have a lot of work to do.”
The remainder of the week will see key US inflation releases, these set to show the initial impact of the Iran conflict and spark characteristic risk-asset volatility.
This article is produced in accordance with Cointelegraph’s Editorial Policy and is intended for informational purposes only. It does not constitute investment advice or recommendations. All investments and trades carry risk; readers are encouraged to conduct independent research before making any decisions. Cointelegraph makes no guarantees regarding the accuracy or completeness of the information presented, including forward-looking statements, and will not be liable for any loss or damage arising from reliance on this content.

Key Takeaways
- Successful investing relies on consistent discipline rather than market forecasting.
- Strategic diversification minimizes losses from incorrect investment decisions.
- Growing economic downturn worries underscore the need for stronger risk management.
- Market analysts increasingly emphasize defensive positioning, quality assets, and liquidity.
- Successful investors stick to systematic approaches and resist emotion-driven choices.
Superior investment performance doesn’t come from accurately predicting market movements. Instead, it emerges from cultivating consistent practices that enhance decision-making quality, particularly during periods of heightened uncertainty and negative sentiment.
This approach proves especially relevant today. Economic downturn anxieties have intensified amid inflationary pressures, elevated oil prices, and international conflicts affecting economic projections. Recent Reuters coverage highlighted Goldman Sachs increasing its U.S. recession probability forecast to 30%, while Federal Reserve Vice Chair Philip Jefferson acknowledged dual risks facing employment stability and price levels.
Prioritize methodology over speculation
Many market participants assume winning strategies depend on identifying ideal securities at opportune moments. However, accomplished investors typically achieve results through consistent, systematic frameworks that eliminate common pitfalls undermining portfolio performance.
This requires understanding your rationale for each holding, recognizing its function within your overall allocation, and identifying potential failure scenarios. It demands acknowledging that perfect accuracy remains impossible.
Warren Buffett emphasized this principle when noting that “temperament is also important,” highlighting how emotional discipline significantly influences investment outcomes. This wisdom endures because many devastating portfolio errors occur when panic or euphoria drives decision-making.
Among the most valuable practices investors can develop is documenting the thesis behind each acquisition. When you cannot articulate your investment case concisely, you likely haven’t achieved sufficient comprehension.
Acknowledge downside scenarios and diversify strategically
Sophisticated investors don’t fixate exclusively on potential gains. They seriously consider outcomes when their assumptions prove incorrect.
This consideration becomes critical amid heightened recession concerns. Late March Reuters reporting indicated Morgan Stanley reduced global equity exposure while increasing allocations to cash and U.S. Treasuries as market participants adopted more protective stances. Reuters additionally noted American financial advisors expressing elevated concern regarding volatility, inflation, and geopolitical uncertainty entering the second quarter.
Diversification stands among the most accessible yet powerful mechanisms available to investors. While it won’t eliminate losses entirely, it prevents isolated errors, sector-specific troubles, or single macroeconomic themes from inflicting excessive harm.
This entails distributing capital across varied asset categories, sectors, and geographic markets. Resilient portfolios typically blend growth-oriented positions with stability-focused holdings rather than concentrating everything in fashionable themes.
Gold may serve a function within this framework. Reuters recently cited UBS Global Wealth Management’s Solita Marcelli stating, “Gold continues to play its historical role as a haven during periods of currency debasement and inflation.” While gold shouldn’t constitute an entire strategy, modest protective positions offer value when risk factors intensify.
Maintain consistency during market turbulence
Investment’s greatest challenge frequently isn’t security selection. Rather, it’s maintaining rational strategies when markets gyrate wildly and emotions intensify.
This difficulty appears to be escalating. April 8 Reuters coverage reported volatility-focused funds liquidated approximately $108 billion in equities since early March, amplifying market fluctuations during an anxious period. Such selling creates pressure for investors to respond quickly, even when immediate action proves counterproductive.
This explains why systematic discipline proves essential. March Reuters reporting highlighted BlackRock CEO Larry Fink encouraging clients to maintain market exposure despite volatility, while recognizing that artificial intelligence gains and broader market advances may distribute unevenly. This guidance provides value by combining prudence with persistence.
Several straightforward practices generate meaningful improvements. Contribute according to predetermined schedules rather than attempting to time entries perfectly. Rebalance at established intervals instead of responding to every news cycle. Maintain adequate cash reserves so downturns present opportunities rather than crises. Reduce portfolio review frequency if constant monitoring triggers poor choices.
Concluding Perspective
Top-performing investors rarely exhibit the most aggressive behavior or loudest predictions. Instead, they demonstrate composure, acknowledge risk parameters, implement thoughtful diversification, and adhere to systematic processes during uncertain conditions. With recession probabilities rising yet forecasts remaining ambiguous, this moment favors prioritizing disciplined execution over prediction attempts. This fundamental reorientation can substantially enhance long-term investment performance.


Hours after US President Donald Trump claimed that Iran and the United States had agreed to a two-week ceasefire that included opening the Strait of Hormuz, Iranian authorities are reportedly considering charging ships using the waterway in cryptocurrency.
According to a Wednesday Financial Times report, a spokesperson for Iran’s Oil, Gas and Petrochemical Products Exporters’ Union said empty oil tankers will be able to pass through the Strait of Hormuz without incurring charges, but certain ships will need to pay a tariff of $1 per barrel of oil in Bitcoin (BTC).
The spokesperson, Hamid Hosseini, reportedly said Iranian authorities would also assess each ship using the waterway over the two-week period to ensure it wasn’t transporting weapons.
“Once the email arrives and Iran completes its assessment, vessels are given a few seconds to pay in Bitcoin, ensuring they can’t be traced or confiscated due to sanctions,” said Hosseini, according to the Financial Times.
Many ships have effectively been cut off from using the Strait of Hormuz to transport oil and other supplies after US-Israel air strikes on Iranian targets in February and March. Amid the move by Iran and geopolitical tensions, the price of crude oil exceeded $100 per barrel for the first time in four years and the prices of many cryptocurrencies were volatile, with BTC fluctuating between $65,000 and $75,000.
Related: Bitcoin reclaims $72K after US, Iran agree to 2-week ceasefire
Trump claimed on his Truth Social platform on Tuesday that the ceasefire deal included the suspension of the “bombing and attack of Iran for a period of two weeks” and the “complete, immediate, and safe opening of the Strait of Hormuz.” Iran’s state media reported that the country delivered a 10-point plan to the US president as a condition for the deal, including continued control of the waterway and the end of sanctions on Iran.
Prior to war, Iran still used crypto to bolster its currency
Before the escalation of hostilities between US-Israeli forces and Iran in February, reports suggested that Iran had been using digital assets to evade sanctions amid its currency, the rial, dropping against the US dollar.
Blockchain analytics platform Elliptic reported in January that Iran’s central bank acquired half a billion dollars worth of Tether’s USDt (USDT) stablecoin. TRM Labs also tracked about $3.7 billion in total crypto flows in Iran between January and July 2025.
Magazine: ‘Phantom Bitcoin’ checks, Drift hack linked to North Korea: Asia Express
Crypto World
South Korea Introduces Comprehensive Regulatory Framework for Stablecoins and Tokenized Assets
Key Highlights
- Stablecoins designated as foreign exchange payment mechanisms
- Enhanced regulatory monitoring for international stablecoin transactions
- Interest-bearing stablecoin products prohibited nationwide
- Real-world asset tokens require regulated trust custody backing
- Digital asset framework harmonized with conventional financial regulations
South Korean regulators are introducing a comprehensive framework that incorporates stablecoins and tokenized assets into the nation’s current financial regulatory system. The upcoming regulations represent a significant move toward enhanced supervision of international payment flows and blockchain-based asset instruments. Authorities seek to maintain consistency between emerging digital assets and established financial market protocols while mitigating systemic vulnerabilities.
Cross-Border Payment Oversight Anchors Stablecoin Strategy
Regulatory authorities in South Korea intend to designate stablecoins as foreign exchange payment vehicles under current legislation. This classification enables oversight bodies to supervise international stablecoin transfers without establishing new licensing categories. The strategy incorporates stablecoin operations into proven regulatory frameworks already governing financial transactions.
South Korea will carve out specific exceptions for domestic transactions from foreign exchange disclosure obligations. These carve-outs apply to purchases of goods and services within predetermined thresholds. International transfers will remain subject to comprehensive foreign exchange monitoring protocols.
Authorities propose eliminating all interest-generating mechanisms for stablecoin deposits regardless of structure. This prohibition prevents issuers from providing return-generating features that could attract users seeking investment opportunities. The regulations position stablecoins exclusively as transaction mediums rather than wealth-building instruments.
The Financial Services Commission will establish technical interoperability benchmarks under the proposed framework. These benchmarks facilitate smooth operations across diverse blockchain infrastructures. The approach balances technological flexibility with regulatory oversight requirements.
Asset-Backed Tokens Face Trust Custody Mandates
South Korean authorities plan mandatory trust-based custody for all tokenized representations of physical assets. These requirements draw authority from the Capital Markets Act. Token issuers must place underlying assets within approved custodial arrangements subject to regulatory supervision.
South Korea is working to incorporate blockchain-based assets into current financial product taxonomies. This incorporation enforces transparency, auditing, and regulatory compliance obligations parallel to conventional securities. Asset tokens would operate under well-established financial governance structures.
Regulators prioritize asset security through formalized custody arrangements. Managed trust structures provide token holders with legally enforceable claims on backing assets. The framework minimizes exposure to custodial failures or fraudulent asset representation.
This regulatory draft addresses specific gaps while leaving broader cryptocurrency policy questions unresolved. Topics including exchange ownership concentration and banking access remain outside the current proposal’s scope. Nevertheless, the framework advances systematic oversight of digital financial instruments.
National Policy Mirrors International Regulatory Evolution
South Korea’s regulatory direction parallels worldwide initiatives targeting stablecoins and tokenized instruments. International regulators increasingly apply existing financial statutes to blockchain-based products. This methodology circumvents prolonged legislative processes associated with developing entirely new legal codes.
The approach reflects previous warnings from South Korea’s monetary authority concerning financial system stability. Officials have identified domestic stablecoins as potential factors affecting capital movement patterns and currency valuation. Enhanced regulatory control supports macroeconomic policy objectives.
South Korea is responding to markets where tokenized assets have experienced substantial valuation growth. Worldwide implementation spans government securities, property holdings, and commodity markets. Defined regulatory parameters could enable controlled expansion domestically.
The nation reinforces an emerging global pattern of incorporating distributed ledger technology within supervised financial systems. The regulatory structure demonstrates that blockchain-based instruments will conform to traditional financial oversight standards. South Korea establishes its position within a compliance-oriented digital asset environment.

MEXC has named Vugar Usi as its new chief executive, signaling a sharpened push for global licensing as the exchange pursues a MiCA authorization in the European Union. The leadership shift appears to be part of a broader brand refresh and a strategic pivot toward an “everything exchange” model in a competitive landscape that spans centralized venues and decentralized rivals.
Usi joined MEXC as chief operating officer in late 2025 after previously serving in the same role at rival Bitget. In a conversation with Cointelegraph, he outlined plans to preserve the exchange’s low-fee trading ethos while expanding multi-asset access and reinforcing regulatory compliance across jurisdictions. “The MiCA license application is a top strategic priority for the company,” he said, adding that MEXC is actively preparing to establish a fully compliant business entity within the EU.
Key takeaways
- MEXC elevates COO Vugar Usi to CEO, aligning leadership with a concerted push for global licensing, including MiCA in the EU.
- MiCA licensing is described by Usi as a top strategic priority, with proactive steps under way to build an EU-compliant entity.
- Regulatory headwinds persist: Dutch authorities flagged MEXC in September 2025 for offering crypto services without a licensed footprint in the Netherlands.
- Market position and growth: CoinGecko places MEXC among fast-rising exchanges with reported daily volumes around $2.2 billion, while CryptoQuant counts it in the top tier of growth alongside peers like Gate and Coinbase.
- Strategic partnerships and ventures: MEXC has collaborated with Hacken for monthly proof-of-reserves audits and has ties to The Open Network (TON) via MEXC Ventures, dating back to late 2023.
A strategic leadership move amid a global licensing push
The leadership transition signals MEXC’s intent to accelerate its evolution from a high-velocity trading venue into a regulated, compliant platform with broader access to assets and markets. In speaking with Cointelegraph, Usi reframed the move as part of a long-term effort to balance growth with responsible oversight, especially as the industry faces intensified scrutiny in Europe and beyond.
Beyond the EU, Usi indicated that MEXC monitors regulatory developments worldwide, aiming to position the exchange to operate under a mosaic of license regimes rather than rely on a single jurisdiction. This approach aligns with the company’s public emphasis on expanding regulatory compatibility while maintaining cost-efficient trading for users.
EU licensing path and regulatory background
The EU’s Markets in Crypto-Assets Regulation (MiCA) represents a comprehensive licensing framework for crypto-asset service providers. MEXC’s leadership frames MiCA enrollment as a strategic necessity to unlock ongoing access to European users, though the company has not disclosed granular timelines or the exact structure of its EU entity. In recent conversations, Usi affirmed that MiCA licensing remains a top priority and that MEXC is actively preparing to operate as a compliant EU entity when the process unfolds.
Contextually, the EU licensing race is already crowded. Binance, the largest global exchange by reported volume, applied for a MiCA license in Greece in January as part of the broader regulatory push across member states. The landscape is politically sensitive and highly competitive, with exchanges weighing compliance costs and the potential benefits of a formal green light to operate across multiple EU jurisdictions.
However, EU regulators have not granted blanket approval to all applicants. MEXC has been labeled non-compliant by European authorities after the Dutch Authority for the Financial Markets (AFM) flagged the platform in September 2025 for offering crypto services without the required license in the Netherlands. The regulatory status highlights the ongoing friction between rapid global expansion and the compliance moat that MiCA seeks to establish.
As part of the broader regulatory narrative, industry coverage has underscored tensions around centralized exchanges, licensing, and cross-border operations. A related discussion in crypto policy circles has examined how jurisdictions like Malta interact with ESMA oversight, illustrating the broader geopolitical dynamics shaping the licensing race.
Related reading: Centralizing crypto: Why Malta’s clash with ESMA is about more than one small state.
MEXC’s growth trajectory and partnerships
Even as regulatory questions flow, MEXC has demonstrated rapid growth and expanding partnerships. CoinGecko tracks daily trading volumes for MEXC at approximately $2.2 billion, underscoring the exchange’s scale in active crypto markets. CryptoQuant places MEXC among the top three exchanges in its Exchange Leader Index, alongside Binance and Gate, and notes strong growth trajectories for MEXC and its peers.
The exchange has also pursued strategic collaborations to bolster transparency and governance. Notably, MEXC partnered with the blockchain security firm Hacken for monthly proof-of-reserves audits to enhance transparency for users. On the venture side, MEXC Ventures has supported The Open Network (TON), with TON securing funding in late 2023 as part of the broader push to align traditional exchanges with Web3 ecosystems.
Brand evolution in a crowded market
The leadership transition accompanies a broader brand reset that mirrors an industry-wide shift toward “everything exchange” models. As competitors accelerate diversification—spanning spot, derivatives, staking, and decentralized alternatives—the market is watching how operators balance nimble execution with rigorous compliance. Coverage of industry moves, including the Arkham Exchange pivot toward a decentralized model, illustrates the tension between centralized platforms and decentralized alternatives in shaping future user experiences.
Looking ahead, the path to MiCA approval will be a pivotal determinant of MEXC’s EU footprint. The ongoing regulatory dialogue in Europe will influence not only licensing timelines but also how exchanges design governance, compliance programs, and cross-border operations. For investors and users, the unfolding strategy offers a lens into how fast-growing exchanges navigate a more consolidated and regulated crypto landscape.
Readers should watch how MEXC negotiates MiCA readiness—whether an EU entity is established, how licensing milestones progress, and what this means for offerings across Europe. The regulatory climate remains fluid, and the ultimate outcome will shape competitive dynamics across global crypto markets in the months ahead.


Arkham Intelligence is discontinuing support for the TON blockchain on its platform effective April 8 at 12pm EST.
Arkham Intelligence announced it will remove support for the TON blockchain from its Arkham Intel platform on Wednesday, April 8 at 12pm EST. The decision follows a periodic review of chain integrations, with Arkham citing user demand and the blockchain’s importance to the crypto ecosystem as key evaluation factors.
Arkham regularly evaluates its chain integrations to determine which blockchains warrant continued maintenance and support on the platform. The removal of TON comes as Arkham maintains its intelligence and on-chain analytics services across other major blockchain networks.
Sources: Arkham
This article was generated automatically by The Defiant’s AI news system from publicly available sources.

LIVE: Ripple Leads Massive Tokenization Move with BlackRock – XRP Crash Explained!
Police issue update after four teenagers injured in Tenby stabbing

14-Year Singleton to Heartbreaking Split


-

 NewsBeat6 days ago
Steven Gerrard disagrees with Gary Neville over ‘shock’ Chelsea and Arsenal claim | Football
-

 Business6 days ago
No Jackpot Winner and $194 Million Prize Rolls Over
-

 Fashion5 days ago
Weekend Open Thread: Spanx – Corporette.com
-

 Crypto World7 days ago
Gold Price Prediction: Worst Month in 17 Years fo Save Haven Rock
-

 Business4 days ago
Expert Picks for Every Need
-

 Business3 days ago
Three Gulf funds agree to back Paramount’s $81 billion takeover of Warner, WSJ reports
-

 Sports4 days ago
India men’s 4x400m and mixed 4x100m relay teams register big progress | Other Sports News
-

 Business7 days ago
Login and Checkout Issues Spark Merchant Frustration
-

 Tech19 hours ago
How Long Can You Drive With Expired Registration? What Florida Law Says
-
Business3 days ago
No Jackpot Winner, Prize to Climb to $231 Million
-

 Tech6 days ago
Commonwealth Fusion Systems leans on magnets for near-term revenue
-

 Fashion2 days ago
Massimo Dutti Offers Inspiration for Your Summer Mood Board
-

 Tech7 days ago
Drawing Tablet Controls Laser In Real-Time
-

 Crypto World7 days ago
Ripple rolls out enterprise crypto treasury platform for corporates
-

 Fashion24 hours ago
Let’s Discuss: DEI in 2026
-
Politics5 days ago
Wings Over Scotland | The quality of mercy
-

 Crypto World7 days ago
Why It’s Partnering, Not Issuing
-
 Sports7 days ago
Steal Gary Woodland’s subtle power move for longer drives
-
Sports7 days ago
Tom Pelissero Drives the Final Nail in the Coffin
-
 Tech7 days ago
Battery Tester Outperforms Cheaper Options
You must be logged in to post a comment Login