

Crypto World
Are retail traders selling bitcoin to buy Elon Musk’s SpaceX IPO?


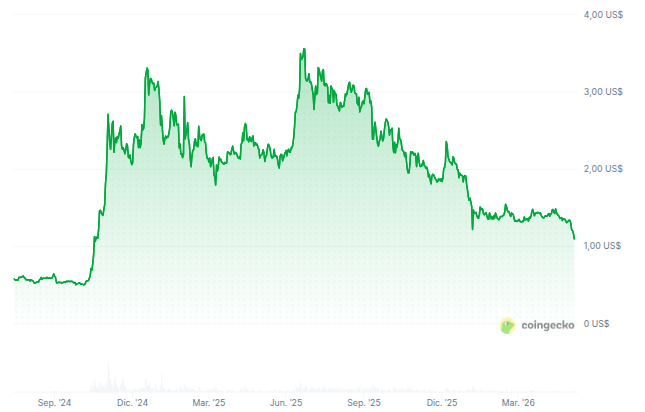
Some online chatter seems to speculate that retail investors may be selling crypto to chase the biggest IPO ever.
The Elon Musk-owned rockets, satellite and AI company SpaceX is selling up to 30% of its record $75 billion offering straight to retail investors through Robinhood, Fidelity and Charles Schwab, more than three times the slice a typical IPO sets aside for individuals.
The roadshow opened Thursday already oversubscribed, with more orders than shares on offer, Bloomberg reported. It is offering shares at a $1.8 trillion valuation.
Bitcoin fell roughly 16% over the same timespan and briefly traded below $60,000 before recovering to around $61,000, according to CoinDesk data.
Stablecoins are the most direct way to track money leaving crypto for dollars. A trader cashing out bitcoin to fund a brokerage account converts into a dollar-pegged token like USDC or tether, then redeems it for cash. That shows up two ways, as stablecoins pulled off exchanges and, later, as a shrinking supply when issuers burn the redeemed tokens.
Neither moved of these readings show anomalies, per data assessed by CoinDesk Outflows for USDC and tether stayed inside the range they’ve held since February, according to CryptoQuant data. The largest single days in recent months were $2.5 billion in USDC on May 22 and $3.6 billion in tether on May 20, both came before the sell-off.
Bitcoin and ether did see heavy withdrawals on Friday, 66,470 bitcoin and about 2.49 million ether moving off exchanges, among the biggest single-day totals of the year on CryptoQuant’s data.
An outflow is coins leaving an exchange for a private wallet, which is what a buyer does after taking delivery. Selling does the reverse, coins moving onto exchanges to be sold.
On-chain data has a blind spot, however. It can’t see inside a Robinhood or Coinbase account, where someone can sell bitcoin for dollars without either ever touching a public blockchain.
Whether crypto holders funded their allocations won’t be answerable until the brokerages publish their own numbers. Robinhood reports monthly trading metrics, with June’s crypto volumes due in mid-July, and Coinbase breaks out retail activity in second-quarter results later in the month.
Bitcoin and ether did see heavy withdrawals on Friday, 66,470 bitcoin and about 2.49 million ether moving off exchanges, among the biggest single-day totals of the year on CryptoQuant’s data.
An outflow is coins leaving an exchange for a private wallet, which is what a buyer does after taking delivery. Selling does the reverse, coins moving onto exchanges to be sold. The week’s largest flows look like withdrawal and dip-buying, not a scramble for cash.
The one place money clearly drained from crypto was the funds.
Spot bitcoin ETFs, the exchange-traded products that hold bitcoin directly, bled for 13 straight sessions through June 3, a record stretch worth about $4.4 billion before a small $3 million inflow snapped the streak.
Ether ETFs ran a longer 17-session streak that broke the same day. When investors pull money from these funds the issuer sells the underlying coins, so the redemptions are real selling.
SpaceX prices on June 11 and lists on the Nasdaq under the ticker SPCX the next day.


Solana price has fallen to a multi-year low as a major corporate holder moved $31.9 million worth of SOL to Coinbase Prime, adding to fears that whales are reducing exposure during the market selloff.
Summary
- Solana price fell to a multi-year low near $60 as whale transfers, ETF outflows, and market-wide liquidations intensified selling pressure.
- Forward Industries moved $31.9 million worth of SOL to Coinbase Prime, fueling concerns that large holders may be reducing exposure.
- Technical indicators and liquidation data suggest a break below current support could expose SOL to the $55–$50 region.
According to data from crypto.news, Solana (SOL) traded near $62 on June 6 after briefly falling to the $60 area. The token has lost roughly 24% over the past week, more than 30% over the past month, and about 50% since the start of the year as traders continued reducing exposure to risk assets amid a broader crypto market selloff.
Large holders have added to concerns about the market’s outlook. According to blockchain analytics platform Lookonchain, Forward Industries transferred 455,784 SOL worth approximately $31.9 million to Coinbase Prime after a month of inactivity.
Since adopting a Solana treasury strategy in September 2025, the company has spent roughly $1.59 billion acquiring 6.83 million SOL at an average price of $232. Lookonchain estimates those holdings are now worth about $458.6 million.
The transfer does not confirm an outright sale, but traders frequently monitor deposits to institutional trading venues for signs that large investors may be preparing to reduce positions. The transaction arrived as SOL traded near its lowest levels since 2024 and reinforced concerns that other treasury holders could also move to protect capital if market conditions worsen.
Derivatives markets have already undergone a sharp deleveraging event. CoinGlass data shows more than $1.5 billion in crypto positions were liquidated over the past day, with long traders accounting for most of the losses. Solana absorbed a significant share of the damage as leveraged bullish positions were forced to close into a falling market.
Institutional demand has also weakened. SoSoValue data showed that U.S. spot Solana ETFs recorded net outflows after several weeks of inflows. The reversal came as investors reassessed exposure to digital assets following Bitcoin’s decline below the key $60,000 support level.
Outside crypto, financial markets have become increasingly defensive. A stronger-than-expected U.S. jobs report reduced expectations for Federal Reserve rate cuts, while renewed geopolitical tensions in the Middle East pushed oil prices higher and revived inflation concerns.
Rising Treasury yields prompted another rotation away from speculative assets, weighing on altcoins across the market.
Solana approaches a critical long-term support zone
The weekly chart shows Solana testing a major support area near $51.5 after months of persistent selling pressure. The level served as an important breakout zone during late 2023 and now represents the most significant support remaining on the higher-timeframe chart.
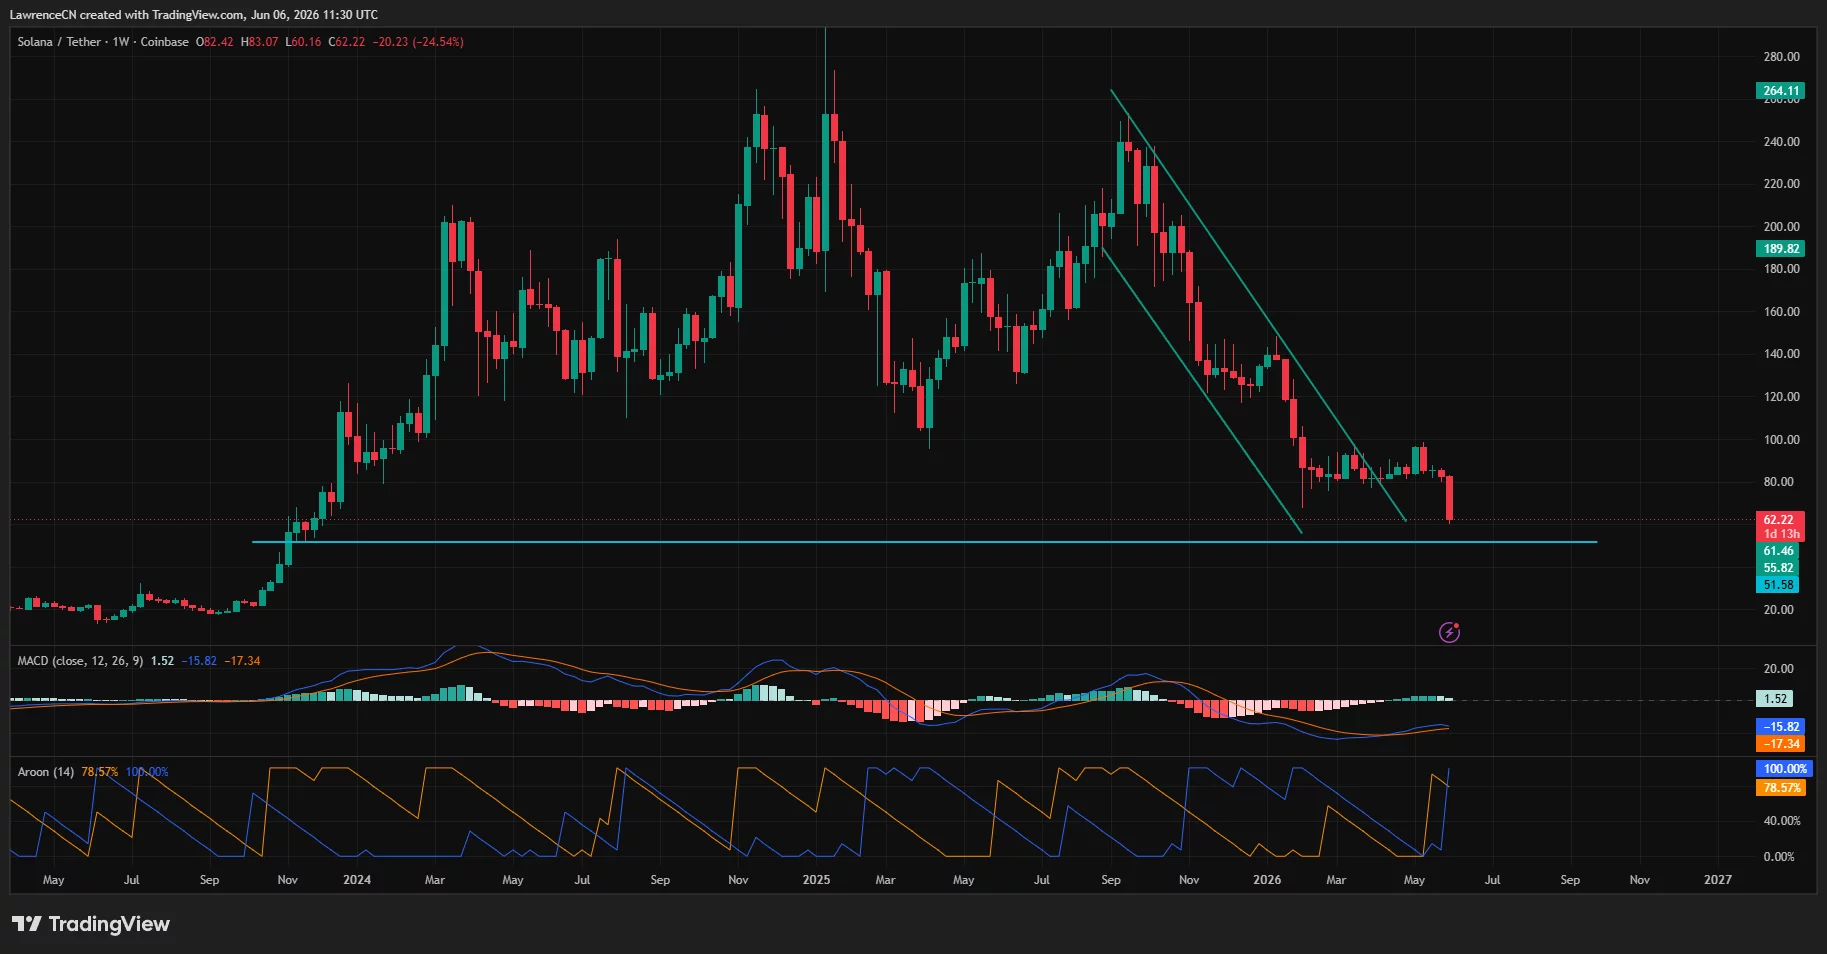
Trend indicators continue to favor sellers. Solana remains well below its major moving averages, while the weekly MACD sits beneath the zero line with both MACD and signal lines still trending lower. Aroon indicators also remain bearish, with the Aroon Down reading returning to 100 and the Aroon Up trailing beneath it.
Commenting on the bearish market setup, crypto analyst Jack Adams argued that Solana may revisit lower levels before finding a durable bottom.
“I am almost certain $SOL is heading back to retest $67-$58 once more before reversing into $120-$175 this year.”
According to the analyst, previous demand zones between $58 and $67 could attract longer-term buyers despite the ongoing market weakness.
Weak support below current levels raises $50 risk
CoinGlass liquidation heatmap data identifies the largest concentration of leveraged positions between $70 and $75, with a particularly dense cluster near $74. Those levels could attract price during any relief rally, although they now represent significant resistance after the recent breakdown.
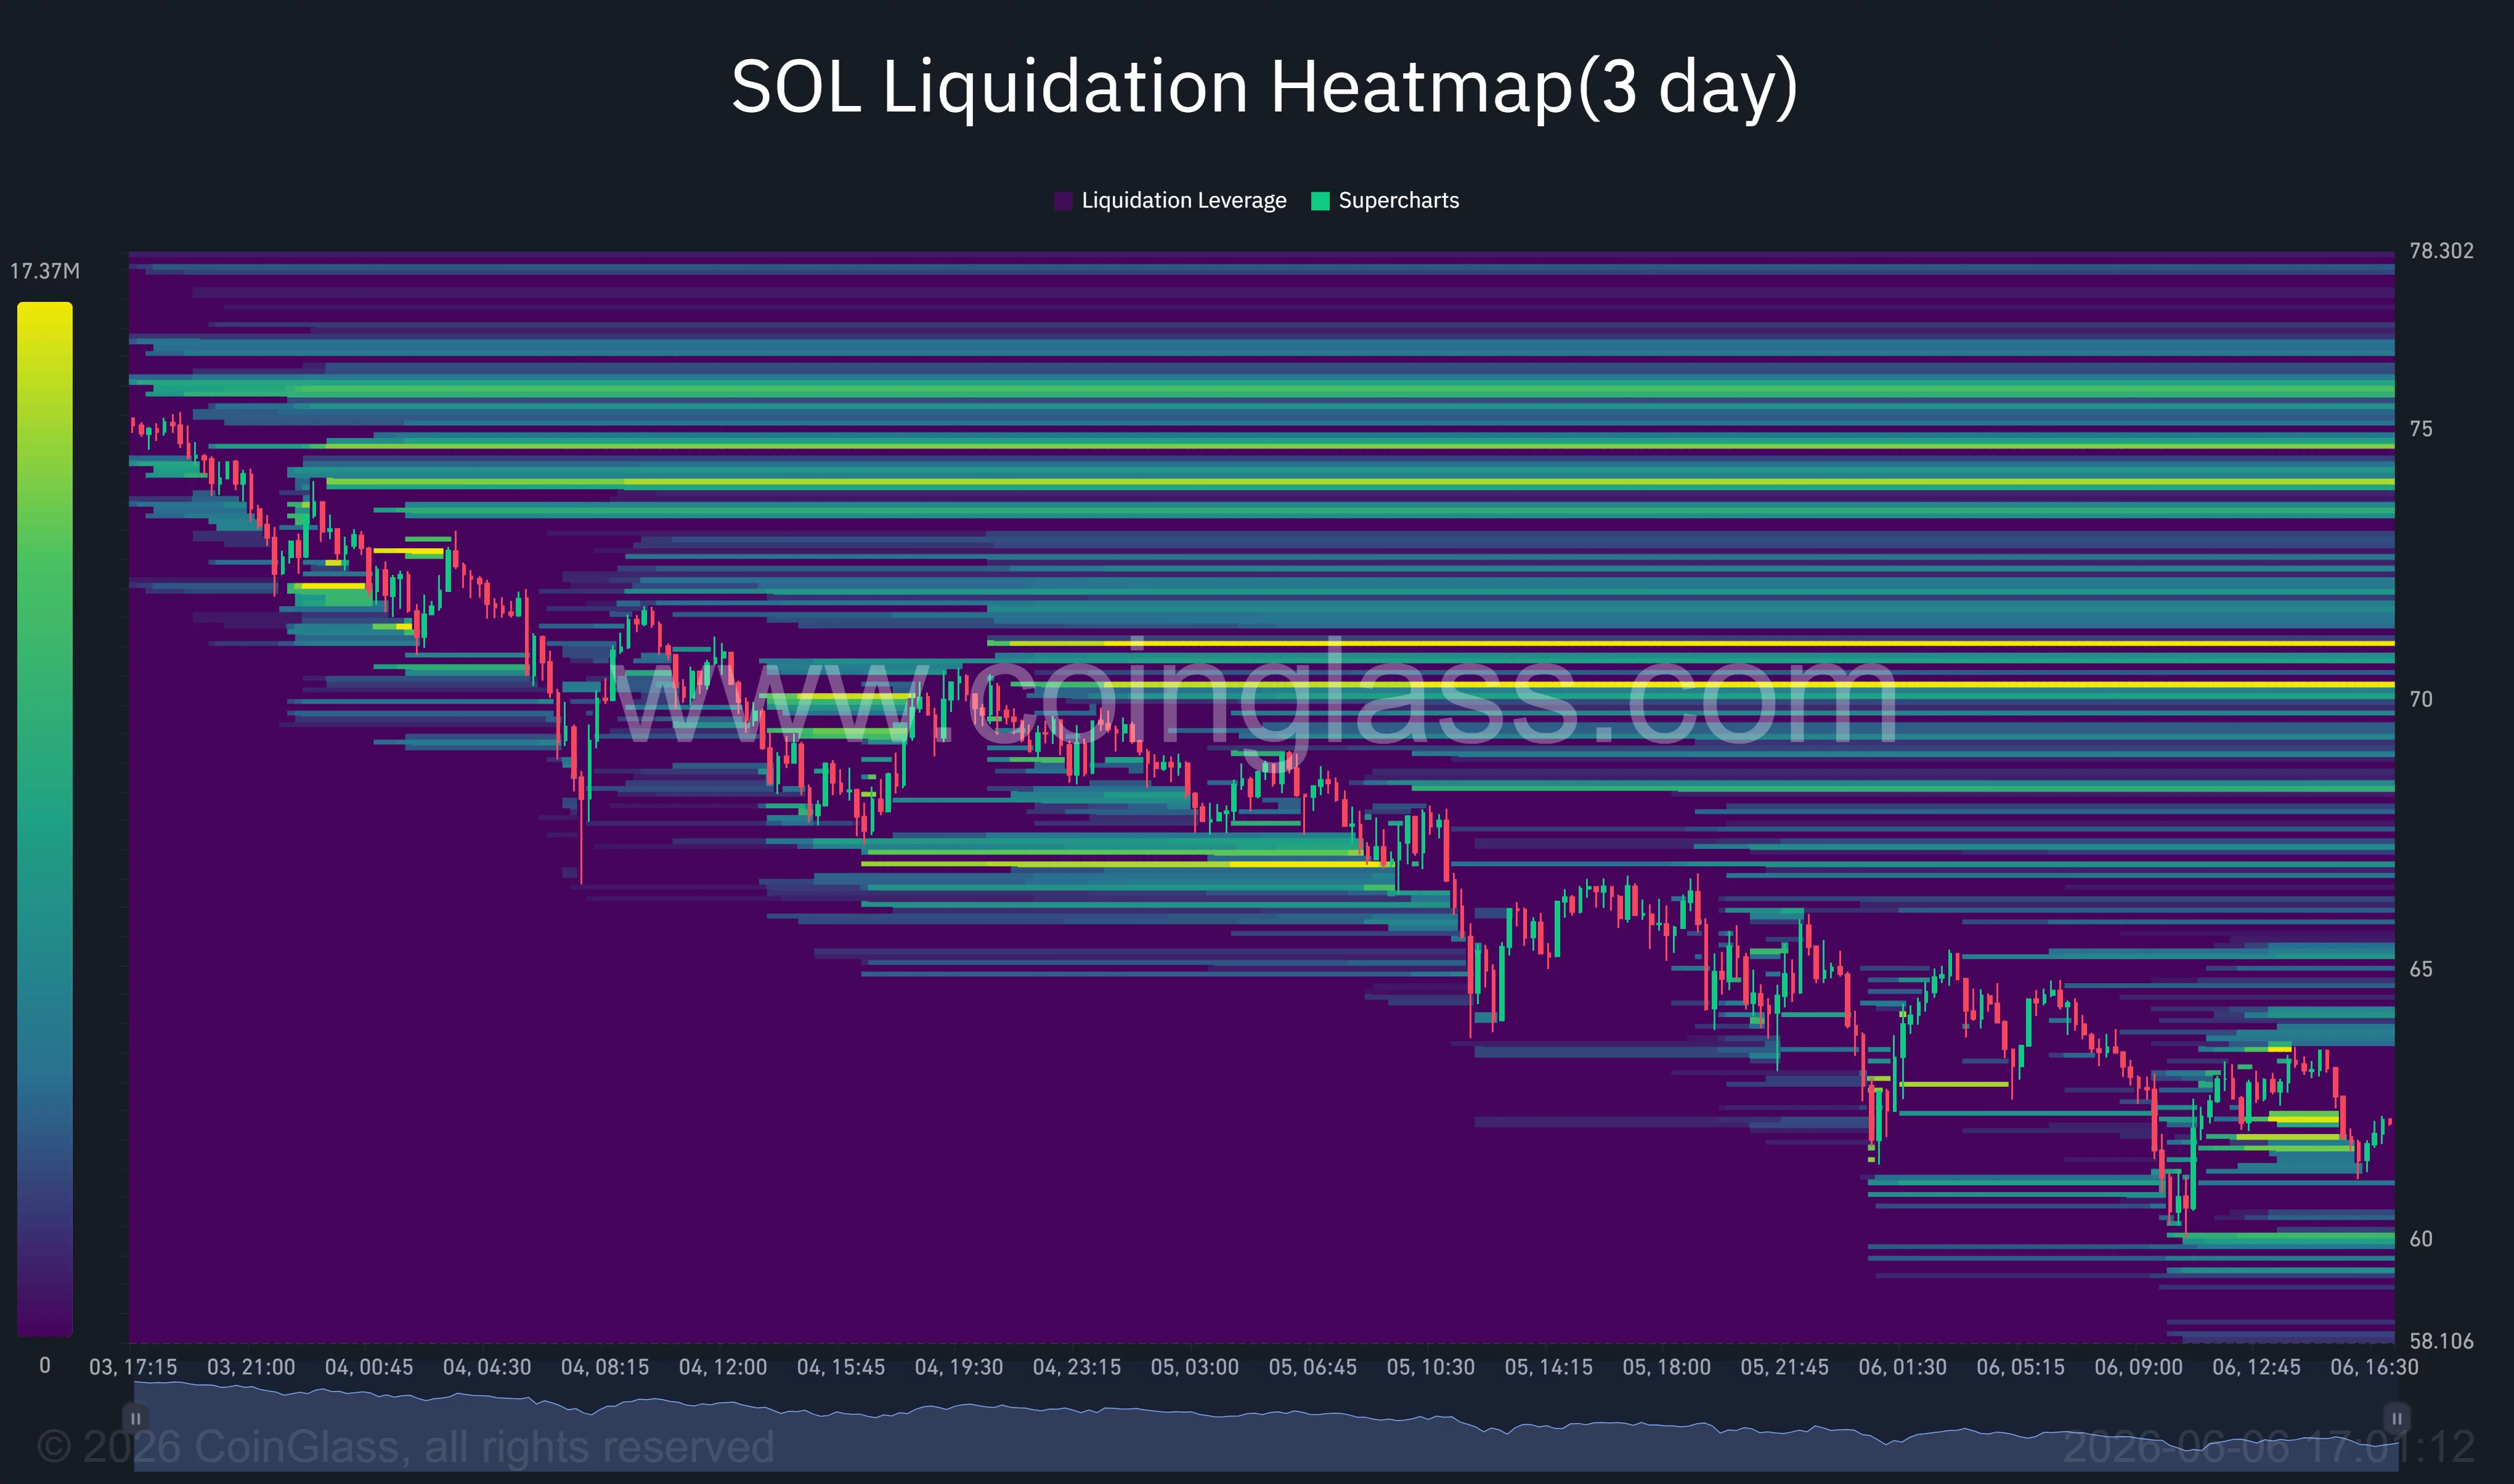
Below the market, liquidity becomes noticeably thinner. The heatmap shows relatively limited support beneath the recent lows compared with the large concentration of positions overhead, increasing the risk of an accelerated move if sellers force another breakdown.
A decisive breakdown below the $51.5 support zone could expose Solana to the psychological $50 level. Since the chart shows limited historical trading activity beneath that area, sellers could attempt to force a deeper move if market conditions remain unfavorable.
Any bullish recovery would likely require SOL to reclaim the former support area near $70 before challenging the heavy liquidation cluster between $74 and $75.
For now, corporate treasury transfers, ETF outflows, aggressive derivatives liquidations, and unfavorable macro conditions continue to keep pressure on the market, leaving the $50 level firmly on traders’ radar.
Disclosure: This article does not represent investment advice. The content and materials featured on this page are for educational purposes only.

In such times of distress, in which the broader crypto market has experienced a sudden and painful decline, Cardano’s co-founder decided to take a break after a short and bitter announcement on X.
Charles Hoskinson’s decision only worsened ADA’s positioning, as the asset tumbled by double digits on Friday and dumped below $0.19 at the time. It kept plunging in the following hours and slumped to under $0.16 later that day, which became its lowest price level since December 2020. The question we asked ChatGPT’s latest version is how low the token can go now.
Consequences for Cardano and ADA
The numbers paint a clear story for ADA. At one point on Friday, it was down by 14% on a 24-hour scale. The weekly losses are up to 30%, while the monthly decline is at 40%. The macro view paints an even more catastrophic picture, with a 75% value reduction in the past year and a whopping 94.7% drop since its all-time high seen in September 2021.
As such, Hoskinson’s move expectedly caused a lot of controversy immediately, with the social media comments exploding. A few praised his decision, others doubted it, and some lashed out.
ChatGPT reassured that Hoskinson has not resigned from Cardano, but the timing matters. His announcement came shortly after the shutdown of major ecosystem participants, the cancellation of Cardano’s flagship summit, and public warnings that additional projects and DeFi applications could disappear before the end of the year.
“The market is treating the move as a vote of no confidence. Whether that interpretation is fair or not is almost irrelevant. Crypto markets are driven by narratives and the current dominant one is that Cardano’s ecosystem is shrinking while competitors continue to attract developers, liquidity, and users,” the AI stated.
So, How Low?
After acknowledging that ADA has already erased years of gains with its drop below $0.17, ChatGPT warned that it could still have room to fall if sentiment continues deteriorating.
Its bearish scenario envisions another leg down, perhaps toward $0.12. If that level cracks, then Cardano’s native asset could be on the way down to even under $0.10. Extreme capitulation sees a decline to $0.08, while the “nuclear scenario” from the AI platform outlined $0.05 as the lowest target.
“For ADA to trade below five cents, Cardano would likely need to enter a prolonged death spiral involving developer departures, collapsing liquidity, and a broader crypto bear market,” it concluded.
The post How Low Could ADA Fall Without Hoskinson? AI Issues Stark Warning appeared first on CryptoPotato.

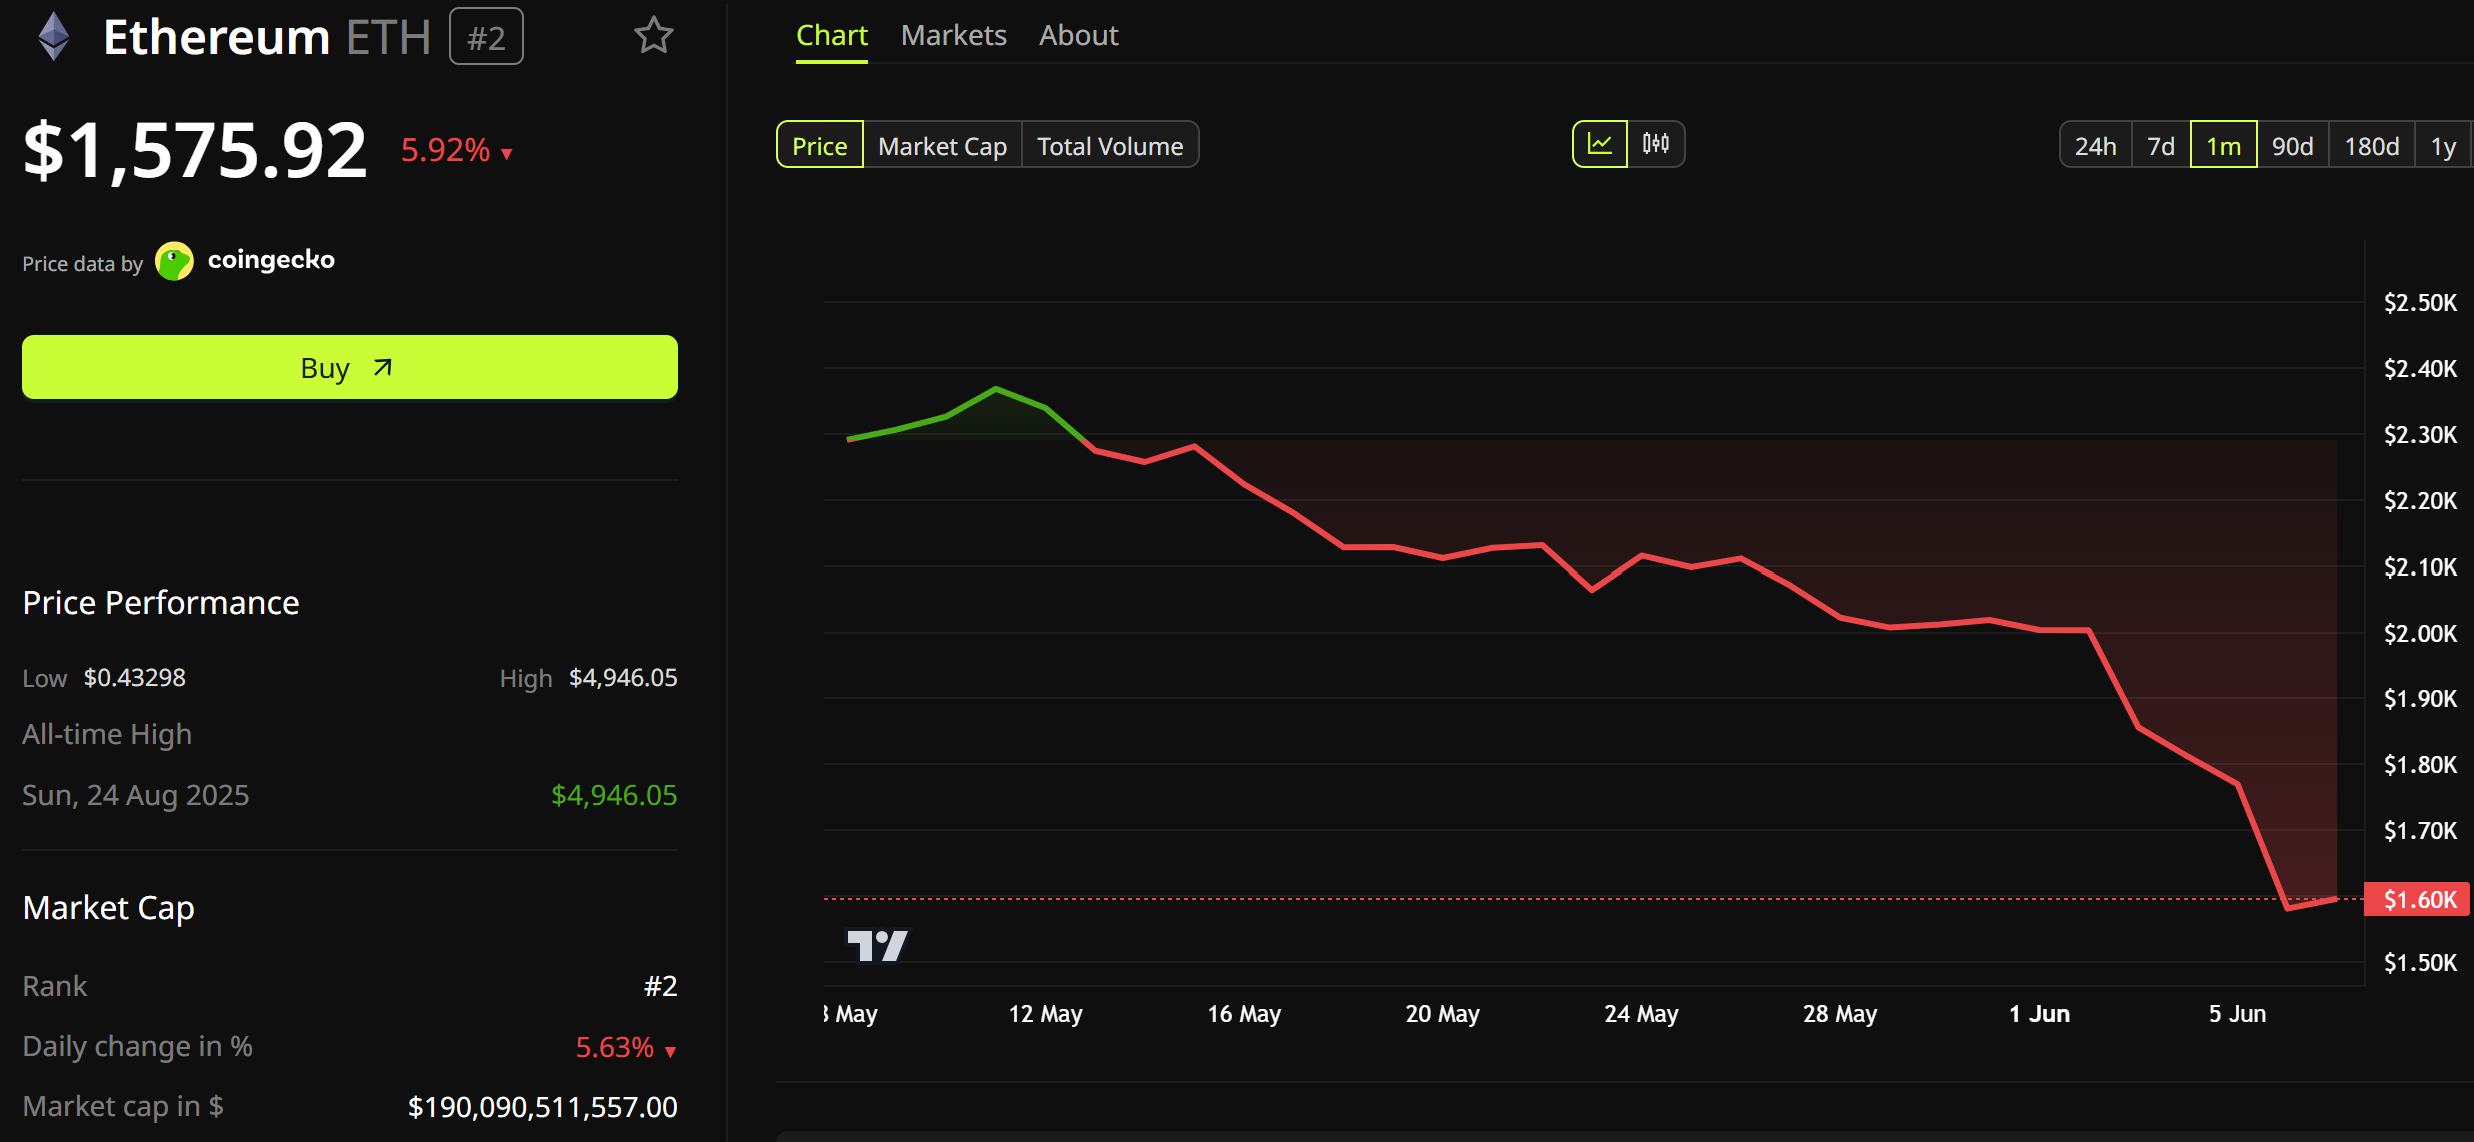
Ethereum price plunged towards the $1,500 level after a wave of long liquidations, persistent ETF outflows, and worsening macroeconomic conditions triggered one of the sharpest crypto selloffs of 2026.
Summary
- Ethereum price plunged to around $1,500, extending weekly losses to 23% amid a market-wide liquidation event and worsening macro conditions.
- Spot Ethereum ETFs saw $540 million in outflows in May, and another $168 million left the funds in early June, adding pressure on prices.
- Analysts warn a break below $1,400 could expose ETH to a deeper decline toward the $1,000-$1,100 region.
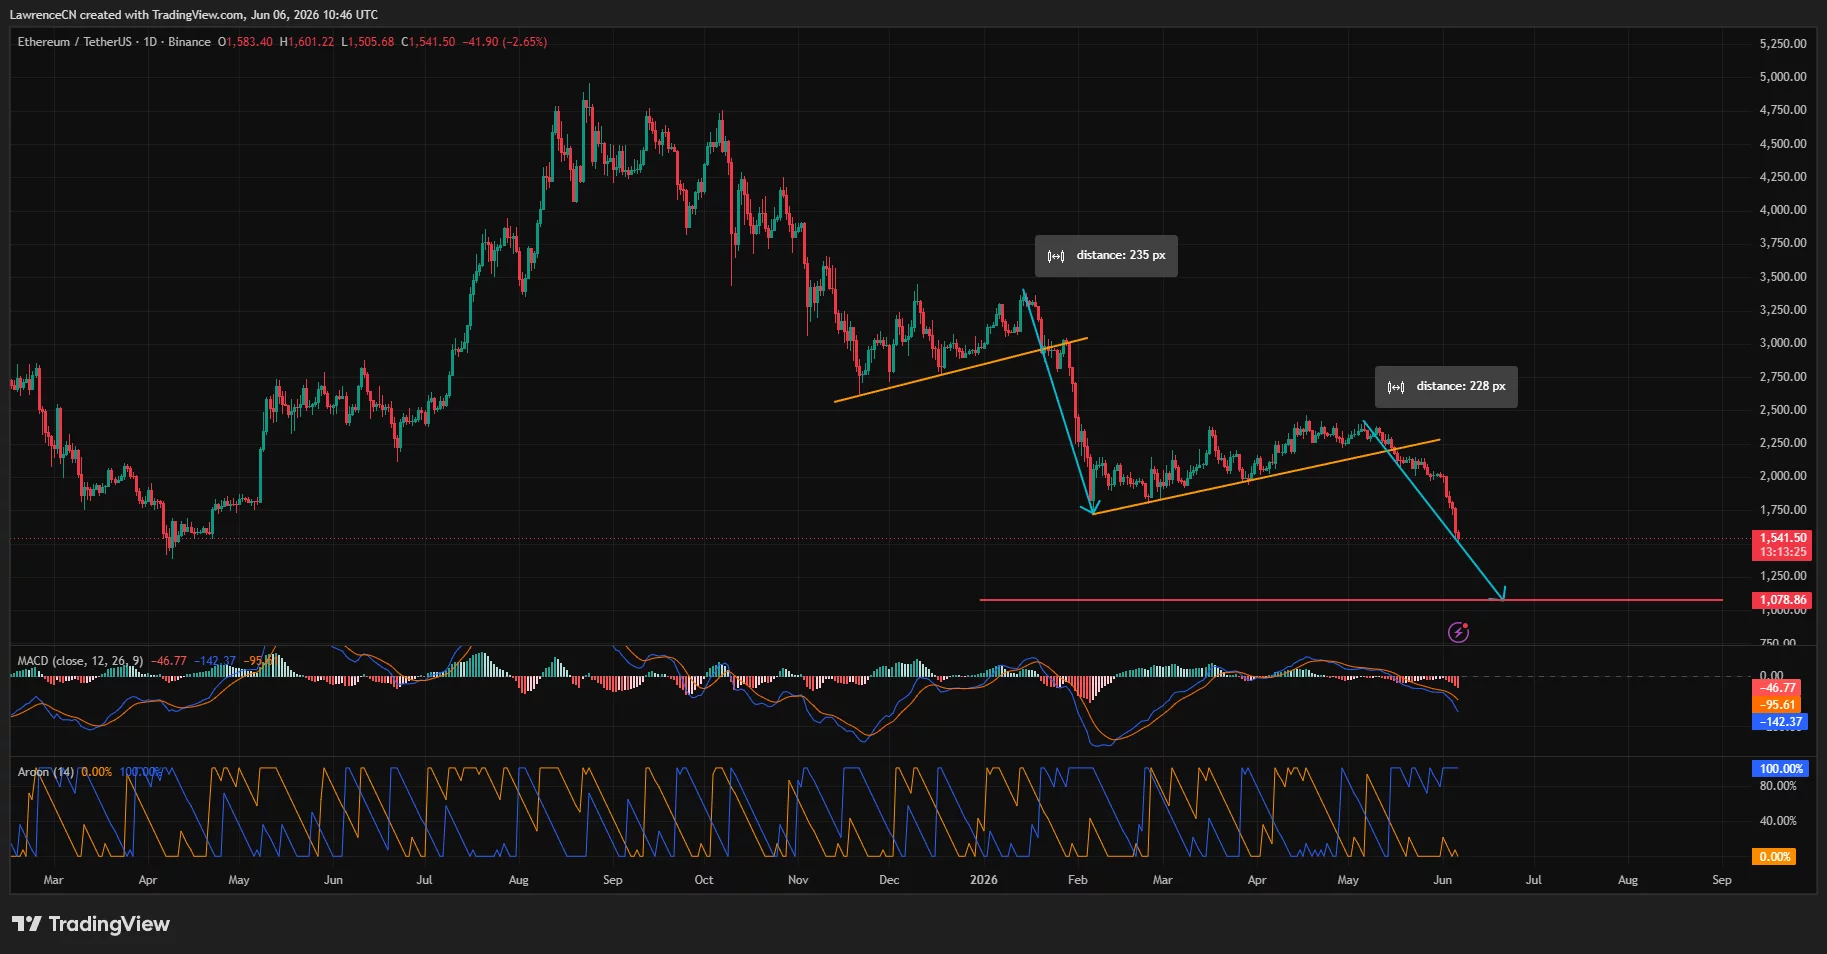
According to data from crypto.news, Ethereum (ETH) price fell over 10% to an intraday low of around $1,505 on June 6 before stabilizing near $1,540 at press time. The decline extended losses to roughly 23% over the past week and pushed ETH to its lowest level since early 2023 as investors fled risk assets across both crypto and traditional markets.
Selling accelerated after Bitcoin briefly slipped below the key $60,000 support level, triggering a market-wide liquidation event. Derivatives data showed nearly 78.7% of liquidations over recent sessions came from long positions, while Ethereum open interest dropped by almost 30%, highlighting a sharp reduction in leveraged bullish bets.
At the same time, institutional demand continued to deteriorate. Per SoSoValue data, U.S. spot Ethereum ETFs recorded approximately $540 million in net outflows during May, with another $168 million leaving the products during the first week of June. The sustained withdrawals removed a major source of demand from the spot market and added pressure on ETH as prices broke below several key technical levels.
Macroeconomic conditions added another layer of stress. A stronger-than-expected U.S. labor report reduced expectations for Federal Reserve rate cuts, while renewed military tensions between the United States and Iran pushed Brent crude toward $97 per barrel.
Rising oil prices revived inflation concerns and prompted investors to move capital into defensive assets and large-cap technology stocks rather than cryptocurrencies.
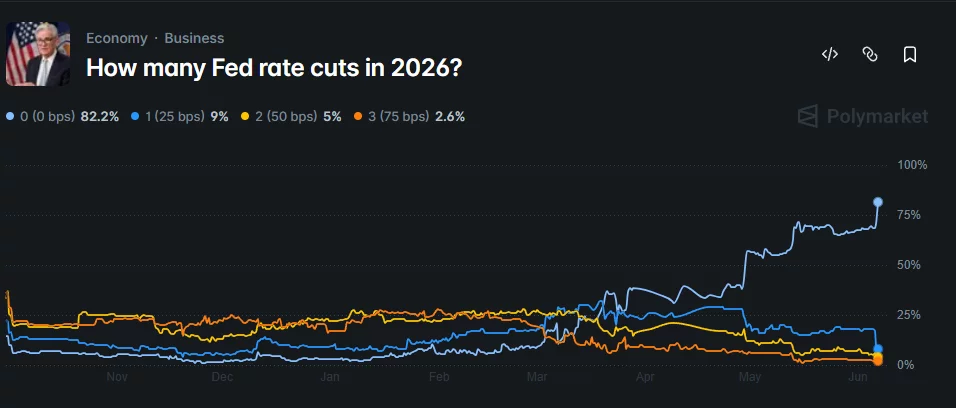
Prediction market participants have also scaled back expectations for Federal Reserve easing. Polymarket data recently showed traders assigning a roughly 82.2% probability that the Federal Reserve will not cut interest rates during the remainder of 2026, a scenario that could keep liquidity conditions tight for risk assets.
Ethereum breakdown opens path toward $1,000 support zone
Technical charts show Ethereum breaking below a rising support trendline that had previously acted as the foundation of several recovery attempts since February. The breakdown completed a bearish continuation structure and sent ETH directly toward the $1,550 support region identified by multiple analysts.
According to crypto analyst Ali Martinez, Ethereum has already reached his first downside objective.
“Ethereum $ETH hit my first target at $1,560. Next target: $1,070.”
A separate analysis from More Crypto Online argues that Ethereum remains in a larger corrective decline. The firm noted that support sits near $1,550 and $1,400, while any recovery attempt is likely to face resistance at the broken trendline that previously supported the market.
Momentum indicators continue to favor sellers. The daily MACD remains deeply negative, while the Aroon indicator shows bears maintaining full control of the prevailing trend. Meanwhile, Ethereum has fallen well below its 200-day moving average after losing the psychologically important $1,800 level earlier this week.
On-chain activity has weakened alongside the price action. Ethereum network fees have fallen roughly 45% from recent highs, while large holders have continued reducing exposure during the latest decline. The drop in network activity coincides with reduced speculative demand across decentralized finance and derivatives markets.
Key risks remain tied to leverage, ETF flows and macro conditions
Liquidation data suggests downside volatility could persist if Ethereum loses the $1,400 support area. Several analysts have identified the $1,000-$1,100 region as the next major historical demand zone should current support levels fail to hold.
Additional pressure could emerge from decentralized finance markets. Estimates suggest roughly $547 million in lending positions may face liquidation if Ethereum extends its decline, creating another potential source of forced selling.
A recovery scenario would require Ethereum to reclaim the broken trendline resistance and recover the $1,800 area, which previously served as a major support level. ETF flows also remain critical. Continued institutional withdrawals would likely limit any rebound attempt, while a return of inflows could help stabilize market conditions.
Crypto sentiment remains firmly bearish for now. The Crypto Fear & Greed Index recently fell to 11, its lowest reading in Extreme Fear territory, underscoring the depth of investor pessimism as Ethereum tests support levels not seen in more than two years.
Disclosure: This article does not represent investment advice. The content and materials featured on this page are for educational purposes only.

TLDR:
- Goldman Sachs projects $7.6 trillion in cumulative AI infrastructure capex between 2026 and 2031.
- Nvidia is forecast to capture 75% of the $5.1 trillion compute layer over the six-year period.
- Power is the smallest budget segment at $358 billion but the critical bottleneck for full deployment.
- Vistra locked in a 20-year, 2,600 MW nuclear deal with Meta to meet surging AI power demand.
Goldman Sachs has released a detailed projection of artificial intelligence infrastructure capital expenditure, forecasting $7.6 trillion in cumulative spending from 2026 to 2031.
The breakdown covers three core layers: compute at $5.1 trillion, data centers at $2.1 trillion, and power at $358 billion.
The report identifies specific companies positioned to absorb capital across each segment. At $765 billion in 2026 alone, annual AI capex is expected to reach $1.6 trillion by 2031.
Compute and Data Center Demands Drive Infrastructure Buildout
Goldman Sachs AI infrastructure projections place Nvidia at the center of the compute layer. The firm assumes Nvidia will capture 75% of all compute spend over the forecast period, translating to roughly $3.8 trillion in cumulative revenue through its products. The baseline unit for this projection is the Rubin VR200 chip, priced at $80,500 per GPU.
Nvidia’s data center GPU gross margins sit at 75%, which is why major hyperscalers are developing custom silicon.
However, performance gaps mean those same companies continue purchasing Nvidia hardware in parallel. No current alternative matches its output at scale.
The data center layer reflects a sharp escalation in physical requirements. Standard cloud infrastructure runs between 5 and 15 kilowatts per rack.
Transitional Blackwell-era AI facilities operate at 130 to 200 kilowatts per rack. Next-generation AI factories running Rubin and Feynman chips require over 500 kilowatts per rack, with liquid cooling as the only viable thermal option.
Construction costs are rising alongside density. Traditional hyperscale data centers cost approximately $10 million per megawatt to build.
Next-generation AI data centers are being planned at $15 to $20 million per megawatt, a sharp increase driven by cooling and power infrastructure requirements.
Power Constraints and Key Companies Shape the Capital Cycle
Goldman Sachs AI infrastructure analysis identifies silicon useful life as the single largest variable in the model. At a three-year replacement cycle, cumulative compute depreciation reaches $3.99 trillion. A seven-year cycle drops that figure to $2.23 trillion, a difference of $1.76 trillion on one assumption.
Vertiv is positioned directly within the data center upgrade cycle. Every rack transitioning from 40 kilowatts to 500-plus kilowatts requires new liquid cooling systems and power distribution equipment. The liquid cooling market is projected to grow from $5.5 billion today to $15.75 billion by 2030.
Power, at $358 billion, is the smallest budget segment but the most operationally critical. Amazon CEO Andy Jassy captured the constraint plainly: “Our single biggest constraint is power.”
Grid connection timelines for large data centers extend into years, making early contracting essential for deployment.
Vistra has responded to that constraint by locking in long-term nuclear power purchase agreements. The company secured a 20-year deal with Meta covering over 2,600 megawatts of nuclear energy, along with a separate agreement with AWS.
Goldman Sachs and Jefferies both upgraded Vistra following the Meta announcement, according to Milk Road AI’s breakdown of the report.

Ethereum co-founder Joseph Lubin moved 80,001 ETH worth roughly $122 million from a wallet that sat untouched for more than three years, reviving fears of founder selling as the token slid toward $1,500.
The transfer drew attention because dormant founder wallets rarely move during market stress. On-chain trackers later showed the ether never reached an exchange, complicating the sell pressure narrative that formed within minutes.
Why The Lubin Transfer Rattled Traders
Ethereum was trading for $1,575 as of this writing, down about 5.9% over 24 hours, according to BeInCrypto data.
The token has shed approximately 22% across the past week, leaving holders sensitive to any large movement.

Nansen analyst Alex Svanevik first flagged a 40,000 ETH outflow, then revised the figure to 80,000 ETH across two transactions.
On-chain analysts soon traced the address tied to Lubin, which still holds about 243,300 ETH worth near $370 million.
The timing fed existing anxiety. Ethereum spot ETF demand had already collapsed, and Ethereum buying has cooled sharply during the slide.
On-Chain Data Points To MakerDAO, Not An Exchange
The bear case rested on where the coins might land next. Moving tokens to an exchange often indicates intention to sell.
“If any portion of this reaches spot order books during an already-stressed ETH market, it adds meaningful sell pressure,” said one user.
However, on-chain trackers reached a different read. The ether moved to two wallets and was supplied into MakerDAO, with about $209 million in Dai (DAI) borrowed against it.
That pattern points to collateral management aimed at reducing liquidation risk, not distribution.
Follow us on X to get the latest news as it happens
Lubin has long held a bullish stance on ETH, which makes outright selling near multi-month lows harder to read as exit behavior.
Whether the remaining 243,300 ETH stays parked will likely shape near-term sentiment.
Traders are now watching for exchange deposits that would confirm distribution rather than DeFi collateralization.
Ethereum ETF Flows Add To The Pressure
Spot Ethereum ETFs briefly interrupted a 17-day outflow run on June 4, taking in $19.3 million, according to SoSoValue data.
However, outflows resumed the next day, with about $6 million leaving on June 5.

The reversal showed how fragile demand remains after two weeks of outflows and a broader crypto risk-off tone.
The post Joseph Lubin’s $122 Million Move Sparks Sell-Off Fears for Ethereum appeared first on BeInCrypto.

Strategy co-founder and executive chairman Michael Saylor is urging Bitcoin to pursue a path of disciplined expansion that weaves the asset into the core fabric of conventional finance. In a Friday essay, he argued that Bitcoin’s base layer should be treated as sacred infrastructure, with most innovation taking place on higher layers, including custody systems, credit instruments and the financial plumbing surrounding the network. The thrust is not merely about more spot buyers or ETF inflows, but about embedding Bitcoin within banks, securities, credit markets and capital markets to fuel a sustainable, enterprise-grade adoption cycle.
The remarks come as Bitcoin endures a broad market setback that has strained the two dominant institutional avenues for exposure: passive spot ETF products and corporate/credit-market adoption. Strategy itself has recently sold 32 BTC to fund preferred stock dividends—the first sale since 2022—challenging the long-standing “never sell” ethos associated with Saylor’s corporate strategy and underscoring how liquidity needs canshape a narrative around perceived HODLers.
Data from SoSoValue illustrate the pressure on spot‑based ETF channels: Bitcoin spot ETF weekly net outflows reached roughly $1.42 billion, $1.26 billion and $1.0 billion in the last three weeks of May, with the current week tally already around $1.4 billion. The combination of outflows and price softness has intensified debate over whether Bitcoin’s recent weakness represents a temporary liquidity reset or a broader shift in institutional demand.
Key takeaways
- Michael Saylor’s framework pushes Bitcoin toward disciplined, embedded finance—integrating Bitcoin into balance sheets, securities, banks, brokers, and capital markets—rather than relying primarily on spot ETF inflows.
- Strategy’s sale of 32 BTC to fund preferred stock dividends marks a rare liquidity event that tests the “never sell” premise and highlights the role of corporate treasury needs in the BTC narrative.
- Spot BTC ETF outflows remain large and persistent, challenging the notion that ETF-driven demand will independently sustain a long-term bull run.
- Analysts present a split view on demand: one camp sees potential stabilization if ETF flows and reserves resume, while another cautions that the unwind in ETF narrative and on‑chain signals could delay a durable recovery without real institutional re-entry.
Saylor’s blueprint: Bitcoin beyond ETFs and into the financial system
In his essay, Saylor outlined four broad ideologies shaping Bitcoin discourse—maximalists, capitalists, technologists and fundamentalists—each valuing something essential yet potentially dangerous if taken to an extreme. The “disciplined expansion” concept aligns most closely with the capitalist frame, which treats Bitcoin as digital capital capable of sitting on corporate balance sheets, serving as collateral, and enabling participation across banks, brokers, insurers and asset managers.
That framing marks a shift from a market‑share metric defined by ETF inflows to a broader, infrastructure‑oriented vision. Saylor argues that Bitcoin’s core value proposition lies in its base layer as a foundation for a secure and auditable financial system, while most innovations will occur in higher layers—such as innovative custody architectures, credit instruments and other capital‑markets mechanisms that can leverage Bitcoin as an underlying asset.
Under this lens, Bitcoin becomes less about chasing ETF commissions or price momentum and more about its role as digital collateral and a decentralized store of value that can operate within traditional financial channels. Adopters—from treasuries to insurers and fund managers—could integrate BTC into capital markets operations, using it as a treasury tool, a collateral backbone, or a component of structured finance. The result would be a more embedded form of Bitcoin’s demand, one driven by corporate utility and risk management as much as by consumer or investor appetite.
“Sacred infrastructure” is not a rhetorical flourish here; it signals a deliberate attempt to distinguish the base layer’s reliability and security from the rapidly evolving layers that enable application development and finance. For builders, this signals a conducive environment for custody providers, liquidity facilities, and on‑ramp/off‑ramp ecosystems to mature in tandem with Bitcoin’s deeper integration into financial workflows.
Market signals and the two-channel test for institutional demand
The current market setup has heightened the tension between two institutional channels: the ETF‑driven path and the corporate/credit‑market route. SoSoValue’s ETF flow data show persistent weekly outflows, eroding the confidence that ETF inflows alone can underpin a lasting uptrend. This dynamic invites closer scrutiny of on‑chain signals and balance‑sheet demand as potential confirmatory indicators for a longer‑term reboot of institutional appetite.
Analysts have been quick to parse the implications. Lacie Zhang, a research analyst at Bitget Wallet, cautions that the key question extends beyond whether BTC holds a psychological level of around $63,000. “We need ETF flows to stabilize, exchange reserves to keep falling, and whale accumulation to pick up,” she told Cointelegraph. Her scenario still keeps open the possibility of a retest in the $55,000 to $57,000 area if outflows persist, given the liquidity constraints and leveraged liquidations that have punctuated recent sessions.
On the other side, Nicolai Sondergaard of Nansen offered a more cautious take. He noted that exchange‑flow data suggest participants have used Bitcoin’s bounce—from roughly $61,000 to the low $60,000s—to reduce exposure rather than to add to new long positions. “ETF demand narrative has been unwinding since May,” Sondergaard said, underscoring that a durable recovery would require visible, sustained re‑entry from institutional buyers. Without such participation, the market could struggle to regain momentum even if immediate pressure eases.
These competing readings reflect a broader debate about Bitcoin’s near‑term path. The ETF‑led demand narrative has waxed and waned over the months, and as liquidity conditions swing, traders are left weighing whether the current pullback represents a recalibration or the onset of a more protracted phase of subdued institutional buying. The next several weeks could prove decisive in whether ETF channels stabilize and if on‑chain dynamics or corporate treasury activity begin to offset declines in spot momentum.
What to watch next: a synthesis of embedded finance and market timing
The ongoing discourse around Bitcoin’s integration into the financial system—beyond simple ETF exposure—will likely shape both policy dialogue and investment decisions. If corporations begin to treat BTC as a regular financial instrument—used in treasuries, collateral, and capital‑markets operations—we could see a structural shift in demand that is less sensitive to ETF inflows and more anchored in balance‑sheet strategy and risk management. Conversely, if ETF outflows persist and on‑chain signals remain weak, the recovery may hinge on a gradual re‑establishment of institutional confidence, with a focus on risk controls, liquidity, and custody reliability as prerequisites for broader participation.
Readers should monitor a few concrete indicators in the coming weeks: ETF flow stability, changes in exchange reserves, and the pace of whale accumulation; especially whether new corporate treasury programs or credit‑market facilities materialize for Bitcoin. The tension between the embedded‑finance thesis and ETF‑driven exposure is likely to define the market’s trajectory in the near term, with the long‑run direction depending on how smoothly Bitcoin can be integrated into the existing financial infrastructure while maintaining its core properties.
As Saylor’s framework suggests, the path forward may hinge less on chasing inflows and more on building a robust ecosystem where Bitcoin functions as a trusted, auditable component of financial operations. Whether that vision materializes remains a question for the months ahead, but the ongoing debate signals that the “next phase” for Bitcoin could be less about rapid price moves and more about how deeply it embeds into the machinery of global finance.

Zcash (ZEC) has faced fresh scrutiny after a patched Orchard Pool vulnerability sparked a dispute over whether the privacy coin’s users and investors still face hidden risks.
Summary
- Zcash faces fresh scrutiny after developers patched a critical Orchard Pool vulnerability.
- Dragonfly partner Haseeb Qureshi said the market may be overstating the immediate risks.
- Qureshi argued that counterfeit ZEC would likely remain limited to the shielded pool.
Dragonfly partner Haseeb Qureshi said the market may be treating the bug as a larger immediate threat than the available evidence supports. He also said Dragonfly continues to hold ZEC, even as developers, investors, and privacy advocates debate what the flaw could have allowed before it was fixed.
Qureshi says ZEC fears look overstated
According to Qureshi, the critical issue was not whether the vulnerability was serious, but where its impact would likely have stayed. He said the bug could have allowed someone to create counterfeit ZEC inside the Orchard shielded pool, but he argued that those coins would face a major obstacle once an attacker tried to sell them.
In Qureshi’s view, an attacker would eventually need to move counterfeit shielded ZEC into transparent ZEC before using major exchanges. Since transparent ZEC can be checked against the public supply, he said any attempt to move inflated amounts into visible circulation would be easier for the network to catch.
For that reason, Qureshi said regular exchange users and many traders likely had limited direct exposure. He placed the largest risk on users who kept funds inside the shielded pool while the vulnerability existed.
Qureshi also cited recent Zcash network data to support his argument. He said the shielded pool’s share of supply fell from 31% to 30% over 48 hours after the disclosure.
To Qureshi, that small drop did not show a rush by privacy-focused users to leave the pool. He described the move as modest rather than a sign of panic, while still acknowledging that the bug created a serious debate around Zcash’s private transaction system.
Wei Dai warns attack could be harder to trace
Meanwhile, Zcash creator Wei Dai argued that a successful attacker may not have needed to empty the Orchard Pool. Dai said a careful attacker could have kept fake ZEC inside the shielded environment and moved it slowly through private transfers.
Under that scenario, Dai said the pool itself could have helped hide the movement of counterfeit coins. He also raised another possible risk. If someone discovered the flaw early, Dai said that person could have opened a large short position against ZEC before the bug became public.
Because ZEC trades on liquid perpetual futures markets, Dai argued that a trader could have profited from the later price reaction without leaving clear on-chain evidence of the original exploit.

Worldcoin price has plunged more than 25% after Arthur Hayes closed his entire WLD position, triggering a sharp reversal in one of the crypto market’s strongest AI-linked trades.
Summary
- Worldcoin price plunged 28% after Arthur Hayes disclosed that Maelstrom had exited its entire WLD position.
- Key support sits at $0.35, with a breakdown potentially opening the door to a retest of $0.23.
- CoinGlass data shows major liquidation clusters at $0.45-$0.48 and near $0.60, creating key levels for traders.
According to data from crypto.news, Worldcoin (WLD) price plunged 28% from above $0.56 to around $0.40 on June 6, wiping out a significant portion of the token’s recent rally. The decline left WLD roughly 35% below its recent peak near $0.62 as selling accelerated after Arthur Hayes disclosed that Maelstrom had exited its entire position just days after publicly defending the trade.
The BitMEX co-founder announced the sale in an X post earlier today.
“This chart is going in the wrong direction. Dumped $WLD. I’m out. See y’all at the clerb.”
The decision represented another major portfolio reduction after Hayes recently disclosed exits from HYPE, NEAR, and Zcash.
Hayes had previously argued that Worldcoin could benefit from enthusiasm surrounding artificial intelligence-related assets and upcoming AI IPOs. By Friday, however, he had abandoned the thesis and cited a changing macro backdrop that included higher energy prices linked to the Iran conflict and growing uncertainty surrounding AI-focused investments.
The reversal came as speculative sentiment weakened across crypto markets. Bitcoin (BTC) briefly slipped below the $60,000 support area this week, triggering broad risk reduction among traders and contributing to heavy liquidations across altcoins.
Zcash provided an early warning of Hayes’ changing stance. As reported by crypto.news earlier, ZEC crashed nearly 50% from its recent high to an intraday low of $264.80 on June 5 after disclosure of the Orchard shielded pool vulnerability. Hayes subsequently liquidated his entire ZEC position, followed by exits from HYPE, NEAR, and finally WLD.
Technical structure keeps $0.35 as the key battleground
The daily chart shows WLD retreating sharply after failing to hold above the recent breakout area near $0.53. Despite the selloff, WLD price remains above a major support zone around $0.35, a level that acted as resistance throughout February and March before turning into support during the latest advance.
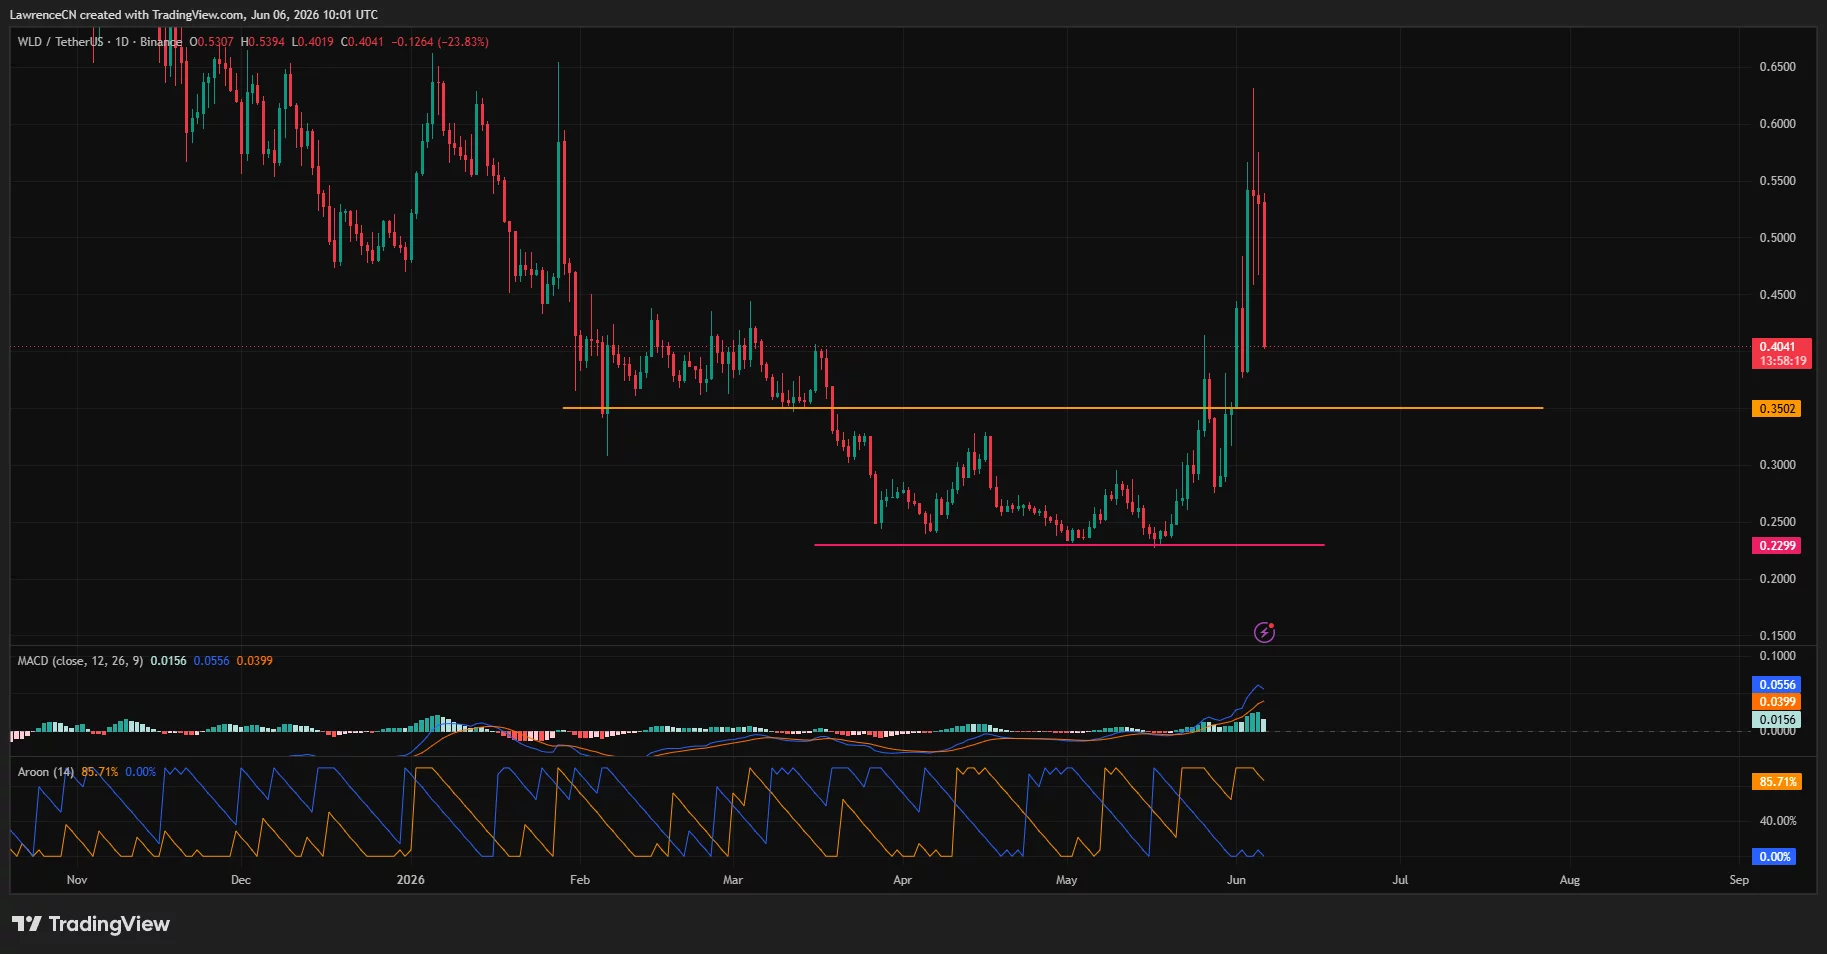
Buyers successfully defended that area multiple times earlier this year, making it the most important level on the chart. A decisive break below $0.35 could expose the next major support near $0.23, where Worldcoin formed its spring bottom.
Momentum indicators present a mixed picture. The MACD remains in bullish territory, with the signal line still above the zero axis following last month’s breakout. At the same time, the Aroon indicator shows Aroon Up near 86 while Aroon Down sits at 0, suggesting the longer-term uptrend has not been fully invalidated despite the recent correction.
Volume expanded significantly during the recent rally, pushing WLD from roughly $0.23 to above $0.60 in less than two weeks. Such rapid advances often lead to sharp retracements as traders lock in profits and leveraged positions unwind.
Liquidation clusters reveal the next major risk zones
CoinGlass liquidation heatmap data shows a dense concentration of liquidity between $0.45 and $0.48, an area likely to act as the first resistance zone if buyers attempt a recovery. Larger liquidation pools remain stacked near $0.59 and $0.60, close to this week’s local high.
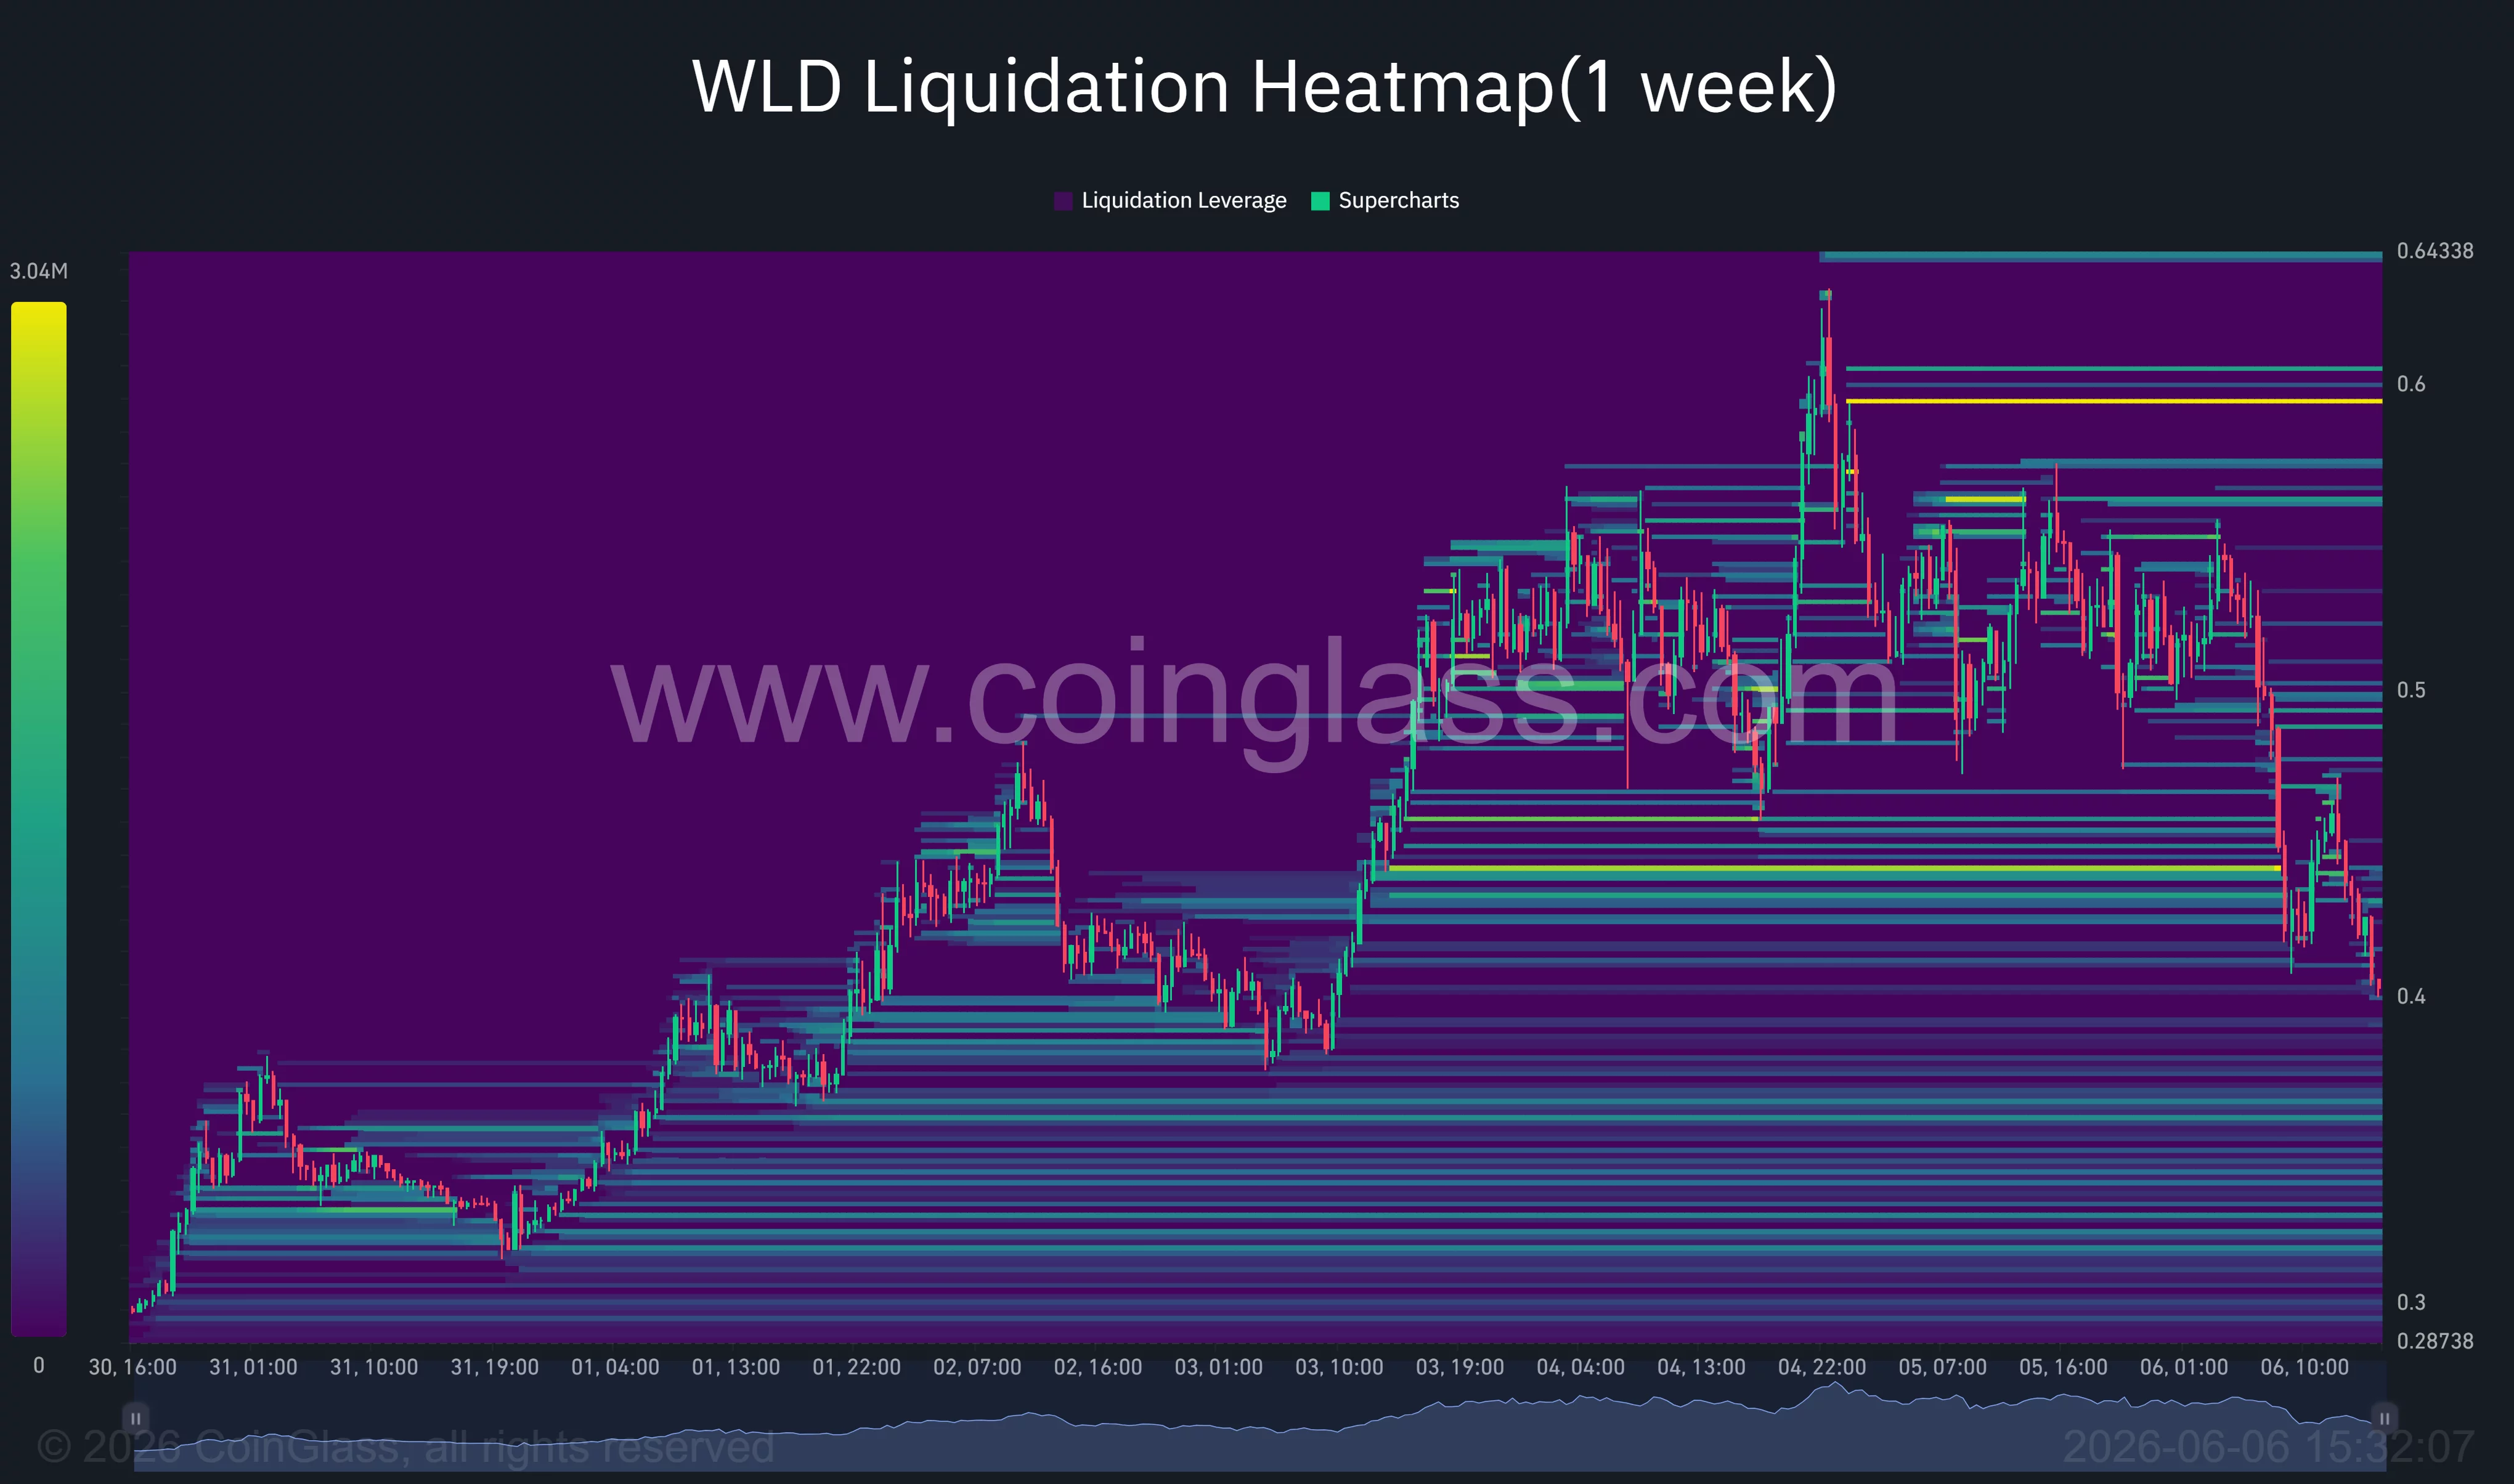
On the downside, leveraged positions are concentrated around the $0.38 to $0.40 region. Price has already entered that area, increasing the risk of additional volatility if sellers continue pressing lower.
Macro conditions remain another source of uncertainty. Stronger-than-expected U.S. labor data has reduced expectations for short-term Federal Reserve easing, while geopolitical tensions in the Middle East have pushed energy prices higher. Both developments have weighed on speculative assets during the past week.
For bulls, defending $0.35 remains the primary objective. Holding above that level would preserve the higher-low structure established since April and keep the possibility of a rebound toward $0.45 alive. A breakdown below support, however, could open the door to a deeper retracement toward the $0.23 base that launched Worldcoin’s recent rally.
Disclosure: This article does not represent investment advice. The content and materials featured on this page are for educational purposes only.
Crypto World
XRP Plunges to 2024 Lows With Risk of a 23% Drop: Will Ripple Ex-CTO’s Roadmap Help Boost the Price?
XRP dropped below $1.10 for the first time since 2024, with analysts warning of a possible further 23% decline, even as Ripple’s CTO emeritus David Schwartz unveiled an ambitious XRP Ledger roadmap.
We break down the price action, the bearish technical setup, and whether Schwartz’s new vision can realistically lift the price.

XRP Plunges Below $1.10: 23% Drop Still Possible
The Ripple’s token fell nearly 4% in the past 24 hours and 18% over the past week, trading between $1.05-$1.09 early on June 6, according CoinGeckos’s data.
That puts XRP roughly 70% below its all-time high near $3.65 set in July 2025. The drop aligns with broader weakness across major crypto assets, including Bitcoin’s recent slide below $60,000.
The decline has been notably steep for XRP. Traders point to technical breakdowns, with the price sweeping below key regression bands on monthly charts and triggering automated selling across leveraged trading platforms worldwide.
Analyst ChartNerdTA highlighted that such moves historically target the middle regression band. That zone sits around $0.84, which would mean a further 23% drop from current levels if the bearish setup plays out fully.
“Over the last 4 months $XRP spent the majority of its time hovering just above its upper regression band. That changed in June. Price is now sweeping below ($1.35), which historically points towards the middle regression band for a potential low ($0.84),” ChartNerd said.
Follow us on X to get the latest news as it happens

Meanwhile, Credible Crypto sees the move differently. He noted that local range lows have been taken and suggested XRP could bounce in the short term before potentially heading toward higher-time frame demand zones, possibly dipping below $1.
He views the correction as a healthy digestion of last year’s impulsive 7x move from sub-$0.50 levels. That framing reframes the current weakness as cyclical rather than structural for committed long-term holders watching closely.
On-chain data also shows significant holdings now in loss, approaching levels seen during prior bear market capitulations. With June historically challenging for crypto, the risk of testing $0.84 remains firmly on the table.
“Absolute capitulation printing on the $XRP 4h chart as a fresh buy confirmation signal locks in right at the 9 exhaustion count. The relentless vertical cascade has crushed the RSI down into deep oversold conditions near 25 while price action attempts to find a floor in the low,” one holder noted.
Can Schwartz’s Roadmap Help Lift the XRP Price?
Against this backdrop, David Schwartz, Ripple’s CTO emeritus and a key architect of the XRP Ledger, shared a forward-looking vision in his recent “XRP in a Minute” video, emphasizing the network’s evolution beyond payments.
Schwartz noted that enterprises are already using the XRPL for tokenized assets. He projected rapid expansion into tokenized securities, stocks, money market funds, repos, and loans across institutional and retail channels.
He framed this as a clear bridge from Bitcoin’s native asset model to a broader ecosystem of issued assets. The XRPL, in his view, can help decentralized finance eventually supplant traditional finance through enterprise-led adoption that pulls in retail users later.
“The XRP Ledger followed soon after, providing both the native digital asset, similar to Bitcoin, as well as issued assets that could represent things like stablecoins or tokenized assets of any kind,” he stated.
The timing is notable. Tokenization fundamentals and institutional pilots show real promise, yet they have so far failed to insulate the XRP price from macro pressures and the profit-taking after last year’s powerful surge across the broader market.
Spot XRP ETFs approved in late 2025 have offered some structural support. However, they have not stemmed the current tide of liquidations and broader risk-off sentiment now dominating global crypto markets across daily sessions.
The disconnect between Schwartz’s roadmap and current price action highlights a familiar crypto dynamic. Technological progress does not always translate into immediate price appreciation, especially during sharp corrections across the broader risk asset complex.
For now, XRP’s long-term thesis hinges on whether the XRPL can capture meaningful real-world asset and DeFi volume amid intensifying competition. Recovery likely requires broader market stabilization plus tangible on-chain growth metrics to validate the roadmap’s promise.
Subscribe to our YouTube channel to watch leaders and journalists provide expert insights
The post XRP Plunges to 2024 Lows With Risk of a 23% Drop: Will Ripple Ex-CTO’s Roadmap Help Boost the Price? appeared first on BeInCrypto.


Online speculation has tied Bitcoin’s latest drop to retail demand for SpaceX’s record IPO, but crypto flow data has not shown clear evidence of a mass cash exit.
Summary
- Online speculation linked Bitcoin’s recent drop to retail demand for SpaceX’s record IPO.
- CryptoQuant data showed no unusual USDC or Tether outflows during the selloff.
- Bitcoin and Ether saw large exchange withdrawals, which often show buyers moving coins to private wallets.
CryptoQuant data reviewed in the report showed no unusual withdrawals of USDC or Tether from exchanges during the selloff. The same data showed stablecoin movements stayed within the range seen since February.
The debate started after Bitcoin price fell about 16% during the same period that SpaceX began marketing its planned public listing. Bitcoin briefly traded below $60,000 before moving back near $61,000, according to market data cited in the report.
Stablecoin flows do not show cash rush
Stablecoins usually offer the clearest public view of crypto traders moving into dollars. A trader who sells Bitcoin to prepare cash for a brokerage account may convert funds into USDC or Tether before redemption.
CryptoQuant data did not show a sharp break in that pattern. The report said the largest recent single-day stablecoin outflows came before the latest Bitcoin decline, with $2.5 billion in USDC on May 22 and $3.6 billion in Tether on May 20.
At the same time, the report said Bitcoin and Ether saw large exchange withdrawals on Friday. CryptoQuant data showed 66,470 Bitcoin and about 2.49 million Ether left exchanges, among the largest single-day totals this year.
Such withdrawals do not usually match panic selling. Coins moving off exchanges often show that buyers took delivery into private wallets after purchases. Sellers usually move coins onto exchanges before selling.
SpaceX IPO draws heavy retail attention
Reuters reported that SpaceX plans to raise $75 billion through its IPO at a $135 share price. Reuters also reported that the company is seeking a valuation near $1.75 trillion, based on sources familiar with the matter.
The listing has drawn attention because retail investors could receive an unusually large share of the offering. Reports said platforms including Robinhood, Fidelity, and Charles Schwab are expected to give individual investors access.
Reuters reported that demand had already reached about $150 billion, or roughly twice the target size of the offering. Final allocations may still change before pricing.
The report said SpaceX is expected to price the IPO on June 11 and begin trading on Nasdaq under the ticker SPCX on June 12.
Brokerage data remains the missing piece
On-chain data cannot show everything. The report noted that a customer can sell crypto inside a Robinhood or Coinbase account and keep the dollars there without moving coins on a public blockchain.
Due to that blind spot, the crypto-to-SpaceX theory may not be settled until brokerages release their own figures. Robinhood reports monthly trading data, while Coinbase reports retail activity in its quarterly results.
Fund data gave the clearest evidence of crypto selling. Public ETF-flow reports showed spot Bitcoin ETFs lost more than $4.3 billion across a record 13-session outflow streak through June 3.
Ether ETFs also posted a 17-session outflow run before the streak ended. In those products, redemptions require issuers to sell the underlying coins, making ETF exits the clearest confirmed source of selling pressure.

Lamine Yamal Crowned LaLiga Player of the Season at 18 After Stellar Barcelona Campaign

Will Solana price slide to $50 next as whales cut exposure?

Kyle Richards Defends Her Sister Kathy Hilton Amid Backlash

HarrisX Poll Found 52% of Registered Voters Support the CLARITY Act

BloFin War of Whales 2026 Grand Prix opens registration for $5M trading championship

Blockchain.com files with SEC for U.S. IPO

How To Invest In Cryptocurrencies For Beginners | Cryptocurrency Sinhala

Mpokket se kaise loan le 2026 | mpokket loan | m pocket money loan app | mpokket Loan App | Mpokket

Crypto Trading For Beginners Full Course | Learn Trading From Scratch | Trading Course (Day 2/10)
-

 Business5 days ago
Jade Biosciences, Inc. (JBIO) Discusses Positive Interim Results From JADE101 Phase I Healthy Volunteer Study and Development Plans Transcript
-

 Sports4 days ago
French Open 2026 results: Alexander Zverev beats Rafael Jodar and will play Jakub Mensik in semi-finals
-

 Fashion18 hours ago
Weekend Open Thread: Evereve – Corporette.com
-
 Crypto World23 hours ago
Jensen Huang Approves Samsung, SK Hynix, and Micron for NVIDIA (NVDA) HBM4 Memory Supply
-

 Tech4 days ago
CryZENx Releases Fresh Playable Content Deep Inside Jabu-Jabu for His Ocarina of Time Remake
-

 Business7 days ago
Is the Spurs Phenom Already Better Than Prime Diesel?
-

 Business3 days ago
Trump Taps Housing Chief Bill Pulte as Acting Intelligence Director After Gabbard Exit
-
Crypto World1 day ago
LBank Surpasses 25 Million Users Worldwide as AFA Partnership Continues to Drive Global Growth
-
 NewsBeat7 days ago
Everything you need to know as Cambridge’s Strawberry Fair returns after cancelled year
-
 Crypto World4 days ago
Seagate (STX) Stock Surges to Record High on AI Boom and Legal Settlement
-
 NewsBeat4 days ago
Republicans balk at Trump’s attempt to appoint a MAGA enforcer to lead National Intelligence
-
Crypto World3 days ago
EU AI Data Center Project Faces Delays as Funding Gaps Grow
-

 Entertainment3 days ago
Did The Mandalorian And Grogu Already Ruin The Next Star Wars Movie?
-

 Business3 days ago
Aehr Test Systems Stock Soars 17% Amid Surging AI Demand and Conference Spotlight
-

 Business3 days ago
Relay Therapeutics Shares Surge 20% on ASCO Momentum for Zovegalisib Breast Cancer Program
-
Business7 days ago
Algoma Steel gains 63% as Fair Value models spot opportunity
-
 Business4 days ago
Claude AI Down Today Reason: Why Anthropic’s AI is not working today? What’s the latest quota update
-
 Crypto World22 hours ago
Merlin (MRLN) Stock Soars 32% on Major USSOCOM Autonomy Milestone
-

 Tech4 days ago
Instagram will stop bombarding teens with the same kind of obsessively unhealthy content
-

 Tech1 day ago
RCS Messages Between iPhone and Android Get End-to-End Encryption With iOS 26.5
You must be logged in to post a comment Login