
Crypto World
ASTER Price Crash From $2.42 to $0.54 Amid Whale Dumps and Market Control

TLDR:
- Six wallets control 88–96% of ASTER supply, enabling coordinated whale dumps.
- ASTER fell from $2.42 to $0.54 as large holders sold aggressively.
- Post-dump consolidation shows weak bounces, indicating continued bearish dominance.
- Price must reclaim $0.56–$0.58 to prevent further decline toward $0.472–$0.451.
The ASTER price crash has shaken the crypto market, dropping from $2.42 to $0.54. Six wallets control nearly 90% of the supply, executing coordinated whale dumps.
Sharp breakdowns triggered stop-losses, while post-dump consolidation shows weak recovery. Technical indicators, including RSI and MACD, confirm continued bearish dominance.
Price must reclaim $0.56–$0.58 for any potential bullish trend shift.
Market Manipulation and Supply Concentration
ASTER declined almost 78% from $2.42 to $0.54 within four months. Six wallets now control 88–96% of the total supply.
Tweets from @StarPlatinum_ show that these wallets executed coordinated dumps across Binance, Bybit, and Gate. The market reacted sharply.
On October 18, 17.85 million ASTER ($22.88M) were sold, followed by 7.5 million ASTER (~$12M) dumped on October 9. Additional large withdrawals included 4.66 million ASTER and 5.01 million ASTER from Binance.
One wallet moved $114.5 million from Gate. Intraday ASTERUSDT charts show lower highs and lower lows, indicating a clear intraday downtrend.
Sharp breaks below $0.57 triggered stop-losses. Weak bounces stalled around $0.537, now acting as minor resistance.
This suggests early positioning rather than retail panic. Volume Delta (Hyblock) analysis confirms selling pressure with -11.7 million ASTER.
Large traders slightly reduced sell aggression, signaling absorption. The 100k–1M filter indicates big players dumped aggressively during breakdowns.
Post-dump, pressure flattened, showing that the heaviest selling already occurred. Overall, price action reflects controlled markdowns, not random dips. Retail traders were impacted, while smart money dictated the market direction.
Technical Structure and Bearish Trend
ASTER’s 4-hour chart confirms a broader bearish trend. Price remains below the 200 EMA, facing repeated resistance at $0.67–$0.70.
The Bears Supply Zone absorbed liquidity, triggering aggressive sell-offs. Attempts to rally failed above mid-range moving averages, producing lower highs.
The Bulls Demand Zone at $0.56–$0.58 offered brief support but quickly collapsed. Buyers remain weak, showing limited influence in the market.
RSI is near 24, oversold but consistent with strong downtrends. MACD shows a bearish crossover with an expanding red histogram.
Sell volume rose sharply during breakdowns, confirming genuine downward momentum. Relief bounces remain weak, showing post-dump consolidation.
Price must reclaim $0.56–$0.58 to shift the trend. Otherwise, further declines toward $0.472–$0.451 are likely. Consolidation indicates early absorption by smart money.
Post-dump structure suggests bears remain dominant. Any relief rallies should be approached cautiously, as structural weakness persists across multiple timeframes.


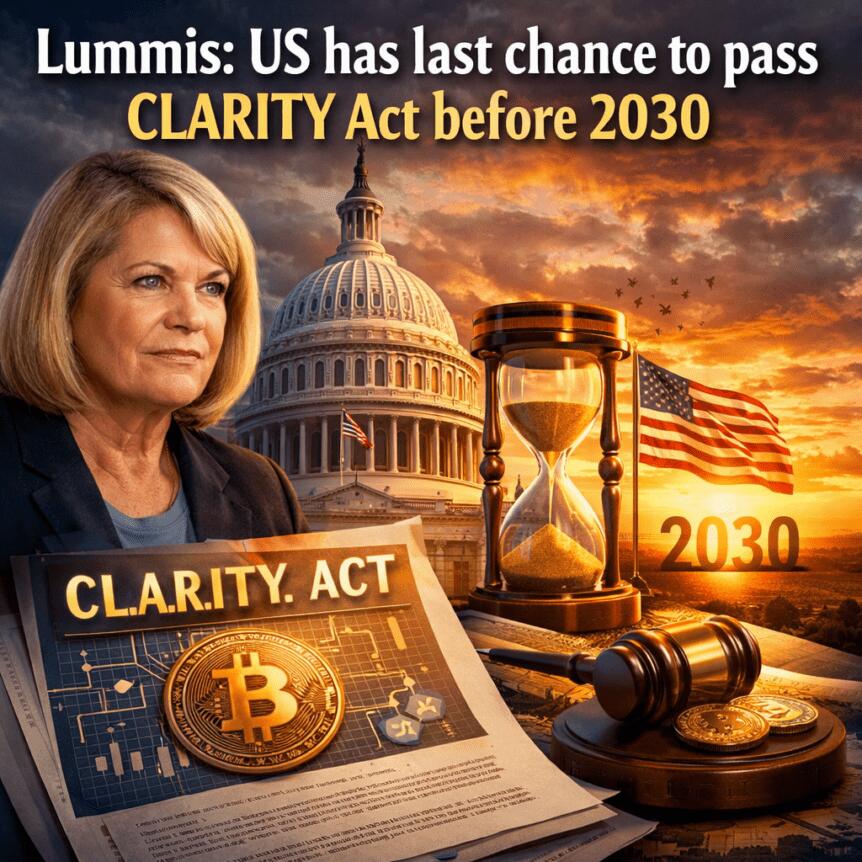
The push to pass the CLARITY Act in the United States is intensifying as lawmakers face a looming deadline to provide clear regulatory oversight for the crypto industry. Senator Cynthia Lummis, among the most vocal crypto advocates in Congress, warned that delay could push meaningful legislation into a distant future, potentially delaying the sector’s growth and investor protections.
In a Friday post on X, Lummis framed the moment as a last chance to enact relief before 2030, arguing that the U.S. cannot surrender its financial future. The comment arrives as momentum for the bill appears fragile amid the upcoming midterm elections in November, which could reshape congressional priorities and slow the momentum around what many see as a foundational market-structure framework for digital assets.
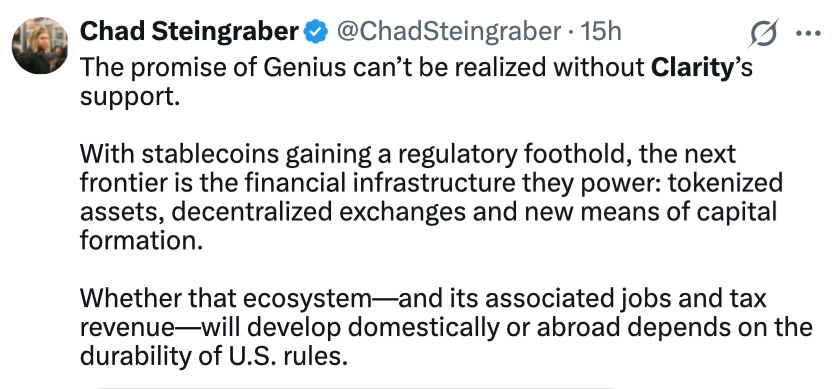
Echoing the urgency, David Sacks, former White House AI and crypto czar, weighed in with a similar sentiment. “The time to act is now. Senate Banking, and then the full Senate, should pass market structure. I’m confident that they will. And then President Trump will sign this landmark bill into law,” Sacks wrote. The chorus from industry insiders underscores a shared view: absence of a clear regulatory path could hobble innovation and investor confidence.
Key takeaways
- Legislative urgency surrounds the CLARITY Act, with proponents arguing that clear regulatory boundaries are essential for advancing the U.S. crypto sector and protecting consumers.
- Timing remains a major question mark due to the November midterm elections, which could shift congressional priorities and slow passage of crypto legislation.
- Support crosses sectors and roles, with influential figures—from venture capital to exchange executives and technology founders—arguing that well-defined rules foster growth and certainty for participants.
- Internal debates on specifics, notably around stablecoin yield, pose potential chokepoints that could affect markup or floor votes in the Senate.
- Regulators themselves have voiced support for a comprehensive market-structure framework, signaling alignment with lawmakers on the direction of regulation.
CLARITY Act as a catalyst for U.S. crypto growth
Industry participants widely view regulatory clarity as a catalyst for innovation. A familiar refrain across crypto circles is that clear rules help both consumers and builders navigate risk, reduce ambiguity, and foster responsible innovation. Chris Dixon, managing partner at A16z Crypto, captured this sentiment in a post, noting that “when rules are defined, both consumers and entrepreneurs win.”
The sentiment extends beyond investment capital to product development and user experience. Robbie Ferguson, co-founder of Immutable, argued that the act could accelerate the sector’s growth trajectory, suggesting that clearer oversight would unlock opportunities for developers and gamers alike. The Web3 gaming ecosystem, in particular, has been a fervent advocate for clarity as a means to scale and protect players and developers in a regulated, trusted environment.
A wave of industry voices has also highlighted how clarity could influence real-world adoption. Coinbase CEO Brian Armstrong called for moving forward with the legislation after months of delays, signaling that the industry wants a path forward that offers predictability and guardrails for participants ranging from exchanges to resourceful startups. Coinbase chief legal officer Paul Grewal also signaled that progress toward a Senate markup hearing could be within reach, though he cautioned that relief hinges on reconciling disputes over stablecoin yield—a friction point that has lingered in negotiations.
On the regulatory front, the push for a comprehensive market-structure framework has drawn support from prominent regulatory figures. SEC Chair Paul Atkins publicly framed the moment as an opportunity for Congress to “future-proof against rogue regulators” and advance a broad framework that could guide the sector through anticipated changes in technology and market dynamics. His comments align with the broader view that congressional action is needed to preempt ad hoc or inconsistent regulatory actions that can unsettle markets and erode investor trust.
Industry alignment and governance questions
The CLARITY Act’s proponents argue that a clear delineation of which regulators oversee various crypto activities would reduce jurisdictional ambiguity and potential regulatory gaps. The broader market has been watching closely for signals about how the U.S. could harmonize oversight between agencies such as the CFTC and the SEC, while also addressing stablecoins as a critical asset class within the crypto ecosystem.
And while there is broad internal agreement on the need for a clear regulatory framework, negotiations are not without friction. Grewal’s remarks underscored a central sticking point: the yield mechanisms of stablecoins. A resolution on this issue appears essential to advancing to a formal markup in the Senate Banking Committee and, ultimately, a vote on the full Senate floor. The absence of consensus on stablecoins could delay movement even as other parts of the bill gain traction.
Regulators themselves have shown support for moving ahead with clear market structure legislation. Atkins’s comments reflect a shared industry sentiment that well-crafted rules would protect consumers, reduce exposure to rogue actors, and create an environment where legitimate crypto projects can flourish with a clear legal footing. This alignment between lawmakers and regulatory leaders could be a pivotal factor in determining whether the CLARITY Act gains the momentum it needs before the election cycle intensifies partisan debates around technology policy.
What this means for investors and builders
For investors, the prospect of a clear regulatory framework could reduce the legal and policy uncertainty that has weighed on asset prices and capital allocation in the crypto space. A well-defined regime may lower compliance risks for exchanges and on-chain platforms, potentially boosting institutional participation and retail confidence alike. For builders, a clarified map of permissible activities, responsible boundaries, and clear licensing expectations could accelerate product development and drive consumer adoption—provided that the final text resolves disputes that currently threaten to stall progress.
Historically, regulatory clarity has correlated with greater market maturity. If the CLARITY Act eventually becomes law, it could set a precedent for how the United States addresses both innovation and risk in digital assets. The timing, however, remains a crucial variable. With midterm elections looming, lawmakers may prioritize other issues, potentially delaying a milestone for the industry. Yet the breadth of support—from venture capital to founders of major crypto projects—signals a broad desire to move beyond debate and toward a functional framework that aligns incentives across the ecosystem.
What remains uncertain is whether the bill can bridge outstanding points of disagreement, particularly around stablecoins, before the Senate’s markup and subsequent floor vote. If those gaps persist, momentum may stall even as other provisions gain traction. Investors should monitor not only the political timetable but also the evolving stance of regulators on the practicalities of stability mechanisms and how they intersect with market structure legislation.
Beyond the U.S., observers note that global regulatory conversations increasingly mirror the desire for clarity and predictability. For markets that operate across borders, a clear U.S. standard could influence international norms, encouraging harmonization or at least mutual recognition of compliant activities. As the CLARITY Act advances, market participants will be watching for concrete milestones—whether a markup date, committee votes, or a White House signing ceremony—that would signal a durable shift toward regulatory certainty.
Readers should watch upcoming statements from lawmakers and industry leaders for clues about the bill’s trajectory, including how negotiators resolve stablecoin yield and other technical details. The next few weeks could prove decisive in determining whether the U.S. crypto sector gains a clear, implementable framework or faces a drawn-out path to regulatory clarity.


A new push for the CLARITY Act is building in Washington as crypto policy supporters warn the timeline may be narrowing.
Summary
- Cynthia Lummis warned Congress may miss its best chance to pass the CLARITY Act soon.
- David Sacks and crypto leaders urged the Senate to move market structure legislation forward now.
- Senate progress may depend on resolving stablecoin yield disagreements before a markup hearing begins.
Senator Cynthia Lummis said Congress must move soon or risk delaying market structure reform for years.
Lummis said the United States may miss a rare opening to pass the CLARITY Act if lawmakers fail to act soon. She said the bill may not get another real chance until at least 2030.
In a post on X, Lummis wrote, “This is our last chance to pass the Clarity Act until at least 2030.” She added, “We can’t afford to surrender America’s financial future.”
The warning comes as crypto policy supporters watch the political calendar. With US midterm elections set for November, some industry figures fear Congress could shift focus and slow work on crypto legislation.
That concern has kept attention on the bill’s timing. Supporters say the next few months may decide whether the measure advances during the current session.
Former White House AI and crypto czar David Sacks also called for quick action. He said the Senate Banking Committee and the full Senate should move the bill forward.
Sacks said, “The time to act is now. Senate Banking, and then the full Senate, should pass market structure.” He added that he expects President Donald Trump to sign the bill if Congress approves it.
Other industry voices have also backed the legislation. A16z Crypto managing partner Chris Dixon said,
“when rules are defined, both consumers and entrepreneurs win.”
Immutable founder Robbie Ferguson also backed the bill. On April 3, he said, “the CLARITY Act will make the last decade of growth in gaming look like a joke.”
Senate progress depends on key issues
Coinbase Chief Executive Brian Armstrong said on Friday that “it’s time” for the bill to pass after months of delays. His comment added to fresh calls for movement in the Senate.
Coinbase Chief Legal Officer Paul Grewal said on April 2 that the CLARITY Act could be nearing a markup hearing in the Senate Banking Committee. He also said disagreements over stablecoin yield still need to be resolved.
Regulators have also shown support. SEC Chairman Paul Atkins said,
“It’s time for Congress to future-proof against rogue regulators & advance comprehensive market structure legislation to President Trump’s desk.”

Kenya is moving closer to formalizing oversight of its digital asset sector after completing public consultations on proposed rules for crypto firms.
On April 11, the National Treasury announced that it had concluded stakeholder submissions on the draft Virtual Asset Service Providers (VASP) regulations. This step advances the framework needed to implement the country’s 2025 law governing crypto-related businesses.
Kenya Drafts Stricter Rules for Crypto Firms
The rules will establish licensing requirements and supervisory standards for companies dealing in cryptocurrencies, tokenized assets, and stablecoins.
The proposed regime outlines entry thresholds for operators, including ownership suitability tests, capital requirements, and governance standards. It also establishes obligations related to risk management and anti-money laundering compliance.
The Kenyan authorities are also seeking to impose stricter consumer safeguards. This would include mandatory disclosures, transparent pricing, and protections for crypto client funds.
The framework introduces market conduct provisions aimed at curbing manipulation and insider activity, while requiring due diligence for asset listings and ongoing monitoring of trading activity. Firms would also be subject to periodic reporting, audits, and cybersecurity standards under a system combining on-site and off-site supervision.
The central bank and capital markets authorities are expected to share oversight of the crypto sector.
Kenya’s push to formalize oversight aligns with a broader global shift among regulators to define sectoral rules while preserving space for innovation.
The Treasury said the next phase will involve reviewing feedback and refining the draft before finalizing the regulations. The outcome is expected to shape how firms enter and operate in one of Africa’s more mature fintech markets.
“Kenya is building a trusted framework that balances innovation with financial stability,” the financial agency stated.
The consultation process comes as digital asset use expands rapidly across Africa. According to Ripple, the continent faces high transaction costs, delays in cross-border transfers, and limited access to stable foreign currencies.
As a result, people on the continent have shown increased reliance on crypto-based tools for settlement and savings.
Due to this, Sub-Saharan Africa has emerged as one of the fastest-growing crypto markets, with transaction volumes rising sharply over the past year.
The post Kenya Moves Closer to Regulating Crypto Firms With VASP Framework appeared first on BeInCrypto.
Crypto World
Trump token sees whale accumulation ahead of Mar-a-Lago gala; senators raise questions over event


Large investors are accumulating the TRUMP memecoin ahead of an upcoming gala hosted by President Donald Trump at Mar-a-Lago on April 28, even as the token trades near record lows and the impending event faces political scrutiny.
Data tracked by blockchain sleuth Lookonchain shows notable whale buying through centralized exchanges. One whale, “8DHkza,” withdrew 850,488 $TRUMP tokens (worth approximately $2.4 million) from Bybit over the past two days. Another address, “7EtuAt,” withdrew 105,754 tokens (around $298,000) from Binance 17 hours ago and currently holds 1.13 million tokens, valued at roughly $3.2 million.
Outflows from exchanges are said to represent investor intention to take direct custody of coins and hold the same for long-term. Hence, outflows are taken to indicate accumulation and potentially reduce immediate sell-side liquidity in the market.
The accumulation comes ahead of an invitation-only luncheon reportedly limited to the top 297 TRUMP token holders, with the top 29 receiving exclusive VIP access to Donald Trump.
However, TRUMP continues to trade at record lows near $2.80, down 0.2% on a 24-hour basis and over 1% in seven days. The token came under pressure this week after CoinDesk reported the Trump-linked crypto venture World Liberty Financial’s controversial lending strategy on the Dolomite DeFi platform.
Meanwhile, U.S. lawmakers have stepped up scrutiny of the Mar-a-Lago event. Senators Elizabeth Warren, Adam Schiff, and Richard Blumenthal have sent a letter to Fight Fight Fight LLC, a Delaware-based entity run by Trump associate Bill Zanker, requesting documents and information on whether Trump played a role in planning, promoting, or financially benefiting from the gathering. Fight Fight Fight LLC TRUMP memecoin in partnership with entities affiliated with Donald Trump.
“It is essential that Congress fully understand the extent to which President Trump and his family are profiting off of his cryptocurrency ventures,” the senators said, adding that “Congress must also take steps to prohibit and prevent these egregious conflicts of interest.”
The probe introduces an additional layer of uncertainty for the token, as regulatory and political risks intersect with already weak price action.
The United States government must pass the CLARITY Act, which aims to provide the crypto industry with clearer regulatory oversight, soon, or risk waiting almost another four years to move the industry forward, according to US Senator Cynthia Lummis.
“This is our last chance to pass the Clarity Act until at least 2030,” Lummis, a well-known crypto advocate, said in an X post on Friday.
“We can’t afford to surrender America’s financial future,” she added. The comments come as crypto industry participants begin to worry that the bill’s chances of passing this year are narrowing, with US midterm elections in November potentially changing congressional priorities and slowing momentum on the highly anticipated crypto legislation.
The former White House AI and crypto czar, David Sacks, also chimed in on Thursday with a similar view to Lummis.
“The time to act is now. Senate Banking, and then the full Senate, should pass market structure. I’m confident that they will. And then President Trump will sign this landmark bill into law,” Sacks said.
Consumers and entrepreneurs both “win” from the CLARITY Act
Many industry participants have argued that the passage of legislation aimed at clarifying which regulators oversee parts of the crypto industry could lead to greater innovation in the US and potentially increase demand for crypto assets among retail investors.

A16z Crypto managing partner Chris Dixon reiterated that view in a post, saying that “when rules are defined, both consumers and entrepreneurs win.”
A wide range of sectors in the crypto industry expect the move to be positive.
Web3 gaming giant Immutable founder Robbie Ferguson said just days before, on April 3, that “the CLARITY Act will make the last decade of growth in gaming look like a joke.”
On Friday, Coinbase CEO Brian Armstrong, who withdrew the crypto exchange’s support for the Digital Asset Market Clarity Act in January, said “it’s time” for the legislation to pass after months of delays.
Meanwhile, Coinbase chief legal officer Paul Grewal said on April 2 that the CLARITY Act could be nearing a markup hearing in the US Senate Banking Committee. However, he noted that progress hinges on resolving disagreements over stablecoin yield.
Related: CFTC unveils innovation task force members in crypto clarity push
Regulators are also voicing their support for the legislation.
US Securities and Exchange Commission (SEC) Chairman Paul Atkins said in a post on the same day that, “It’s time for Congress to future-proof against rogue regulators & advance comprehensive market structure legislation to President Trump’s desk.”
Magazine: Bitcoin quantum-safe without upgrade? CZ’s 2031 crypto vision: Hodler’s Digest, April 5 – 11

US spot Bitcoin exchange-traded funds (ETFs) posted their strongest weekly inflow since February last week, drawing more than $786 million.
Data from SoSoValue showed that the US-listed funds’ performance last week narrowly trailed the roughly $787.31 million recorded during the last week of February.
BlackRock and Morgan Stanley’s New MSBT Fund Drive Interest
The inflows followed a softer stretch for the products amid broader market volatility and geopolitical tension, which weighed on risk appetite.
SoSoValue data shows that the flow pattern was uneven through the week. The funds opened with a sharp $471.32 million intake on Monday, then slipped into outflows midweek before recovering on Thursday and Friday.
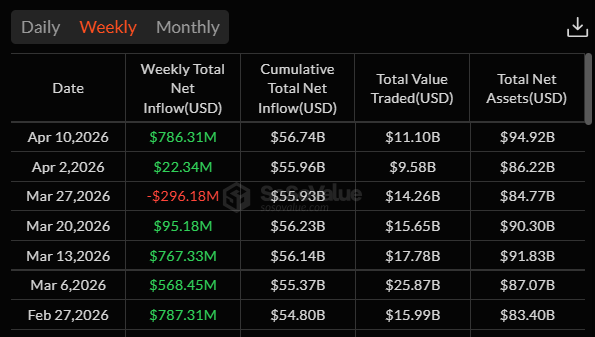
The turnaround left the group with its best weekly result in nearly two months and suggested buyers returned as Bitcoin regained momentum.
BlackRock’s iShares Bitcoin Trust remained the main driver of demand. The fund brought in about $612 million during the week, accounting for almost four-fifths of total net inflows across the category.
The concentration underscored how heavily new institutional allocations continue to favor the largest and most liquid product in the market.
Meanwhile, Morgan Stanley’s newly launched MSBT fund added another point of interest for the market. The fund raised roughly $46 million over its first three trading days, giving investors a fresh entry point as demand across the ETF group picked up again.
Its early flows were modest compared with BlackRock’s scale, but the launch carries broader significance because of Morgan Stanley’s distribution reach. The bank’s network of roughly 16,000 financial advisers oversees trillions of dollars in client assets, giving it access to a channel few Bitcoin ETF issuers can match.
The improvement in fund flows came alongside a strong week for the underlying asset. Bitcoin climbed from around $67,000 to above $70,000 during the period and was trading near $73,411 by the end of the week, a gain of about 9%.
The move marked one of the token’s strongest weekly advances in recent months and helped restore momentum after a period of weaker price action.
The post US Bitcoin ETFs Log Biggest Weekly Inflow Since February appeared first on BeInCrypto.
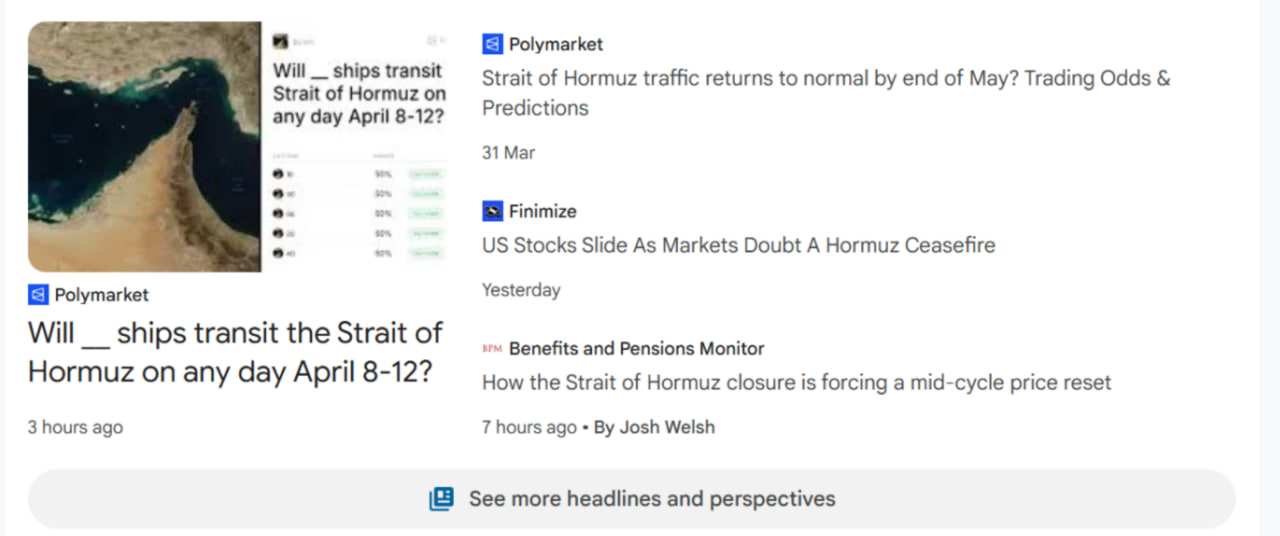
Polymarket betting markets reportedly appeared inside Google News results alongside established news publishers before disappearing.
A Google spokesperson told The Verge that the platform’s appearance in News was an error. “This site briefly appeared in Google News in error, and it is no longer surfacing in News,” spokesperson Ned Adriance reportedly said.
Before removal, Polymarket links were shown directly beneath mainstream outlets when users searched event-driven queries. In one example cited by Futurism, a search for “will ships transit the strait” related to the Strait of Hormuz returned a Polymarket market predicting outcomes on vessel passage alongside reporting from Reuters and The Guardian.

In a Sunday search conducted by Cointelegraph, the same query did not surface any Polymarket results.
Related: Three Polymarket traders made timely bets on US-Iran ceasefire
Polymarket and Kalshi pursue media partnerships
Last year, Google partnered with both Polymarket and rival Kalshi to integrate their data into Google Finance.
In June, Elon Musk’s X also announced a partnership with Polymarket, naming it as its official prediction market partner. The deal aimed to integrate the betting-based forecasting service into the social media platform.
Furthermore, in October, MetaMask said it would integrate Polymarket as part of its push to expand beyond a crypto wallet into a broader “democratized finance” gateway. The same month, World App, the digital wallet and identity platform from Sam Altman’s World project, also added the Polymarket app.
Related: Prediction market users await Artemis II mission splashdown
Small portion of Polymarket traders make a profit
As Cointelegraph reported, only a tiny fraction of Polymarket traders manage to generate consistent high monthly income, according to new data shared by crypto analyst Andrey Sergeenkov. While around 1% of traders have crossed $5,000 in profits in a single month, only 0.015% were able to sustain that level for four consecutive months.
The findings also show that just 0.033% of wallets have exceeded $100,000 in total profits, with some of these likely belonging to professional traders rather than retail users. Despite growing hype around prediction markets as a fast-rising crypto use case, the data suggests most participants struggle to maintain consistent profitability over time.
Magazine: Bitcoin’s ‘biggest bull catalyst’ would be Saylor’s liquidation — Santiment founder


Crypto exchange activity slowed in the first quarter of 2026 after the market cooled from its earlier peak.
Summary
- Crypto exchange trading volume fell sharply in Q1 2026 as market participation weakened after the cycle peak.
- Perpetual futures dominated March activity, with volume reaching four times the level of spot trading.
- Binance held the top position in spot and derivatives despite rising competition from secondary exchanges.
CryptoQuant data showed lower participation across centralized venues, while Binance kept the lead in both spot and derivatives trading.
Centralized exchange trading volume dropped about 48% from the October 2025 peak. The figure fell to $4.3 trillion in March 2026, its lowest level since October 2024.
The pullback showed lower participation from traders and investors after the earlier market run. Activity narrowed toward the biggest exchanges, as users favored liquid venues during periods of price movement.
Perpetual futures remained the main source of trading activity during the quarter. Perpetual volume rose to $3.5 trillion in March, while spot volume stood at $0.8 trillion.
That gap showed how strongly derivatives shaped market structure in Q1. Perpetual volume reached four times spot volume in March, and cumulative perpetual trading hit $4.5 trillion this year.
The rise in derivatives activity also picked up during the relief rally in the third week of March. Binance recorded the largest 24-hour open interest increase for both Bitcoin and Ethereum by mid-March.
Bitcoin open interest on Binance rose by $829 million in 24 hours, while Ethereum open interest increased by $1.6 billion. Across exchanges, Bitcoin and Ethereum perpetual futures open interest climbed to $23 billion and $16 billion.
Binance keeps lead in derivatives trading
Binance led the perpetual futures market with a 40% share and $1.4 trillion in monthly volume. OKX followed with 19%, while Bybit held 13%.
The data showed that most open interest growth flowed to Binance during the March rebound. Other exchanges, including Gate and Bybit, also posted gains, but none matched Binance’s scale.
Binance remained the largest spot trading venue in March. The exchange recorded $248 billion in spot volume and controlled 32% of the market.
That share was down from 37% in October 2025, but Binance still held a lead well ahead of rivals. MEXC and Bybit followed with 9% and 7%, while Gate and Crypto.com posted growth without changing the broader market order.


North Korea’s six-month infiltration campaign at Drift rattled a crypto industry already reeling from billion-dollar exploits.
But as the news settled, a bigger question came into focus: why does North Korea keep coming back to crypto in the first place, and why does its approach look so different from every other state-backed hacking operation on the planet?
The short answer, according to security experts, is that crypto helps give the regime a revenue stream and keep them afloat.
“North Korea doesn’t have the luxury of patience,” said Dave Schwed, chief operating officer at SVRN and the founder of the cybersecurity masters program at Yeshiva University. “They’re under comprehensive international sanctions and they need hard currency to fund weapons programs. The UN and multiple intelligence agencies have confirmed that crypto theft is a primary funding mechanism for their nuclear and ballistic missile development.”
That urgency explains a dynamic that has long puzzled investigators: why North Korean hackers carry out large-scale, traceable heists on public blockchains instead of quietly using crypto to evade sanctions the way other state actors do.
The answer, Schwed argues, is structural. Russia still has an economy: oil, gas, commodity exports, and trading partners willing to use workarounds. It needs crypto as a payment rail, but not for much else. Iran, too, has goods to move — sanctioned oil, proxy financing networks, willing intermediaries across the Middle East. North Korea has almost nothing left to sell.
“Their exports are almost entirely sanctioned. They don’t have a functioning economy that needs a payment rail. They need direct revenue,” Schwed said. “Crypto theft gives them immediate access to liquid value, globally, without needing a counterparty willing to do business with them.”
That distinction — crypto as infrastructure versus crypto as a target — is what separates North Korea not just from Russia, but from Iran as well. While Russia routes money through crypto to work around sanctions, and Iran uses it to fund proxy networks across the Middle East, North Korea is running something closer to a state-sponsored heist operation.
“Their targets are exchanges, wallet providers, DeFi protocols and the individual engineers and founders who have signing authority or infrastructure access,” said Alexander Urbelis, chief information security officer at ENS Labs and a professor of cybersecurity at King’s College London. “The victim is whoever holds the keys or access to the infrastructure that holds the keys.”
Russia and Iran, by comparison, treat crypto as incidental, a means to broader geopolitical ends.
“Russia targets elections, energy infrastructure and government systems. Iran goes after dissidents and regional adversaries,” Urbelis said. “When either of them touches crypto, it’s to move money, not to steal it from the ecosystem.”
That singular focus has pushed North Korean operatives to adopt tactics more commonly associated with intelligence agencies than criminal hackers: months-long relationship building, fabricated identities and supply chain infiltration.
The Drift campaign is only the most recent example.
“You’re not defending against a phishing email from a random scammer,” Urbelis said. “You’re defending against someone who spent six months building a relationship specifically to compromise one person who has the access you need to protect.”
Crypto’s own architecture makes it a uniquely attractive hunting ground. In traditional finance, even successful hacks run into friction in the form of compliance checks, correspondent bank checks, settlement delays and the possibility of reversing fraudulent transfers. When North Korea’s hackers pulled off the Bangladesh Bank robbery in 2016, the heist took days to process and most of the funds were eventually recovered or blocked. In crypto, none of those safeguards exist at the protocol level.
“Once a transaction is signed and confirmed, it’s final,” Urbelis said. The Bybit exploit earlier last year moved $1.5 billion in roughly 30 minutes, a pace and scale that would be nearly impossible in the traditional banking system.
That finality fundamentally changes the security calculus. In banking, a reasonable defense can be built across prevention, detection and response, because there’s always a window to freeze funds or reverse a wire. In crypto, that window barely exists, which means stopping an attack before it happens isn’t just preferable — it’s essentially the only option.
And while banks operate under decades of regulatory guidance and audit requirements, many crypto projects are still improvising — often prioritizing speed and innovation over governance and controls.
That gap creates an environment where even sophisticated teams can be vulnerable, particularly to the kind of long-term infiltration tactics North Korea has been refining.
“This is the hardest operational security problem in crypto right now,” Urbelis said of the challenge of vetting against sophisticated fake identities and third-party intermediaries. “I don’t think the industry has solved it.”
Read more: How North Korea’s 6-month long secret espionage program has crypto community rethinking security


Donald Trump is facing fresh scrutiny as crypto tokens tied to his name and family trade near record lows.
Summary
- TRUMP fell about 90% from its peak as renewed scrutiny hit Trump-linked crypto projects again this week.
- WLFI dropped to a fresh all-time low as criticism of Trump family crypto ties intensified.
- Senators pressed Bill Zanker for details after Trump announced an April 25 gala for token holders.
The pressure has grown after a new gala for token holders raised new questions from Democratic lawmakers.
The Official Trump token, known as TRUMP, fell to an all-time low of about $2.73 in March 2026. It later traded near $2.86, according to CoinGecko data.
The token has dropped about 90% from its January 2025 peak above $73. The decline has kept attention on Trump-backed crypto ventures as traders track whether the project can regain momentum.
World Liberty Financial’s governance token, WLFI, also fell sharply. The token dropped to about $0.07 on Saturday, marking a new all-time low.
WLFI is down nearly 75% from its September 2025 high of about $0.31. The slide has added to pressure on projects linked to Trump and his family.
Criticism grows around Trump crypto ventures
The price declines drew criticism from market observers and legal scholars. Professor Tonya Evans responded to the sell-off with a sharp rebuke of Trump’s role in crypto.
“We thought Sam Bankman-Fried or Gary Gensler were the worst things to happen to the crypto industry, and they were horrible,” Evans said.
She added that “turns out, it was the guy who surrounds himself with sycophants, siphons every bit of value he can for himself, and then expeditiously bankrupts companies and casinos without consequence.”
Her comments came as debate over Trump’s crypto activity returned to the center of public discussion. Critics have focused on whether token-linked events create a financial path to political access.
April gala draws Senate attention
President Trump recently announced another gala for token holders, scheduled for April 25. The event has drawn criticism from Democratic senators who said the plan raises questions about access and fundraising.
Senators Elizabeth Warren, Richard Blumenthal and Adam Schiff sent a letter to Bill Zanker, the memecoin’s creator, seeking details about the event, according to Politico. They said organizers were “dangling access” to Trump while requiring attendees to hold TRUMP tokens, a structure they said could benefit Trump and his family through increased token demand.
Disclosure: This article does not represent investment advice. The content and materials featured on this page are for educational purposes only.

Iconic Indian singer Asha Bhosle dies in Mumbai

US has last chance to pass CLARITY Act before 2030
CBS’ 3-Part Thriller Series Is the Perfect Weekend Binge

Why Israel is blocking foreign journalists from entering

Bitcoin: We’re Entering The Most Dangerous Phase

Alan Cumming Brands Baftas Ceremony A ‘Triggering S**tshow’

Achieving financial freedom isn’t permission to abandon your purpose on earth. #worldwide

Moneyview Personal Loan App | How To Apply Money View Loan | Moneyview Personal Loan Telugu 2026

How Small Actions Change Financial Struggles | A Simple Economics Story
-

 Business6 days ago
Three Gulf funds agree to back Paramount’s $81 billion takeover of Warner, WSJ reports
-

 Politics2 days ago
US brings back mandatory military draft registration
-

 Fashion2 days ago
Weekend Open Thread: Veronica Beard
-

 Tech5 days ago
How Long Can You Drive With Expired Registration? What Florida Law Says
-

 Fashion6 days ago
Massimo Dutti Offers Inspiration for Your Summer Mood Board
-
 Sports2 days ago
Man United discover Nico Schlotterbeck transfer fee as defender reaches Dortmund agreement
-

 Fashion5 days ago
Let’s Discuss: DEI in 2026
-

 Crypto World3 days ago
Canary Capital Files SEC Registration for PEPE ETF
-

 Business2 days ago
Tesla Model Y Tops China Auto Sales in March 2026 With 39,827 Registrations, Beating Cheaper EVs and Gas Cars
-

 Crypto World4 days ago
Bitcoin recovers as US and Iran Agree a Ceasefire Deal
-

 Politics2 days ago
Malcolm In The Middle OG Turned Down ‘Buckets Of Money’ To Appear In Reboot
-

 Business2 days ago
OpenAI Halts Stargate UK Data Centre Project Over Energy Costs and Copyright Row
-

 Business19 hours ago
Ireland Fuel Protests Enter Day 5 as Blockades Spark Shortages and Government Prepares Support Package
-

 Tech6 days ago
Italian court says Netflix must refund customers up to $576 over price hikes
-

 Tech6 days ago
Gamer Restores the Original PlayStation Portal From Two Decades Ago
-

 Tech6 days ago
Samsung just gave up on its own Messages app
-

 Tech6 days ago
Haier is betting big that your next TV purchase will be one of these
-

 Tech6 days ago
The Xiaomi 17 Ultra has some impressive add-ons that make snapping photos really fun
-

 Politics2 days ago
LBC Presenter Mocks Trump Over Iran War Failures
-

 Tech6 days ago
Save $130 on the Samsung Galaxy Watch 8 Classic: rotating bezel, sleep coaching, and running coach for $369
You must be logged in to post a comment Login