
Crypto World
Bitcoin Breaks $80K Barrier: Will Altcoins Follow?
Key points:
- Bitcoin’s rally through $79,500 opens the door to a move toward $84,000.
- Ether, Dogecoin and Hyperliquid are showing strength, but the other major altcoins are yet to pick up momentum.
Bitcoin (BTC) opened the new week with a rally above $80,500, suggesting the bulls are attempting to take charge. Analysts are closely watching the $80,000 level, as some believe a failure to close above it could trigger a move toward $60,000.
However, crypto analyst Matthew Hyland said in a post on X that traders calling BTC’s fall to $60,000 and lower ‘will be the ones flipping bullish late above $90K.”
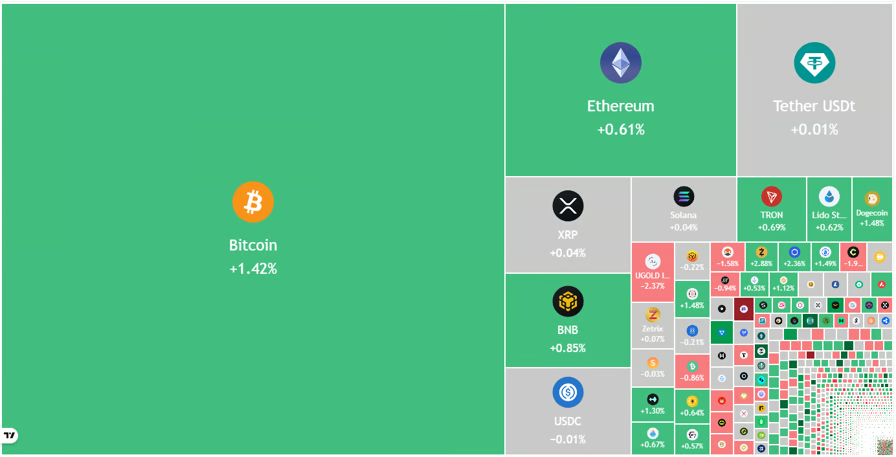
BTC’s 30-day liquidation map shows that a rally above $84,000 would trigger $2.85 billion worth of short liquidations across all exchanges.

Crypto market data daily view. Source: TradingView
A positive sign for the bulls is that BTC’s rise continues to be supported by institutional investors. Capriole Investments founder Charles Edwards said in a post on X that institutions have been “slurping up 500%+ of Bitcoin’s daily mined supply.” Such instances in the past have boosted prices by more than 24% in the following month. If history repeats, BTC may surge to around $96,000.
Could BTC and the major altcoins sustain the breakout? Let’s analyze the charts of the top 10 cryptocurrencies to find out.
S&P 500 Index price prediction
The S&P 500 Index (SPX) remains in a strong uptrend, rising to a new all-time high of 7,272 on Friday.

SPX daily chart. Source: Cointelegraph/TradingView
The upsloping 20-day exponential moving average (7,043) indicates an advantage to buyers, but the relative strength index (RSI) near the overbought zone signals that a minor consolidation or correction is possible in the near term.
The 7,000 level is the crucial support to watch out for on the downside. A solid bounce off the 7,000 level suggests that the bulls have flipped it into support. That improves the prospects of a rally to 7,500.
On the contrary, a close below the 7,000 support may sink the index to the 50-day simple moving average (6,827).
US Dollar Index price prediction
The US Dollar Index (DXY) has been stuck between the 50-day SMA (98.97) and the 97.74 support.

DXY daily chart. Source: Cointelegraph/TradingView
The downsloping 20-day EMA (98.61) and the RSI in the negative territory indicate that the bears are at a slight advantage. If the price breaks below the 97.74 support, the index may tumble toward the 96.21 level.
Conversely, a close above the 50-day SMA suggests that the bulls are on a comeback. The index may rally to the 100.54 resistance level, where buyers are expected to encounter solid selling pressure from bears.
Bitcoin price prediction
BTC has broken above the $79,500 resistance, signaling the resumption of the uptrend toward $84,000.

BTC/USDT daily chart. Source: Cointelegraph/TradingView
The uptrend is expected to face solid selling pressure at $84,000, but if the bulls prevent the BTC price from dipping below the 20-day EMA ($76,634), the possibility of a breakout increases. If the $84,000 level is broken, the BTC/USDT pair may surge toward the pattern target of $92,000.
Time is running out for the bears. They will have to swiftly yank the price below $76,000 to weaken bullish momentum. The pair may then tumble to the 50-day SMA ($72,798).
Ether price prediction
Ether (ETH) rose above the 20-day EMA ($2,298) on Friday and is marching toward the $2,465 overhead resistance.

ETH/USDT daily chart. Source: Cointelegraph/TradingView
Sellers will attempt to stall the rally at the $2,465 level, but if the bulls prevail, the ETH/USDT pair may jump to the resistance line. If the ETH price turns down sharply from the resistance line and breaks below the 20-day EMA, it suggests the pair may remain within the channel for some time.
On the other hand, a break and close above the resistance line signals that the bulls are back in control. The pair may then surge toward the $3,050 level.
XRP price prediction
Buyers have pushed XRP (XRP) above the moving averages, opening the door to a rally toward the downtrend line.

XRP/USDT daily chart. Source: Cointelegraph/TradingView
The flattish moving averages and the RSI just above the midpoint do not give either bulls or bears a clear advantage. Buyers will gain the upper hand on a close above the $1.61 level. The XRP/USDT pair may then rally to $2, then to $2.40.
Contrary to this assumption, if the XRP price turns down from the $1.61 level, it would suggest that bears are active at higher levels. That may extend the pair’s stay inside the $1.27 to $1.61 range for a while.
BNB price prediction
BNB (BNB) has been trading near its moving averages over the past few days, indicating indecision between bulls and bears.

BNB/USDT daily chart. Source: Cointelegraph/TradingView
The flattish moving averages and the RSI just above the midpoint suggest that the BNB/USDT pair may remain inside the $570 to $687 range for a few more days.
The next trending move is expected to begin on a close above $687 or below $570. If bulls push the BNB price above the $687 resistance, the pair is expected to gain momentum and surge to $790. Alternatively, a close below $570 signals the resumption of the downtrend toward $500.
Solana price prediction
Solana (SOL) is attempting to rise above the moving averages, indicating demand at lower levels.

SOL/USDT daily chart. Source: Cointelegraph/TradingView
A close above the moving averages may push the SOL price to the $90.73 resistance. Sellers will attempt to defend the $90.73 level, but if the bulls prevail, the SOL/USDT pair may surge to $98.
On the downside, the bears will need to push the price below $82.65 to gain the upper hand. If they do that, the pair may descend to the solid support at $76. The next trending move is expected to begin on a close above $98 or below $76.
Related: BTC price can ‘easily’ hit $95K: Five things to know in Bitcoin this week
Dogecoin price prediction
Dogecoin (DOGE) has broken above the $0.11 resistance level, clearing the path for a rally toward $0.12.

DOGE/USDT daily chart. Source: Cointelegraph/TradingView
The 20-day EMA ($0.10) has started to turn up, and the RSI is in the overbought zone, indicating that the buyers have the edge. Sellers are expected to mount a strong defense at the $0.12 level, but if buyers bulldoze through, the rally may reach $0.14 and eventually $0.16.
Instead, if the DOGE price turns down sharply from $0.12 and breaks below the moving averages, it suggests that the bears remain sellers on rallies. That may keep the DOGE/USDT pair within the $0.09-$0.12 range for a few more days.
Hyperliquid price prediction
Hyperliquid (HYPE) is maintaining above the 20-day EMA ($41.04), but the long wick on the candlestick shows selling at higher levels.

HYPE/USDT daily chart. Source: Cointelegraph/TradingView
The uptrend is expected to face selling pressure in the $43.76 to $45.77 resistance zone. If the HYPE price turns down from the current level or the overhead zone and breaks below the 50-day SMA ($40.11), the advantage will tilt toward the bears. The HYPE/USDT pair may then tumble to $38.70.
Contrarily, a break and close above the overhead zone signals the resumption of the uptrend. The pair may surge to $50 and then to $51.43.
Cardano price prediction
Cardano (ADA) has risen above the downtrend line, but the bulls are facing stiff resistance at the 50-day SMA ($0.25).

ADA/USDT daily chart. Source: Cointelegraph/TradingView
The RSI has risen just above the midpoint, signaling a slight advantage to the bulls. If buyers push the price above the 50-day SMA, the ADA/USDT pair may rally to $0.29, then to $0.31. Sellers are again expected to pose a strong challenge at the $0.31 level, as a close above it suggests that the pair may have bottomed out in the short term.
The $0.22 level is the critical support to watch out for on the downside. If the ADA price turns down and breaks below the $0.22 support level, it signals a resumption of the downtrend.

Bitcoin (BTC) reached a new three-month high of $80,500 on Monday, testing the level for the first time since Jan. 31. The rally above $80,000 puts the price just below short-term holders’ cost basis of $81,486, the next dynamic resistance level. For the rally to continue, a daily close above this level is key to securing $80,000 as support.
A rally to $81,500 may lock in the trend
Bitcoin’s rally to $80,000 places the price directly under the short-term holder’s realized price of $81,486. This metric reflects the average cost of coins moved over the last 155 days and indicates where recent buyers have flipped from loss to profit.
A daily close above $81,500 would return these holders to profit and reduce sell-side pressure. According to crypto analyst Crazyyblockk, the short-term holder losses have narrowed to about -2.17%, showing that the overhead supply band is thinning. The long-term holders (LTHs) hold near +27% profit and are not distributing aggressively.

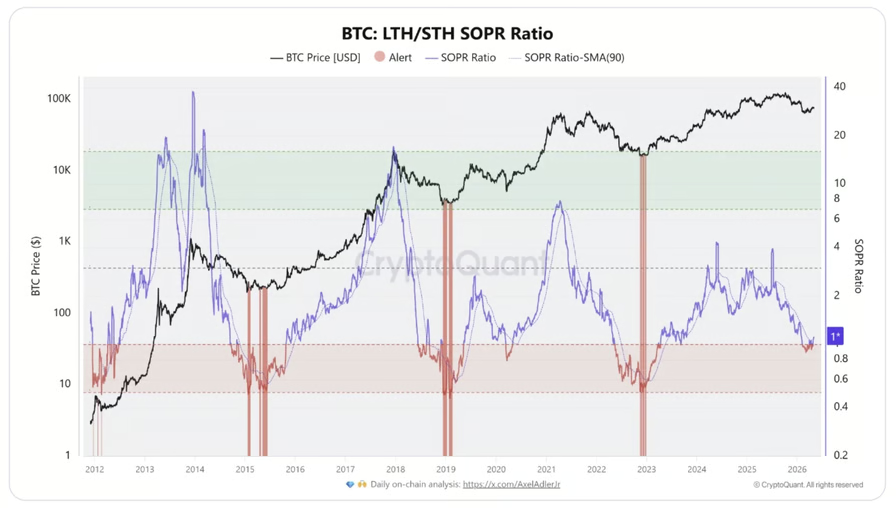
Bitcoin LTH/STH SOPR ratio. Source: CryptoQuant
The spent-output profit ratio (SOPR), which tracks whether coins are spent at a profit or a loss, has climbed to 1.097 from 0.99. This indicates the coins are being spent in profit again, led by long-term holders.
The exchange inflow data aligns with that shift. Around 97.2% of recent deposits came from short-term holders, with wallets holding 1 to 1,000 BTC contributing roughly 58%.
BTC inflows peaked at 35,649 BTC on April 24 and dropped to 3,895 BTC by May 3. That compression reduces immediate sell pressure and supports the case for holding at $80,000 once the cost basis flips.
Related: Bitcoin in ‘disbelief rally’ as traders spot $84K BTC price target
BTC exchange supply builds below $80,000
BTC exchange flow data tracked by Bitcoin researcher Axel Adler Jr shows 8,512 BTC in net inflows over recent days, with spikes on April 27 and April 30. The price absorbed that supply without a sharp downside, signaling an active BTC demand.

Bitcoin exchange netflows for all exchanges. Source: CryptoQuant
The BTC flows have since cooled to near-neutral at 269 BTC between May 1 and May 3. The short-term averages stay positive, while the longer-term averages sit near zero, keeping the move contained to a short impulse.
BTC exchange reserves increased by 5,773 BTC week over week to 2,685,541 BTC, before easing slightly after April 30. Adler Jr explained that the coins are currently sitting on exchanges without aggressive selling, forming a supply overhang that could turn into pressure if demand slows.
Meanwhile, crypto trader Ardi highlighted that BTC is retesting breakout liquidity near $79,600. The trader said that holding this level keeps the move intact toward the next supply zone near $84,000.

BTC/USDT analysis by Ardi. Source: X
A breakdown below $80,000 shifts focus to the new-money cost basis near $76,500 and increases the likelihood of a failed breakout setup.
Related: BTC price can ‘easily’ hit $95K: Five things to know in Bitcoin this week
XRP price action has flatlined near $1.40 as Bollinger Bands on both the weekly and daily charts compress to their tightest readings in years, setting the conditions for an outsized directional move.
The Bollinger Band Width Percentile has fallen into extreme blue territory across multiple timeframes, and on-chain activity from large holders has cooled in step. Together, these signals point to a coiled market waiting for a catalyst.
Volatility Compression Reaches Multi-Year Extremes
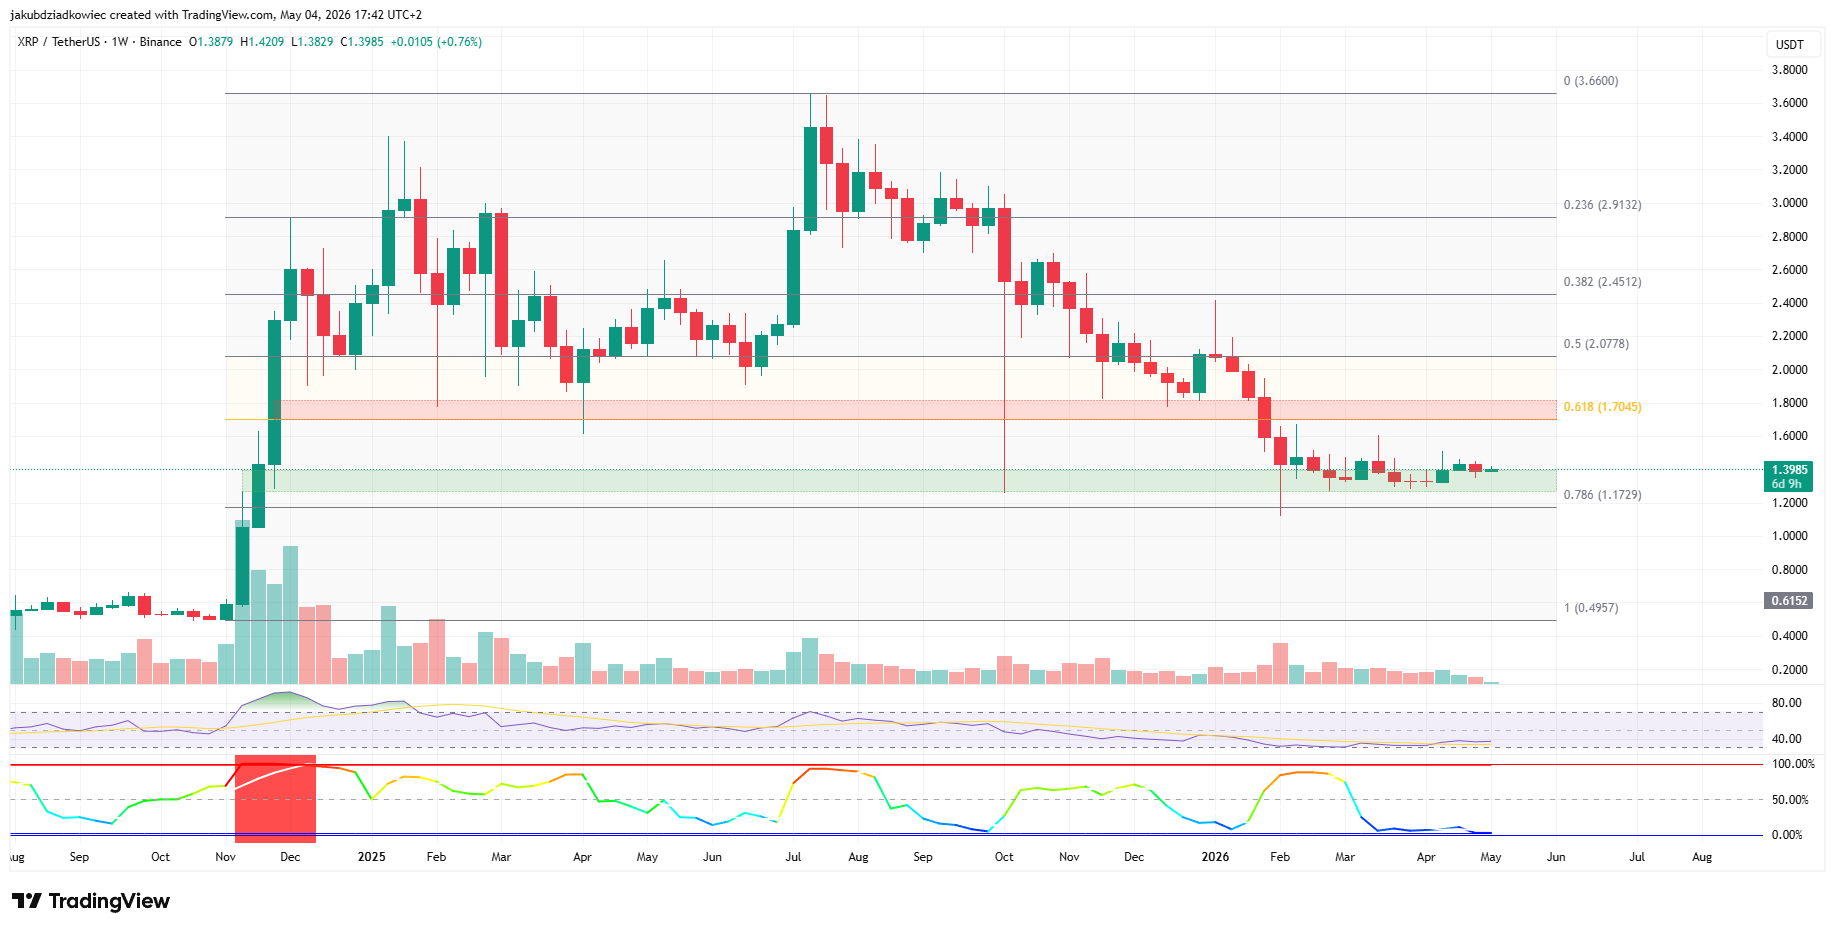
On the weekly chart, XRP trades at $1.3985 just above the 0.786 Fibonacci retracement zone near $1.1729, while the BBWP reading sits at the very bottom of its range.
That places weekly volatility at its lowest level since the late 2024 expansion phase.

The daily timeframe tells the same story. The BBWP has flashed extreme blue three times in recent weeks, with the most recent reading from late April still pinned to the indicator’s floor.
The Relative Strength Index hovers near 40, reinforcing the absence of momentum in either direction.

A move on the BBWP back above 50 would signal that volatility is expanding. Until then, the squeeze remains the dominant technical feature on both timeframes.
On-Chain Activity Confirms the Calm
While the chart shows compression, on-chain data confirms why. Santiment data shows the whale transaction count for transfers above $100,000 has dropped to 117, well below the 700-900 peaks seen during the January and early February swings.
Exchange inflows tell the same story. The metric currently stands at roughly 2.19 million XRP per day, near the lowest level in the past six months. Large holders are not moving size onto exchanges, and retail flows have thinned out alongside.

This combination historically precedes volatility expansion rather than continued drift. When whale activity and exchange flows reset to local lows, the market typically runs out of fuel to sustain the existing range.
XRP Price Prediction Hinges on Triangle Apex Near $1.40
The daily price chart shows XRP grinding inside a contracting symmetrical triangle. The descending resistance line tracks down from the mid-February high near $1.65 toward $1.45, while the ascending support line rises from the early February low near $1.20 toward $1.30. The apex sits within days of completion.
An independent analyst @seth_fin highlighted the same setup, noting that the current Bollinger Band squeeze on Ripple is the tightest in years.
The Visible Range Volume Profile on his chart shows the heaviest volume node clustered between $1.35 and $1.42, identifying that band as the immediate battleground.

A breakout above the descending trendline near $1.45 opens the path toward $1.4697 and the 0.618 weekly Fibonacci resistance at $1.7045. A breakdown through $1.3563 exposes the $1.1427 to $1.1729 region, which aligns with the weekly 0.786 Fibonacci support.
The catalyst remains open. Spot Bitcoin and Ethereum exchange-traded fund flows, fresh news on the Ripple legal file, or a broad macro shift could each force the squeeze to release. Either way, the apex is closing fast, and the next candle of size should set the direction.
The post XRP Calm Before the Storm? Bollinger Squeeze Signals Big Move appeared first on BeInCrypto.


Pi Network co-founder Dr. Chengdiao Fan is set to speak at Consensus 2026 in Miami on May 6, delivering a session titled “Aligning Web3, AI, and Blockchain for Utility” at the Convergence Stage, six days before Protocol 23 brings full smart contracts to the Pi blockchain on May 11.
Summary
- Fan’s session argues that verified human identity is the competitive advantage that AI cannot replicate, directly connecting Pi’s 18 million verified users to the AI era’s core governance problem.
- Pi Network has completed over 526 million human KYC validation tasks and runs 421,000 active Mainnet nodes entering Consensus week.
- Protocol 23, Pi’s most significant upgrade, launches May 11, introducing full smart contract functionality and transforming Pi into a programmable blockchain.
Pi Network’s official X account confirmed that Dr. Fan will speak May 6 from 11:15 to 11:35 AM EDT at the Convergence Stage. Her presentation argues that as AI lowers the barriers to building products, competition increasingly centres on authentic human data, verified user acquisition, and trusted participation.
This is the infrastructure Pi has been building since 2019. As crypto.news reported, Pi Network is an official sponsor of Consensus 2026, with co-founder Nicolas Kokkalis joining a May 7 panel titled “How to Prove You’re Human in an AI World (Without Doxing Yourself).”
As crypto.news documented, Protocol 23 is scheduled for May 11, six days after Consensus 2026 closes, introducing full smart contract functionality and unlocking decentralised applications, exchanges, and real-world asset tokenisation on Pi for the first time. The Consensus timing creates maximum public visibility immediately before launch.
As crypto.news tracked, PI rose more than 5% on April 29 as both founders were confirmed for Consensus 2026, with the token near $0.187 entering conference week. The official minepi.com blog confirmed full schedule details and session descriptions for both founders.
The Depository Trust & Clearing Corporation (DTCC) plans to pilot trading of tokenized securities in July with a goal of a full service launch in October.
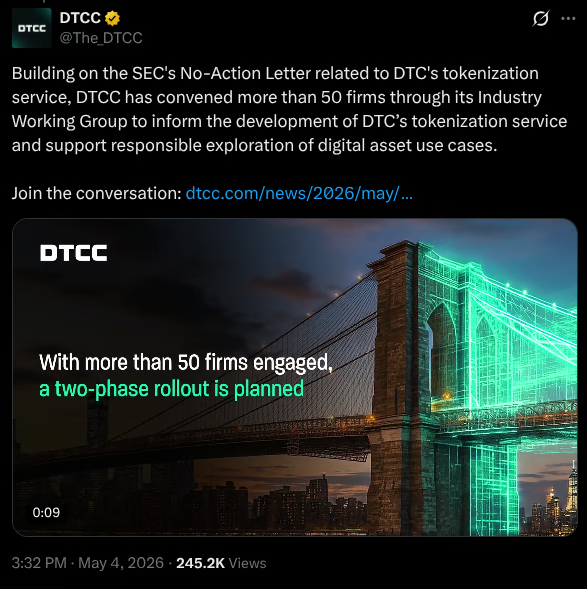
The post-trade market infrastructure giant said Monday that more than 50 TradFi and DeFi firms will play a role in the design and deployment of the service. That DTCC Industry Working Group includes Alpaca, Anchorage Digital, BitGo Bank & Trust, BlackRock, Circle and Fireblocks, along with some of the biggest banks in the country.

Source: DTCC
DTCC, which currently custodies $114 trillion in liquid assets from stocks to exchange-traded funds, said it expects the service will enable tokenization of real-world assets that provide the same entitlements, investor protections and ownership rights as the assets held in traditional form.
In December, DTCC received permission from the US Securities and Exchange Commission (SEC) to offer tokenization services on pre-approved blockchains for three years.
“Although this program is a pilot subject to various operational limitations, it marks a significant incremental step in moving markets onchain,” SEC Commissioner Hester Peirce said at the time.
Related: Tokenized assets climb to $23.6B as investors seek always-on markets
While the pilot phase will test limited production trades, the full service is expected to tokenize a specific set of some of the most-widely traded liquid assets, including exchange-traded funds tracking major indexes, Russell 1000 constituents, US Treasury bills, bonds and notes, according to DTCC’s announcement.
Tokenized RWA market grows, but remains concentrated
The value of tokenized real-world assets have surged 66% in 2026, with funds, gold and equities driving growth across public blockchains.
Data from the analytics platform RWA.xyz show that tokenized stocks alone expanded from $375.4 million on May 3, 2025, to about $1.21 billion on May 3, 2026. Kraken’s xStocks platform has emerged as one of the more visible entrants, reporting more than $25 billion in cumulative trading volume since launching last year.
In January, the New York Stock Exchange and its parent company, the Intercontinental Exchange, announced the development of a new platform to trade tokenized stocks and ETFs. The platform, subject to regulatory approvals, is intended to underpin a new NYSE trading venue for tokenized securities.

Tokenized stocks have recently topped $1.2 billion in value. Source: RWA.xyz
Rather than creating a parallel crypto-native marketplace, the venue is designed to operate within existing US market rules while leveraging blockchain-based settlement infrastructure.
Both NYSE Group and Kraken’s parent, Payward, are part of the DTCC Industry Working Group announced Monday.
In March, TD Securities’ Reid Noch, vice president for electronic trading, said tokenization is beginning to carry real implications for market structure, pointing to the NYSE’s proposed tokenized equities alternative trading system as a key development.
Noch described the structure as closer to a “2.0” market shift, where custody and settlement would remain anchored to the DTCC, while trading would comply with National Best Bid and Offer requirements.
Magazine: How to fix suspected insider trading on Polymarket and Kalshi

TLDR
- Bitmine purchased 101,745 ETH worth about $238 million and increased its total holdings to over 5.18 million ETH.
- The company now holds roughly 4.29% of Ethereum’s outstanding supply and maintains total crypto and cash assets of $13.1 billion.
- Bitmine has pledged more than 4.36 million ETH to staking operations and generates about $297 million in annualized revenue.
- Chairman Thomas Lee said a new crypto spring has begun despite subdued investor sentiment.
- Lee referenced progress on the CLARITY Act and cited a more than 60% probability of passage this year on Polymarket.
Bitmine expanded its Ethereum holdings last week with a 101,745 ETH purchase valued near $238 million. The acquisition raised its total holdings to more than 5.18 million ETH, equal to about 4.29% of supply. Chairman Thomas Lee said a new “crypto spring” has started even as overall sentiment remains weak.
Ethereum Treasury Expands Ether Holdings
Bitmine increased its Ethereum treasury with the latest purchase and pushed total holdings above 5.18 million ETH. The firm said the position equals roughly 4.29% of Ethereum’s outstanding supply. It confirmed the transaction value at about $238 million based on current market prices. The company has continued weekly purchases and has accumulated ETH at scale.
The firm reported total crypto and cash holdings of $13.1 billion after the transaction. It holds 200 Bitcoin, worth about $79,935.77 each at the time of disclosure. It also maintains $700 million in cash and equity stakes in Beast Industries and Eightco Holdings. Bitmine said it uses its balance sheet to support long-term digital asset exposure.
Bitmine has pledged more than 4.36 million ETH into staking operations. That figure represents over 84% of its total ETH holdings. The company said staking generates about $297 million in annualized revenue. It operates the MAVAN staking platform for internal use and institutional clients.
Regulation and Market Outlook Shape Strategy
Lee linked the company’s accumulation strategy to improving regulatory progress in the United States. He referenced the Senate’s release of compromise text for the CLARITY Act. He said the bill bans stablecoin yield on reserves but allows activity-based rewards. He stated, “This compromise is largely acceptable to us, and we hope to see this bill passed in 2026.”
He also cited Polymarket data that assigns more than a 60% chance of passage this year. Lee said crypto markets are emerging from a recent “mini-winter” phase. He stated, “Crypto Spring, in our view, has commenced, and like past cycles, investor sentiment and conviction are muted and bearish even as crypto prices strengthen.” He added that current sentiment does not reflect price performance.
Lee said Ethereum benefits from tokenization trends and artificial intelligence growth. He argued that financial assets continue shifting onto blockchain infrastructure. He said AI systems may prefer neutral public networks for payments and verification. He also said ETH functions as both a store of value and a medium of exchange.
He cited Ethereum’s performance relative to equities since the start of the Iran conflict. Bitmine plans to maintain its staking allocation through its MAVAN platform.

TLDR:
- Bitcoin on-chain activity has fallen to 2-year lows, with only 531K wallets making daily transfers.
- BTC’s 22% price rise over five weeks is not backed by broad network participation or new user growth.
- Only 203K new Bitcoin wallets are created daily, a figure that sits at the lowest point in two years.
- Santiment warns that price rallies without on-chain support are historically fragile and short-lived.
Bitcoin on-chain activity has dropped to its lowest levels in two years, even as BTC reclaims the $80,000 price mark.
Data from blockchain analytics firm Santiment shows only 531,000 wallets making daily transfers. Additionally, just 203,000 new Bitcoin wallets are being created each day.
These are the weakest participation numbers since 2023. The gap between the price recovery and user activity has drawn fresh scrutiny from market observers.
A Rally Supported by Few Market Players
Bitcoin’s price has climbed roughly 22% over the past five weeks. Yet, the number of daily active wallets has not risen in step with the price.
This kind of divergence is unusual during a sustained price recovery. Market participants and on-chain analysts are paying close attention to the gap.
Santiment noted on X that both wallet metrics are sitting at two-year lows. The firm shared data showing “531K Bitcoin wallets making transfers daily” and “203K new Bitcoin wallets created daily.”
This comes as Bitcoin breaks back above $80,000 for the first time in three months. The timing makes the numbers stand out even more.
Typically, rising prices pull in new users and encourage more wallet activity. More on-chain traffic and higher wallet creation rates are common signs of broad adoption. Those signals are clearly missing from the current rally.
Instead, a smaller pool of market participants appears to be driving prices higher. Without wide user participation, the move rests on a narrow foundation.
That makes it more sensitive to profit-taking by larger holders. There is also less fresh demand available to absorb a potential sell-off.
What Low Network Activity Could Signal Next
Low on-chain activity during a price rally is widely viewed as a warning sign. According to Santiment, price increases without growing on-chain participation tend to be fragile. There is simply less buying pressure backing the current move.
If larger players choose to exit their positions, the situation becomes more delicate. There may not be enough demand from new users to keep prices elevated.
The absence of retail adoption at scale remains a key concern for market watchers. Santiment’s data shows that buying fuel remains thin at current participation levels.
However, Santiment also notes that low activity can serve as a contrarian signal. Activity bottoms have historically marked the end of periods of market apathy, not the continuation of them. The market may be closer to a turning point than the current numbers suggest.
Bitcoin is already recovering toward $80,000 with participation near multi-year lows. If retail interest picks back up and daily active addresses begin climbing, the move could gain a stronger footing.
During the 2024–2025 peaks, new wallet creation regularly exceeded 100,000 per day. A return to those levels would represent a notable shift in market momentum.
Three altcoins stand out in the first week of May 2026. SkyAI rocketed 358% over seven days, Dash broke its six-month descending trendline, and Ondo Finance escaped a three-month accumulation range. Each chart point to extension if momentum holds.
Daily and weekly setups across the three tokens show similar bullish triggers but differ in scale. Below are the technical structures and the levels traders are watching as the second quarter progresses.
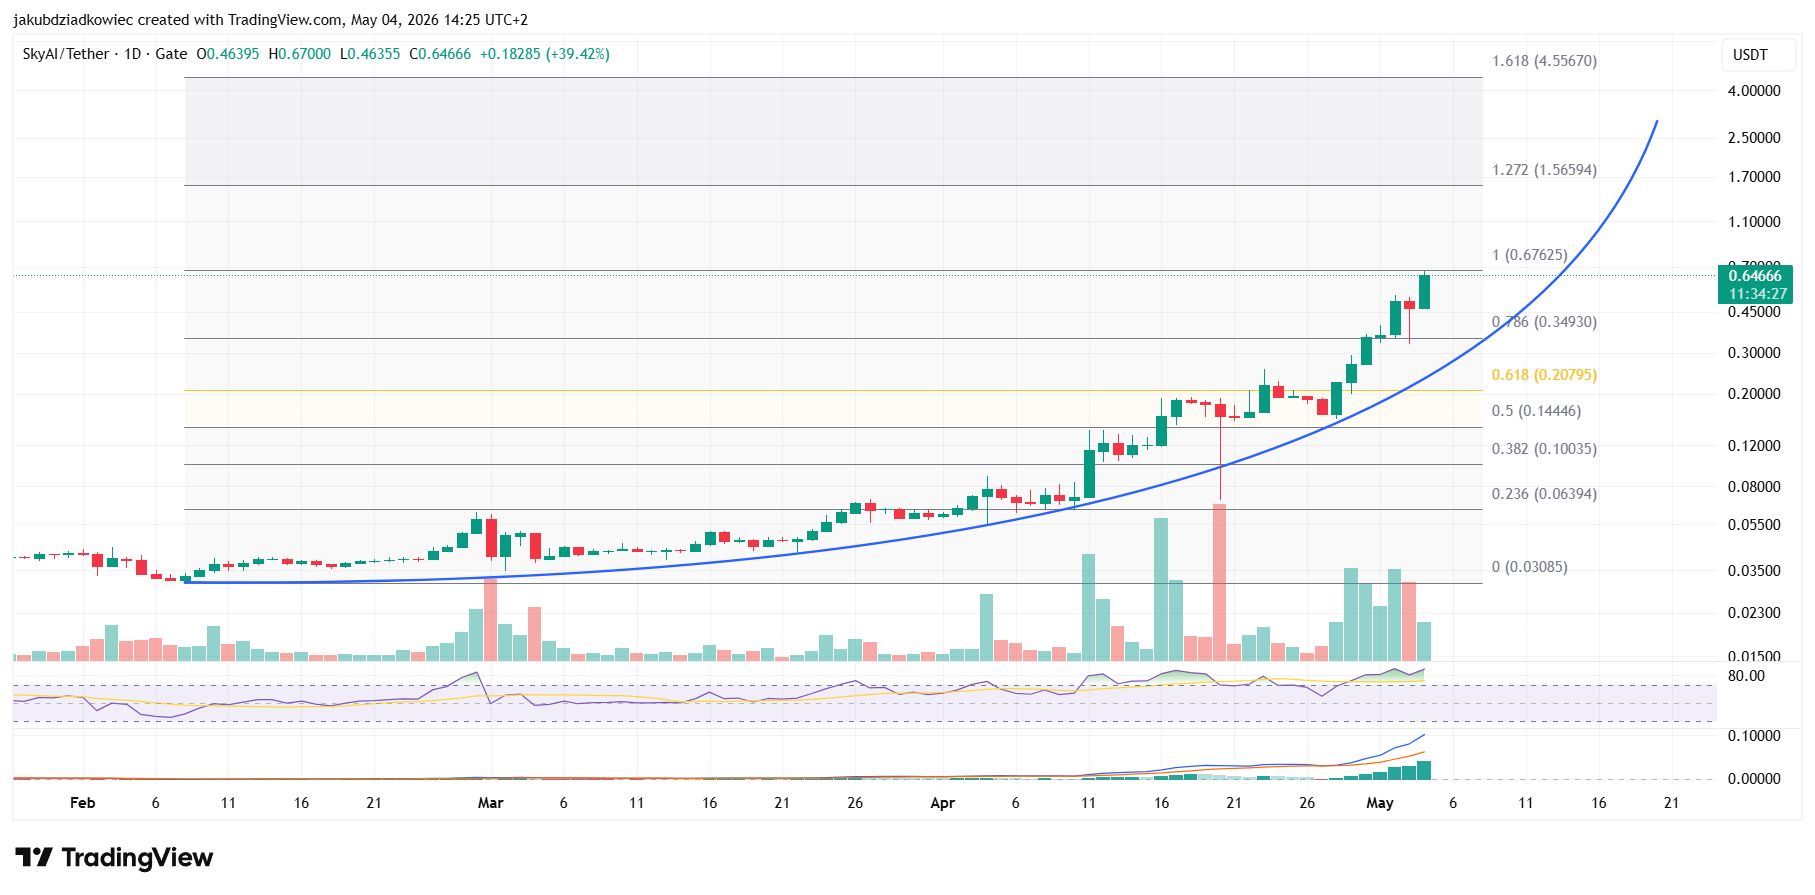
SkyAI (SKYAI) Targets $4.56 If Exponential Curve Holds
SkyAI (SKYAI) printed a fresh local high near $0.68 on May 4. The move capped a parabolic rally from the February 8 swing low at $0.03.
The daily chart uses a logarithmic scale because the price moved more than 20-fold in 90 days. Buyers continue to step in on shallow pullbacks, with the rising blue exponential curve acting as dynamic support.
The Daily Relative Strength Index (RSI) is in bullish territory, with no bearish divergence visible. Moving Average Convergence Divergence (MACD) prints taller green histogram bars, confirming the presence of intact upside momentum.
Two extension targets frame the next leg of the move. The 1.272 external Fibonacci retracement sits near $1.57, while the 1.618 extension projects toward $4.56.
A loss of the curve would expose the 0.618 retracement near $0.21 and the 0.382 zone near $0.10. The token rides the broader AI sector rotation that has lifted small-cap tokens since April.

X user cryptoknight890 mapped two rejection scenarios on the 4-hour chart, with resistance bands drawn at $0.50 and $1.00. Both paths assume a deeper pullback before any continuation toward the upside extensions.

Dash (DASH) Eyes $55 After Daily Trendline Break
Dash (DASH) jumped 23.73% on May 4 to $48.55, attacking a descending trendline from the November 2025 high at $150. The line had capped every rally for the past 6 months.
The breakout candle posted the largest daily volume since early February. A close above $51 would flip resistance to support and validate the breakout structure.
Above the trendline, the previous April 11 swing high near $48 stands as the immediate hurdle. The 0.5 Fibonacci retracement at $54.45 marks the next supply zone.
The November $93 peak sits above as the major upside target. RSI broke into the upper band on the daily, while MACD posted a fresh bullish cross.
A failed breakout would put the 0.786 retracement at $30.49 back on the table as long-term support. The current Dash setup mirrors a rally pattern from earlier this year.

On a weekly basis, X user on cryptclay flagged a confirmed higher low and an inverse head-and-shoulders pattern. Targets sit at $62, $91.35, $135.40, and $236.15, anchored by a major support-and-resistance trendline retest.

Ondo (ONDO) Breaks Out Toward $0.36 First Resistance
Ondo (ONDO) broke above a three-month accumulation range on May 4, trading near $0.30. The token had compressed between $0.245 and $0.295 since February.
The breakout candle came on a fresh volume spike. The first resistance sits at $0.36, with the next supply zone at $0.45.
The chart projects roughly 19% to the first level and 50% to the second from the breakout point. Daily RSI ticked into bullish territory, and a fresh bullish MACD cross supports the move.
The $0.29 zone now needs to flip from prior resistance to support. A daily close back inside the range would invalidate the breakout.
Ondo Finance posted $13.26 million in Q1 revenue and $3.58 billion in total value locked. Those metrics add a fundamental tailwind to the technical setup. Earlier this year, ONDO led the broader real-world asset sector higher.

X user DonWedge confirmed the breakout, noting that previous resistance is now serving as support. The ‘studymycharts’ overlay below shows the move out of the four-month base on the long-term line chart.

The first week of May has handed bulls three different setups across small-cap AI, privacy, and real-world asset tokens. Each level above will tell traders whether the rotation extends or fades into mid-month.
The post 3 Altcoins to Watch as SKYAI Surges 300% in the First Week of May appeared first on BeInCrypto.


Securitize received FINRA approval to expand broker-dealer activities and custody tokenized securities, completing the first full onchain IPO infrastructure stack.


A U.S. attorney is attempting to claim ETH frozen by Arbitrum following the Kelp DAO exploit — on behalf of victims of North Korean state hackers from prior incidents.


XRP price climbed from $1.3840 to $1.4065 in early Asia trading on May 4 on a sharp pickup in volume, breaking through resistance at $1.40 alongside Bitcoin’s return above $80,000.
Summary
- Volume expanded into the $1.40 breakout on May 4, confirming real positioning rather than a low-liquidity push.
- The $1.45 level is the critical structural barrier: 36.8 billion XRP, or 60% of supply, sits at a $1.44 average cost basis per Glassnode.
- Standard Chartered projects $4 to $8 billion in additional XRP ETF inflows if the CLARITY Act clears the Senate Banking Committee before May 21.
XRP price broke above $1.40 for the first time in several days on May 4, alongside Bitcoin’s move above $80,000. As crypto.news reported, Standard Chartered analyst Geoffrey Kendrick projected that Senate Banking Committee advancement of the CLARITY Act could unlock $4 to $8 billion in additional XRP ETF inflows, placing the week-of-May-11 markup as the primary event that could break the $1.45 supply wall.
The $1.45 level has rejected XRP four times in 2026, including a brief $1.50 excursion on April 17 after Rakuten integrated XRP payments for 44 million Japanese users.
Glassnode data confirms roughly 36.8 billion XRP, approximately 60% of total circulating supply, is held at an average cost basis of $1.44, creating a mechanical ceiling at every approach. Traders are now watching whether XRP can hold $1.40 as support and clear $1.41 to $1.42, with a failure back below $1.40 signalling a reversed breakout.
As crypto.news documented, Standard Chartered cut its 2026 XRP target from $8 to $2.80 in February on macro headwinds, making the CLARITY Act catalyst the primary variable for any re-rating this year. As crypto.news tracked, XRP spot ETFs posted $81.63 million in April inflows across a 20-day streak that broke on April 30, before the broader market recovery on May 4 brought renewed buying interest.
Terence Crawford responds to Turki Alalshikh’s offer to unretire for Canelo rematch
Dolly Parton Las Vegas residency officially cancelled as ‘health needs a rebuild’

Which Star’s Absence Hurts Their Team More in 2026 Playoffs?
Manchester United reach agreement with Casemiro over contract clause amid transfer speculation

US brings back mandatory military draft registration

Steven Gerrard disagrees with Gary Neville over ‘shock’ Chelsea and Arsenal claim | Football


-

 Fashion6 days ago
Kylie Jenner’s KHY Enters a New Era with ‘Born in LA’
-

 Business6 days ago
Most Commercial Energy Audits Miss the Real Losses
-

 NewsBeat1 day ago
Channel 5 – All Creatures Great and Small series 7 new post
-
 Tech3 days ago
Trump’s 25% EU auto tariff breaches Turnberry Agreement that also covers semiconductors and digital trade
-

 Crypto World6 days ago
CFTC’s AI will review U.S. crypto registration applications, chairman tells CoinDesk
-
 Sports3 days ago
Paul Scholes issues Marcus Rashford reality check as agreement emerges over Man United star
-

 Business6 days ago
Barclay Brothers Avoid Bankruptcy: HSBC Drops High Court Petitions After IVA Deal
-
 Business5 days ago
Tesla Officially Registers Elon Musk’s Stock: What Investors Need to Know
-

 Tech6 days ago
Get Ready for More Brain-Scanning Consumer Gadgets
-
Crypto World7 days ago
Robinhood Phishing Scam Exploits Gmail Dot Feature to Bypass Security
-

 Crypto World7 days ago
Gmail Dot Trick Underpins Robinhood Phishing, Sending Real-Looking Emails
-

 Entertainment7 days ago
Michael Jackson’s Biopic Excluded Abuse Allegations For $25M
-

 Business4 days ago
Two Powerball Tickets Split $143 Million Jackpot in Indiana and Kansas
-

 Tech5 days ago
Texas Instruments made a new flagship graphing calculator: the TI-84 Evo
-

 Business7 days ago
Superdry co-founder accused of raping woman
-
 Crypto World4 days ago
CoreWeave (CRWV) Stock Climbs 8% Despite $45M Insider Share Dump
-
 Crypto World7 days ago
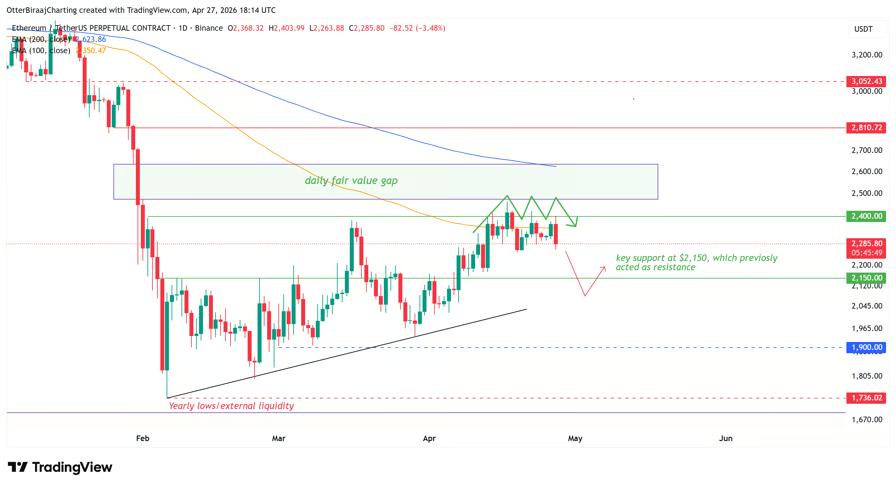
ETH Triple Top Rejects $2.4K As Analysts Flag Weakness Against BTC
-

 Crypto World7 days ago
Will Ethereum hold $2,300 or slip lower from here?
-

 Business7 days ago
Outsourced IT Support vs Internal Teams: A Complete Guide
-

 Entertainment7 days ago
How A Fantasy Flop Finally Found Success On HBO Max
You must be logged in to post a comment Login