
Crypto World
Bitcoin Could Flip ‘Highly Volatile’ Tag as Bulls Eyes $80K by April

Bitcoin paused in choppy trading near the $70,000 mark as markets priced in geopolitical risk and shifting macro cues. After weeks of rangebound action, bulls are betting that a sustained push above the key level could unlock the next leg higher, while bears warn a breakdown remains a possibility if liquidity dries up. In the background, futures open interest has shown signs of revival in recent days, signaling fresh positions and mounting leverage that could amplify price swings into the spring. With traders watching the chart from multiple angles, the next moves may hinge on whether support around $70,000 holds or a breakout above resistance emerges.
Key takeaways
- Bitcoin remains stuck in a narrow range around $70,000, with many market participants awaiting a decisive breakout above or below the level.
- Open interest in Bitcoin futures has risen over the past 30 days, suggesting new positions and heightened leverage that could fuel increased volatility.
- Analysts highlight risk of liquidity-driven moves, including potential sweeps of the $64,000 liquidity pool if price action weakens toward the monthly and weekly opens around $66,000–$66.9K.
- A move above $72,000–$73,000 could shift attention to the $74,000–$76,000 area as the next point of interest for bulls.
- Macro risk sentiment, regulatory signals, and liquidity conditions remain critical drivers shaping the near-term trajectory.
Tickers mentioned: $BTC
Market context: The trading backdrop is defined by a cautious mood as macro headlines and geopolitical tensions influence risk appetite, while futures data points to growing leverage that could widen price swings.
Why it matters
The price action around $70,000 is more than a technical milestone; it acts as a proxy for ongoing sentiment about Bitcoin’s ability to sustain a new leg higher after a protracted consolidation. If Bitcoin can establish $70,000 as a reliable support, traders anticipate a renewed push toward higher bands—potentially into the high $70,000s and beyond toward the low $80,000s by month’s end. Conversely, a failure to defend the level could invite a test of lower supports as risk-off flows and stop-loss clustering generate cascading moves.
Market commentary from prominent voices underscores the duality. Some traders see $70,000 as a critical inflection point: a successful hold could set the stage for a breakout, while a breach could accelerate selling pressure, especially if liquidity providers trigger tighter risk controls. In particular, a handful of analysts emphasized that the market remains vulnerable to rapid swings if leveraged positions unwind in the wake of rising open interest. They point to recent dynamics in which fresh long exposure compounds downside risk and raises the likelihood of abrupt reversals when bids disappear at key levels.
From a technical perspective, the longer-term structure continues to point sideways unless a clear breakout or breakdown emerges. The last weekly candle’s behavior and the ongoing consolidation suggest that traders await a conclusive cue before committing capital in large size. The market’s sensitivity to macro triggers is evident in the way traders frame risk-reward around the $66,000–$64,000 liquidity pockets, which could be targeted in a dip if $70,000 fails as support and retail and institutional players re-strategize around risk controls.
On the upside, the literature of potential targets remains clear. A move above the 72,000–73,000 area could reorient the narrative toward a new zone around $74,000–$76,000, where previously observed liquidity clusters and order-flow dynamics may define the next major milestone. Market observers who emphasize this path argue that as long as $70,000 continues to act as a magnetic point for bids and offers, bulls will keep the door open for a sustained advance into the mid-to-high $70,000s. On the other side, bears stress that if the market cannot sustain gains beyond short-term liquidity spikes, a retest of the monthly open near $66,000 could occur, potentially drawing in stop-loss activity that accelerates the move to the downside.
In a broader sense, the story is not only about price levels but about market mechanics. The 30-day Open Interest change has signaled a transition from a quiet period to a renewed phase of position-building, a sign that participants are more willing to contemplate larger bets. This shift, combined with ongoing macro uncertainty, suggests that Bitcoin could experience a more volatile environment in the weeks ahead as traders adjust to evolving risk appetite and hedging activity. The dynamic invites caution, but it also leaves room for significant upside if price action confirms a sustained bid above critical thresholds.
What to watch next
- Whether BTC can defend the $70,000 level as support in the coming sessions, paving the way for a sustained break above $73,000.
- Short-term liquidity risk around the $64,000–$66,000 zone, where a sweep could trigger further volatility if price moves toward the monthly or weekly opens.
- Shifts in open interest and leverage on futures platforms over the next few weeks, as noted by CryptoQuant’s Quicktake analysis on rising Open Interest.
- Price action around the $74,000–$76,000 area as the next potential magnet for bulls if higher-timeframe momentum resumes.
- Macro and regulatory developments that could alter risk sentiment and liquidity provision in cryptocurrency markets.
Sources & verification
- CryptoQuant Quicktake: Bitcoins Open Interest Is Rising Again—Volatility Ahead (30-day OI trend and implications for leverage).
- BTC price observations and chart references from TradingView (BTC/USD price action and notable levels around $70k).
- Cryptomorphic’s X-posts discussing rangebound price action and the bearish weekly candle context.
- KillaXBT’s X-posts identifying potential liquidation scenarios near key levels and next targets around 74–76k.
- Mark Cullen’s X-posts noting $70,000 as a critical level for potential range breaks or hold.
- Previous coverage noting resistance around $70,000 and the broader discussion of price dynamics (contextual reference to related analyses).
Bitcoin teeters at a pivotal price threshold as open interest rises
Bitcoin (CRYPTO: BTC) has spent the midweek session hovering near the $70,000 level, with traders weighing a possible breakout against the risk of renewed volatility. The current setup reflects a clash between the bulls’ desire to push the market higher and the bears’ caution about a potential breakdown if buyers fail to convert the price into a sustained move. Across the market, sentiment is mixed: while some participants expect a move toward the high $70,000s and into the low $80,000s by month’s end, others warn that a break below the $66,000 region could catalyze a more pronounced downward sweep toward the lower end of the trading range.
In recent weeks, a steady uptick in Open Interest in Bitcoin futures signals the return of new positions and greater leverage. CryptoQuant’s Quicktake notes that the 30-day Open Interest change has entered a stronger recovery phase, implying that traders are layering on new bets as price action remains undecided. This dynamic can translate into heightened swings, as leveraged bets unwind or amplify intraday moves when liquidity concentrates around key levels. The market’s short-term risk therefore remains asymmetric: upside potential exists if buyers sustain momentum, but downside risk persists if demand wanes and liquidity providers pull back.
From a price-formation perspective, the path forward hinges on the daily and weekly clock. Several analysts mentioned that the weekly candle’s structure points to a sideways range unless a decisive breakout materializes. The neighborhood around $70,000 is repeatedly framed as a make-or-break zone; hold it, and bulls may attempt a breakout toward the upper echelon of the range, while a close below could invite a testing of the liquidity pools near $64,000 and the surrounding zones. Observers point to specific price landmarks as potential inflection points: a drop toward the monthly open around $66,000 or slightly below could trigger rapid liquidations, whereas a push above the current resistance band could direct attention to the $74,000–$76,000 corridor as the next waypoint.
Market participants also weigh the broader context. The narrative around Bitcoin’s price action remains tethered to macro risk sentiment and liquidity conditions, with a continued emphasis on whether the market can sustain bids beyond immediate support levels. In the near term, the landscape suggests that the next moves will be driven by how traders manage risk, how much new leverage enters the market, and how external shocks—ranging from geopolitical headlines to regulatory developments—shape risk appetite. While some indicators point to a favorable setup for bulls should the $70,000 threshold hold, others caution that a renewed burst of volatility could come swiftly if liquidity tightens and positions unwind.
As the week unfolds, the combination of recaptured open interest and cautious price action keeps Bitcoin at a delicate crossroads. The story is less about a single run and more about a sequence of micro-episodes that could culminate in a clearer directional cue. For market participants, the immediate question remains whether the congestion around $70,000 will resolve in a durable breakout or a renewed test of support, a distinction that will likely dictate the tone of trading in the weeks ahead.

Key points:
-
Buyers are attempting to maintain BTC above the $66,500 level, but several analysts believe that the $60,000 level may crack.
-
Some major altcoins risk breaking below their immediate support levels, signaling that bears remain in control.
Buyers are attempting to push and maintain Bitcoin (BTC) above the $66,500 level, but are facing stiff resistance from the bears. Although recovery attempts are being sold into, the BTC supply in profit and loss metric suggests that BTC may be close to a bottom.
CryptoQuant analyst “Darkfost” said that there are currently about 8.2 million BTC in loss, compared to roughly 10.6 million BTC during the previous bear market. That suggests the market is at a comparable level of undervaluation seen during the previous bear phase.
However, not everyone believes that a bottom is in. Chartered Market Technician Aksel Kibar said in a post on X that BTC may sink to $52,500 if its developing bearish pattern breaks down.

During bear phases, select analysts turn overly negative and forecast gloom and doom for the markets.
One such projection is from Bloomberg Intelligence senior commodity strategist Mike McGlone, who said in a post on X that BTC may collapse to $10,000. Contrary to that opinion, ARK Invest CEO Cathie Wood said in an interview with CNBC that BTC will not see 85-95% collapses from its all-time high.
Could BTC and select major altcoins hold above their support levels? Let’s analyze the charts of the top 10 cryptocurrencies to find out.
Bitcoin price prediction
BTC turned down from the moving averages on Thursday, and the bears are attempting to strengthen their position by pulling the price below the support line.

If they succeed, the bullish ascending triangle setup will be invalidated. That may force the aggressive bulls to close their positions. The BTC/USDT pair may then slump to the crucial $62,500 to $60,000 support zone.
The first sign of strength will be a close above the moving averages. That opens the doors for a rally to $72,000 and then to $76,000. A close above $76,000 will complete the ascending triangle pattern, propelling the pair toward $84,000.
Ether price prediction
Ether (ETH) failed to rise above the $2,200 resistance on Wednesday, indicating that the bears are aggressively defending the level.

The flat moving averages and the relative strength index (RSI) just below the midpoint do not give a clear advantage either to the bulls or the bears. That suggests the ETH/USDT pair may swing between $2,200 and $1,916 for some time.
Buyers will have to push and maintain the ETH price above the $2,200 level to gain the upper hand. If they do that, the pair may climb to $2,400 and thereafter to $2,600. On the downside, a close below $1,916 might sink the pair to the critical $1,750 support.
BNB price prediction
BNB (BNB) turned down from the moving averages on Wednesday and dropped to the solid support at $570.

The downsloping 20-day exponential moving average ($620) and the RSI near the oversold territory signal that the path of least resistance is to the downside. If the $570 support breaks down, the BNB/USDT pair may resume the downtrend to $500.
This negative view will be invalidated in the near term if the BNB price turns up and breaks above the moving averages. That suggests the pair may continue to oscillate between $570 and $687 for a few more days.
XRP price prediction
XRP (XRP) turned down from the 20-day EMA ($1.36) on Thursday, and the bears are striving to pull the price below the $1.27 support.

If they manage to do that, the XRP/USDT pair may plummet to the Feb. 6 low of $1.11. This is a vital support for the bulls to defend, as a close below it may extend the decline to the support line of the descending channel pattern near $1.
Buyers are likely to have other plans. They will attempt to drive the XRP price above the moving averages, clearing the path for a recovery to the $1.61 level and then to the downtrend line.
Solana price prediction
Solana (SOL) has reached the support of the $76 to $95 range, indicating that the bears continue to exert pressure.

Buyers are expected to aggressively defend the $76 level, but the relief rally is likely to face selling at the moving averages. If the SOL price turns down from the current level or the moving averages and breaks below $76, it signals that the bears are back in the driver’s seat. There is support at $67, but if the level cracks, the next stop may be $50.
Contrarily, if the SOL/USDT pair turns up and breaks above the moving averages, it signals that the range-bound action may continue for a while longer.
Dogecoin price prediction
Dogecoin (DOGE) is getting squeezed between the moving averages and the $0.09 support, signaling a potential range expansion in the short term.

A close below the $0.09 support indicates that the bears are back in command. That may intensify selling and sink the DOGE/USDT pair to the Feb. 6 low of $0.08. Buyers will attempt to defend the $0.08 level, but if the bears prevail, the DOGE price may plunge to $0.06.
On the upside, a close above the moving averages suggests that the buyers have overpowered the bears. The pair may ascend to $0.10 and later to the stiff $0.12 resistance.
Hyperliquid price prediction
Hyperliquid (HYPE) is attempting to bounce off the 50-day simple moving average ($34.16), but the relief rally is expected to face selling at higher levels.

The 20-day EMA ($37.10) has started to turn down, and the RSI has slipped into the negative zone, signaling that the bulls are losing their grip. If the HYPE price turns down and breaks below the 50-day SMA, the pullback may reach the $29.42 level.
Contrary to this assumption, if the price turns up and breaks above the 20-day EMA, it suggests that the bulls remain in control. The HYPE/USDT pair may march to $41.59 and subsequently to $43.76.
Related: Here’s what happened in crypto today
Cardano price prediction
Sellers have maintained Cardano (ADA) below the $0.25 resistance but have failed to pull the price below the $0.23 level.

The 20-day EMA ($0.25) is sloping down gradually, and the RSI is in the negative territory, indicating a slight edge to the bears. If the ADA price turns down from the 20-day EMA and breaks below $0.23, it suggests that the bulls have given up. The ADA/USDT pair may drop to $0.22 and later to the support line near $0.18.
Conversely, if buyers propel the price above the moving averages, it suggests that the selling pressure is reducing. The pair may rally to the downtrend line, which is a vital resistance for the bears to defend.
Bitcoin Cash price prediction
Bitcoin Cash (BCH) has dropped to the $443 level, which is a critical support for the bulls to defend.

Any bounce off the $443 level is expected to face selling at the moving averages. If the BCH price turns down sharply from the moving averages, it increases the likelihood of a drop below the $443 level. If that happens, the BCH/USDT pair will complete a bearish head-and-shoulders pattern. The pair may then tumble to the $375 level.
On the contrary, a close above the $486 level suggests that the bulls are back in the game. The pair may then jump to the $520 to $540 zone.
Chainlink price prediction
Chainlink (LINK) has been trading between the $8 and $10 level, indicating a balance between supply and demand.

If buyers thrust the price above the moving averages, the LINK/USDT pair may rise to the $10 resistance. Sellers are expected to defend the $10 level, as a close above it may propel the LINK price to $10.94 and then to $11.61.
Alternatively, if the price turns down from the moving averages and breaks below the $8 level, it signals that the bears have seized control. The pair may collapse to $7.15 and then to the $6 level.
This article does not contain investment advice or recommendations. Every investment and trading move involves risk, and readers should conduct their own research when making a decision. While we strive to provide accurate and timely information, Cointelegraph does not guarantee the accuracy, completeness, or reliability of any information in this article. This article may contain forward-looking statements that are subject to risks and uncertainties. Cointelegraph will not be liable for any loss or damage arising from your reliance on this information.
Crypto World
Gate 2026 Q1 Spot Listing Key Stats: 35.7% of Exclusive Listings Gained 100%+ in One Week
In the first quarter of 2026, against the backdrop of overall pressure in the crypto market and a more cautious risk appetite among capital, high quality early stage assets remained one of the most attractive structural opportunities in the market.
Gate listed a total of 37 new spot assets in Q1, covering 77.1% of the newly added projects across major exchanges during the same period, of which 27 were first listings, accounting for 73% of Gate’s new listings for the quarter; additionally, 14 were exclusive listings, representing 37.8%.
Amid heightened market volatility, Gate maintained a steady listing pace, strong capability in onboarding high quality projects, and a consistent ability to deliver positive return opportunities.
Overall Overview
From the perspective of total sample size, in the first quarter of 2026, using seven major platforms including Gate as the sample, a total of 48 new projects were listed across leading exchanges.
Among them, Gate listed 37 projects during the quarter, corresponding to a coverage rate of 77.1%, meaning that among the newly added high quality supply competed for by major platforms in Q1, Gate covered more than three quarters of the projects.
For general users, the importance of coverage is self evident. It directly determines whether users can access a sufficiently complete set of core new market listings on a single platform. If a platform has relatively low coverage, even if a few projects perform well, it can still leave users with the impression that important projects are not fully represented.
A coverage rate of 77.1% indicates that at least during Q1, Gate remained closely aligned with the mainstream pipeline of new project supply, allowing users to access most of the new assets worth paying attention to on the platform.
However, what truly defines Gate’s competitiveness is not only the breadth of coverage, but also the structure of that coverage.
Among the 37 new assets listed by Gate in Q1, 27 were first listings, accounting for 73%, while 14 were exclusive listings, representing 37.8%. If calculated based on the overall sample of major exchanges, Gate’s first listing coverage reached 56.3%. In other words, among the 48 new projects listed across major exchanges in Q1, more than half were first listed on Gate.
A high proportion of first listings indicates that Gate has strong attractiveness at the critical stage when projects transition from primary market narratives into secondary market trading. Projects choosing Gate as one of their initial public trading venues essentially reflects recognition of Gate’s user base, liquidity absorption capacity, initial price discovery efficiency, and market distribution capability. A platform that consistently secures first listings is often in a relatively proactive position in competition for project resources.
A meaningful share of exclusive listings reflects another layer of capability with substantial value. First listings demonstrate a platform’s ability to participate in mainstream high quality supply, while exclusive listings indicate whether the platform possesses independent judgment and differentiated sourcing capabilities.
Especially in a weak market environment, the selection difficulty for exclusive projects is higher, as exclusivity implies a lack of sufficient external validation from other platforms, requiring the platform to bear the responsibility of early judgment. If selection proves inaccurate, post listing performance will quickly reflect the issue; if exclusive projects perform well after listing, it not only indicates access to resources but also strong forward looking evaluation capability.
From this overall overview, Gate’s core foundation in Q1 can be summarized in three key characteristics.
(1) Broad coverage, indicating continuous participation in top tier new supply;
(2) High proportion of first listings, indicating strong capability to capture high quality projects at their entry into the market;
(3) A meaningful share of exclusive listings, showing that the platform is not merely following the market, but actively identifying and positioning differentiated assets in advance.
Taken together, these three factors form the foundation of Gate’s spot listing system in Q1. Only when coverage, first listings, and exclusivity all hold simultaneously can a platform’s listing framework be considered complete.
Post Listing Performance: Consistent Positive Return Coverage Across Short Term and 7 Day Windows
The quality of a platform’s listing performance cannot be evaluated solely by whether it secures projects, but also by whether those projects demonstrate stable performance after listing. A key characteristic of Gate in Q1 is that newly listed projects exhibited relatively consistent time series behavior across multiple holding periods, with overall positive return coverage remaining relatively stable.
Figure 1: Share of Gate New Listings With Price Increases Across Timeframes (5m–7d)
From the perspective of the share of price increases, among newly listed projects in Q1, 58.3% rose within the first 5 minutes after listing, 54.1% maintained gains at the 1 hour interval, 56.8% still recorded positive returns after 24 hours, 54.1% were up after 3 days, and 50.0% remained in an upward trend after 7 days. The data shows that the positive return coverage of Gate’s listed projects remained relatively stable across multiple holding periods.
Many new projects are driven by early speculative capital, short term sentiment, and traffic momentum at the opening stage, often leading to rapid initial price surges. However, if the project lacks fundamental support or if the platform’s liquidity absorption is insufficient, such gains tend to fade quickly, resulting in significantly weaker performance after 24 hours.
This is not the case for Gate’s Q1 sample. Across 5 minutes, 1 hour, 24 hours, and 3 days, the share of projects with price increases consistently remains above 50%, indicating that most listed projects did not exhibit a typical pattern of opening high and trending downward during the core price discovery window.
The 24 hour and 3 day intervals are particularly meaningful as reference points. Most participants in new listings are not ultra short term traders, and many operate on intraday, overnight, or short cycle holding strategies.
For these users, the fact that 56.8% of projects are up after 24 hours and 54.1% are up after 3 days reflects a more realistic trading experience. It indicates that positive return opportunities for Gate’s new listings are not limited to the initial opening phase, but show a degree of continuity during the key post listing holding window.
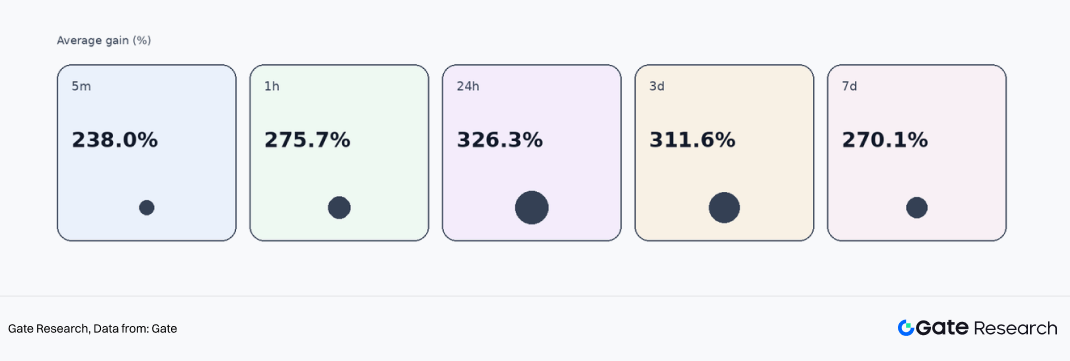
Further examining the average gains of projects that recorded price increases provides a clearer view of return elasticity. In Q1, the average gains for rising projects across the 5 minute, 1 hour, 24 hour, 3 day, and 7 day intervals were 238.0%, 275.7%, 326.3%, 311.6%, and 270.1%, respectively.
This indicates that once high quality new listings on Gate establish early positive momentum, the potential for price expansion remains substantial. Notably, during the 24 hour and 3 day windows, average gains remain around 300%, suggesting that the wealth effect of high quality projects has not disappeared in a weak market, but is instead more concentrated in a subset of carefully selected assets.
Figure 2: Average Gains of Rising Gate New Listings Across Timeframes (5m–7d)
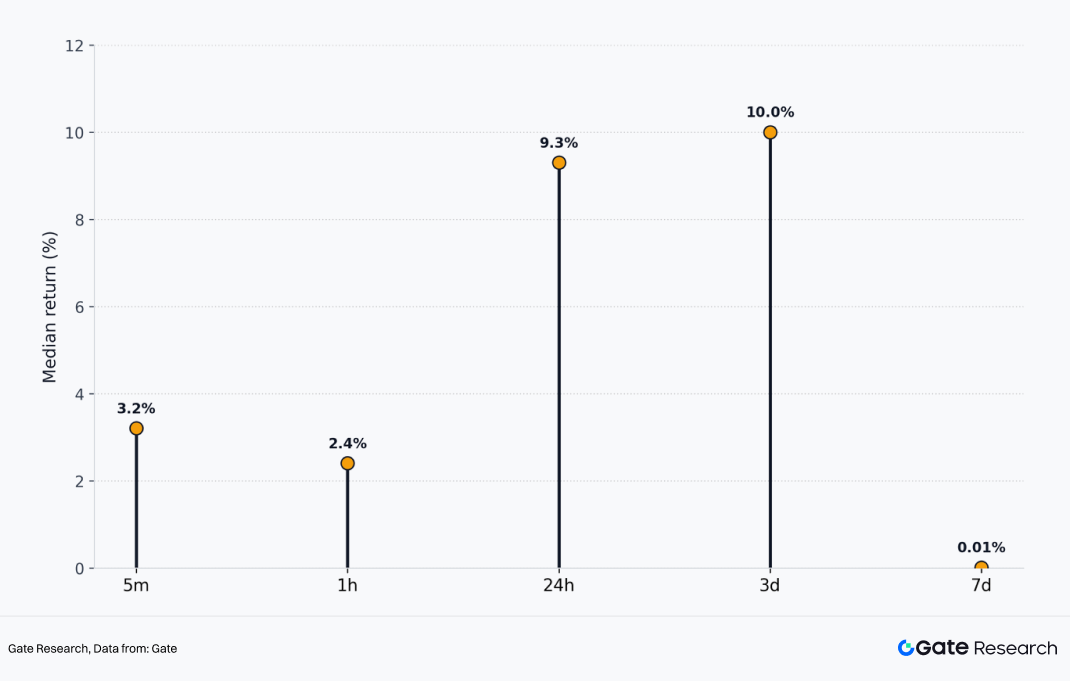
Of course, looking at average gains alone does not provide a complete picture, as averages are easily influenced by extreme outliers, which can obscure the typical performance of most projects. Therefore, the median is particularly important in this context.
The median gains of newly listed projects in Q1 were +3.2% at 5 minutes, +2.4% at 1 hour, +9.3% at 24 hours, +10.0% at 3 days, and +0.01% at 7 days. Even when excluding the impact of extreme high multiple projects, the typical project performance within the sample still shows clearly positive returns at the 24 hour and 3 day stages.
This indicates that the overall performance of Gate’s spot listings during the quarter was not driven solely by a small number of outliers lifting the average, but rather that most projects maintained a certain level of positive return potential during the core post listing observation window.
Figure 3: Median Price Increase of Gate New Listings Across Timeframes (5m–7d)
For general users, what truly determines the participation experience is not whether there are one or two projects with extremely high returns, but whether the overall quality of new listings on the platform is consistent and whether it demonstrates a certain level of repeatability.
Based on the median data, Gate provided a clear answer in Q1, at least within the 24 hour to 3 day window: its spot listings exhibited strong consistency and a certain level of positive expected returns.
At the same time, the near flat median at 7 days also reflects another fact. The advantage of new listings is primarily concentrated in the early stage of post listing price discovery rather than extending indefinitely.
After 7 days, the market enters a more advanced phase of differentiation and elimination, where disparities between projects expand rapidly. Therefore, for users, not all new listings are suitable for long term holding; instead, within the first 24 hours to 3 day window after listing, the market presents a clearer and more stable density of return opportunities.
First Listings and Non-First Listings: A Dual Track Structure
When discussing a platform’s listing capability, many tend to focus entirely on first listings. While first listings are important, a platform with a truly mature listing system demonstrates its strength not only through first listings, but through the ability of different types of projects to form their own clear return logic. Based on Q1 data, this characteristic is particularly evident for Gate.
First Listings: Dominant in Quantity with Stronger Return Elasticity
In Q1, Gate recorded 27 first listings, accounting for 73% of all new listings. First listings formed the core of Gate’s listing structure in Q1, meaning that in most cases, the platform directly participated in the initial stage when projects entered the secondary market.
In terms of performance, the most notable characteristic of first listings is their strong return elasticity. Data shows that nearly 46% of first listed projects remained in an upward trend after 7 days; among the projects that increased in price, the average gains reached 502.8%, 440.7%, and 364.3% on the first day, 3 day, and 7 day intervals, respectively.
This indicates that the core advantage of Gate’s first listings lies not only in early access, but in their ability to build market momentum starting from Gate, often resulting in stronger price expansion potential.
Figure 4: Average Returns of Rising Gate Listings Across Holding Periods (1d, 3d, 7d)
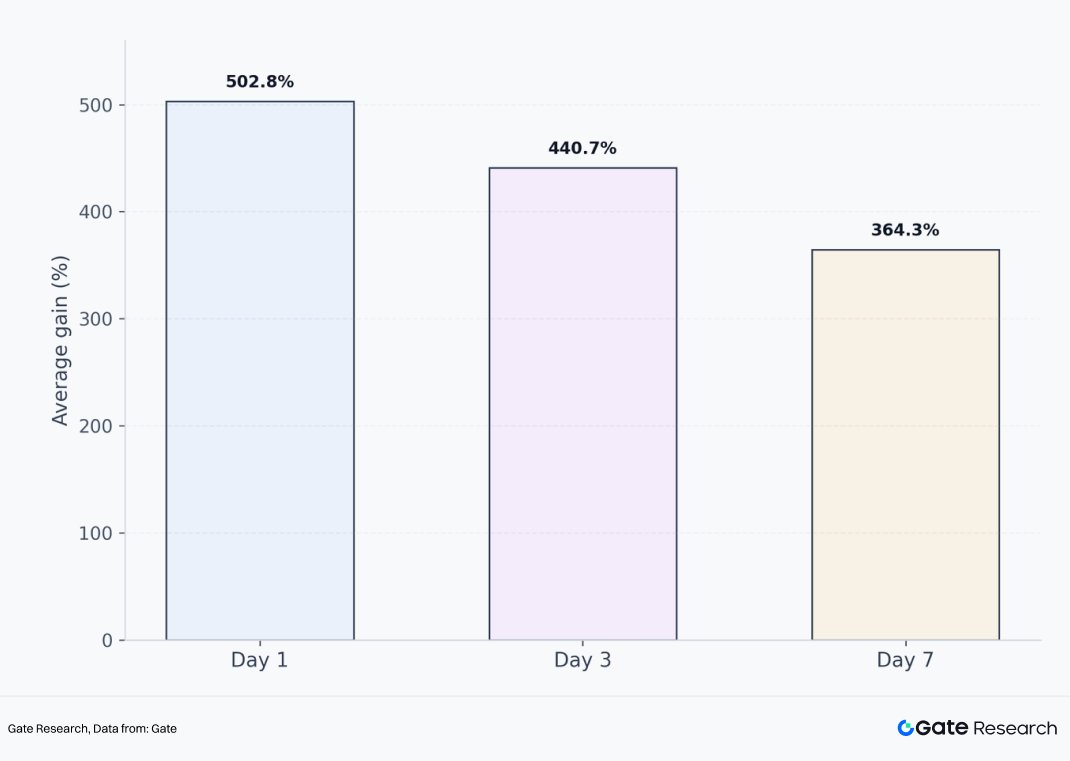
From the perspective of extreme return distribution, this high elasticity is further validated. Among first listings in Q1, 7.4% of projects recorded gains exceeding 500% and even 1,000% within 24 hours. This indicates that within Gate’s listing system, the first listing segment serves as an entry point for high payoff opportunities.
Not every project is guaranteed to surge, but once a selected first listing aligns with market attention, narrative strength, and traffic momentum, the resulting price response is often more pronounced.
The underlying logic is straightforward. First listings occur at the earliest stage of public trading, where price discovery is still incomplete, market understanding is rapidly forming, and capital can concentrate more easily within a short period.
For platforms, the ability to secure high quality projects at this stage determines their capacity to provide users with high payoff, high attention early trading opportunities. For users, first listings offer the potential for earlier participation and higher return elasticity, but also come with greater volatility and faster divergence.
Non-First Listings: Smaller in Number but More Stable in Trend
Compared with first listings, Gate recorded 10 non-first listings in Q1, representing a significantly smaller share. However, in terms of performance, these projects demonstrate more stable median returns.
Figure 5: Win Rate and Median Price Increase of Gate Non-Initial Listings Across Timeframes (5m–7d)
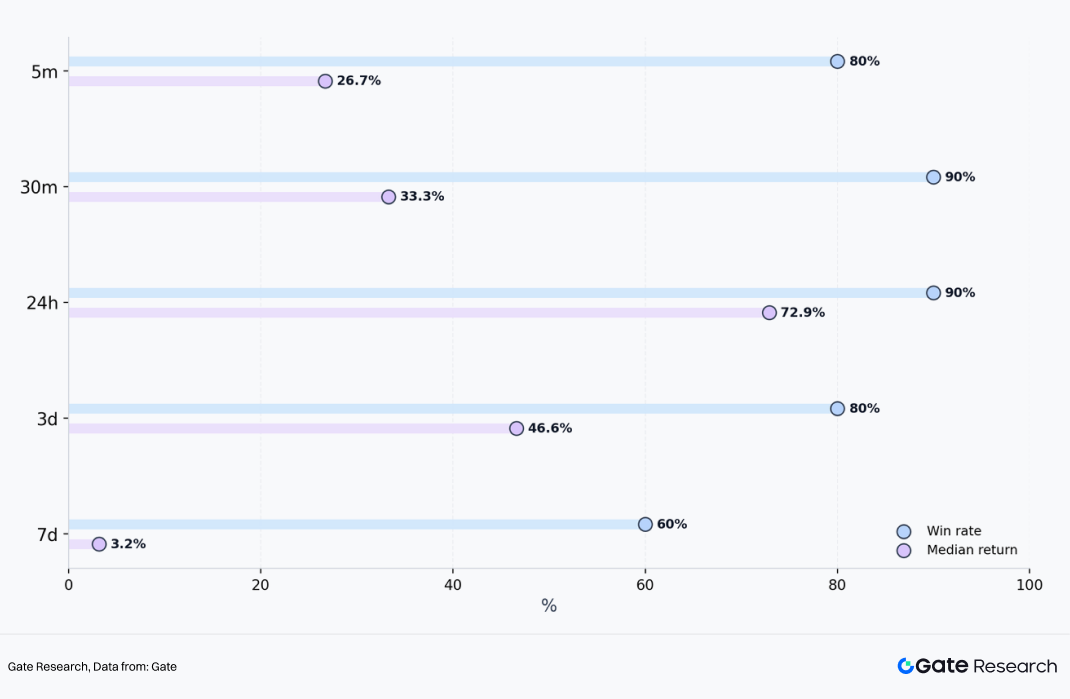
Data shows that non-first listings recorded price increase shares of 80%, 90%, 90%, 80%, and 60% across the 5 minute, 30 minute, 24 hour, 3 day, and 7 day intervals, respectively; the corresponding median gains were +26.7%, +33.3%, +72.9%, +46.6%, and +3.2%. In addition, 40% of non-first listing projects achieved gains exceeding 100% within 24 hours.
The data indicates that although non-first listings do not possess the same initial pricing advantage as first listings, they demonstrate higher success rates of price increases under Gate’s screening mechanism.
This is because non-first listing projects have typically undergone initial market validation, allowing the platform to conduct a second layer of selection based on more comprehensive factors such as price performance, community attention, narrative diffusion, and market absorption conditions, thereby offering greater certainty compared to first listings.
Overall, Gate’s listing structure does not rely solely on first listings to demonstrate its advantage, but instead forms two complementary pathways: first listings provide higher elasticity and stronger wealth effects, while non-first listings deliver more stable median returns.
The former is more aligned with an aggressive approach, while the latter is more aligned with a stable strategy, together enabling the platform to serve different user preferences. From the platform perspective, this dual track structure is more mature than relying solely on first listings.
It shows that Gate is not mechanically pursuing a higher number of first listings, but is also able to continuously provide effective opportunities through the timing and secondary selection of non-first listing projects.
Exclusive Listings: The Segment That Best Reflects Gate’s Proactive Judgment Capability
If first listings reflect a platform’s ability to participate in mainstream high quality supply, exclusive listings reflect a more proactive capability in project selection, resource acquisition, and forward looking judgment. Exclusive listings directly reveal a platform’s project evaluation standards, risk control capability, and execution efficiency.
In Q1, Gate exclusively listed 14 projects, accounting for 37.8% of all new listings. This proportion itself indicates that Gate was not merely passively following the mainstream market listing cycle during the quarter, but instead maintained a differentiated project pipeline to a significant extent. More importantly, these exclusive projects did not underperform after listing; on the contrary, they demonstrated strong competitiveness across multiple key time windows.
Figure 6: Win Rate and Median Price Increase of Gate Exclusive Listings Across Timeframes (24h–7d)
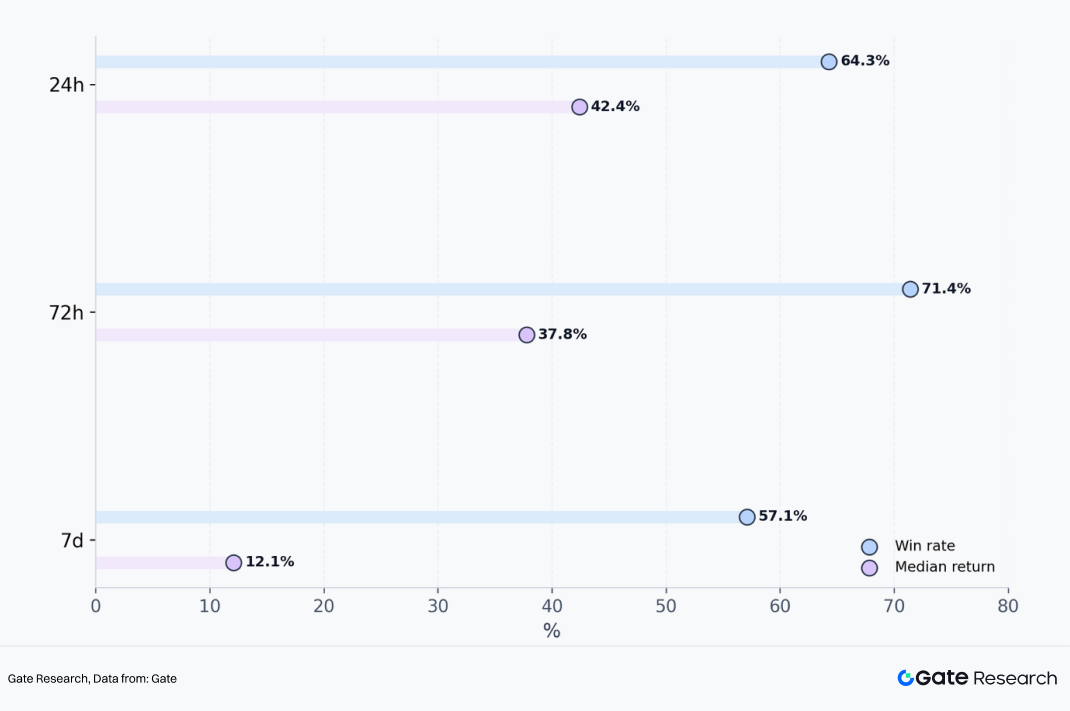
From the perspective of success rate, exclusive listings recorded price increase rates of 64.3%, 71.4%, and 57.1% across the 24 hour, 72 hour, and 7 day intervals, respectively, with the 72 hour window showing the strongest performance. This means that during the period from day 2 to day 3 after listing, Gate’s exclusive projects did not weaken rapidly as initial listing momentum faded, but instead demonstrated clearer capital absorption and upward price momentum.
From the perspective of median returns, exclusive listings achieved +42.4%, +37.8%, and +12.1% across the 24 hour, 72 hour, and 7 day intervals, respectively. This indicates that exclusive projects not only have a relatively high share of price increases, but also deliver median returns that are significantly higher than the overall sample. This suggests that the strong performance of exclusive listings is not driven by a small number of extreme cases, but rather that most projects provide solid return quality within the core observation windows.
Further examining the distribution of extreme returns makes the characteristics of exclusive listings even clearer. From 30 minutes after listing up to 30 days, more than 20% of exclusive projects consistently achieved gains exceeding 100%; during the 3 to 7 day window, the share of projects with gains above 100% reached as high as 35.7%, significantly higher than the 15.4% observed among all first listings; even when extended to a 30 day horizon, 12.5% of exclusive projects still recorded gains exceeding 500% and even 1,000%.
Taken together, these data points indicate that Gate’s exclusive listings do not rely solely on initial scarcity driven momentum at the opening stage, but are able to sustain price discovery and attract consistent buying support across multiple post listing time windows, with a relatively high probability of delivering more pronounced return trajectories.
Case Review
Based on Q1 cases, Gate’s project selection broadly followed three pathways: one category consists of high attention projects where Gate completed early first listings or priority onboarding, followed by validation from other platforms; another category includes exclusive listings on Gate that delivered strong subsequent performance, reflecting the platform’s independent selection capability; the third category consists of narrative driven projects with strong community traction and topic diffusion, demonstrating the platform’s sensitivity to sentiment driven sectors.
Solana Mobile (SKR): Early First Listing Execution on High Attention Projects
Solana Mobile belongs to the DePIN sector, achieving an ATH increase of 2,459% after TGE and a 30 day gain of 715%. As a combination of Solana’s official hardware phone and Web3 applications, Solana Mobile benefits from inherent brand endorsement, a strong community foundation, and significant dissemination advantages. Gate conducted a simultaneous first listing with two other CEXs and went live one day ahead of B*** Alpha to capture market share, indicating that Gate maintained strong responsiveness to globally high attention projects in Q1.
From the SKR listing, it can be seen that Gate is able to enter the key early window for projects with high traffic, strong narratives, and elevated expectations, allowing users to participate before broader market coverage occurs. This capability reflects Gate’s competitive position in accessing mainstream high quality project supply.
CodexField (CODEX): A Representative High Return Exclusive Listing
CodexField belongs to the content creation sector and is one of the most representative exclusive listings on Gate in Q1. It recorded an ATH increase of 4,900% and maintained a gain of 2,566% as of March 25, while B***, B***, and B*** had not yet listed the project.
If exclusive listings best reflect a platform’s proactive selection capability, then CodexField serves as a clear demonstration of Gate’s strength in this area. The project received institutional investment from Gate Labs prior to listing, and Gate provided the initial secondary market pricing venue, ultimately generating a strong wealth effect.
For projects that are not yet widely covered but possess strong growth potential and market imagination, Gate has the ability to establish early positioning and, through its platform liquidity and user base, convert these opportunities into verifiable market outcomes.
Lobster: An Early Positioning Case in AI plus Meme Narratives
The combination of AI and Meme was a high attention yet highly differentiated direction in Q1. Many projects had strong narratives but lacked sustainability, while others demonstrated strong dissemination capability without translating into trading results. Lobster belongs to the AI plus Meme category and was first listed on Gate, achieving an ATH increase of 286% and a 7 day gain of 164%; B*** Alpha followed with a listing the next day after observing Gate’s market signal. This case highlights Gate’s early positioning capability in highly viral narratives, as well as its ability to lead early price discovery.
Overall, these cases show that Gate’s spot listing performance in Q1 was not driven by a single type of project, but rather by a combination of multiple sectors, styles, and narratives. The platform is capable of onboarding high attention mainstream projects while also identifying exclusive growth oriented projects; it covers both technology and product driven projects, as well as community culture and sentiment driven assets. This diversity itself reflects the maturity of Gate’s listing system.
Conclusion
Overall, Gate’s spot listing performance in the first quarter of 2026 can be summarized in one sentence: in a market phase characterized by overall pressure, reduced opportunity density, and intensified project divergence, Gate continued to maintain a relatively high quality pipeline of new listings and convincing post listing performance.
During a period where strong outcomes are not easy to achieve, Gate’s overall sample maintained a relatively high share of price increases across multiple time windows, with median returns at 24 hours and 3 days remaining positive. New listings demonstrated a certain breadth of performance, where first listings provided stronger return elasticity, non-first listings delivered higher success rates, and exclusive listings reflected greater scarcity and stronger mid term performance. The platform’s listing capability is not driven by isolated strengths, but by a systematic and integrated framework.
For users, Gate provides a more complete and structured early stage participation framework. Users seeking higher return elasticity can focus on first listings for higher payoff opportunities; users preferring more stable pathways can look to the higher success rate characteristics of non first listings; users aiming to access differentiated assets before broad market coverage can pay closer attention to Gate’s exclusive listing segment. For project teams, Q1 data also demonstrates that Gate possesses strong capabilities in initial trading support, liquidity organization, and price discovery.
From a longer term perspective, the core competition in spot listing capability among exchanges ultimately lies in whether they can consistently maintain strong project sourcing, selection, and outcome realization across different market cycles. Gate’s Q1 data clearly demonstrates this point: even in a weak market, Gate is able to list accurately, select with stability, and deliver tangible results.
Gate Research is a comprehensive blockchain and cryptocurrency research platform that provides deep content for readers, including technical analysis, market insights, industry research, trend forecasting, and macroeconomic policy analysis.
Disclaimer: Investing in cryptocurrency markets involves high risk. Users are advised to conduct their own research and fully understand the nature of the assets and products before making any investment decisions. Gate is not responsible for any losses or damages arising from such decisions.
The post Gate 2026 Q1 Spot Listing Key Stats: 35.7% of Exclusive Listings Gained 100%+ in One Week appeared first on BeInCrypto.

TLDR
-
South Korean FSS identifies critical omissions in Dunamu-Naver merger documentation
-
Regulator demands immediate corrections to restructuring and investment disclosures
-
Stock exchange agreement encounters obstacles from regulatory oversight
-
Governance structure and control arrangements under FSS evaluation
-
Emerging digital asset regulations complicate merger approval process
The Financial Supervisory Service of South Korea has mandated that Dunamu revise its disclosure documents related to the proposed stock exchange with Naver Financial involving Upbit. The regulatory body uncovered significant omissions and inaccuracies concerning crucial investment information and corporate reorganization strategies. This enforcement action intensifies regulatory compliance requirements as the transaction undergoes official evaluation.
Regulatory Authority Identifies Critical Reporting Deficiencies
Following a thorough examination of Dunamu’s significant transaction filing, the FSS discovered substantial deficiencies in essential disclosure components. The shortcomings centered on prospective corporate reorganization plans and other material information relevant to investors. Consequently, the financial watchdog mandated prompt remedial action to guarantee precise public information.
According to the FSS, inadequate disclosures potentially compromise stakeholders’ ability to properly evaluate the transaction. The regulatory body stressed the importance of transparency regarding risk factors and strategic decision-making processes. Dunamu received explicit instructions to amend and supplement the filing without delay.
In response, Dunamu contended that no definitive restructuring plans have been established following the stock exchange’s finalization. The FSS countered that insufficient transparency nonetheless impairs proper assessment capabilities. The regulator reinforced its position that revised documentation must encompass all pertinent considerations.
Merger Agreement Encounters Regulatory and Organizational Challenges
Under the proposed arrangement, Dunamu will transition into a fully controlled entity of Naver Financial via an all-encompassing stock exchange mechanism. This framework will transform current shareholders into Naver Financial equity holders. The FSS maintains ongoing surveillance of disclosures concerning ownership transitions and governance implications.
The agreement establishes a valuation exchange ratio of 3.064569 to one comparing Dunamu against Naver Financial. The FSS emphasized that mandatory approval procedures could postpone or modify the transaction schedule. These requirements encompass Fair Trade Commission assessments and additional financial regulatory submissions.
Naver intends to maintain operational control through shareholder agreements guaranteeing voting authority within Naver Financial’s structure. The FSS observed that such mechanisms necessitate clear disclosure of their ramifications. The regulatory body continues evaluating whether governance-related risks receive adequate explanation.
Legislative Developments Introduce Additional Complications
South Korea’s developing digital asset regulatory framework introduces ambiguity to the contemplated transaction. The FSS recognized that forthcoming legislation could fundamentally alter ownership parameters and regulatory obligations. Dunamu incorporated legislative uncertainty factors in its updated submission.
The Digital Asset Basic Act establishes more rigorous standards for platform operators and financial configurations. The FSS views these legislative developments as pertinent to transaction viability and strategic planning. The regulator anticipates disclosures will accurately represent prospective regulatory modifications.
Proposed restrictions on cryptocurrency exchange ownership percentages may challenge Naver Financial’s complete control objectives. The FSS categorizes these policy deliberations as substantive elements in investment analysis. Consequently, the FSS continues implementing more stringent disclosure requirements.
The regulatory intervention demonstrates elevated examination of major fintech and cryptocurrency sector consolidations. Dunamu must reconcile its disclosures with regulatory standards as the transaction advances. The FSS maintains its pivotal role in assessing transparency and regulatory conformity throughout the deal.

Crypto World
BlackRock Is Paying $350,000 for Crypto Executives: Is Wall Street Digital Asset Takeover Just Getting Started?
Leading Wall Street firms BlackRock, Goldman Sachs, Morgan Stanley, and Citigroup are actively posting crypto jobs, not for experimental blockchain labs, but for permanent digital asset desks running live revenue operations. This is a structural build, not a pilot program.
The numbers confirm the scale. Crypto companies listed 5,154 open positions in early 2025, a 40%+ rise from late 2023.
BlackRock alone posted a New York Managing Director role for crypto at $270,000–$350,000. Goldman Sachs has disclosed $2 billion in crypto exposure. The ETF approval wasn’t a catalyst – it was the starting gun.
Key Takeaways:
- ETF Catalyst: Bitcoin ETF inflow recovery has forced Wall Street to staff permanent middle-office, trading, and compliance functions – roles that didn’t exist inside these firms two years ago.
- Named Institutions: BlackRock, Goldman Sachs, Morgan Stanley, and Citigroup all carry active crypto job listings; JPMorgan posted a Lead Software Engineer for blockchain infrastructure.
- Role Categories: Current demand centers on institutional trading, fund accounting, ETF market-making, digital asset compliance, and tokenization engineering – not R&D or innovation labs.
- Compensation Signal: BlackRock’s Managing Director crypto role is listed at $270,000–$350,000; global crypto salaries rose 18% year-over-year into 2025, with North America offering the highest base pay.
- Geographic Expansion: New York remains the primary hub, but Singapore crypto job listings surged 158% – signaling the institutional build is global, not domestic.
- What to Watch: Whether TradFi retention packages can outcompete token incentives from crypto-native firms – that tension determines how fast these desks actually scale.
Discover: The best crypto to diversify your portfolio with
What the Shift Actually Signals – and Why This Cycle Is Different From 2021
The last time Wall Street rushed into crypto jobs was 2021. That wave was driven by retail speculation, NFT hype, and internal pressure to appear innovative.
The 2022 FTX collapse and subsequent market crash wiped out more than 70% of crypto jobs globally – and most of those TradFi crypto units quietly dissolved with them.
This cycle is structurally different. The demand driver is regulated product infrastructure: spot Bitcoin ETFs, Ethereum ETFs, and the tokenization of real-world assets (RWAs).
BlackRock’s IBIT has generated historic AUM growth, and that volume demands middle-office expansion – reconciliation, fund accounting, reporting – roles that are operational, not experimental.

Sam Wellalage, founder of recruitment agency WorkInCrypto, put it plainly: “When I speak with CEOs from TradFi who are now building digital assets, they consistently say the same thing: Crypto will ultimately be integrated into TradFi, not exist separately.” That framing matters – integration implies permanent headcount, not rotating project teams.
The regulatory environment has accelerated the timeline. The Trump administration’s pro-crypto posture – light-touch regulation, an explicit goal of making the US the crypto capital of the world – has given compliance and legal teams the green light to build rather than wait. Regulatory clarity at the federal level is precisely what makes a permanent digital asset division viable inside a bank that answers to the SEC.
Wellalage flagged the skills threshold that will define the 2026 hiring class: “Institutional recruitment in 2026 will be about finding digital asset leaders who can operate at the intersection of capital, markets, and regulation – not just crypto enthusiasm.” That distinction – capital plus markets plus regulation, not enthusiasm – is what separates this buildout from the 2021 experiment.
Discover: The best pre-launch token sales
TradFi vs Crypto Desk: The Role Map
The talent pipeline runs in both directions, but the dominant flow right now is TradFi into institutional digital assets – and the role categories are specific. ETF market makers, crypto derivatives traders, digital asset compliance officers, tokenization engineers, and custody operations specialists are the positions drawing the most competitive offers.
BlackRock is staffing for senior portfolio and product roles that sit directly on top of IBIT’s operational infrastructure.
— Coin Bureau (@coinbureau) March 30, 2026
 NEW: BLACKROCK ADDS $350K HEAD DIGITAL ASSETS ROLE
BlackRock is recruiting a Managing Director of Digital Assets in NYC to lead its crypto, stablecoin, and tokenization strategy, reinforcing that crypto is now a core priority for Wall Street. pic.twitter.com/wCrEsxxknR
Goldman Sachs – which reported a significant uptick in clients trading crypto derivatives – is building on its existing trading desk capabilities. Citigroup posted a VP-level backend engineer for digital finance. JPMorgan, which launched its Onyx blockchain platform for tokenized assets in 2021, is now hiring lead engineers to scale that infrastructure rather than prototype it.
The skills that transfer cleanly from TradFi: fixed income structuring, derivatives risk management, fund accounting, regulatory compliance, and institutional sales. The skills that must be learned on the job: on-chain settlement mechanics, wallet custody architecture, tokenomics, and DeFi protocol risk – areas where crypto-native firms like Coinbase, Galaxy, and Grayscale still hold a decisive edge.
That edge is also a competitive threat. Platforms building permanent digital asset divisions – including exchange operators now operating under formal regulatory licenses – are drawing from the same talent pool as the bulge-bracket banks. The retention math favors whoever can offer the better blend of institutional prestige and upside exposure.
Compensation is already being used as a differentiator. Global crypto salaries rose 18% year-over-year into 2025. North America leads on base pay; Asia leads on growth rate, fueled in part by token grants. Singapore’s crypto job listings surged 158%, reflecting how aggressively regional hubs are competing for the same senior institutional profiles that New York firms are targeting.
The US Bureau of Labor Statistics projects 22% demand growth for blockchain developers by 2026 – outpacing average tech roles by a wide margin. With institutional adoption locking in through regulated ETFs and RWA platforms, that demand curve isn’t softening.
Discover: The Best Crypto Presales Live Right Now
The post BlackRock Is Paying $350,000 for Crypto Executives: Is Wall Street Digital Asset Takeover Just Getting Started? appeared first on Cryptonews.
Bitcoin remains pinned near the $66,500 area as buyers push to extend a recovery, but a chorus of bears continues to defend the line. The price action has traders watching a potential bullish pattern on the daily chart, with a clear test above the moving averages needed to propel a further advance. If bulls fail to sustain above the level, traders fear a slide back toward the mid-to-lower $60,000s, threatening the current setup and inviting renewed selling pressure.
On-chain and sentiment signals add nuance to the tape. CryptoQuant analyst Darkfost highlights that roughly 8.2 million BTC are currently in loss, a level that echoes the undervaluation seen during the prior bear market when losses topped around 10.6 million BTC. For some market observers, that provides a familiar framing: price recovery may be slow, but capitulation dynamics remain supportive of a longer-term bottom formation.
Yet not all technical voices agree on where the floor lies. Aksel Kibar, a Chartered Market Technician, warned that if the developing bearish pattern breaks down, BTC could slip to around $52,500, underscoring that the chart remains delicate and vulnerable to further downside unless fresh buyers step in.
Key voices shaping the narrative
Market pundits remain divided on how to interpret the current setup. Bloomberg Intelligence senior commodity strategist Mike McGlone has floated a bear-case scenario in which BTC could plunge toward the $10,000 level, a stark reminder that macro shocks and risk-off sentiment can quickly reshape risk assets. In a contrasting stance, ARK Invest chief executive Cathie Wood told CNBC that she does not anticipate an 85%–95% collapse from Bitcoin’s all-time highs, suggesting that the downside may be more bounded than some headlines imply.
Bitcoin price outlook
From a purely technical vantage, BTC’s next move hinges on how it interacts with key support and resistance rails. The daily chart shows price bouncing off major moving averages but facing persistent selling pressure near the $66,500 threshold. If the price closes decisively below the moving averages and the support zone around $60,000–$62,500, the chart pattern around the ascending triangle could be invalidated, potentially accelerating a pullback as speculative longs unwind.
Conversely, a sustained close above the moving averages would mark a bullish inflection, opening the path toward $72,000 and then toward $76,000. A breakout beyond $76,000 would relieve near-term resistance and could push BTC toward the $84,000 region, aligning with the pattern’s completion mechanics and fueling renewed enthusiasm among bulls.
Ether price outlook
Ether has failed to clear the $2,200 resistance, indicating that sellers remain resolute at the level. The chart shows flat moving averages and RSI hovering near the middle, suggesting a balanced tug-of-war with little clear advantage for either side. Traders expect the ETH/USD pair to oscillate roughly between $1,916 and $2,200 in the near term.
To tilt the balance in favor of buyers, ETH would need to sustain a move above $2,200, which could open the way to $2,400 and then $2,600. On the downside, a close below $1,916 would threaten a deeper pullback toward $1,750, where a more meaningful support cluster could form.
Altcoin snapshot: mixed signals across the top names
The broader cohort of high-capaltcoins reflects a landscape of competing forces, with several names hovering near critical levels that could determine the near-term trajectory.
BNB has turned down from resistance near the moving averages and sits near a solid $570 support. The path of least resistance appears downward while the 20-day exponential moving average hovers around $620 and RSI remains near oversold territory. A break of $570 could open the door to a potential slide toward $500, while a bounce above the moving averages might keep price in a range roughly between $570 and $687 for a few days more.
XRP is testing support near $1.27 after failing to sustain the bounce from the 20-day EMA around $1.36. A breakdown below $1.27 could invite a fall toward the February low near $1.11, with the lower bound of a descending-channel pattern offering another potential touchpoint near $1.00. A move above the moving averages could renew the drive toward $1.61 and the descending-channel resistance.
Solana has found itself pressed within a $76–$95 zone, with bulls likely to defend $76. A break below that level would raise the risk of a broader retreat toward $67 or even $50, while a renewed push above the moving averages could extend range-bound action and a back-and-forth rhythm in the near term.
Dogecoin is caught between the moving averages and a key $0.09 support, flagging a potential range expansion in the short term. A daily close below $0.09 would intensify selling pressure and could pull DOGE toward the $0.08 area, with a deeper drop toward $0.06 possible if bears take control. A close above the moving averages would set the stage for a run toward $0.10 and possibly $0.12.
Hyperliquid (HYPE) has been attempting a bounce off the 50-day simple moving average near $34.16, but the immediate challenge is a weakening momentum as the 20-day EMA around $37.10 turns down and the RSI retreats. A break below the 50-day SMA could pull the price toward the $29.42 level, while a move above the 20-day EMA would keep bulls in the driver’s seat and potentially push toward $41.59 and then $43.76.
Cardano’s ADA remains capped below the $0.25 resistance while holding above $0.23. The 20-day EMA sits around $0.25, and RSI remains bearish, suggesting further downside risk if the price breaks below $0.23 toward the $0.22 region and then the $0.18 support. A sustained move above the moving averages could re-activate a rally toward the downtrend line acting as a major hurdle for bulls to conquer.
Bitcoin Cash has slipped to around $443, a critical support, with bulls needing to defend this level. Any bounce faces selling pressures near the moving averages, while a breakdown could form a bearish head-and-shoulders pattern that targets the $375 zone. Conversely, a close above $486 could re-ignite upside toward the $520–$540 area.
Chainlink has traded in a tight band between roughly $8 and $10, signaling a balance of supply and demand. If buyers push above the moving averages, LINK could challenge $10, with a close above that level opening the door to roughly $10.94 and then $11.61. A break below $8 would raise the risk of a drop toward the $7.15 and $6 zones as bears gain traction.
What to watch next
In a market where multiple signals coexist, traders will be watching not only price action but also shifts in on-chain activity and macro risk sentiment. The immediate question is whether BTC can convincingly clear the moving-average hurdle and sustain a breakout, or whether the $60,000–$62,500 zone becomes a more durable magnet for prices. For Ether and the broader altcoin cohort, the next few sessions could determine whether the current ranges compress further or give way to more pronounced breakouts in either direction.
Readers should stay attuned to on-chain metrics that signal capitulation or accumulation, such as BTC’s loss exposure and the behavior of long-term holders, as well as any new insights from major market voices that can reinterpret risk appetite in the weeks ahead.
As these dynamics unfold, the path forward remains highly conditional on how price interacts with key technical levels, how macro risk sentiment evolves, and whether fresh capital returns to defend critical supports or pushes prices toward new milestones.

Key Highlights
- Reed Hastings, Netflix’s co-founder and board chair, offloaded $40.1M worth of NFLX shares on April 1, 2026
- The transaction involved 393,950 shares executed at prices spanning $95.02 to $96.66 per share
- Simultaneously, Hastings exercised stock options for 420,550 shares priced at merely $9.44 apiece
- Earlier in March, Hastings liquidated approximately $39M in Netflix stock, bringing his 2026 total to over $79M
- Wall Street maintains confidence with 41 analysts rating NFLX a Strong Buy and targeting $113.97 per share
On April 1, 2026, Reed Hastings—the visionary co-founder and current board chair of Netflix (NFLX)—executed a substantial stock divestiture worth $40.1 million. The transaction encompassed 393,950 shares distributed across several trades, with individual share prices fluctuating between $95.02 and $96.66.
Records filed with the Securities and Exchange Commission (SEC) confirm the shares were sold through open market transactions.
Concurrent with this divestiture, Hastings leveraged pre-existing stock options to purchase 420,550 NFLX shares at the remarkably low exercise price of $9.44 per share, representing a total outlay of roughly $3.97 million. Additionally, he obtained 654 shares through Non-Qualified Stock Options at $95.55 per share.
This marks a continuing pattern. Earlier on March 2, Hastings divested 410,000 Netflix shares, generating approximately $39 million in proceeds. Combined, his equity liquidations in 2026 have already surpassed $79 million within just one month’s timeframe.
These stock sales follow Netflix’s strategic withdrawal from its ambitious $82 billion acquisition attempt of Warner Bros. Discovery (WBD). After an extended competitive bidding process that included Paramount Skydance (PSKY) as a contender, Netflix ultimately abandoned its WBD takeover pursuit.
In the wake of that decision, Netflix implemented subscription price increases throughout its U.S. market.
Subscription Price Adjustments Catch Wall Street’s Eye
The ad-supported Standard subscription tier now carries an $8.99 monthly price tag. The ad-free Standard option has increased to $19.99, while the Premium tier has risen to $26.99 monthly.
Analysts from Needham project these pricing adjustments could generate approximately $1.7 billion in additional revenue, potentially accelerating North American growth metrics by roughly 300 basis points throughout fiscal 2026.
Major financial institutions including BofA Securities, Bernstein, and Needham have maintained bullish stances on the streaming giant, establishing price targets of $125, $115, and $120 respectively.
NFL Programming Expansion on the Horizon
Netflix is currently negotiating to double its NFL game package from two to four games annually. The streaming platform is pursuing additional time slots, including a Thanksgiving Eve broadcast and an internationally-based matchup.
These negotiations unfold as Netflix nears the conclusion of its three-year Christmas Day game agreement, which commanded approximately $75 million per game.
Citizens Bank recently launched coverage on NFLX with a Market Perform designation, acknowledging Netflix’s standing as the world’s second-largest streaming service provider.
Current analyst consensus reveals 41 Wall Street professionals covering NFLX maintain a Strong Buy recommendation—comprising 30 Buy ratings and 11 Hold ratings published within the preceding three months. The consensus price target stands at $113.97, suggesting potential upside of approximately 16% from present trading levels.


Opinion by: Ido Sofer, founder and CEO at Sodot.
The crypto industry is normally well ahead of its game when it comes to pure innovation and functionality, but security is a different matter.
For years, custody risk in crypto was defined by a single fear: the theft of private keys. The industry responded by hardening storage with cold storage, air-gapped systems, MPC and other methods. It then recognized that protecting only the keys is not enough, introducing transaction security and policies to prevent malicious transactions that steal funds, although the keys remain safe. Both of these remain a serious threat, but focusing solely on private keys obscures a deeper shift.
Custody itself has expanded far beyond private keys.
“Custody” once meant protecting private keys. That definition no longer reflects reality. Custody has evolved into a complex, automated system that operates different kinds of transactions, across multiple venues, custodians, vendors and internal systems. Modern trading firms operate across exchanges, staking platforms, liquidity venues and infrastructure providers, each with API keys, validator keys, deployment credentials and system-level secrets that can move capital directly or indirectly.
Many of these credentials are stored in secret managers that, by design, return the full key to any authenticated process. Convenient, yes, but structurally fragile. If the execution environment is compromised, either by an external attacker, an employee that was threatened or a malicious dependency, the full key is compromised. Custody risk has expanded beyond dormant on-chain keys into a live execution layer, where capital moves in milliseconds and exposure happens in real time.
The evolution of custody security
Custody security evolved in stages. First, the industry secured private keys in storage. It then moved beyond storage, embedding policy and multi-party controls to govern how those keys were used in execution. The next step is inevitable: apply the same zero-exposure and policy-driven discipline to every key and credential. In modern crypto operations, API keys, deployment credentials and execution secrets carry significant risk. Extending private key best practices across this broader surface is no longer optional; it is the defining challenge of execution risk.
In recent years, the execution risk has emerged as the single biggest vector for large-scale exploits. Cybercriminals are bypassing onchain security mechanisms in favor of the soft underbelly, namely the API keys, server credentials and other off-chain secrets needed to facilitate trading, code deployment, staking and custodial actions. Recent major breaches, including the Bybit hack, started with an off-chain hack and compromised credentials, which later led to on-chain loss of funds.
How big is the execution risk?
It’s big and structural. Asset managers, trading firms, custodians and payment companies connect to dozens of CEXs, DEXs, liquidity providers and other vendors simultaneously. Each integration introduces its own credentials, access controls and operational dependencies. Managing these spans across development, ops, trading, risk and security teams, which creates complexity that compounds over time.
Securing these operations is a never-ending struggle. Maintaining consistent security policies and multi-vendor access is a massive headache that’s largely manual, resulting in inevitable security gaps and configuration drift.
Related: Bitcoin is infrastructure, not digital gold
Execution risk is not inherent toautomation. It is a byproduct of how trading systems have historically been designed. In many centralized exchange environments, API keys and operational credentials are placed directly inside trading infrastructure to eliminate latency. For market makers and trading firms, speed is not a feature, it is the business model. Even marginal delay affects revenue.
Over time, full-key availability inside live systems became normalized as the simplest way to achieve high-performance execution. Credentials sit in a constant state of readiness so transactions can be authorized instantly. The issue is not that capital moves quickly. It is that unilateral authority is embedded inside operational infrastructure. And when authority is concentrated where execution happens, it becomes the most predictable attack vector.
Existing controls fall short
Existing tools fall far short of what’s required, considering the complexity of modern execution environments.
While crypto exchanges, custodians and over-the-counter trading desks certainly employ robust security policies for specific operations, it’s incredibly difficult for them to synchronize those controls across such a fragmented ecosystem. In fact, it’s almost impossible to maintain consistent governance across forty-odd exchanges for any length of time. Since it’s done manually, in silo, errors are inevitable, and a single mistake can put millions of dollars in value at risk.
There’s also the counterparty risk to consider. Exchanges and custodians may have their own vulnerabilities in the shape of bugs, misconfigured infrastructure and inconsistent policy enforcement mechanisms. If a trading firm’s internal security code requires geofencing, but one of the exchanges it’s connected to has a buggy implementation of that control, it creates a risk at the point of execution.
The risk is intolerable
The lesson the industry learned from private key security is clear: eliminate full key exposure and enforce strict policy controls around usage. Those principles must now extend beyond on-chain private keys to every credential capable of authorizing value movement.
The solution is not simply better secret storage. Secret managers were built for convenience; they return the full key to any authenticated process. In live execution environments, that model distributes authority to multiple components of the system at the very moment capital is in motion.
What is required is zero key exposure architecture systems where no single machine or employee ever holds unilateral control, combined with enforceable, context-aware policies governing how credentials are used. Multi-party computation (MPC) is one way to implement this model, but the principle is broader — expand private-key security best practices across the entire crypto execution layer.
Opinion by: Ido Sofer, founder and CEO at Sodot.
This opinion article presents the author’s expert view, and it may not reflect the views of Cointelegraph.com. This content has undergone editorial review to ensure clarity and relevance. Cointelegraph remains committed to transparent reporting and upholding the highest standards of journalism. Readers are encouraged to conduct their own research before taking any actions related to the company.

What does it take to get corporations into digital assets? According to Brad Garlinghouse, the formula is surprisingly simple.
The Ripple CEO just broke down the “secret sauce” behind Ripple Treasury. It’s an enterprise treasury management platform that lets businesses view and manage both fiat and digital assets (including XRP and RLUSD stablecoins) in a single, unified dashboard.
The Two-Ingredient Formula
Garlinghouse laid it out clearly. No complicated onboarding, no new systems to learn, and no juggling between separate platforms for fiat and crypto. Just one unified solution.
Fun Fact: Ripple Treasury facilitated $13 trillion in payments last year. That’s roughly half of the entire US GDP processed through a single treasury platform!
What Changed
Ripple Treasury just launched as the first Treasury Management System (TMS) with native digital asset capabilities. For CFOs, this means a single place to hold and manage both digital and fiat assets.
Renaat Ver Eecke, who leads Ripple Treasury (formerly GTreasury), explained the vision:
“From the moment GTreasury became Ripple Treasury, we’ve been building to this, giving Corporates a clear, trusted entry point into digital assets.”
The new features include Digital Asset Accounts and Unified Treasury. Corporate treasurers no longer need separate systems, separate logins, separate workflows. Everything lives in one place.
Ver Eecke outlined the roadmap: connecting to Ripple’s regulated payments network and prime brokerage. This will allow corporates to use digital assets and stablecoins for cross-border intercompany payments, earn yield on idle cash around the clock, and much more.
The key insight: Corporations don’t want to become crypto companies. They want to use crypto rails without changing their operations. Ripple Treasury meets them exactly where they are.
Ver Eecke summarized it bluntly: “Corporate treasury has never had a solution like this before.”
Ripple Has a Unique Value in the Enterprise Segment
Traditional treasury management is fragmented. Fiat accounts here, digital assets there, cross-border payments somewhere else. Every system requires its own processes, its own compliance checks, its own headaches.
Ripple Treasury collapses all of that into a single platform. Trusted. Regulated. Embedded in existing workflows.
For CFOs who have been watching crypto from the sidelines, waiting for an entry point that doesn’t require rebuilding their entire infrastructure, this is it. The friction is gone.
Garlinghouse called it the secret sauce. Looking at $13 trillion in volume and native digital asset capabilities, the recipe seems to be working.
The post Ripple CEO Reveals the Secret Behind Its Crypto and Fiat Treasury System appeared first on BeInCrypto.
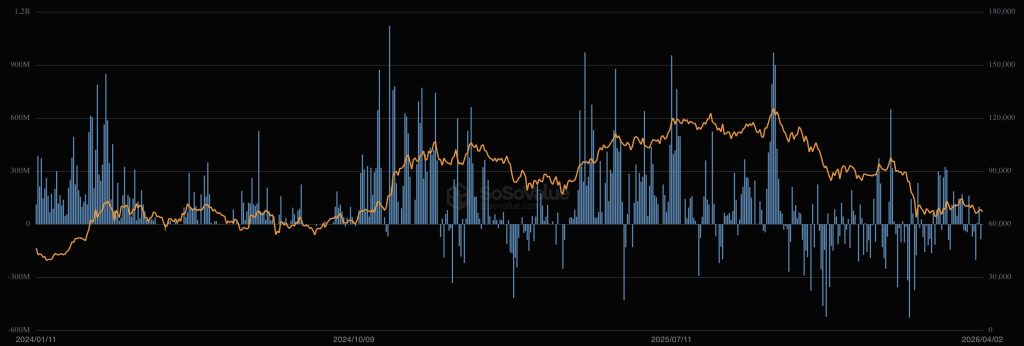
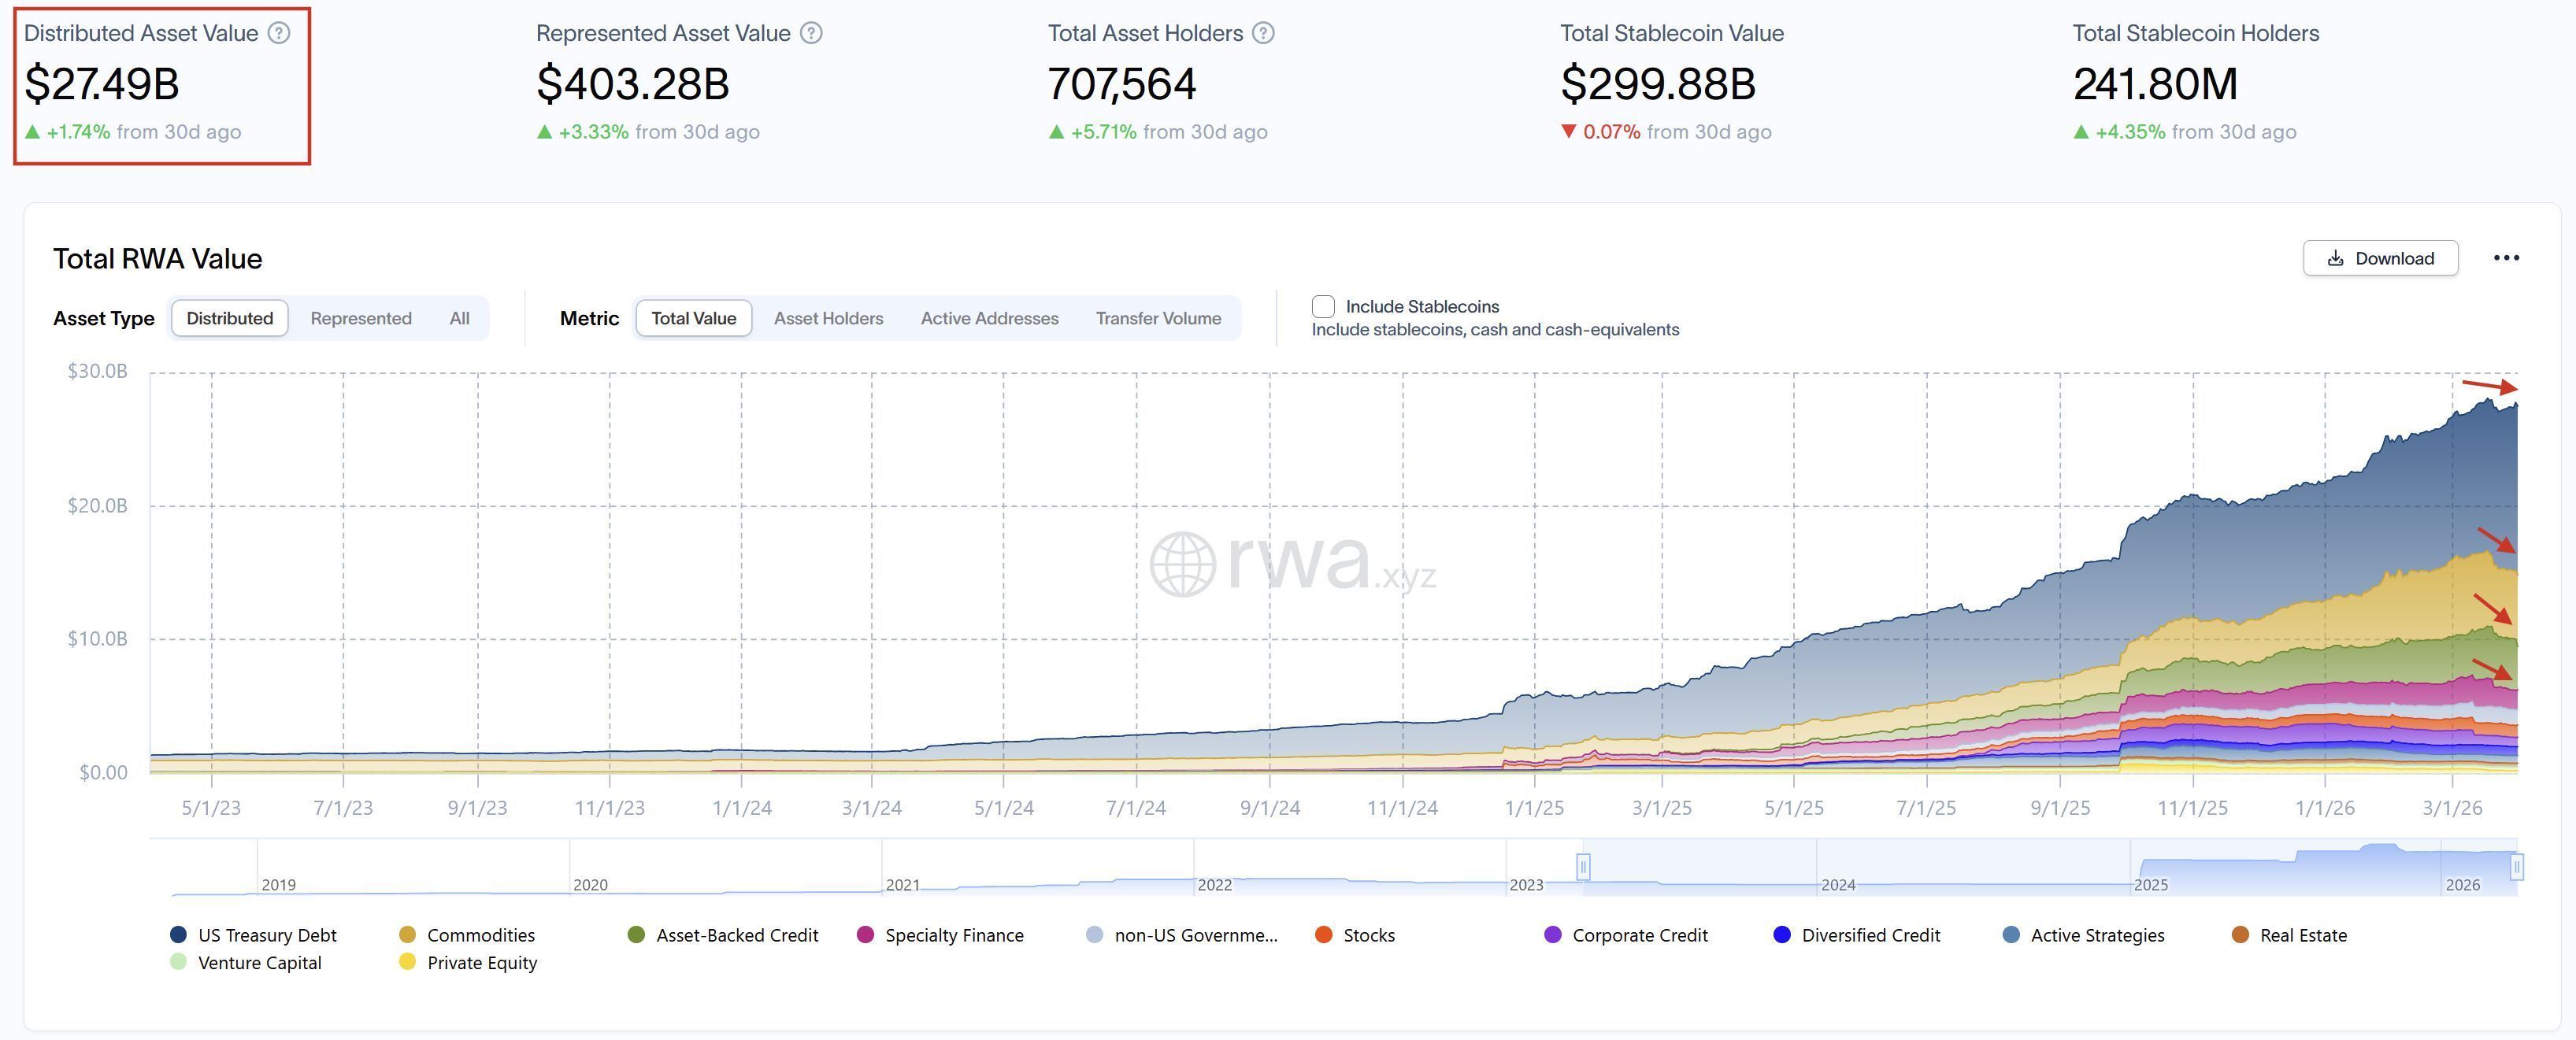
After months of continuous growth, the RWA sector is showing its first signs of a slowdown.
Distributed asset value sits at $27.49 billion with only 1.74% growth over the past 30 days. Stablecoins even recorded a slight decline.
RWA Growth is Dying Out
Current data from RWA.xyz shows the following picture:
- Distributed Asset Value: $27.49 billion, up 1.74% in a month.
- Represented Asset Value: $403.28 billion, up 3.33%.
- Total Asset Holders: 707,564, up 5.7%.
- Total Stablecoin Value: $299.88 billion, down 0.07%.
- Total Stablecoin Holders: 241.80 million, up 4.35%.
The number of holders continues to grow, but the value is not keeping pace. New market participants are entering, but bringing less fresh capital than in previous months.
Fun Fact: Despite the slowdown, RWA distributed value has grown from under $5 billion in early 2024 to nearly $28 billion today. The long-term trend remains intact!
Which RWA Segments Are Cooling
Several asset categories are contributing to the slowdown:
- Commodities: Gold prices have stagnated, and tokenized gold follows the underlying asset.
- US Treasuries: Still the largest segment in the RWA market, but momentum has flattened. Initial demand for tokenized T-bills appears to be stabilizing.
- Stocks and Asset-Backed Credit: Both categories are also showing reduced growth.
The chart from RWA.xyz displays a clear pattern: explosive growth through 2024 and into early 2025, followed by a gradual flattening in recent months.
A monthly growth rate of 1.74% does not constitute a crash. Annualized, that still represents over 20% growth.
However, compared to the triple-digit percentage gains the RWA sector recorded in 2024, the deceleration is clearly visible.
The slight 0.07% decline in stablecoins deserves particular attention. Stablecoins often serve as an entry point into tokenized assets. A shrinking pool may indicate reduced on-chain activity.
On the positive side: asset holders grew by 5.71%. New participants continue to enter the market, though with more cautious capital allocation.
The RWA sector appears to be entering a phase of normalization following a period of strong growth. Whether this represents a temporary consolidation or the beginning of a longer trend remains to be seen in the coming months.
The post Why the RWA Market Is Slowing Down: Is the Boom Over? appeared first on BeInCrypto.
Corporate Bitcoin (BTC) holders are diverging into two distinct paths amid continued market pressure. While Strategy held steady on its massive BTC reserves, Nakamoto Holdings moved in the opposite direction, selling at a loss and trimming exposure as it reworks its balance sheet.
The contrast highlights a growing divide in the corporate Bitcoin treasury model. Some holders have refused to sell, treating BTC as a long-term reserve asset and doubling down through volatility, while others are being forced to unlock liquidity, book losses or rethink capital allocation.
With Bitcoin down 46% from its peak, the risks behind debt-fueled or aggressive buying strategies are becoming harder to ignore.
Elsewhere, a proposed Bitcoin-backed municipal bond in New Hampshire is moving closer to issuance. It has now received a speculative-grade rating from Moody’s, underscoring both the appeal and the risks of tying public financing to digital assets.
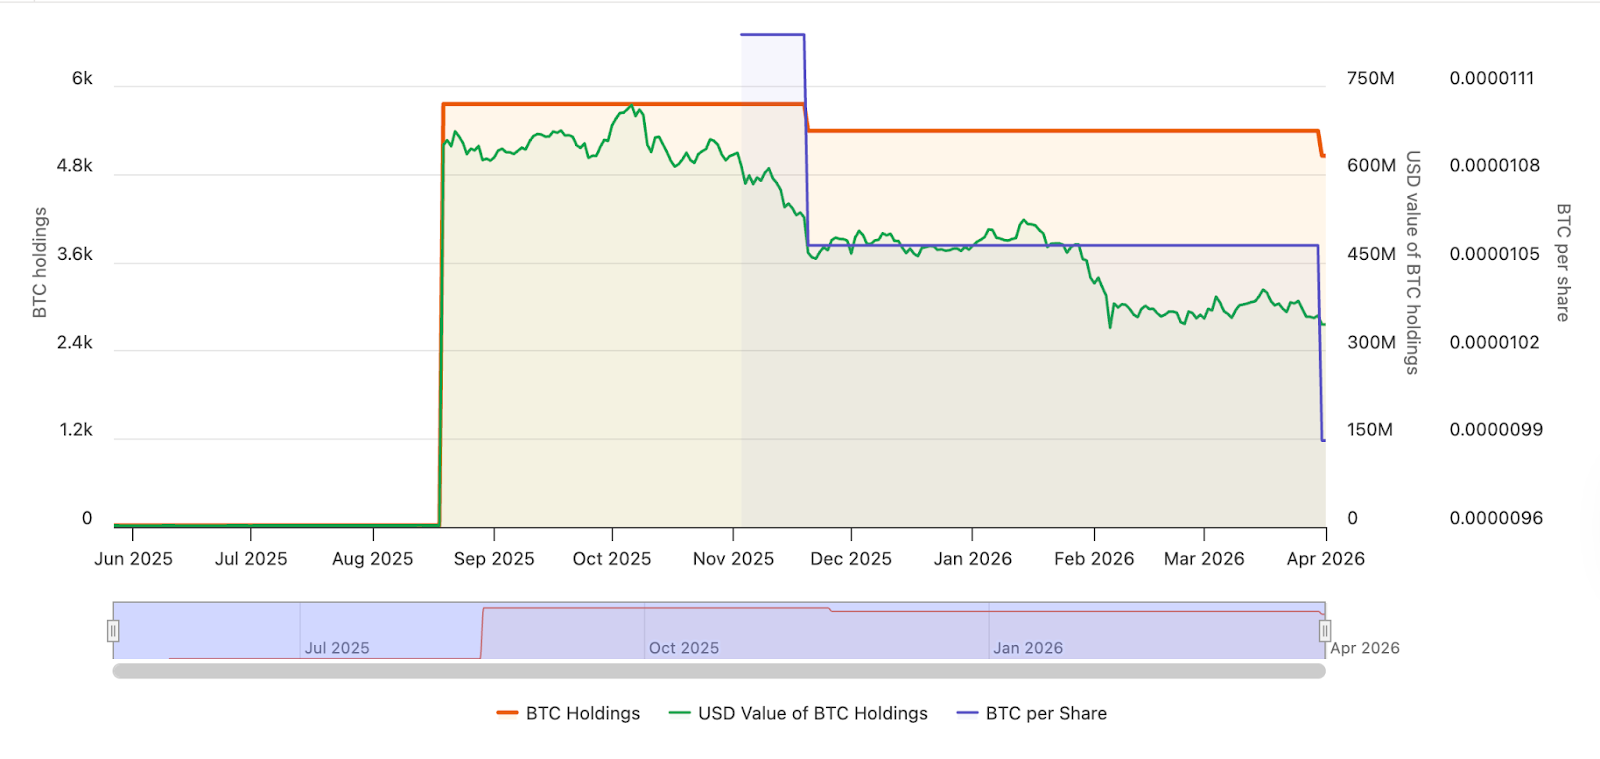
Nakamoto realizes losses as Bitcoin treasury model comes under pressure
Bitcoin treasury company Nakamoto Holdings sold roughly $20 million worth of Bitcoin in March, executing the sale at prices well below its prior acquisition costs. The transaction reduced its holdings to just over 5,000 BTC and marked a shift from unrealized to realized losses.
The company sold approximately 284 BTC at around $70,400 per coin, significantly less than its average purchase price. The proceeds were earmarked for working capital and business investments tied to recent mergers.
Alongside the crypto sale, Nakamoto also cut its equity exposure to Japanese company Metaplanet, selling millions of shares at a loss. The moves point to a broader balance-sheet reset as digital asset treasury companies come under pressure.

Strategy pauses Bitcoin buys, keeps its treasury intact
Michael Saylor’s Strategy broke a months-long pattern of steady Bitcoin accumulation, reporting no purchases during the latest weekly disclosure period.
The pause stands out because Strategy has maintained consistent buying as a core part of its corporate identity and capital strategy, especially during the recent market downtrend that has seen Bitcoin fall from $120,000 to below $70,000.
Weekly disclosures have become a signal for institutional demand, and even a temporary halt could suggest squeamishness over market conditions, capital availability or the pace of buying. Strategy still holds roughly 762,000 BTC, maintaining its position as the largest corporate holder of the asset.

New Hampshire Bitcoin-backed bond inches toward reality after Moody’s rating
A proposed Bitcoin-backed municipal bond in New Hampshire has moved a step closer to issuance after receiving a Ba2 rating, below investment grade, from Moody’s. The structure would give investors exposure to Bitcoin-linked returns within a public finance framework, with proceeds expected to support public infrastructure and development projects.
The planned issuance, reportedly around $100 million, would be backed by Bitcoin collateral rather than traditional tax revenues. Repayments would depend on returns from that collateral, introducing a new approach that ties crypto markets to municipal borrowing.

CoinShares debuts on Nasdaq following SPAC deal
Digital asset manager CoinShares launched on the Nasdaq on Wednesday following a merger with special purpose acquisition company Vine Hill Capital, marking another step in bringing crypto-native companies to US public markets.
The deal gives CoinShares access to a broader investor base and deeper capital markets, while offering public market investors exposure to a company focused on digital asset products and infrastructure. SPAC structures have remained a viable route for crypto companies seeking listings despite shifting market conditions.
As Cointelegraph previously reported, the SPAC merger valued CoinShares at roughly $1.2 billion.
Crypto Biz is your weekly pulse on the business behind blockchain and crypto, delivered directly to your inbox every Thursday.

Price Predictions for BTC, ETH, BNB, XRP, SOL, DOGE, HYPE, ADA, BCH, LINK

Dave Filoni Wanted Star Wars’ New Series to Be a “Pulpy Noir” [Exclusive]

Lifeboat, coastguard, helicopter rescue at Flamborough Head


-

 NewsBeat7 days ago
The Story hosts event on Durham’s historic registers
-

 NewsBeat22 hours ago
Steven Gerrard disagrees with Gary Neville over ‘shock’ Chelsea and Arsenal claim | Football
-

 Sports7 days ago
Sweet Sixteen Game Thread: Tide vs Michigan
-
Entertainment4 days ago
Fans slam 'heartbreaking' Barbie Dream Fest convention debacle with 'cardboard cutout' experience
-

 Business17 hours ago
No Jackpot Winner and $194 Million Prize Rolls Over
-

 Crypto World2 days ago
Gold Price Prediction: Worst Month in 17 Years fo Save Haven Rock
-
 Entertainment6 days ago
Lana Del Rey Celebrates Her Husband’s 51st Birthday In New Post
-

 Tech5 days ago
The Pixel 10a doesn’t have a camera bump, and it’s great
-
Crypto World3 days ago
Dems press CFTC, ethics board on prediction-market insider trades
-

 Tech5 days ago
Avatar Legends: The Fighting Game comes out in July and it looks pretty slick
-

 Sports3 days ago
Tallest college basketball player ever, standing at 7-foot-9, entering transfer portal
-

 Tech3 days ago
EE TV is using AI to help you find something to watch
-

 Fashion6 days ago
Amazon Sundays: Soft Spring Layers
-

 Business2 days ago
Login and Checkout Issues Spark Merchant Frustration
-

 Fashion7 days ago
When Evening Dressing Gets Colorful for Spring
-

 Tech5 days ago
Elon Musk’s last co-founder reportedly leaves xAI
-

 Tech3 days ago
How to back up your iPhone & iPad to your Mac before something goes wrong
-

 Tech4 days ago
Apple will hide your email address from apps and websites, but not cops
-

 Politics4 days ago
Should Trump Be Scared Strait?
-

 Crypto World4 days ago
U.S. rule change may open trillions in 401(k) funds to crypto
You must be logged in to post a comment Login