
Crypto World
Bitcoin Crashes to $63K as US, Israel Bomb Iran
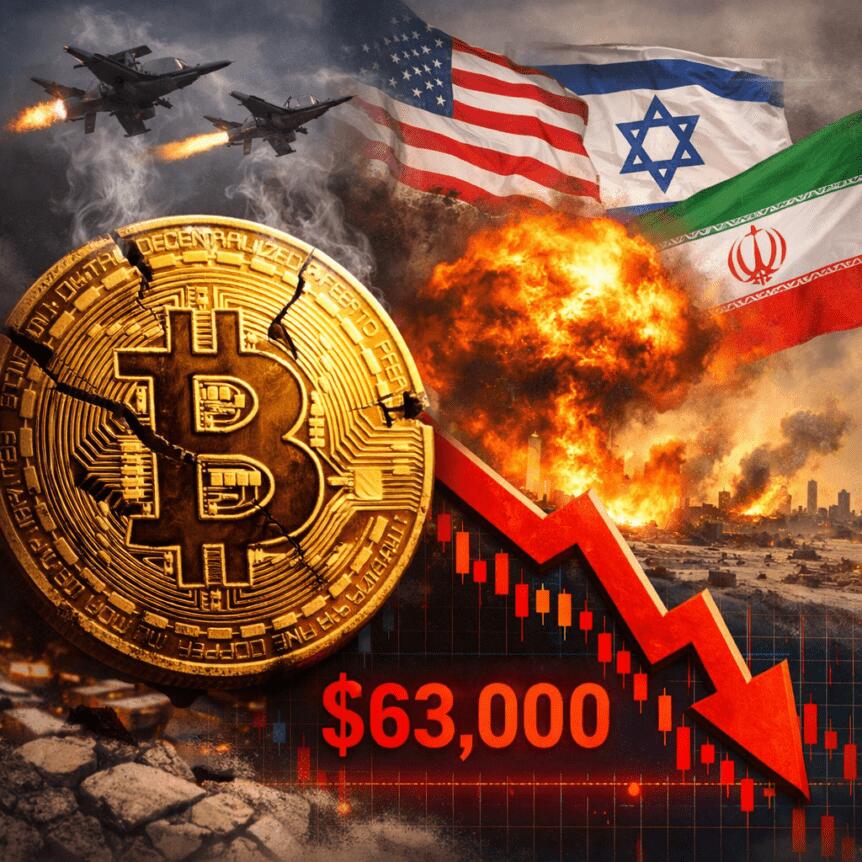
Bitcoin (CRYPTO: BTC) faced renewed geopolitical turbulence over the weekend as reports of a joint U.S.-Israel operation targeting Iran intensified market chatter. The move came as traditional markets remained in a holding pattern, leaving crypto traders to assess the implications in a vacuum. On Saturday, BTC slid toward the lower end of a key trading band, briefly testing the $63,000 region as investors weighed the potential fallout from a campaign aimed at Iran’s nuclear infrastructure. The timing coincided with a quiet moment in traditional markets, where futures and other risk assets had not yet resumed full trading, underscoring how crypto can move on its own schedule during periods of geopolitical stress.
Key takeaways
- BTC traded around the mid-$60,000s, probing the $63,000 level as weekend escalation unfolded and U.S. and Israeli actions were reported against Iran.
- Liquidations tied to the move surpassed $250 million within a four-hour window, highlighting heightened risk-off dynamics within crypto despite a pause in broader market activity.
- Trump’s remarks—calling on Iranians to take over their government after describing the objective as targeting Iran’s nuclear infrastructure—added a political overlay to the headline-led move.
- Crypto markets moved independently of TradFi during the period, with traditional market activity disrupted or delayed, amplifying a crypto-driven narrative around safe-haven + risk-off tension.
- Historical echoes surfaced in trading chatter, referencing prior Iran-related shocks in 2025 that produced outsized volatility across crypto and risk assets, a pattern that some traders cited as context for the current reaction.
Tickers mentioned: $BTC
Sentiment: Neutral
Price impact: Negative. The weekend developments contributed to a near-4% drop and a test of notable support around the $63,000 area.
Trading idea (Not Financial Advice): Hold. Price action remains within a framework of key support and the potential for a renewed test of higher levels will hinge on evolving geopolitical signals and macro cues.
Market context: The episode underscored how geopolitics can drive crypto-specific volatility even when traditional markets are quiet or paused, with liquidity dynamics shaping the immediate response and sentiment.
Why it matters
The unfolding weekend episode reinforces the role of Bitcoin as a potential nonlinear reaction to geopolitical stress. While equities and other traditional assets were not fully pricing in the latest headlines, BTC moved with a decisive tilt, testing an important round-number barrier and illustrating how market participants treat crypto as a distinct risk-on/risk-off instrument during times of international tension. The magnitude of intraday liquidations—reported to exceed $250 million in a short span—highlights the rapid, leveraged dynamics that can accompany sudden shifts in sentiment, even when broader markets remain comparatively subdued.
Beyond the immediate price action, the incident raises questions about liquidity and correlation in the current macro environment. The absence or delay of traditional market participation on the weekend left a vacuum that crypto markets often fill with their own narratives, sometimes amplifying moves beyond what fundamentals would suggest. The juxtaposition of a hawkish geopolitical headline with a crypto market that has recently faced a prolonged drawdown in prior cycles adds texture to the analysis of BTC’s resilience near blocks of support, including around the $60,000 level that traders view as a psychological and technical hinge in this cycle.
The episode also nods to a broader history of Iran-related shocks in the crypto space. A notable note from observers cited a previous Iran-focused episode in 2025 that sparked a surge in volatility across risk assets—an echo that keeps some traders attentive to the potential for follow-through moves as headlines evolve. In this sense, the latest escalation becomes part of a longer-running narrative about how geopolitical risk translates into crypto-specific dynamics, particularly as markets approach monthly or quarterly closes where liquidity and risk sentiment can tighten further.
Against this backdrop, traders remained mindful of the broader inflation and macro data cycle that can compound or cap spikes in volatility. Prior to the weekend move, hot U.S. inflation data had already given Bitcoin bulls a reason to tread carefully, underscoring that price resilience often coexists with a fragile narrative around sustained upside. The combination of a fresh geopolitical shock and sticky inflation metrics paints a complex picture for BTC, where sharp short-term moves coexist with a longer arc of price discovery that is still trying to chart a sustainable path above key support levels.
As the situation evolved, the narrative around Bitcoin’s behavior during geopolitical flare-ups continued to gain traction. Analysts emphasized the importance of monitoring $63,000 as a test point—an inflection that, if held, could set the stage for a cautious rebound or a renewed consolidation. Conversely, a break of that level would invite a fresh wave of risk-off selling and raise the possibility of retesting lower cushions established earlier in the year, particularly given the sensitive macro backdrop and ongoing concerns about liquidity if volatility persists into the February close.
On the ground, observers also noted the role of media framing and social chatter in shaping short-term expectations. A post from political commentators and market analysts alike threaded together the weekend’s headlines with the technical narrative, underscoring how crypto markets continue to operate at the confluence of macro, policy, and technology-driven factors. The result is a market environment where BTC can diverge from traditional assets for stretches, but remains tethered to the same fundamentals that govern risk appetite, funding conditions, and liquidity availability as traders size up the next significant catalyst.
What to watch next
- February monthly close: Watch for whether BTC can defend the $60,000–$63,000 range or if a break below sharpens the downside bias.
- Geopolitical updates: Any new statements or actions from the U.S. or allied governments, and Iran’s official responses, could redraw the risk landscape for crypto markets.
- Liquidity metrics: Monitor liquidity flows and liquidation data from trackers like CoinGlass as markets digest new headlines and potential policy signals.
- Regulatory signals: Any regulatory commentary or policy signals that could affect crypto markets in the wake of geopolitical events.
Sources & verification
- BTC price action near $63,000 and intraday dynamics as reported by market data aggregators (e.g., TradingView) for BTCUSD.
- Public statements from U.S. President Donald Trump regarding the weekend operation and his remarks about Iran.
- Liquidation data tracked by market observatories (CoinGlass) during the four-hour window cited.
- Analysis and context provided by commentators referencing the Kobeissi Letter and its remarks on related Iran-related episodes.
- Historical references to prior Iran-related events affecting crypto and risk assets, including related coverage from Cointelegraph.
Geopolitical shock and Bitcoin’s path
Bitcoin (CRYPTO: BTC) moved to absorb fresh geopolitical headlines as a joint U.S.-Israel operation targeted Iran’s nuclear infrastructure. In the immediate aftermath, price action suggested a cautious mood among traders: the asset hovered near the upper mid-range before dipping toward support levels, with the market registering a roughly four-percent decline in intraday trading. Data from market trackers captured a considerable liquidation footprint—more than $250 million in a four-hour window—underscoring how liquidity can ebb and flow in response to headlines even when traditional markets are less active.
The weekend narrative was further shaped by political signals. A video message from U.S. President Donald Trump contained a dual aim: to describe the operation’s objective as targeting nuclear infrastructure while urging Iranians to “take over your government.” The message added a layer of political risk to an already delicate market environment, illustrating how policy chatter can intersect with price dynamics in crypto markets that are increasingly sensitive to headline risk.
In market commentary, observers noted that crypto markets were effectively operating in isolation as TradFi trading hours were unsettled or paused. This was a period where BTC moved independently of equity futures and other traditional benchmarks, a pattern that some analysts attribute to the asset’s ongoing role as a non-sovereign store of value during times of geopolitical strain. Yet even with a certain degree of independence, BTC’s trajectory remained tethered to the broader macro narrative—specifically, how inflation data and risk sentiment evolve in the days ahead and whether the market can defend key technical fortresses near $60,000.
The historical angle remains salient. Some market watchers pointed to a prior Iran-related episode in 2025 that produced a pronounced risk-off response across crypto and traditional assets, illustrating how geopolitical shocks can imprint a multi-month pattern on price action. While this does not define a forecast, it provides context for current traders who monitor the interplay between headlines, liquidity, and the delicate balance between risk-on and risk-off dynamics at a time when the February close looms.
As the near-term narrative unfolds, the market context remains one of cautious navigation. The combination of geopolitical catalysts, inflation dynamics, and the fragility of intraday liquidity means investors are watching not just the immediate price moves but the persistence of support levels that have held in prior tests. The coming days will reveal whether BTC’s reaction to the weekend headlines translates into a broader shift in momentum or a temporary pause as traders reassess risk preferences ahead of the next macro and policy updates.


TLDR
- JPMorgan CFO Jeremy Barnum warned that stablecoins could become a form of regulatory arbitrage under inconsistent rules.
- He stated that some stablecoin models may replicate bank-like products without adhering to traditional banking safeguards.
- Barnum emphasized that equal regulation for similar financial products is necessary to prevent an uneven competitive environment.
- He noted that yield-bearing stablecoins could resemble bank deposits while avoiding capital and liquidity requirements.
- Coinbase has advocated for the ability to pass interest earned on reserve assets to stablecoin holders.
JPMorgan Chase Chief Financial Officer Jeremy Barnum warned that stablecoins could become regulatory arbitrage tools under uneven rules. He spoke during the bank’s first-quarter earnings call on Tuesday. He said inconsistent oversight could let firms replicate banking products without meeting banking standards.
Stablecoins and Regulatory Standards
Barnum framed the issue as a matter of oversight rather than technology change. He said some stablecoin structures could mirror deposit products without similar safeguards. He warned that uneven rules could create regulatory arbitrage.
“If the same product isn’t regulated the same way, you open the door to arbitrage,” Barnum said. He added that some models offer rewards that resemble yield to customers. He said firms could “run a bank” without core banking regulations in that case.
Lawmakers continue to review digital asset legislation in Washington, D.C. The proposed Clarity Act seeks to define oversight between the Securities and Exchange Commission and the Commodity Futures Trading Commission. The bill also aims to clarify rules for stablecoins and related services.
The debate also centers on whether issuers can pass reserve interest to holders. Coinbase has urged lawmakers to allow yield distribution on stablecoin reserves. The company argues that interest sharing would improve utility as a savings product.
Banks oppose yield-bearing stablecoins under current frameworks. They argue that such products resemble deposits but avoid capital and liquidity requirements. They also say non-bank firms could attract funds by offering returns that banks cannot provide.
Barnum said JPMorgan supports clear digital asset rules. However, he stressed that consistency matters more than speed in policymaking. He warned that gaps could allow new entrants to operate outside existing boundaries.
JPMorgan Earnings and Digital Infrastructure
Barnum downplayed threats to JPMorgan’s core payments operations. He said the bank already runs a large wholesale payments network. He added that it processes transactions quickly and at low cost.
Instead, JPMorgan continues to build blockchain-based tools within its infrastructure. Through its Kinexys unit, the bank developed JPM Coin and tokenized deposits. These tools allow institutional clients to move funds around the clock.
Barnum described these efforts as part of modernization plans. He said programmable payments now integrate into existing systems. He stated that these features complement rather than replace traditional services.
On consumer products, Barnum addressed compliance requirements. He said stablecoins often appear as digital cash in public discussion. However, he stressed that identity checks and compliance rules still apply.
JPMorgan reported strong first-quarter financial results. Net income rose 13% year over year to $16.49 billion. Revenue increased 10% to $50.54 billion.

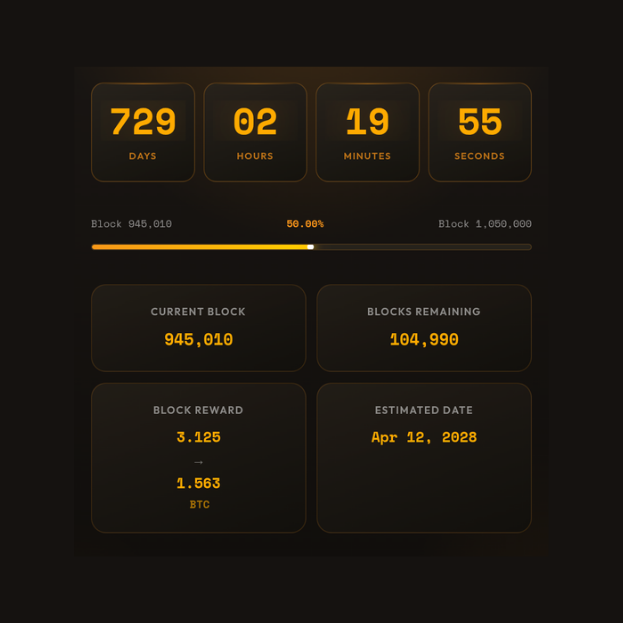
The countdown to Bitcoin’s next halving has reached its midpoint. Approximately 105,000 blocks remain before block rewards are cut in half again.
The Bitcoin network is now halfway through the current halving cycle that began in April 2024. When the network reaches block 1,050,000, estimated for April 2028, the block reward will drop from 3.125 BTC to 1.5625 BTC per block.
What the Bitcoin Halving Milestone Means for Supply
Each halving reduces the rate at which new Bitcoin enters circulation. Currently, miners produce approximately 450 BTC per day. After the 2028 halving, daily issuance will drop to roughly 225 BTC.
The halving mechanism is hardcoded into Bitcoin’s protocol and occurs every 210,000 blocks, approximately every four years. This predictable supply schedule is central to Bitcoin’s value proposition as a scarce digital asset.
With approximately 19.7 million Bitcoin already mined out of the maximum 21 million supply, halvings become increasingly significant for the remaining issuance. More than 98% of all Bitcoin will be mined by 2030.

Historical Bitcoin Halving Price Performance
Previous halvings have preceded significant price increases, though the magnitude of gains has diminished with each cycle. The pattern has made halving events closely watched by investors.
The first halving in November 2012 reduced rewards from 50 BTC to 25 BTC. The second halving in July 2016 cut rewards to 12.5 BTC. The third halving in May 2020 reduced rewards to 6.25 BTC. The most recent halving in April 2024 brought rewards down to the current 3.125 BTC.
In each case, Bitcoin’s largest price moves occurred 12 to 18 months after the halving event. However, past performance does not guarantee future results, and market conditions vary significantly between cycles.
This Cycle Is Different Due to ETF Demand
The 2024 to 2028 halving cycle differs fundamentally from previous cycles. Spot Bitcoin ETFs in the United States now hold over 1.3 million BTC, worth approximately $92 billion at current prices.
This institutional demand creates a structural floor that did not exist in prior cycles. ETF investors tend to be longer term holders, including financial advisors, pension funds, and family offices building portfolio allocations.
Meanwhile, Strategy continues accumulating Bitcoin at a pace that exceeds new mining supply. The company now holds over 780,000 BTC and absorbs more Bitcoin monthly than miners produce.
The combination of reduced new supply and sustained institutional demand could amplify the supply and demand dynamics that have historically driven post halving price appreciation.
Two Years Until the Next Bitcoin Halving
With the countdown now at 50%, approximately two years remain until the fifth Bitcoin halving. The exact date continues to shift based on mining difficulty and network hashrate changes.
Current estimates place the halving in April 2028, though projections range from March to May depending on the data source. The network targets a 10 minute block time on average, but actual block times vary.
For miners, the approaching halving means another reduction in revenue per block. Mining operations must continue optimizing costs through more efficient hardware and cheaper electricity to remain profitable after the reward cut.
The halving countdown serves as a reminder of Bitcoin’s fixed monetary policy. Unlike fiat currencies where central banks can adjust supply at will, Bitcoin’s issuance schedule is transparent and unchangeable.
The post Bitcoin Halving 2028 Is Now 50% Complete appeared first on BeInCrypto.

The Bitcoin network is now more than halfway (50.01%) through its current halving cycle, with the next halving expected on April 12, 2028, just under two years away, according to mempool.space.
This cycle, known as “epoch 5”, which began in April 2024 and will continue through to 2028.
A halving occurs every 210,000 blocks, roughly every four years, and reduces the reward miners receive by 50%.
This process controls bitcoin’s issuance and ensures a predictable decline in its inflation rate (currently under 1%). In the current epoch, the block subsidy is 3.125 BTC per block. With blocks mined on average every 10 minutes, around 450 BTC are issued daily.
This 10 minute schedule is maintained through difficulty adjustments, which occur every 2,016 blocks. The network increases or decreases mining difficulty depending on how quickly blocks are found, keeping issuance consistent.
With approximately 104,986 blocks remaining in this cycle, bitcoin’s supply continues its dependable path toward its fixed cap. Each new epoch further reduces issuance and its inflation rate, reinforcing its long term scarcity.
Bitcoin has a fixed maximum supply of 21,000,000 coins, one of its main characteristics which underpins its scarcity. Recently, the network reached a major milestone as the 20 millionth bitcoin was mined, meaning the final million will take another 114 years to mine.
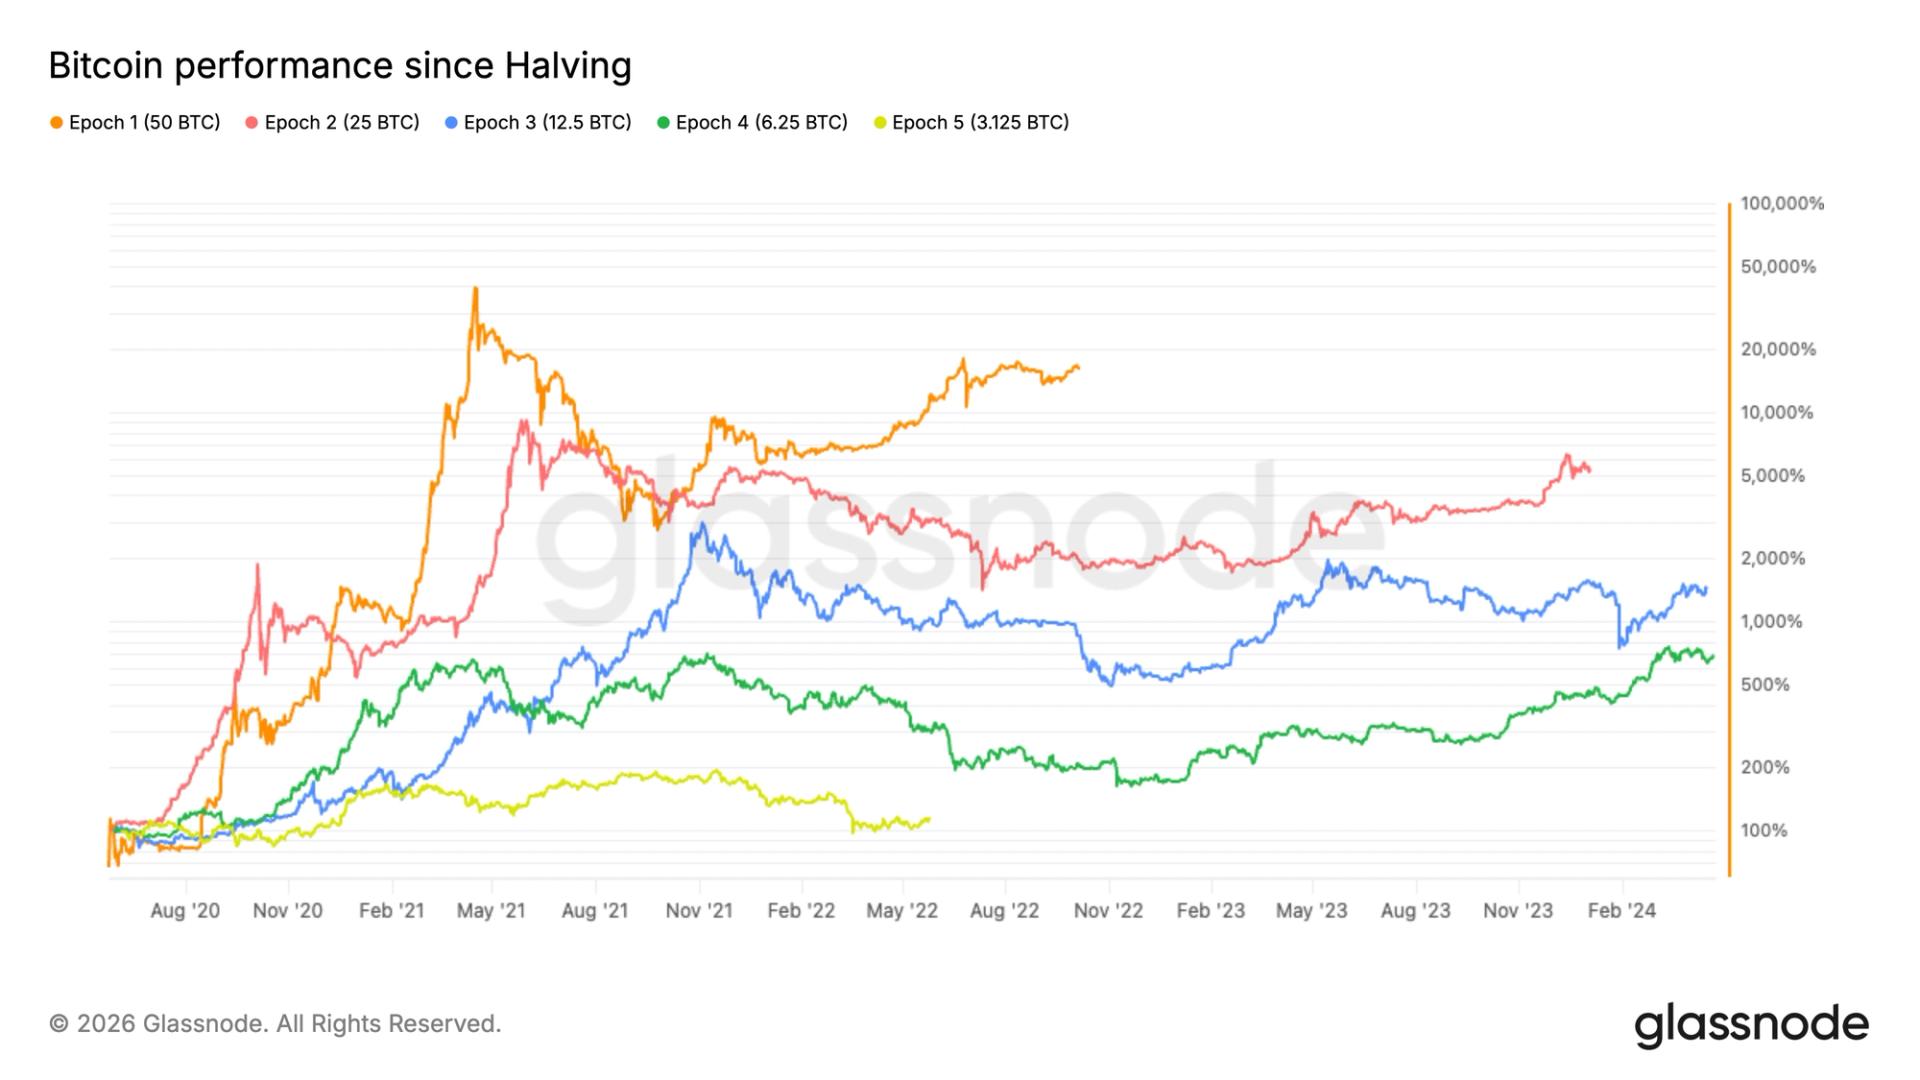
Bitcoin post-halving gains lag prior cycles
Bitcoin is up around 15% since the April 2024 halving, rising from roughly $64,000 to just under $75,000. Previously reached an all time high of around $126,000 in October 2025 before falling roughly 50% to $60,000 in early February.
However, it has underperformed previous cycles over the same post-halving period, continuing the trend of diminishing returns, according to Glassnode data.
This is largely expected as bitcoin matures, with greater adoption and a larger market cap requiring more capital to drive outsized gains. As a result, volatility is declining each cycle and price action is becoming more gradual compared to earlier cycles.


The Stripe-backed Tempo blockchain gained a pair of heavyweight validators in Visa (V) and Zodia Custody, the crypto custodian majority owned by Standard Chartered (STAN).
Alongside Stripe, Visa and Zodia will participate in the Tempo blockchain by maintaining network security and verifying transactions.
Visa, a long-time collaborator of the payments services provider, configured and managed the validator node entirely in-house, following six months of joint work with Tempo’s engineering team to integrate the card giant’s infrastructure directly into the blockchain, according to a press release.
Visa plans to run nodes on some other blockchains following the Tempo integration. The card network had previously said it will join the Canton Network, where there are plans to serve as a “Super Validator.”
For the past seven years or so, Visa’s blockchain engineers have been “living and breathing stablecoins,” said the head of Visa’s crypto team, Cuy Sheffield. Now the focus is on supporting the evolution of new payment flows such as machine-to-machine commerce using AI agents, he added.
“We’ve been an early design partner, working very closely with the Tempo team, looking at designing infrastructure that can support many types of new payment flows, and particularly agentic payment flows,” Sheffield said in an interview with CoinDesk.
Tempo, which is also backed by crypto investment firm Paradigm, went live last month with Machine Payments Protocol (MPP), a protocol that lets software and AI agents pay for services autonomously.
“Visa is a big part of MPP,” Sheffield said. “We added the MPP card spec. We announced Visa CLI, which is a wallet that is built on top of MPP where agents can use a Visa card to be able to spend. So we’ve been deeply involved in the Tempo and the MPP ecosystem, and now we’re running the underlying infrastructure on Tempo.”
There’s no doubting Stripe’s conviction when it comes to assembling an end-to-end blockchain-based system for stablecoin payments. But, taking a step back, some people might question how open and decentralized such a system is.
Sheffield, in response, said Visa is simply being pragmatic, looking for products that can drive payment volume.
“Our view has always been that decentralization is a spectrum,” Sheffield said. “There are many use cases where decentralization for the sake of decentralization doesn’t solve a problem. I think we’re now entering a phase in the crypto industry where decentralization is not the primary value prop. It’s whether a new payment infrastructure is fast, efficient, programmable and can outperform some existing payment infrastructure for certain use cases.”
Stripe moved into the stablecoin industry when it acquired stablecoin specialist Bridge for $1.1 billion in 2024. Earlier this year, Mastercard made a similar move, buying stablecoin firm BVNK for $1.8 billion.
Asked if Visa had any plans to offer its own stablecoin, Sheffield said:
“It’s so early and the rules haven’t even been fully written yet. We spent a bunch of time with the OCC (Office of the Comptroller of the Currency) and others,” he said. “I think there are many different roles that Visa can play, but everything we do, we want to make sure that we’re doing it in partnership with our clients and our network.”
UPDATE (April 14, 14:16 UTC): Rewrites headline, first paragraph to include reference to Zodia Custody.
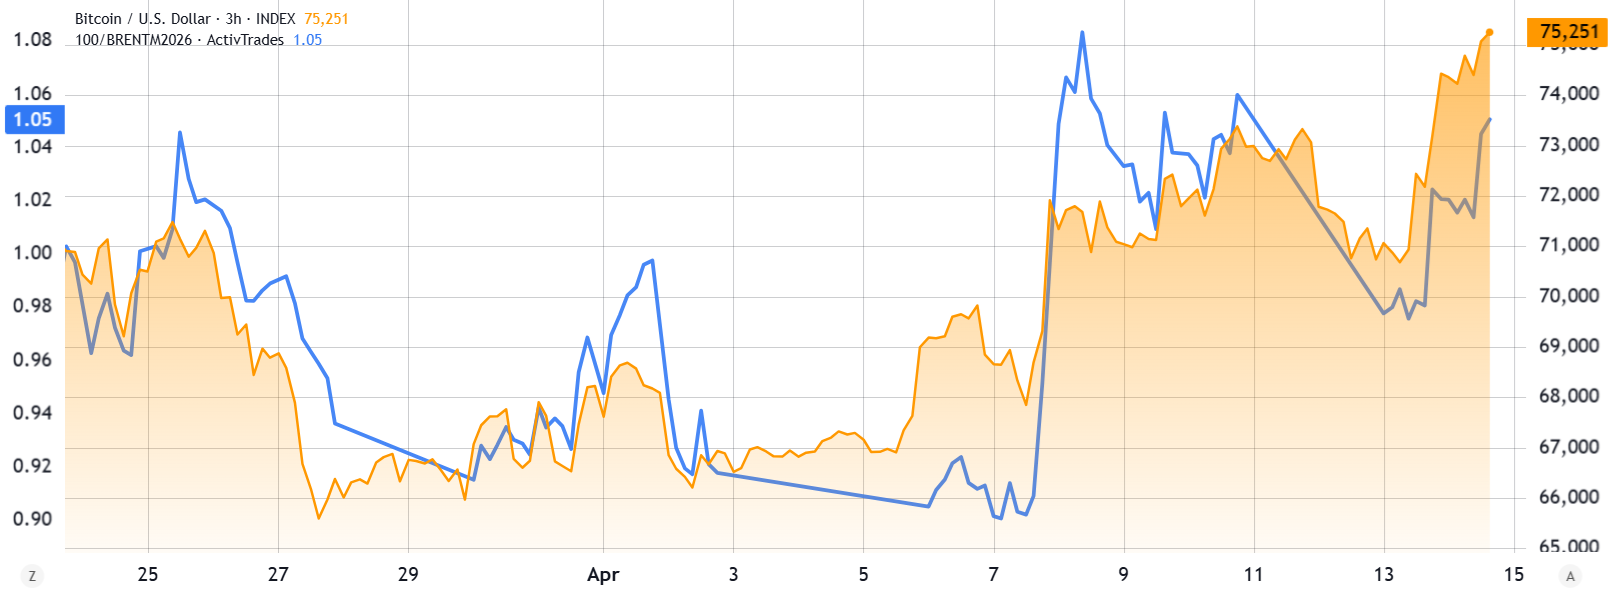
Bitcoin extended its latest bounce, surging about 5% on Tuesday to a fresh intraday high near $76,120 as traders weigh a renewed bullish setup and stronger on-chain activity. The move rekindles expectations of a broader rally, with market participants eyeing higher targets if momentum persists and key resistance zones are cleared.
Key takeaways
- Bitcoin punched to an intraday high around $76,120, reclaiming earlier resistance and signaling renewed upside momentum.
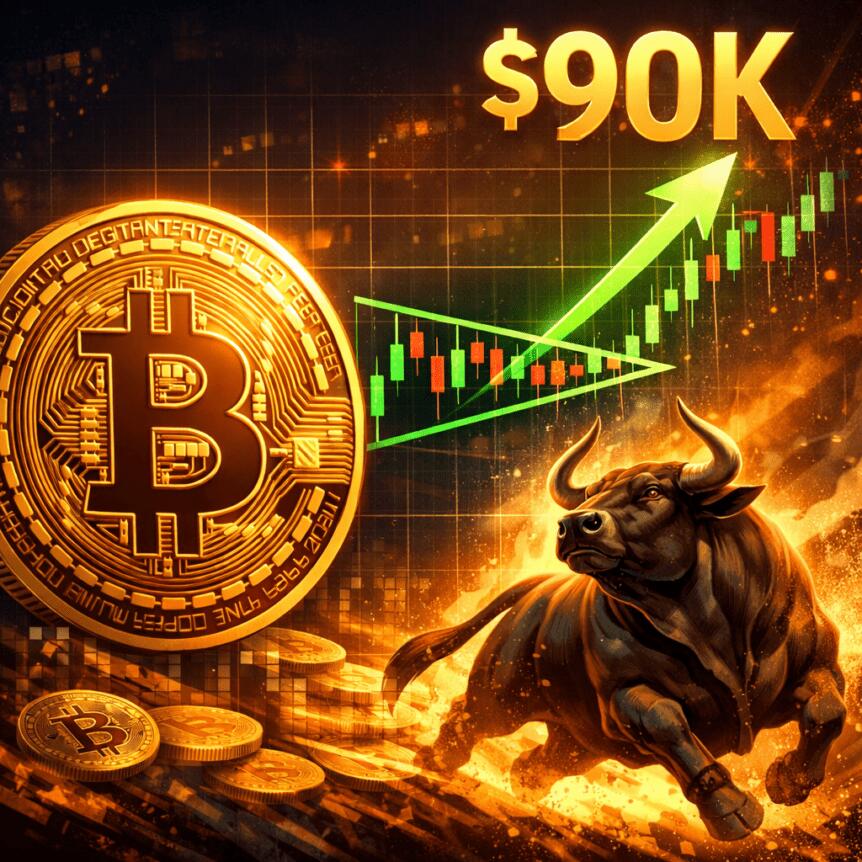
- Analysts see a potential breakout above an ascending triangle pattern, with the next major hurdle near $80,000 and a measured target around $89,050.
- On-chain activity supports the price move: daily transaction count rose sharply in 2026, reaching 765,130 million as of April 5, a level last seen in November 2024 when BTC briefly topped $100,000.
- Network activity is corroborated by higher fee revenue, with total on-chain fees up about 4% week over week to roughly $153,700, suggesting greater willingness to pay for priority processing.
Price action and the chart setup
Trading data shows Bitcoin breaking above the upper boundary of its latest consolidation, with Tuesday’s rally pushing the price above $76,000—levels not seen since early February. Analysts described the move as a breakout that validates renewed bullish momentum, noting that a decisive close above the $75,000 to $76,000 zone would confirm the breakout and widen the path toward higher targets.
“Bitcoin surged above the $76,000 level, breaking above its March highs and signaling renewed bullish momentum,”
Skeptics and optimists alike are watching the same crucial points: a sustained close above the moving averages near $75,000 and a daily close beyond the resistance front near $80,000. If these thresholds are crossed, traders anticipate a continued push toward the measured target implied by the formation—roughly $89,050—which would mark a meaningful shift in the short-term trajectory.
Technical commentary also highlights the pattern at play: Bitcoin appears to be validating an ascending triangle after breaking above the upper trend line around $73,000 earlier in the week. A close above the confluence of the trend line and the 100-day moving average would bolster confidence in a bullish breakout, while a failure to sustain above $75,000 could reintroduce volatility and test lower supports.
As observers map the road ahead, one analyst emphasized that breaking above the pattern and the 100MA would indicate a genuine shift in momentum, potentially accelerating a move toward the $84,000 area and higher. The discussion underscores how chart structure, not just price level, is shaping expectations for the near term.
On-chain activity corroborates the price move
Price strength is aligning with rising on-chain usage. Bitcoin’s daily transaction count has surged in 2026, reaching about 765,130 million as of April 5, according to CryptoQuant data cited in market briefings. This level marks a multi-month high and echoes earlier bursts of network activity that accompanied major price moves.
That activity level was last observed during a period in November 2024 when Bitcoin briefly traded into the six-figure territory, approximating a macro moment when speculative fervor and investor interest peaked. An analyst known on social channels noted that the current transaction count is higher than during some earlier high-price eras, suggesting sustained network engagement rather than a fleeting spike.
The on-chain signal is complemented by commentary from observers who point to the broader implications of rising usage: increased transaction counts can reflect a growing number of market participants, higher merchant adoption, or greater trader activity seeking to execute orders with priority. In this context, the 2026 uptick in activity helps explain why the market is not only chasing higher prices but also experiencing more active on-chain participation.
“The network is showing bull market behavior,”
That sentiment came from a Twitter analyst who highlighted the robust on-chain activity as a meaningful backdrop to price action. While the precise drivers behind the surge remain multifaceted, the association between rising transaction counts and bullish momentum is a recurring theme in recent market cycles.
Fees rise as demand for on-chain priority grows
Beyond transaction counts, Fee activity also rolled higher. Glassnode’s Market Pulse observed that Bitcoin’s total on-chain fee volume increased about 4% over the prior week, reaching roughly $153,700. The uptick in fees is interpreted as heightened willingness among users to pay for priority processing, signaling sustained or expanding network demand even as price moves unfold.
From a market perspective, rising fees can reflect a mix of transaction acceleration by traders attempting to front-run or secure confirmations in a volatile environment, and real-world use cases driving higher activity. While fees alone do not determine price direction, they provide a complementary read on how busy the network is and how users are prioritizing their transactions in this phase of renewed activity.
What this means for traders and investors
The combination of a renewed price breakout, a believable chart pattern, and stronger on-chain signals paints a cohesive picture of renewed appetite among market participants. For traders, the key inflection point remains the daily close above critical resistance—roughly $75,000–$76,000—and confirmation of the ascending triangle’s breakout with a follow-through beyond the next hurdle near $80,000. If these thresholds hold, the measured move toward the mid-to-upper $80,000s—and potentially toward $89,050—becomes more credible.
Investors will also be watching whether the surge in on-chain activity and rising fee volume persists, as it can indicate longer-term engagement rather than a purely speculative sprint. The last time the network showed similar on-chain vigor was during prior price cycles when BTC breached notable price milestones, which adds a layer of historical context to the current setup.
Nevertheless, uncertainties remain. The macro landscape—regulatory developments, policy shifts, and broader market conditions—will always color Bitcoin’s trajectory. A decisive close above resistance levels, followed by sustained momentum, would strengthen the case for a continued advance; a retreat or muted follow-through could prompt a reversion to nearer support around the $75,000 mark.
For readers watching the next chapters, the immediate priority is confirmation: a daily close above the $76,000 zone and a sustained push beyond $80,000 would provide a clearer path toward the higher targets implied by the chart pattern and the improving on-chain backdrop. Until then, the market remains in a wait-and-watch phase, balancing chart psychology with real-time network activity.
Key takeaways:
-
The US Federal Reserve’s shift toward balance sheet expansion may provide the liquidity needed to boost Bitcoin and broader risk markets.
-
The war in Iran and high oil prices might be driving investors toward scarce assets to hedge against rising inflation.
On Tuesday, Bitcoin (BTC) price surpassed $76,000 for the first time in over two months, triggering $285 million in leveraged short liquidations. The rally closely tracked the S&P 500, indicating a high probability of a macroeconomic-driven event. Is the war in Iran the only factor behind Bitcoin’s price gains, and what are the odds of a bull trap?

Crude oil prices stabilized near $95 after peaking at $104 over the weekend, a move many traders view as positive. The inverted chart of crude oil prices depicts a high-intraday-correlation environment.
The war in Iran has been a major source of concern due to its impact on US inflation and supply chain logistics, which limits the ability of global central banks to trim interest rates and exerts negative pressure on economic growth.
Simultaneously, gains in the S&P 500 and gold prices likely indicate a higher probability of stimulus measures, causing investors to seek shelter in scarce assets.

The recent gains in the S&P 500 following failed negotiations to reopen the Strait of Hormuz may seem odd, but the added risk of recession provides the strongest incentive for governments to implement expansionary measures. Regardless of whether the US Federal Reserve opts for a cautious approach, the US Congress and the Trump administration can authorize direct investment in infrastructure projects and social programs, or provide tax credits.
Inflationary worries line up with investors’ Fed policy expectations
Bitcoin does not need to compete with stocks or even gold to capture the capital currently held in money market funds and short-term bonds. The longer oil prices remain above $90, the higher the upward pressure on forward inflation.
Reduced expected returns on fixed-income assets may be the primary catalyst behind Bitcoin’s surge above $75,000, and governments have few alternatives without expanding the monetary base.

The US Fed changed its strategy to expand the balance sheet in January, reversing the trend from the previous two years. This move is highly supportive of risk markets, as short-term concerns about the bond market are diminishing. Financial institutions and hedge funds have greater access to liquidity and face less competition to offload US Treasuries, providing temporary relief to the stock market.
Regardless of whether Bitcoin holds above $75,000, there are few incentives for traders to take profits after two months of trading near $68,000, given the meager 10% gains. Even if Bitcoin eventually rallies to $80,000, that would represent a modest 20% gain for those who purchased at $66,500. Unless traders perceive an imminent risk to oil prices, the odds do not favor continued sell pressure on Bitcoin.
Related: Bitcoin’s struggle to build long-lasting uptrend continues–Here’s why
Ultimately, given the likelihood of expansionary monetary policy and inflationary pressures, Bitcoin bears will have a difficult time showing strength, making the odds of a successful bull trap extremely low.
This article is produced in accordance with Cointelegraph’s Editorial Policy and is intended for informational purposes only. It does not constitute investment advice or recommendations. All investments and trades carry risk; readers are encouraged to conduct independent research before making any decisions. Cointelegraph makes no guarantees regarding the accuracy or completeness of the information presented, including forward-looking statements, and will not be liable for any loss or damage arising from reliance on this content.

The dogecoin price prediction now sits at $0.0934 after a 70-day accumulation pattern squeezed into a descending triangle that analyst Ali Charts says is ready for a 30% move, per BanklessTimes. DOGE spot ETF products pulled in $1.34 million last week, the best single-week figure since January, but that inflow barely moves a $14.2 billion cap that needs billions to shift direction.
Meanwhile, Pepeto already has a live exchange running before its token even hits the open market. More than $9,012,000 poured in from early buyers, and every new stage brings the Binance listing closer.
Dogecoin Price Prediction Under Pressure as 70-Day Triangle Nears Its Breaking Point
Crypto analyst Ali Charts flagged a descending triangle on April 12 where lower highs keep pressing into flat support near $0.088 to $0.090, per BanklessTimes. The week ending April 10 saw DOGE spot ETFs pull in $1.34 million after four straight weeks of zero flow, pushing total net assets to $10.86 million per SoSoValue data. Developer contributions rose 300% year over year per Benzinga, and GitHub proposal #3776 targets cutting block rewards by 90%. The dogecoin price prediction faces a setup where the biggest chart pattern in months is about to snap, and that kind of tension sends the fastest money straight into early-stage entries.
Accumulation Breakout, Returning ETF Demand, and the Entry That Skips the Wait
How Pepeto Delivers What the Dogecoin Price Prediction Cannot Touch
No other token sale this cycle put a working exchange in front of buyers before asking for a single dollar. PepetoSwap, the multi-chain bridge, and the AI contract scanner were all live and tested before the sale opened. That build-first sequence is the reason $9,012,000 flowed in while the typical meme token can barely close its first round.
Zero trading fees on PepetoSwap mean your full stack stays yours after every swap. The bridge moves tokens across Ethereum, BNB, and Solana for free, so transfers never eat into gains. The AI scanner catches risky contracts before capital touches them. And because each stage raises the floor and shrinks what is left, today’s buyers get a better deal than anyone who follows.
The Pepe cofounder whose first project hit $11 billion without a single tool now leads this build alongside a Binance listings veteran. SolidProof audited every contract before the sale went public. Daily staking rewards at 184% APY keep compounding.
Every stage sells faster than the one before, the buzz keeps spreading, and the Binance listing date gets closer by the day. Against that, DOGE sitting at $0.0934 with a weak ETF trickle and no chart confirmation offers nothing close.
Dogecoin (DOGE) Price at $0.0934 as 70-Day Accumulation Nears a Decision Point
Dogecoin (DOGE) sits near $0.0934 per CoinMarketCap, up about 2.32% over the past day, with every major EMA still pressing down and $0.10 acting as the nearest wall. DOGE spot ETFs recorded $1.34 million in weekly inflows after four weeks of silence, pushing total assets to $10.86 million.
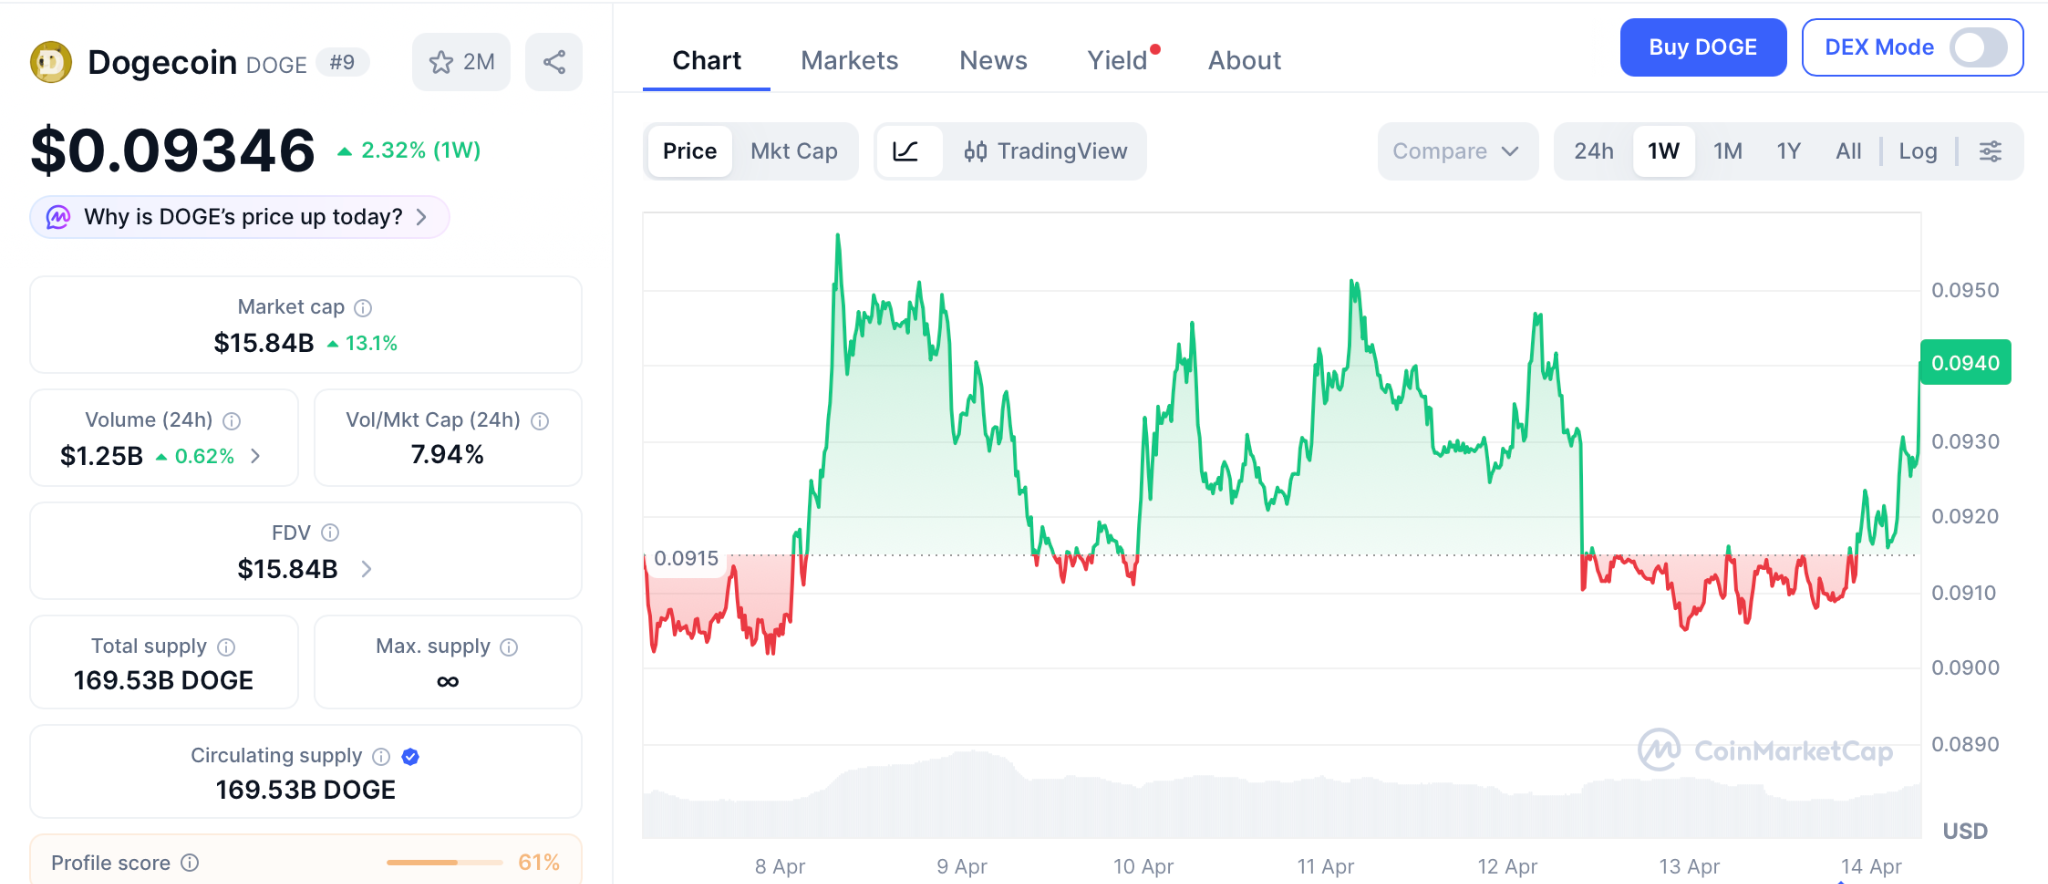
On-chain developer work rose 300% year over year, and GitHub proposal #3776 still targets a 90% block reward cut. The 2026 dogecoin price prediction range sits at $0.09 to $0.21. The gap between $0.0934 and the $0.21 bull target works out to about 127%, and all of it needs sentiment to flip. Pepeto’s path to 100x runs through one confirmed listing that gets closer by the day.
Conclusion
DOGE holds at $0.0934, ETF inflows barely trickling, and 70 days of sideways action still unresolved. Meme tokens with no real products behind them keep losing ground. Pepeto stands alone this cycle: a live exchange, the Pepe cofounder’s track record, and a confirmed Binance listing backing every dollar that enters.
Back in 2020, anyone who put $1,000 into DOGE at $0.002 walked away with $365,000 near the top. That kind of return is what Pepeto is built to deliver again, only now a full exchange and a Binance listing back the entry instead of pure hype. The wallets buying today are positioning for the breakout story 2026 gets defined by, and sitting on the sidelines while the dogecoin price prediction grinds sideways is the kind of miss that stings for years.
Click To Visit Pepeto Website To Enter The Presale

FAQs
What is the dogecoin price prediction now that DOGE ETF inflows returned after four flat weeks?
Analysts target $0.09 to $0.21 for Dogecoin in 2026, with recovery needing a confirmed breakout above $0.10 that has not happened yet. DOGE spot ETFs pulled $1.34 million last week after four straight weeks of zero flow.
How does Dogecoin (DOGE) at $0.0934 stack up against a token targeting 100x on listing day?
Dogecoin (DOGE) trades at $0.0934 with a $14.2 billion cap and roughly 127% upside to the bull case over months. Pepeto at its early-stage entry targets 100x from a single Binance listing that keeps getting closer.
Disclaimer: This is a Press Release provided by a third party who is responsible for the content. Please conduct your own research before taking any action based on the content.
Crypto World
Tether (USDT) launches crypto wallet to bring stablecoin, bitcoin (BTC) payments directly to users

Tether, issuer of the most popular stablecoin USDT , rolled out Tuesday a self-custodial crypto wallet aimed at putting its stablecoin network directly in users’ hands, aiming to make crypto payments as easy as sending a message.
The new app, called tether.wallet, allows users to hold and send USDT and USAT (USAT) stablecoins, gold-backed token XAUT (XAUT) and bitcoin across multiple blockchains. It removes common friction points by letting users pay transaction fees in the asset they send and by replacing long wallet addresses with human-readable names like “name@tether.me.”
The move is notable for Tether because it marks a shift to a consumer-facing app from being an intermediary in crypto payments issuing the most popular digital dollar, the $185 billion USDT token. Tether said more than 570 million users already interact with its technology, largely indirectly through exchanges and payment rails. The new wallet brings those functions into a direct interface, where users control their private keys and sign transactions on their own devices.
The launch builds on Tether’s Wallet Development Kit (WDK), an open-source toolkit the firm developed for third-party efforts such as the Rumble wallet, which uses Tether’s infrastructure to enable creator payments and peer-to-peer transfers.
“Tether.wallet is ‘the People’s Wallet,’ said Tether CEO Paolo Ardoino, “because it truly reflects the natural evolution of Tether’s role, from building the foundation of the digital asset economy to making it directly usable by anyone, ready for a future in which tens of billions of humans, machines, and trillions of AI agents will transact seamlessly at the speed of light.”

XRP price is at $1.3575 on April 14, down 1.32% on the session, as a symmetrical triangle converges toward its apex on the daily chart. A daily MACD bullish crossover has printed simultaneously, with the histogram turning positive for the first time in weeks, adding momentum confirmation to a pattern that has been compressing price since early March.
Summary
- XRP price is trading at $1.3575 on April 14, down 1.32%, as a symmetrical triangle tightens on the daily chart with the upper descending trendline from the February highs and the lower ascending trendline from the March lows converging at the apex.
- The daily MACD (12,26,9) has produced a bullish crossover with the histogram at +0.0060, while the MACD line at -0.0112 has crossed above the signal at -0.0171. Both lines remain below zero.
- A daily close above the SMA 50 at $1.3792 confirms a triangle breakout and opens $1.5625 as the next resistance; a daily close below the lower trendline near $1.30 invalidates the bull case.
XRP (XRP) price is at $1.3575 on April 14, with 24-hour trading volume of $2.24 billion, as the daily chart shows a symmetrical triangle pattern compressing price action between two converging trendlines since early March. The upper descending trendline connects the February highs above $1.60, and the lower ascending trendline runs from the March lows around $1.20. The full MA ribbon sits above price: SMA 20 at $1.3398, SMA 50 at $1.3792, SMA 100 at $1.5625, and SMA 200 at $1.9222, forming overhead resistance at each level. Price is at the apex of the triangle, forcing an imminent directional resolution.
The symmetrical triangle on the daily chart reflects the market’s indecision since March, with sellers unable to push XRP below the ascending lower trendline and buyers unable to break through the descending upper trendline. Each successive high has been lower and each successive low has been higher, compressing the range toward a convergence point that is now directly at price. Apex-level compression in symmetrical triangles typically precedes a strong directional move, and the volume context during the pattern matters: declining volume inside the triangle has been followed by an expansion of volume on the breakout in prior XRP patterns.
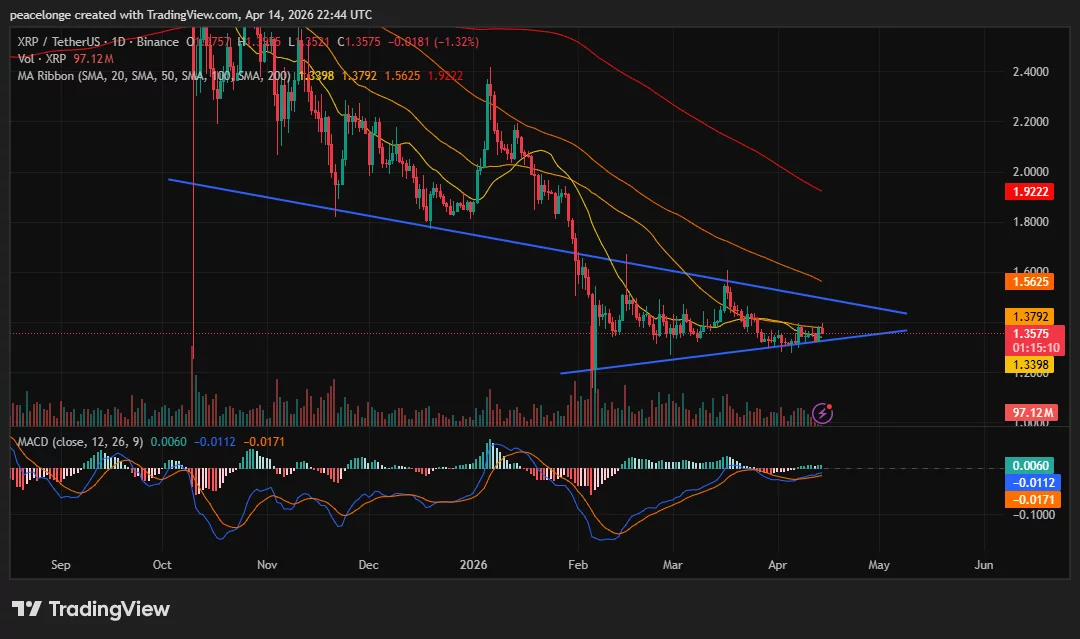
The MACD (12,26,9) has produced a bullish crossover simultaneously, with the MACD line crossing above the signal at the daily close. The histogram reads +0.0060, a positive reading for the first time since the pattern began. Both lines remain below zero, which means the macro trend is still bearish, but the crossover inside the triangle at the apex is the most constructive shortterm momentum signal XRP has produced in the current consolidation period. A KuCoin technical analysis published on April 8 noted that the MACD bullish crossover in XRP, when accompanied by expanding histogram bars, “could be a potential trend reversal signal” within the broader downtrend.
Key Levels: Support, Resistance, and Price Targets
The SMA 20 at $1.3398 is the immediate dynamic support, sitting just below current price. A daily close below $1.3398 signals that the SMA has failed to act as a floor and brings the lower trendline of the triangle near $1.30 into focus as the last structural support.
On the upside, the SMA 50 at $1.3792 is the first resistance and the level that must be cleared on a daily close basis to confirm a triangle breakout. A confirmed breakout above $1.3792 opens $1.5625 as the next target, where the SMA 100 sits. The extended bull case points to $1.9222, the SMA 200 level and the last major overhead reference before the February highs.
A daily close below the lower trendline near $1.30 breaks the symmetrical triangle structure and exposes $1.20 as the next support, consistent with the 1.0 Fibonacci level identified by analysts as the key floor below the current pattern.
Invalidation: a daily close below $1.30.
On-Chain and Market Data Context
XRP perpetual futures open interest fell sharply from a peak of $10.94 billion in July 2025 to approximately $2.45 billion currently, per Coinglass data, reflecting a significant deleveraging of speculative positioning over the past nine months. This reduction in open interest reduces the risk of a liquidation-driven breakdown and creates a cleaner setup for a technical breakout on lower leverage. XRP ETF inflows recorded approximately $3.3 million in net inflows on April 12, notably outperforming Bitcoin and Ethereum ETFs on the same session despite broader risk-off conditions.
The SEC CLARITY Act roundtable scheduled for April 16 is a nearterm catalyst that could introduce fresh directional volatility for XRP. The bill, which would establish XRP’s digital commodity status as permanent federal law, is expected to dominate market commentary heading into the session.
If XRP holds above $1.3398 on a daily close basis and the MACD histogram continues to expand, a test of the symmetrical triangle upper trendline and SMA 50 at $1.3792 becomes the primary nearterm target, with $1.5625 opening on a confirmed breakout above it.
Crypto World
Chainlink Price Prediction Targets $30 as US Commerce Department Joins LINK Network While Pepeto Presale Offers 100x
The chainlink price prediction just gained serious weight after Chainlink confirmed on April 12 that the US Department of Commerce, S&P Global Ratings, FTSE Russell, Deutsche Börse, and Tradeweb now distribute data through its oracle network.
LINK sits at $9.39 while a SWIFT and DTCC pilot using Chainlink hit 100% consensus on corporate actions across $58 billion in annual processing. Institutions do not wire this kind of infrastructure into a token they plan to abandon.
But the chainlink price prediction that matters most right now is not the slow climb to $30. It is whether the presale carrying a confirmed Binance listing can reshape a portfolio in weeks while the LINK forecast grinds through the rest of the year.
Chainlink Price Prediction After US Government Data Flows Through LINK Infrastructure
The US Department of Commerce, S&P Global Ratings, FTSE Russell, and Intercontinental Exchange now push data through Chainlink according to BanklessTimes. Total US LINK spot ETF assets crossed $93.78 million with zero net outflows since tracking began, and the reserve wallet holds 2.93 million LINK from protocol fees.
CCIP processes $18 billion in monthly cross-chain volume while securing $29.3 trillion in total value. With Coincub’s bull case at $85 and InvestingHaven at $30, the chainlink price prediction carries more real-world backing than most top-twenty tokens. But a $6.5 billion cap puts a ceiling on the kind of multiples that change lives, and the real 100x lives in a different entry entirely.
Chainlink Price Prediction and the Presale That Will Not Wait for It
Pepeto
Sitting on the LINK chart and hoping for $30 is the slow lane, and slow lanes cost portfolios the entries that actually print life-changing wealth. Pepeto is a fully operational exchange presale created by the same person who took Pepe from zero to $11 billion on 420 trillion tokens without a single working tool. A former Binance exchange engineer directs the technical side, and SolidProof verified every contract before the first dollar entered.
Capital crossed $9.01 million at $0.0000001863 and each round closes ahead of schedule because the wallets getting in already know what happens when this founder launches. PepetoSwap settles every swap without charging a fee so nothing gets skimmed from your bag, and the bridge connects ETH, BNB, and SOL at zero cost so every dollar lands whole.

The chainlink price prediction will print when the cycle turns, but the wallets loading right now are grabbing presale positions where 100x is basic arithmetic grounded in a founder who already delivered at $11 billion scale. Staking at 184% APY stacks tokens every single day while the majority sits frozen waiting for confirmation that whale wallets already gave months ago.
By the time LINK touches $30 and headlines call that a 3.4x win, the Pepeto listing will have already happened and the presale price will be the number that everyone who passed keeps bringing up for the rest of the cycle. That is how every missed presale ends, and that is exactly the window closing right now.
Chainlink (LINK) Price at $9.39 as Government and Institutional Data Partners Stack Up
Chainlink (LINK) trades at $9.39 according to CoinMarketCap, sitting 84% below its $52.88 all-time high with a market cap near $6.5 billion. A 72-day accumulation structure is forming on the chart, ETF net assets crossed $93.78 million, and the Bitwise CLNK fund on NYSE Arca now opens LINK to 401(k) and IRA accounts for the first time.
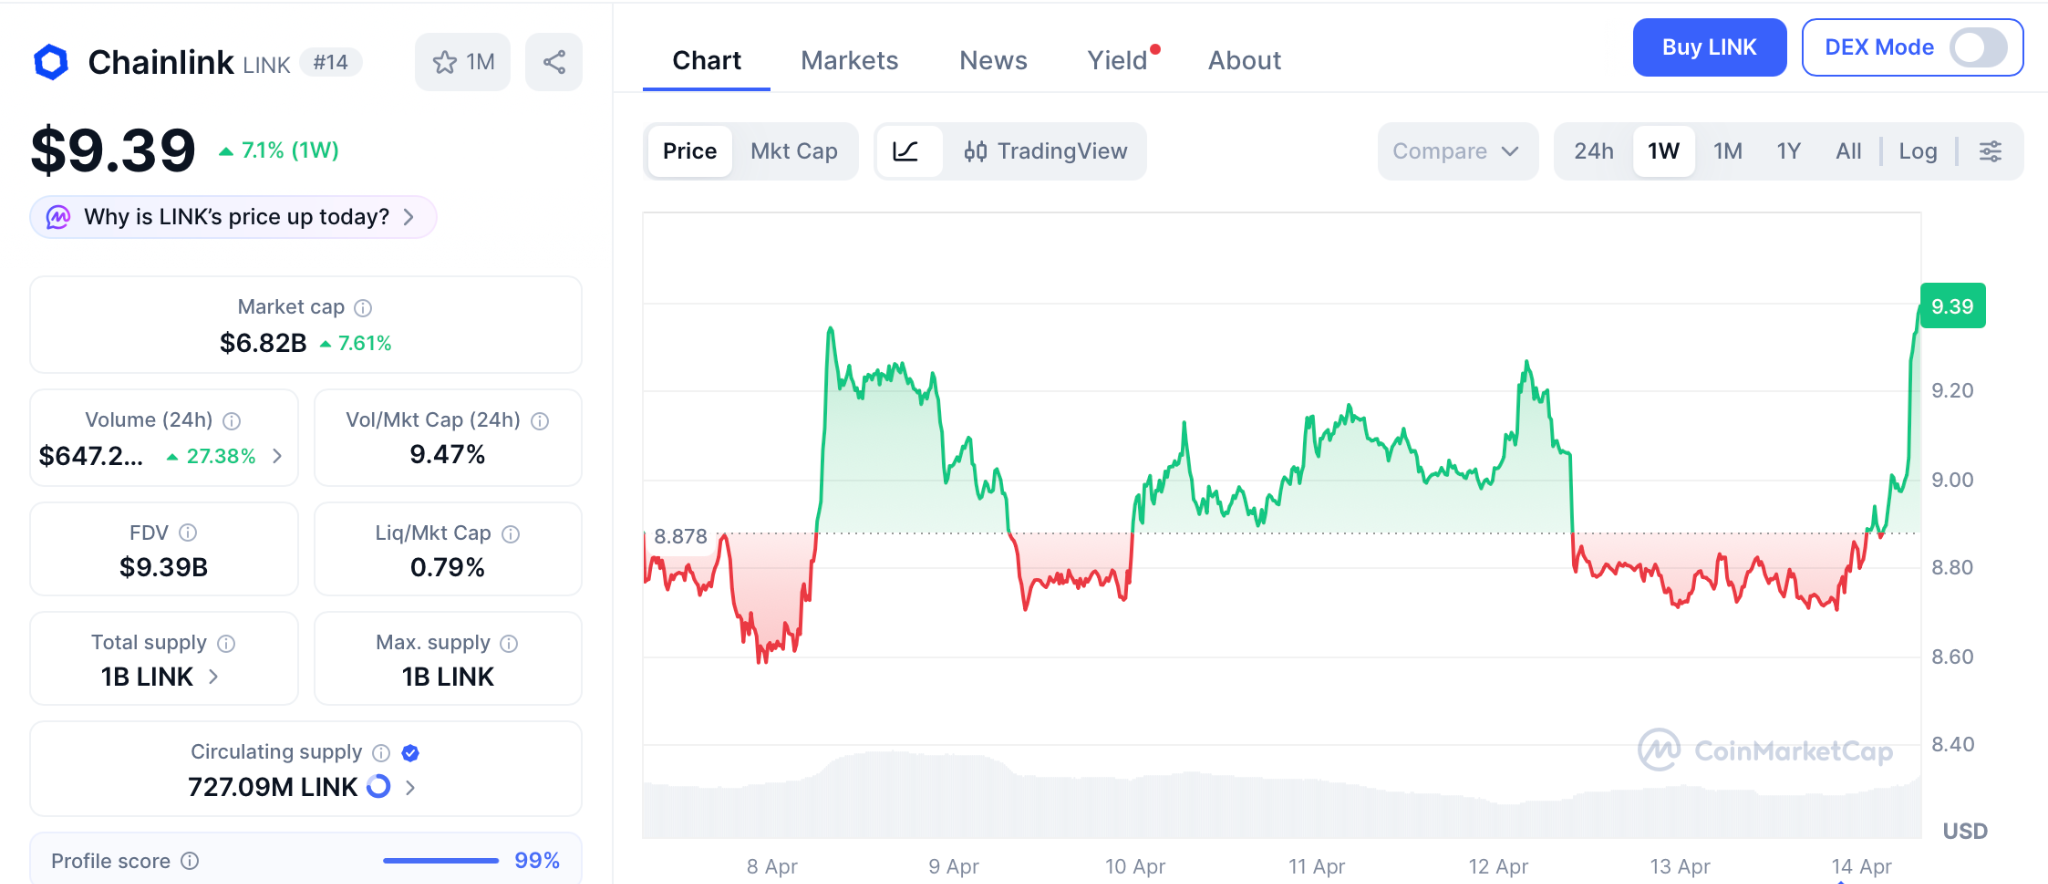
Analyst forecasts for 2026 range from $9.97 to $85 according to CoinCodex and Coincub. InvestingHaven holds $30, Coincub’s base hits $42, and the bull case reaches $85. Support holds at $8.20 with resistance at $9.55 to $10.40. Compressed Bollinger Bands point to an imminent breakout, but direction depends on broader market strength.
Even the most aggressive chainlink price prediction gives roughly 9x from here, a strong gain for an infrastructure token but nowhere near what presale entries paired with listing triggers can produce.
Conclusion
The chainlink price prediction will reward patient holders, and the infrastructure behind LINK is stronger than anything in the top twenty. But remember when LINK sat at $0.20 and zero institutions cared. No ETF existed. No government agency used the network. The wallets that entered that silence turned tiny positions into seven figures when LINK crossed $52, and most of the market never got in because they waited for proof that only arrived after the move was already over.
Those fortunes were not built by watching a $6.5 billion asset climb slowly. They were built by acting while the price was still a secret, and Pepeto is sitting in that identical window right now with $9.01 million raised, a confirmed Binance listing approaching, and a founder who already turned this exact model into $11 billion. The wallets that recognize this setup are locking entries today, and when the listing hits, the difference between acting now and waiting will be the difference between wealth and regret.
Click Here To Enter The Pepeto Presale

FAQs
What is the chainlink price prediction for 2026 after US government data joins the network?
Analyst targets range from $9.97 to $85, with InvestingHaven at $30 and Coincub reaching $85 in the bull case. CCIP processes $18 billion monthly across $29.3 trillion in secured value.
Can Pepeto beat the chainlink price prediction from presale pricing?
Pepeto at $0.0000001863 targets 100x once the Binance listing opens, compressing into days the returns the chainlink price prediction needs a full year to deliver.
Disclaimer: This is a Press Release provided by a third party who is responsible for the content. Please conduct your own research before taking any action based on the content.

Plan to turn Denham into centre of Australian trepang trade
JPMorgan CFO Flags Regulatory Arbitrage Risks From Stablecoins

General Hospital LEAK: Anna’s Story Collides with Ethan & Jason – Explosive Twist Revealed!


-

 Politics4 days ago
US brings back mandatory military draft registration
-
 Sports4 days ago
Man United discover Nico Schlotterbeck transfer fee as defender reaches Dortmund agreement
-

 Fashion4 days ago
Weekend Open Thread: Veronica Beard
-

 Politics5 days ago
Malcolm In The Middle OG Turned Down ‘Buckets Of Money’ To Appear In Reboot
-

 Politics2 days ago
World Cup exit makes Italy enter crisis mode
-

 Crypto World6 days ago
Canary Capital Files SEC Registration for PEPE ETF
-

 Business4 days ago
Tesla Model Y Tops China Auto Sales in March 2026 With 39,827 Registrations, Beating Cheaper EVs and Gas Cars
-

 Crypto World1 day ago
The SEC Conditionalises DeFi Platforms to Be Avoided for Broker Registration
-

 Crypto World1 day ago
SEC Signals Exemption for Crypto Interfaces From Broker Registration
-

 Crypto World6 days ago
Bitcoin recovers as US and Iran Agree a Ceasefire Deal
-
 NewsBeat2 days ago
Pep Guardiola and Gary Neville agree over Arsenal title problem that benefits Man City
-

 Business5 days ago
OpenAI Halts Stargate UK Data Centre Project Over Energy Costs and Copyright Row
-

 Business3 days ago
Ireland Fuel Protests Enter Day 5 as Blockades Spark Shortages and Government Prepares Support Package
-

 Politics5 days ago
LBC Presenter Mocks Trump Over Iran War Failures
-

 Crypto World4 days ago
Federal judge blocks Arizona from bringing criminal charges against Kalshi
-
 NewsBeat3 days ago
JD Vance announces ‘no agreement’ with Iran over nuclear weapons fear
-

 Tech5 days ago
A version of Windows 10 released a decade ago is now eligible for additional security patches
-

 Business4 days ago
IMF retains floor for precautionary balances at SDR 20 billion
-

 Crypto World19 hours ago
SEC Proposes Certain Crypto Interfaces Don’t Need to Register as Brokers
-

 NewsBeat16 hours ago
Trump and Pope Leo: Behind their disagreement over Iran war
You must be logged in to post a comment Login