
Crypto World
Bitcoin ETF Outflows Reach $167M as Ether and Solana ETFs Rebound



US-listed spot Bitcoin exchange-traded funds (ETFs) recorded $120.2 million in net outflows on Wednesday, bringing withdrawals across the first two sessions of the holiday-shortened week to $166.8 million, according to Farside Investors data.
The ARK 21Shares Bitcoin ETF (ARKB) led Wednesday’s withdrawals with $78 million, followed by Grayscale’s Bitcoin Trust ETF (GBTC) with $27.2 million and BlackRock’s iShares Bitcoin Trust ETF (IBIT) with $19.5 million. Morgan Stanley’s Bitcoin Trust (MSBT) was the only fund to record inflows, adding $4.5 million.
Wednesday’s withdrawals followed $46.6 million in net outflows on Tuesday, marking the category’s first back-to-back outflow days since a three-day run ended on Aug. 14. Across the two sessions, GBTC lost $92.7 million, while ARKB and IBIT recorded net redemptions of $69.9 million and $8.8 million, respectively.
The two-day pullback erased about 4.4% of the $3.8 billion attracted during the funds’ strongest three-week stretch of 2026. Bitcoin ETFs have recorded about $55 billion in cumulative net inflows since their launch, while their combined 2026 net flows amount to about $1.07 billion in outflows, according to Farside Investors.
Ether and Solana ETFs return to inflows
Meanwhile, US spot Ether ETFs attracted $34.7 million on Wednesday after recording $24.3 million in withdrawals on Tuesday, leaving the funds with $10.4 million in net inflows for the week.
BlackRock’s ETHB led Wednesday’s Ether ETF inflows with $22.9 million, followed by its ETHA fund with $9.7 million. The 21Shares TETH fund added $2.1 million, while the remaining Ether ETFs reported no net flows.
Related: Bitcoin SOPR metric sees longest profit run of 2026 as new analysis challenges bear market
Spot Solana ETFs also reversed Tuesday’s outflow of about $700,000, attracting $11.2 million on Wednesday and bringing their two-session total to $10.5 million in net inflows. All Wednesday inflows went to Bitwise’s BSOL.
Hyperliquid ETFs recorded net outflows for a second session, losing $5.3 million Wednesday after $13 million in Tuesday outflows, bringing the week’s total outflow to $18.3 million.
The mixed ETF flows came as Bitcoin traded near $78,000 on Thursday, down from about $79,700 when the earlier three-week inflow figures were reported. Ether traded around $2,470, while Solana hovered near $101, according to CoinGecko.

MemeToro is another speculative memecoin and prediction-market project wrapped in an AI narrative. Its trust scores sit between just 25% and 50% across automated website-checking platforms. The smart contracts meant to handle MemeToro’s future funding rounds and token launches haven’t been audited yet. MemeToro’s favorable media coverage has been distributed as paid PR.
That, more or less, is the case a handful of websites are making against MemeToro. At first glance, it can leave the project looking far more questionable than the full picture suggests.
At the same time, MemeToro has also been covered over the past few months by names like CoinGape, Invezz, Business Insider and many more, without the project being treated there as fraud.
Much of that attention has focused on its AI Agent, which is being built to scan trends, filter possible meme ideas, and make the reasoning behind future launches more transparent. Just as importantly, MemeToro’s development is open-source, with the framework already taking shape on GitHub and regular code updates that anyone can follow.
There’s an obvious irony in calling a project like this an outright scam without much stronger evidence. The claims are still worth checking, but against what MemeToro actually does, not just the headline.
What is MemeToro?
MemeToro is a memecoin launch platform being built on BNB Chain, with an AI agent at the center of how new token ideas come together. The agent follows trends across news, social media and culture, looks for meme-worthy concepts and turns the strongest ones into potential token launches.
Instead of stopping at a name or image, it builds a fuller proposal around each idea, including the reasoning behind it and the conditions for a possible release. If nothing looks suitable, it can simply pass and wait for a better opportunity.
MemeToro already has an early MVP of this process, while the full agent shown on the website remains in development. Further iterations of the platform also bring trading, prediction markets, staking and other memecoin-focused features into the same ecosystem.
What is the $MT token?
$MT is MemeToro’s native token and is separate from the individual memecoins that the platform’s agent will eventually propose. It runs on BNB Chain and has a fixed total supply of 1.2 billion tokens.
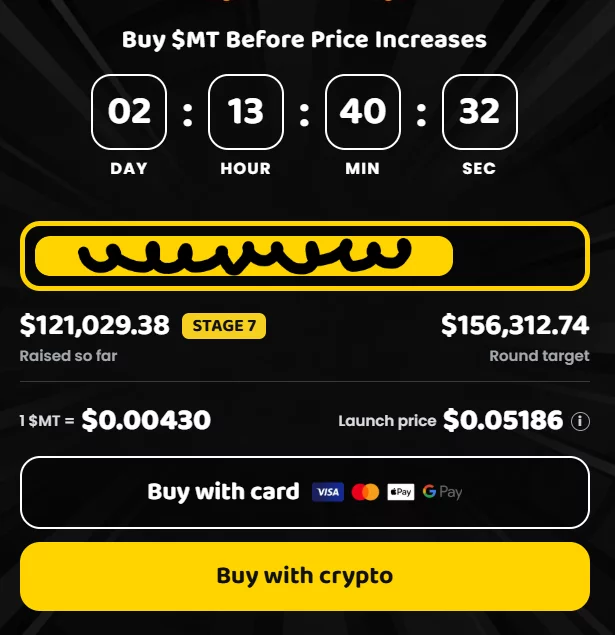
As of September 7, 2026, the $MT presale is in Stage 7, with each token priced at $0.00430. MemeToro shows $121,029 raised toward a $156,312 round target, while the website lists $0.05186 as the planned launch price. The presale supports crypto payments as well as card purchases through Visa, Mastercard, Apple Pay and Google Pay.
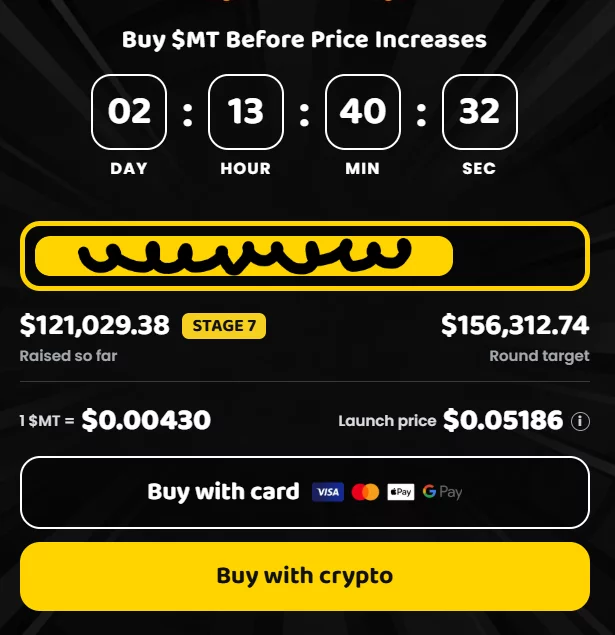
There’s visible buying activity around the presale too, with recent $MT purchases continuing to appear in the site’s feed across both Ethereum and BNB Chain.

$MT can be used in MemeToro’s future fixed-rate funding rounds alongside BNB and supported stablecoins. The token is also tied to staking, rewards, trading and prediction-market activity across the platform.
MemeToro review: What the accusations leave out
Once the basics of MemeToro and $MT are clear, the accusations are easier to assess on their own terms. That means tracing the numbers, trust scores, audit warnings and on-chain activity back to where they actually come from. That’s where some of the strongest-sounding risk signals start to look quite different.
MemeToro has low trust scores
MemeToro has been rated between roughly 25% and 50% by automated website-checking services, which is a compelling number to point to when arguing that the project appears suspicious.
The main negatives cited are MemeToro’s relatively young domain, private WHOIS registration and the fact that there simply isn’t much historical reputation data attached to the website yet. That makes sense for a project that hasn’t been online for years, but none of those checks found the kind of thing that would make the score much more alarming, such as confirmed phishing or malware.
One of the services giving MemeToro a middling score actually lists several positives at the same time:
In other words, the low rating is largely saying “this website is new and doesn’t have much history yet,” rather than identifying something concrete that makes MemeToro unsafe. Domain age by itself isn’t something that tells you whether a crypto project is legit or a scam.
MemeToro uses paid PR to promote itself
MemeToro has been criticized for using paid coverage and comparison articles that mention competing presales such as Pepeto. In crypto, though, that’s hardly an unusual marketing strategy, and the wider PR activity around these projects puts that criticism into a bit more perspective.
One example is easy to trace through releases published on openPR. Around the same time MemeToro was being called out for paid comparisons and SEO-heavy headlines, Apeing was being promoted by Crypto Presale PR through big, promising headlines such as “next 100x crypto,” “next 1000x crypto” and “best crypto presale.” What makes the whole thing feel a little odd is that MemeToro wasn’t even the first project this account had gone after. The same PR agency had already published pieces attacking Bullski, with one outright framing it as a fraudulent clone, and MemeToro was next.
In comparison, MemeToro’s own promotion looks relatively restrained, with most of it centered on the AI launch model, open-source development, staking and other platform features rather than “100x” or “1000x” style claims.
Sure, some of MemeToro’s coverage is paid, and that should be treated as marketing, but the project has also attracted substantial organic coverage, so it would be misleading to reduce its entire media presence to sponsored PR.
MemeToro’s smart contracts haven’t been audited
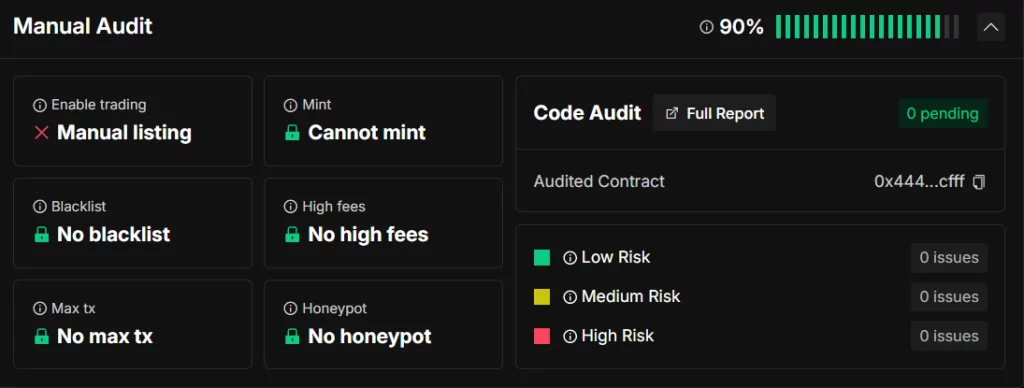
This one sounds pretty damning until the different contracts involved are separated. MemeToro already has a deployed $MT token contract, and the audit results around it are reassuring. Coinsult found no major red flags such as honeypot behavior, blacklisting or high fees,
BlockSAFU gave it its highest trust score of 100,
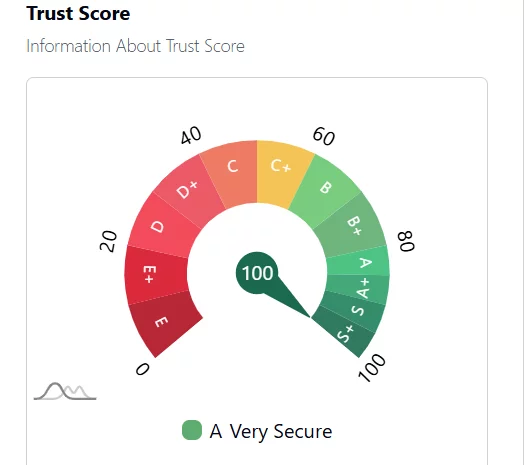
and SolidProof’s audit also came back clean. Taken together, there’s little on the contract side that raises concern.

The contracts that haven’t been audited are the future fair-launch contracts that will eventually handle funding rounds, token launches, claims and refunds for the memecoins proposed by MemeToro’s agent.
MemeToro says this pretty openly in its own GitHub. The contracts are still being worked on, aren’t meant to handle real funds yet, and are supposed to go through independent security reviews before they’re used in production.
So the more accurate version of the criticism isn’t that MemeToro has launched an unaudited financial system. It’s that part of the system hasn’t launched yet precisely because the contracts still need to be completed and audited.
The working MVP can already pick up trend signals, choose a concept and produce a draft proposal, but the funding, execution side and MemeToro AI agent only come later. Once that layer is ready, MemeToro plans to use fixed-rate funding rounds rather than the bonding-curve model common on platforms such as Pump.fun, with the smart contracts enforcing the published terms.
An unaudited contract already holding user funds would be one thing. A contract that is now in development, openly described as such and scheduled for review before production is something quite different.
MemeToro is just another meme coin project with an AI angle
It’s easy to look at MemeToro and assume the AI part is just another layer of branding around a meme coin. But here, the AI is meant to have an actual role in deciding what gets launched. It looks at what people are talking about, weighs different ideas, can reject them completely, and records the reasoning and sources behind whichever concept makes the cut.
The markets MemeToro is trying to connect aren’t particularly niche either. As of early September 2026, memecoins represent a roughly $33 billion market, while AI-agent tokens are worth another $3.2 billion. Prediction markets have grown much bigger still: Kalshi and Polymarket handled more than $45 billion in volume in August alone.
What MemeToro is really trying to do is combine those areas into one launch process: AI for finding and filtering ideas, transparent proposals showing why they were chosen, and eventually fixed-rate funding under published rules rather than a bonding curve. That makes the AI part feel less like a label added to the project and more like the thing tying the whole model together.
MemeToro’s whitepaper and website don’t match
MemeToro’s April whitepaper allocates 50% of the $MT supply to the public sale. The current tokenomics page shows roughly 71%.
That difference is real, but the two sources aren’t equally current. The whitepaper reflects an earlier version of the token allocation, while the website shows the breakdown being used for the presale now. In other words, the tokenomics changed, but the whitepaper wasn’t updated along with them.
That matters because some of the criticism treats the two figures as if MemeToro is presenting conflicting allocations at the same time. For anyone checking the presale today, the live website is the most reliable source. The whitepaper is simply carrying older numbers. That makes it a documentation issue, not something that really adds much weight to the MemeToro scam narrative.
86% of the $MT supply will be accessible to the market at launch
One of the sharper criticisms of MemeToro claims that roughly 71% of the total $MT supply is designated to the public sale. Add the 10% CEX reserve and 5% MemeToro trading allocation, the argument goes, and as much as 86% of all $MT could be sitting in or around the market from launch.
The problem is that this calculation treats allocation and circulating supply as though they were the same thing.
The 71% figure tells us how much of the overall supply has been set aside for the public sale. It doesn’t tell us that all of those tokens have actually been sold, claimed and placed into circulation. In fact, the same analysis that raises the alarm over the 71% allocation later argues that a large portion of those public-sale tokens may remain unsold. If they haven’t been sold, they obviously can’t all be sitting in presale buyers’ wallets ready to hit the market on day one.
The jump from 71% to 86% is even less straightforward. It comes from adding the CEX reserve and MemeToro trading allocations to the public-sale bucket. But, tokens reserved for exchange activity or liquidity aren’t automatically equivalent to freely circulating tokens available for holders to sell. Calling the entire combined amount “market accessible” makes the launch-day float sound much larger than the tokenomics table alone establishes.
There is a real distinction here that gets lost in the headline: 71% is an allocation figure, while circulating supply depends on how many tokens are actually sold and released. Those aren’t interchangeable numbers.
MemeToro claimed $118,562 raised, but only $63,966 appeared in its presale contracts
Another article raising concerns about MemeToro compared its advertised $118,562 raised with the figures from two public presale contracts on BNB Chain and Ethereum. Together, those contracts showed about $63,966, leaving roughly $54,600 that the author couldn’t account for through those two contracts alone.
Still, that comparison only works if those two contracts capture every way people can buy $MT. MemeToro’s presale doesn’t operate exclusively through direct on-chain purchases. The website also accepts card payments, as already mentioned. Purchases going through an external payment processor wouldn’t necessarily be reflected in the two contract counters the investigation checked.
The same criticism stops short of saying the missing amount was fabricated, because it recognizes other payment routes could exist. It actually lists card purchases, another payment processor and additional contracts among the possible explanations for the difference.
MemeToro moved presale funds through bridges, swaps and Binance
MemeToro’s treasury wallet has also come under scrutiny. It sent money through bridge services and swap routers, made transfers to a Binance deposit address, and also transferred funds to wallets the author couldn’t identify. Framed as “unexplained outflows,” that can easily sound like something disappeared. However, the transactions themselves only show money moving.
A bridge is used to transfer assets between chains. A swap router exchanges one asset for another. Sending funds to Binance can mean conversion, custody, payments, liquidity preparation or any number of ordinary operational uses. None of those actions is unusual enough on its own to tell us what the money was ultimately used for.
There’s another detail that makes the accusation much harder to read as a clean trail of presale money. The same wallet also received funds that couldn’t be tied directly to presale purchases, so incoming and outgoing assets were mixed together. Even the article taking aim at MemeToro acknowledges that it would be irresponsible to assume every outgoing transaction was investor money.
To round things out, the treasury was active. But “the wallet moved funds” and “presale money went missing” are two very different statements, and the on-chain activity shown in the article casting doubt on MemeToro only proves the first one.
What we’re left with after reviewing MemeToro
After looking through the presale, token setup, public GitHub work, audits and the main accusations around the project, MemeToro looks legit.
There’s enough here that can actually be checked. The AI idea isn’t just a landing-page promise, the MVP exists, development is public, and the $MT contract has already been through security reviews. A lot of the scarier claims appear much weaker once you get past the headline, especially the ones that treat token allocation as circulating supply, compare only part of the presale payment flow, or frame normal wallet movements as proof that funds disappeared.
MemeToro still has some features left to complete, but that’s not the same thing as there being no real platform behind it. At this point, the MemeToro scam label looks much harder to justify than the view that this is a genuine project in the middle of being built.

Zcash price traded near $1,216 on Sep. 10 after a seven-day rally of more than 50%, but overbought momentum, a three-day sell signal and nearby liquidation clusters raised the risk of a pullback.
Summary
- Zcash price advanced from about $814 to a multi-year high near $1,257 during the seven-day period.
- Daily RSI reached 75.72, keeping ZEC in overbought territory after its rapid breakout.
- 4-hour Bollinger Bands place immediate support at $1,196 and resistance near $1,287.
- Analysts identified $1,000–$1,100 as a possible base if the rally enters a correction.
Zcash price action today
According to data from crypto.news, Zcash (ZEC) price was trading at $1,216.15 at the time of writing, down 2.26% for the session after opening at $1,244.18. The token traded between an intraday low of $1,204.93 and a high of $1,256.80.
Despite the daily decline, ZEC remained one of the strongest large-cap crypto performers over the past week. Its price rose more than 50% from around $814 on Sep. 4 and briefly entered the $1,249–$1,257 area before buyers lost momentum.
The breakout also placed Zcash above $1,000 for the first time in years. Price continued to hold more than $200 above the psychological level at the time of writing, even as Bitcoin and Ethereum faced broader selling pressure.
Derivatives liquidations contributed to the initial acceleration. More than $34.5 million in ZEC short positions were reportedly closed during a 24-hour period as bearish traders were forced to buy back the asset. Short liquidations accounted for about 94% of the total cited liquidations.
Forced buying helped ZEC clear resistance quickly, but the same leverage that drove the advance could increase volatility if traders begin taking profits.
Daily ZEC chart remains overextended
The daily chart shows Zcash trading far above all four moving averages. Its 20-day simple moving average stood at $942.96, while the 50-day, 100-day, and 200-day averages were positioned at $679.76, $573.86, and $468.71, respectively.
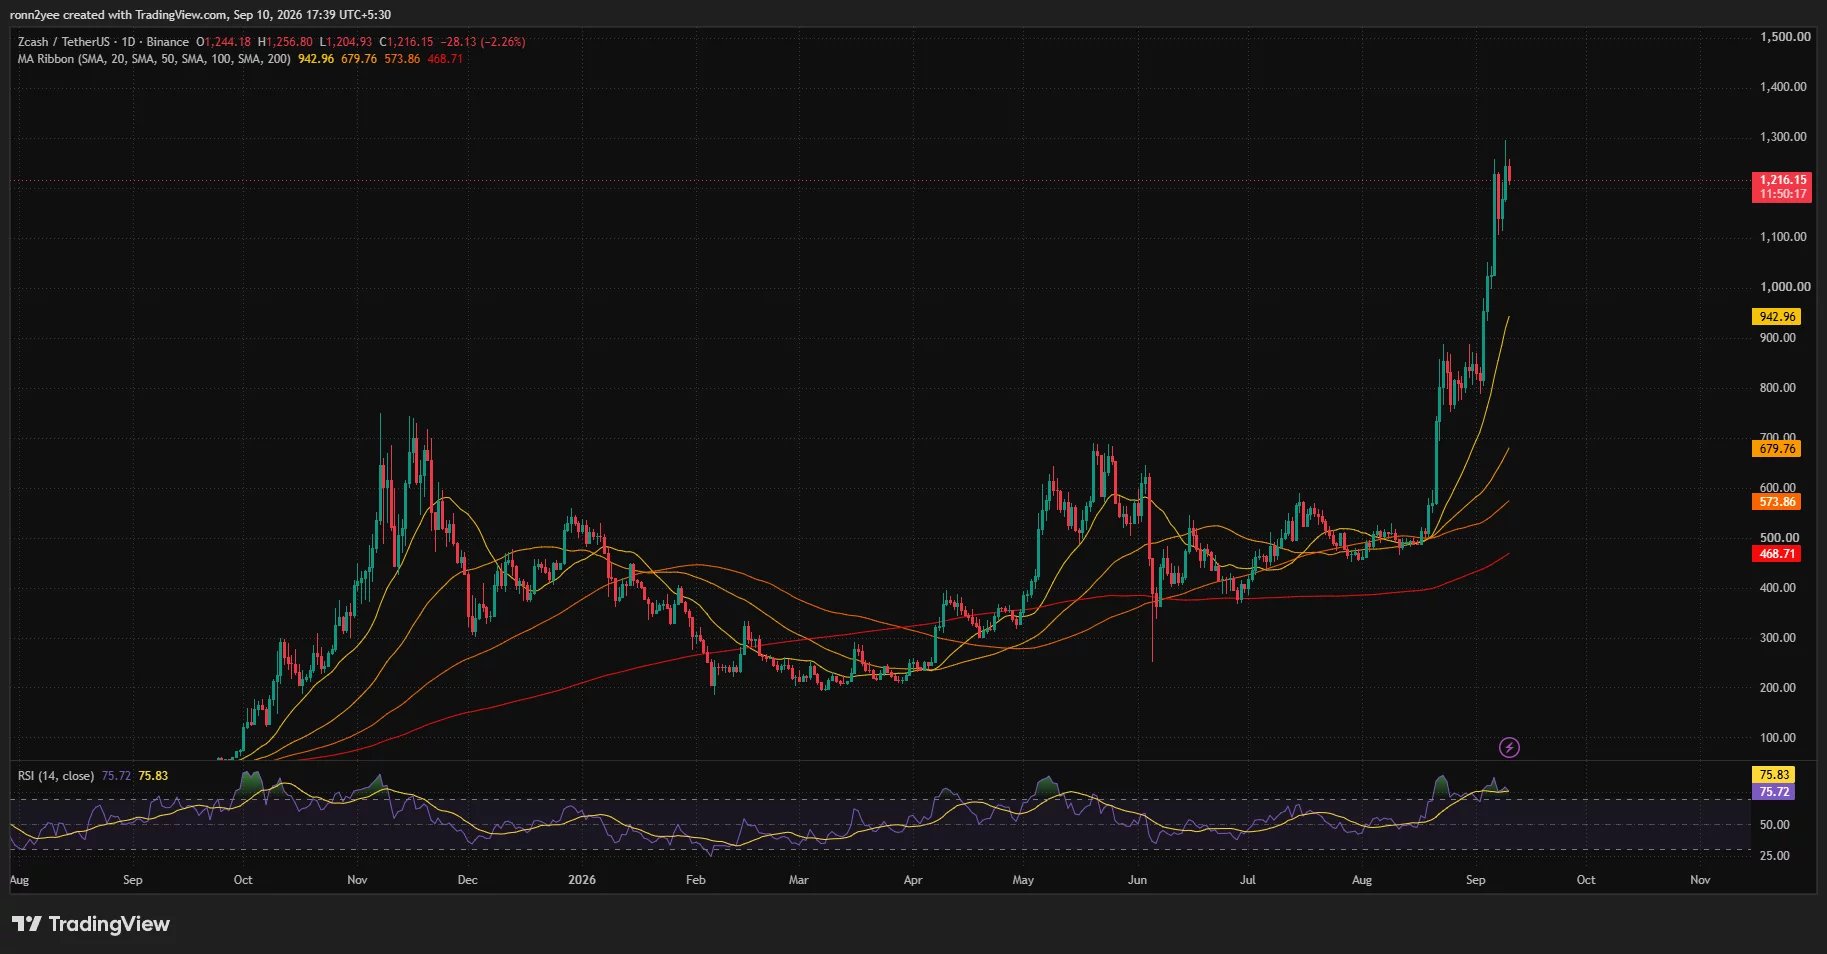
ZEC was therefore about 29% above its 20-day average and more than 159% above its 200-day average. Large gaps between price and long-term moving averages often show strong momentum, but they can also leave an asset vulnerable to mean reversion.
The moving averages remained in bullish order, with the shorter averages positioned above the longer ones. Maintaining that structure would support the broader uptrend even if ZEC experiences a short-term correction.
The daily relative strength index stood at 75.72, with its signal average at 75.83. A reading above 70 is generally treated as overbought, suggesting that the market may need to consolidate before attempting another sustained advance.
The indicator had also eased from its recent peak while ZEC held close to its highs. Continued cooling in the RSI without a sharp price decline could help reduce the overbought condition. A drop in both price and RSI, however, would point to weakening momentum.
4-hour chart puts $1,196 support in focus
Zcash was testing the middle Bollinger Band on the 4-hour chart. The indicator’s midline stood at $1,196.28, making the $1,190–$1,200 range the first support area to watch.
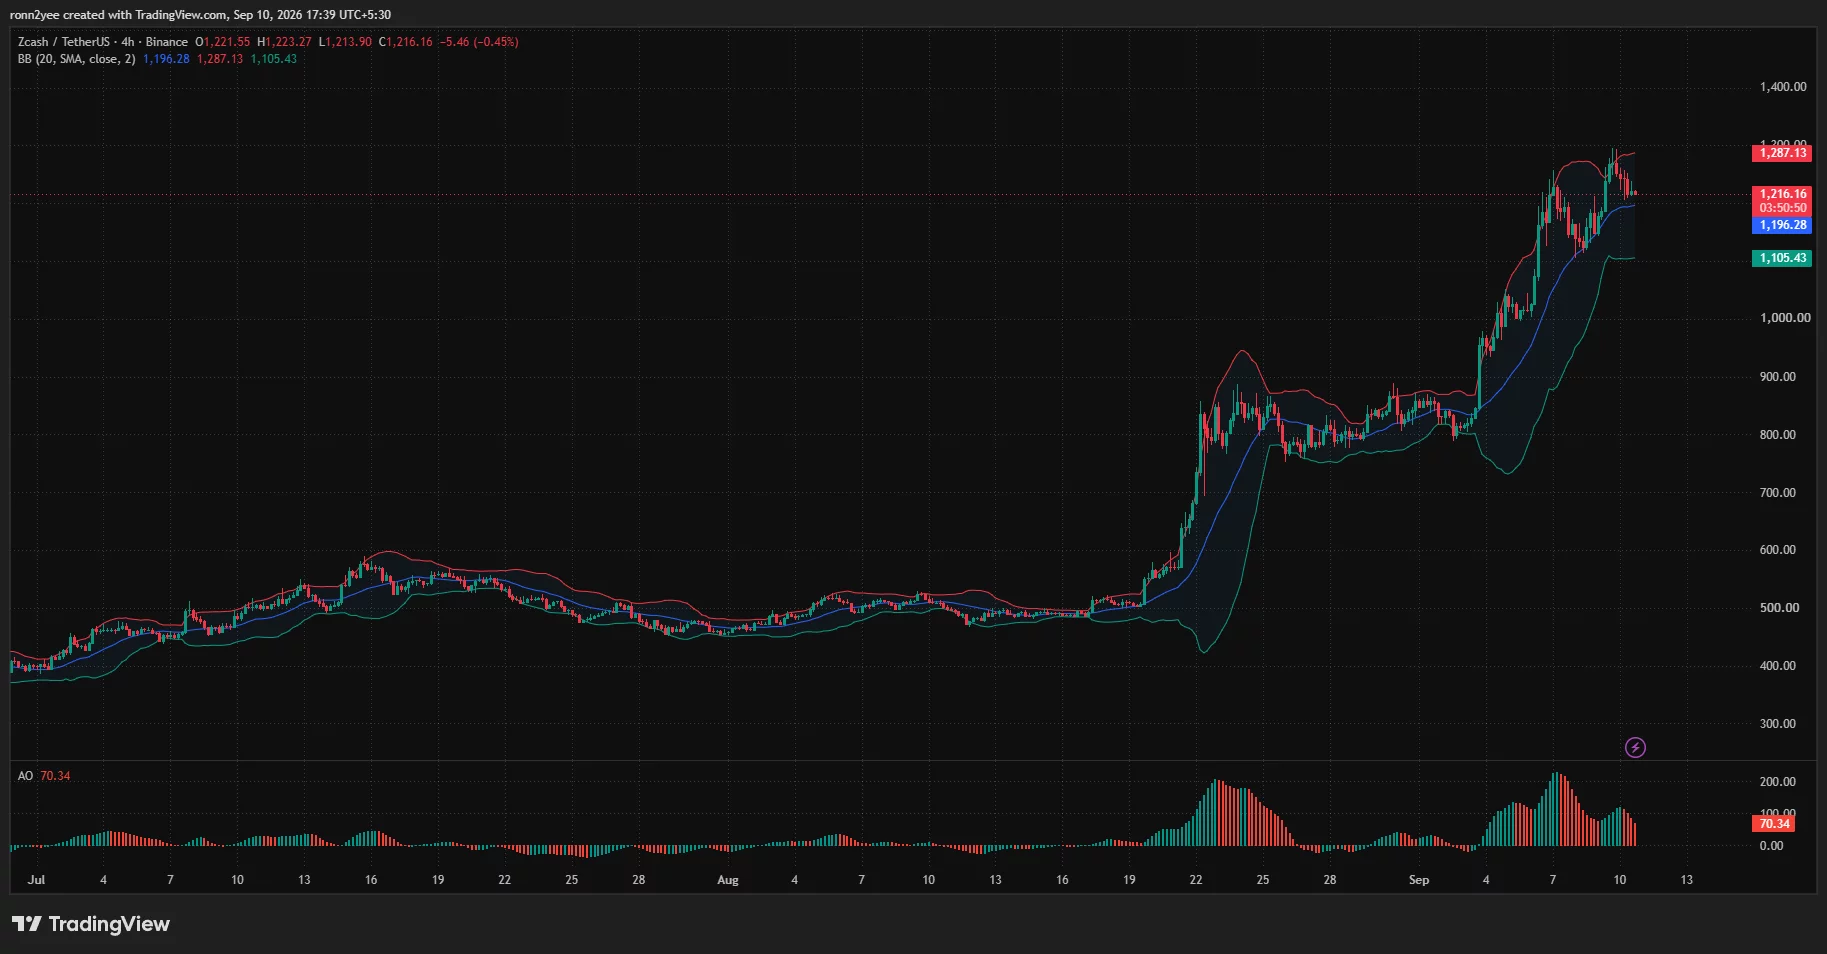
The upper Bollinger Band was located at $1,287.13. A 4-hour close above that level would place ZEC beyond the recent high and could open the way toward the round-number resistance at $1,300.
The lower band stood at $1,105.43, aligning with the wider $1,000–$1,100 demand region identified by crypto trader Altcoin Sherpa. The analyst said both levels were areas of interest but preferred to see ZEC spend time building a base instead of trying to identify an exact bottom.
The Awesome Oscillator remained positive at 70.34, showing that short-term momentum had not turned bearish. Its histogram bars were contracting, however, indicating that the pace of the advance was slowing.
A loss of $1,196 could expose the recent intraday area near $1,170, followed by the lower Bollinger Band around $1,105. A deeper decline would bring the $1,000 breakout level back into focus.
Liquidation map shows pressure on both sides
CoinGlass’ 24-hour ZEC liquidation heatmap placed several liquidity clusters above the market, including concentrations around $1,245–$1,270, $1,290–$1,305 and $1,320.
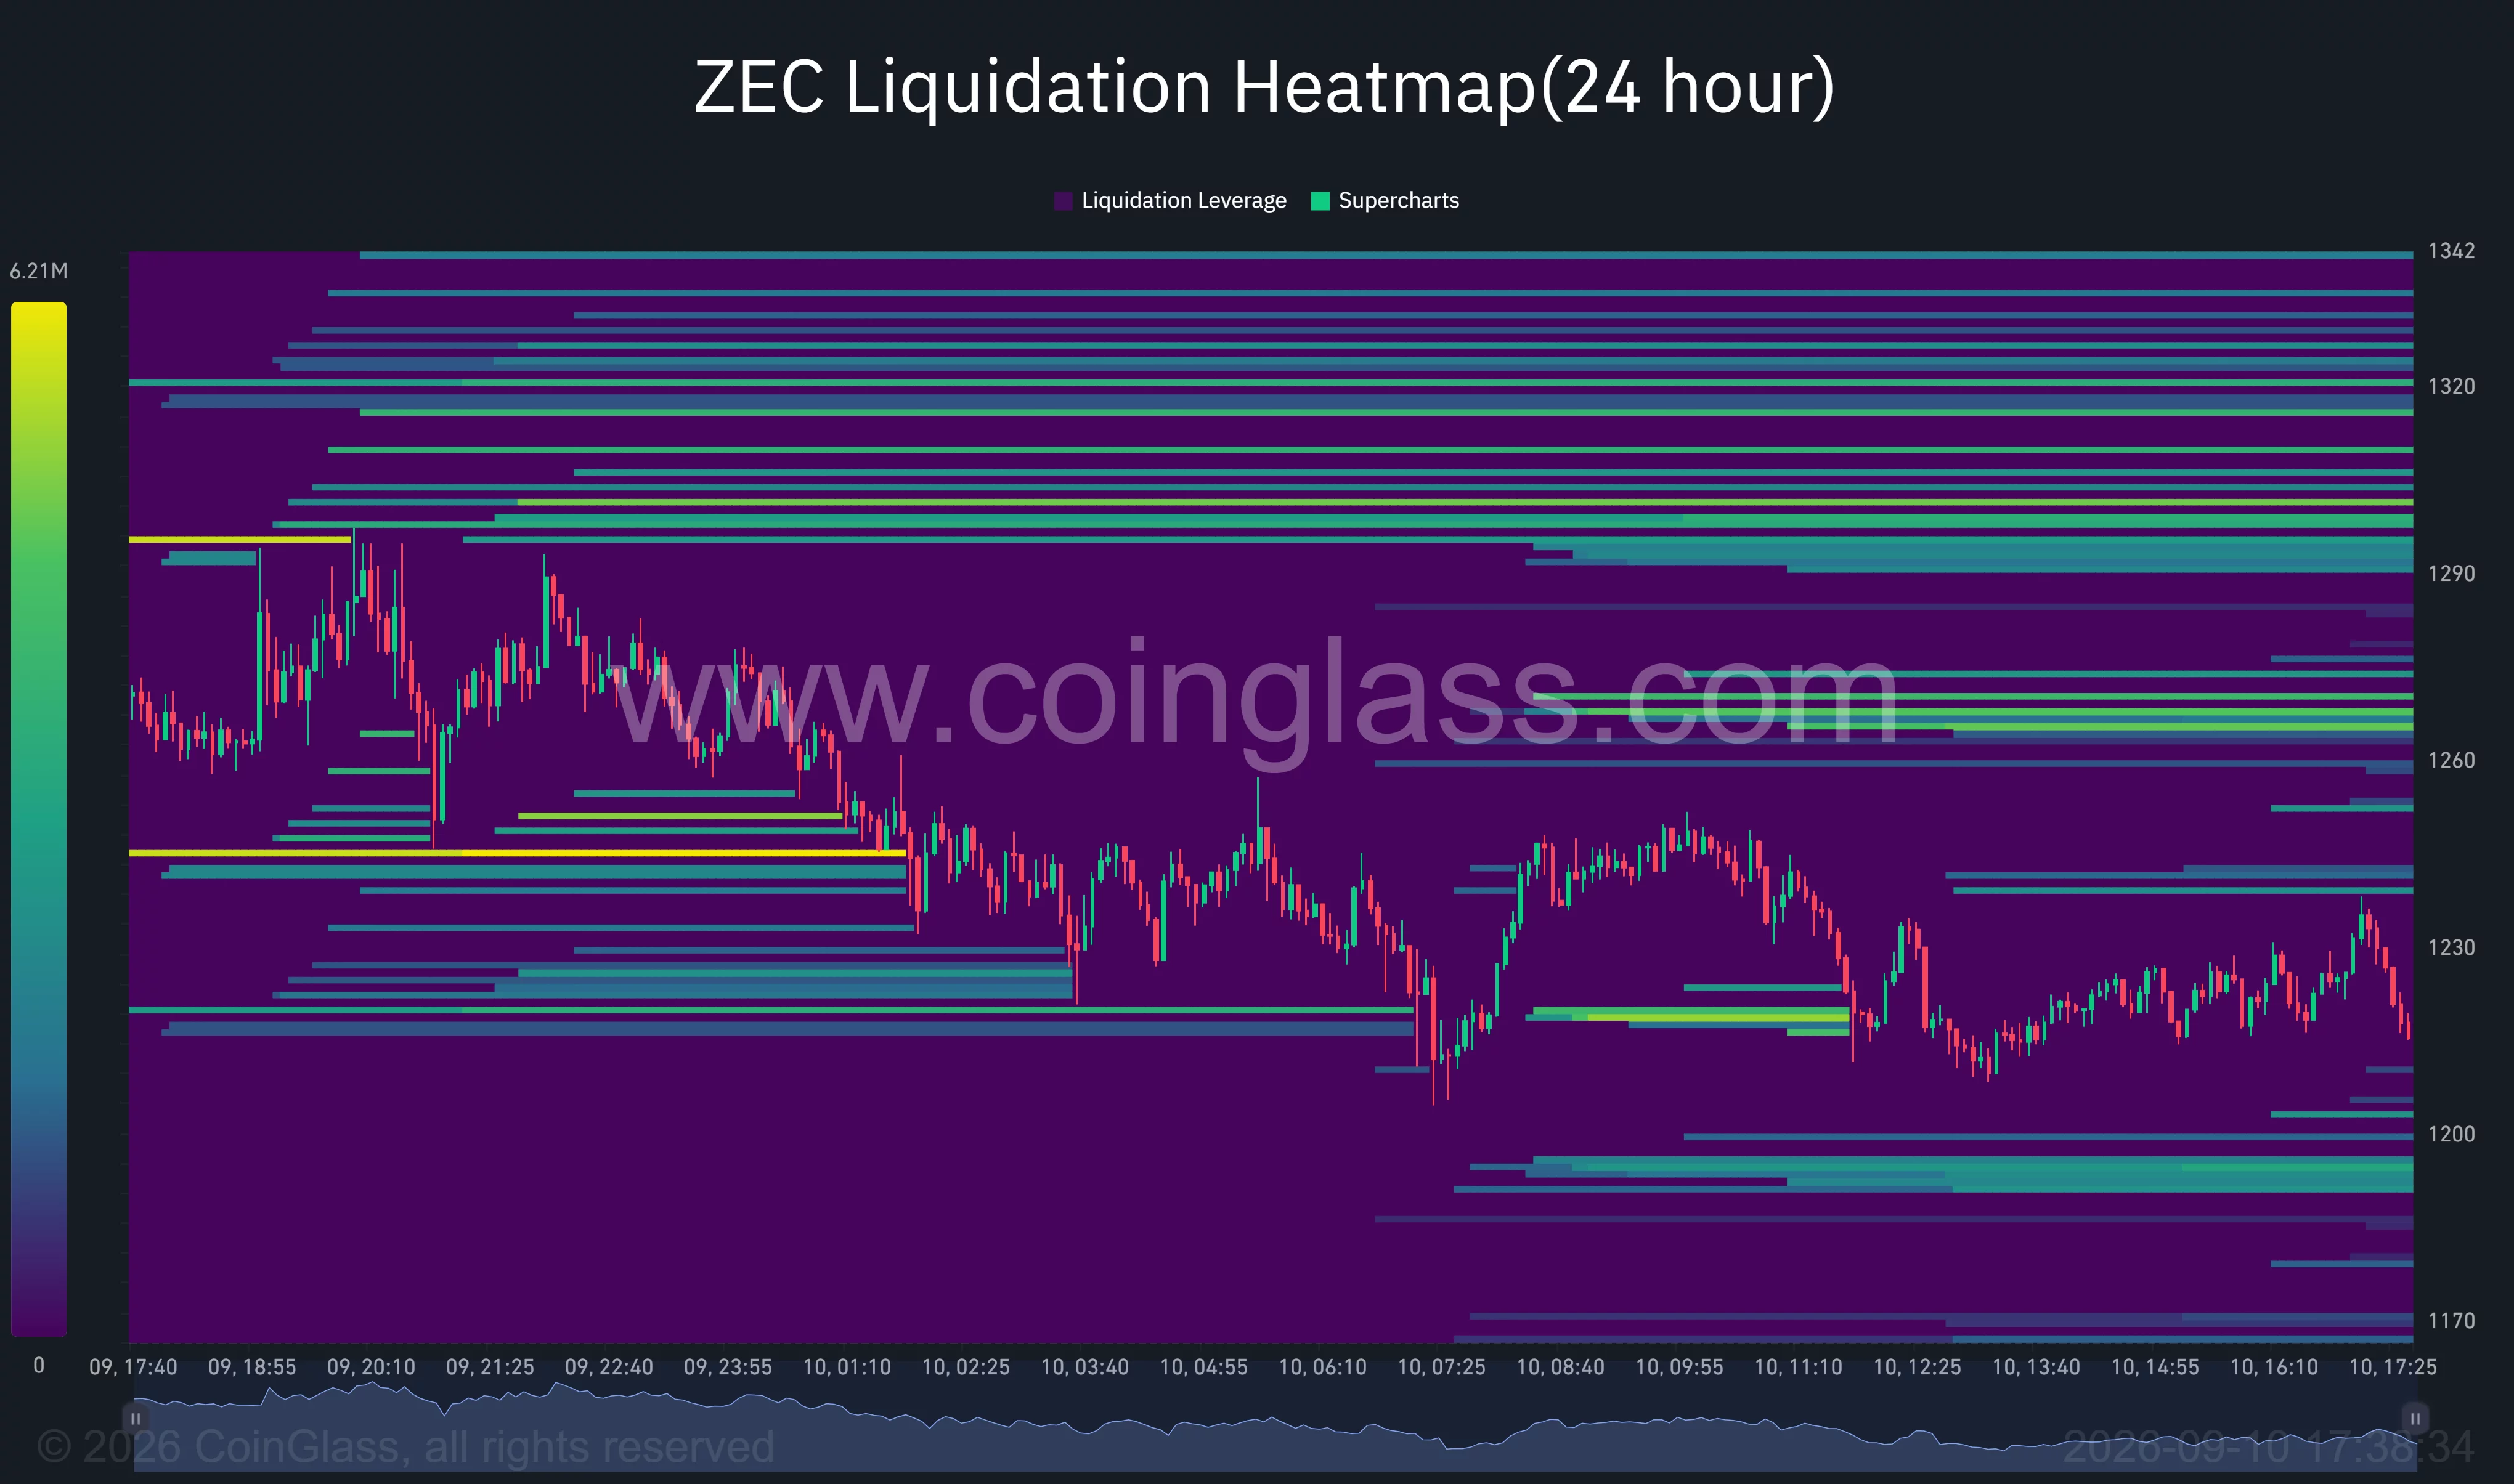
A recovery toward those levels could force short sellers to close positions, adding buy orders to the market. The nearest cluster around $1,245 also overlaps with the latest intraday trading range, making it an immediate barrier for bulls.
Below the market, the heatmap showed liquidity near $1,195–$1,200 and around $1,170. A break under $1,200 could therefore accelerate the decline as leveraged long positions face pressure.
The distribution leaves ZEC between competing liquidity zones. Holding $1,196 would keep the upper clusters within reach, while a clear loss of the level could draw price toward $1,170 or $1,105.
Analysts warn of a Zcash correction
Analyst Ali Martinez said the TD Sequential indicator had produced a sell signal on Zcash’s three-day chart. He compared the setup with a previous signal on May 19 that preceded a 64% correction.
The historical comparison does not mean ZEC will repeat the earlier decline, but it adds to the caution signaled by the elevated daily RSI and contracting 4-hour momentum.
Altcoin Sherpa maintained a longer-term bullish view but said the current move would benefit from a period of consolidation. His chart presented a possible path in which ZEC retreats toward the $1,000–$1,100 area, forms a base, and later resumes its advance.
For US traders, derivatives positioning may remain the key short-term risk after the reported short squeeze. A move above $1,287–$1,300 would strengthen the bullish case, while a sustained break below $1,196 could shift attention toward $1,105 and the former $1,000 resistance zone.
Disclosure: This article does not represent investment advice. The content and materials featured on this page are for educational purposes only.

Bitcoin price fell below $78,000 on Sept. 10 as hotter U.S. producer inflation, ETF outflows and weakening technical indicators weighed on demand ahead of the Federal Reserve’s September meeting.
Summary
- Bitcoin price fell 1.31% to $77,278 after reaching an intraday low of $76,676.
- Price broke below the daily Bollinger Band midpoint and 4-hour Supertrend support.
- 4-hour CMF dropped to -0.06, indicating that capital flows favored sellers.
- Liquidation clusters near $79,500–$80,000 could become an upside price magnet.
Bitcoin price falls toward its lower Bollinger Band
According to data from crypto.news, Bitcoin (BTC) price was trading near $77,278 at the time of writing, down 1.31% on the daily chart. The asset opened the session at $78,306 before falling as low as $76,676, placing it near the bottom of its recent trading range.
The wider crypto market also declined 2.01% over 24 hours to $2.65 trillion. Ether traded near $2,420, while XRP and Solana changed hands around $1.36 and $99.31, respectively.
U.S. producer inflation contributed to the risk reduction. August headline producer price inflation reached 5.4%, slightly above the 5.3% forecast, while core PPI climbed to 4.6%, its highest reading since June 2026.
The hotter figures added to concerns that the Federal Reserve could raise rates at its Sept. 15–16 meeting. Higher rates can place pressure on crypto and other risk assets by raising yields on cash and government debt.
Bitcoin’s daily chart shows that the latest retreat followed several failed attempts to sustain gains above $80,000. Price also formed lower highs after its early September peak above $82,000, showing that buyers lost momentum near the upper end of the range.
Daily indicators point to $76,392 support
Bitcoin has dropped below the daily Bollinger Band midpoint at $78,650. Losing that level shifts attention to the lower band at approximately $76,392, which sits just below the Sept. 10 intraday low.
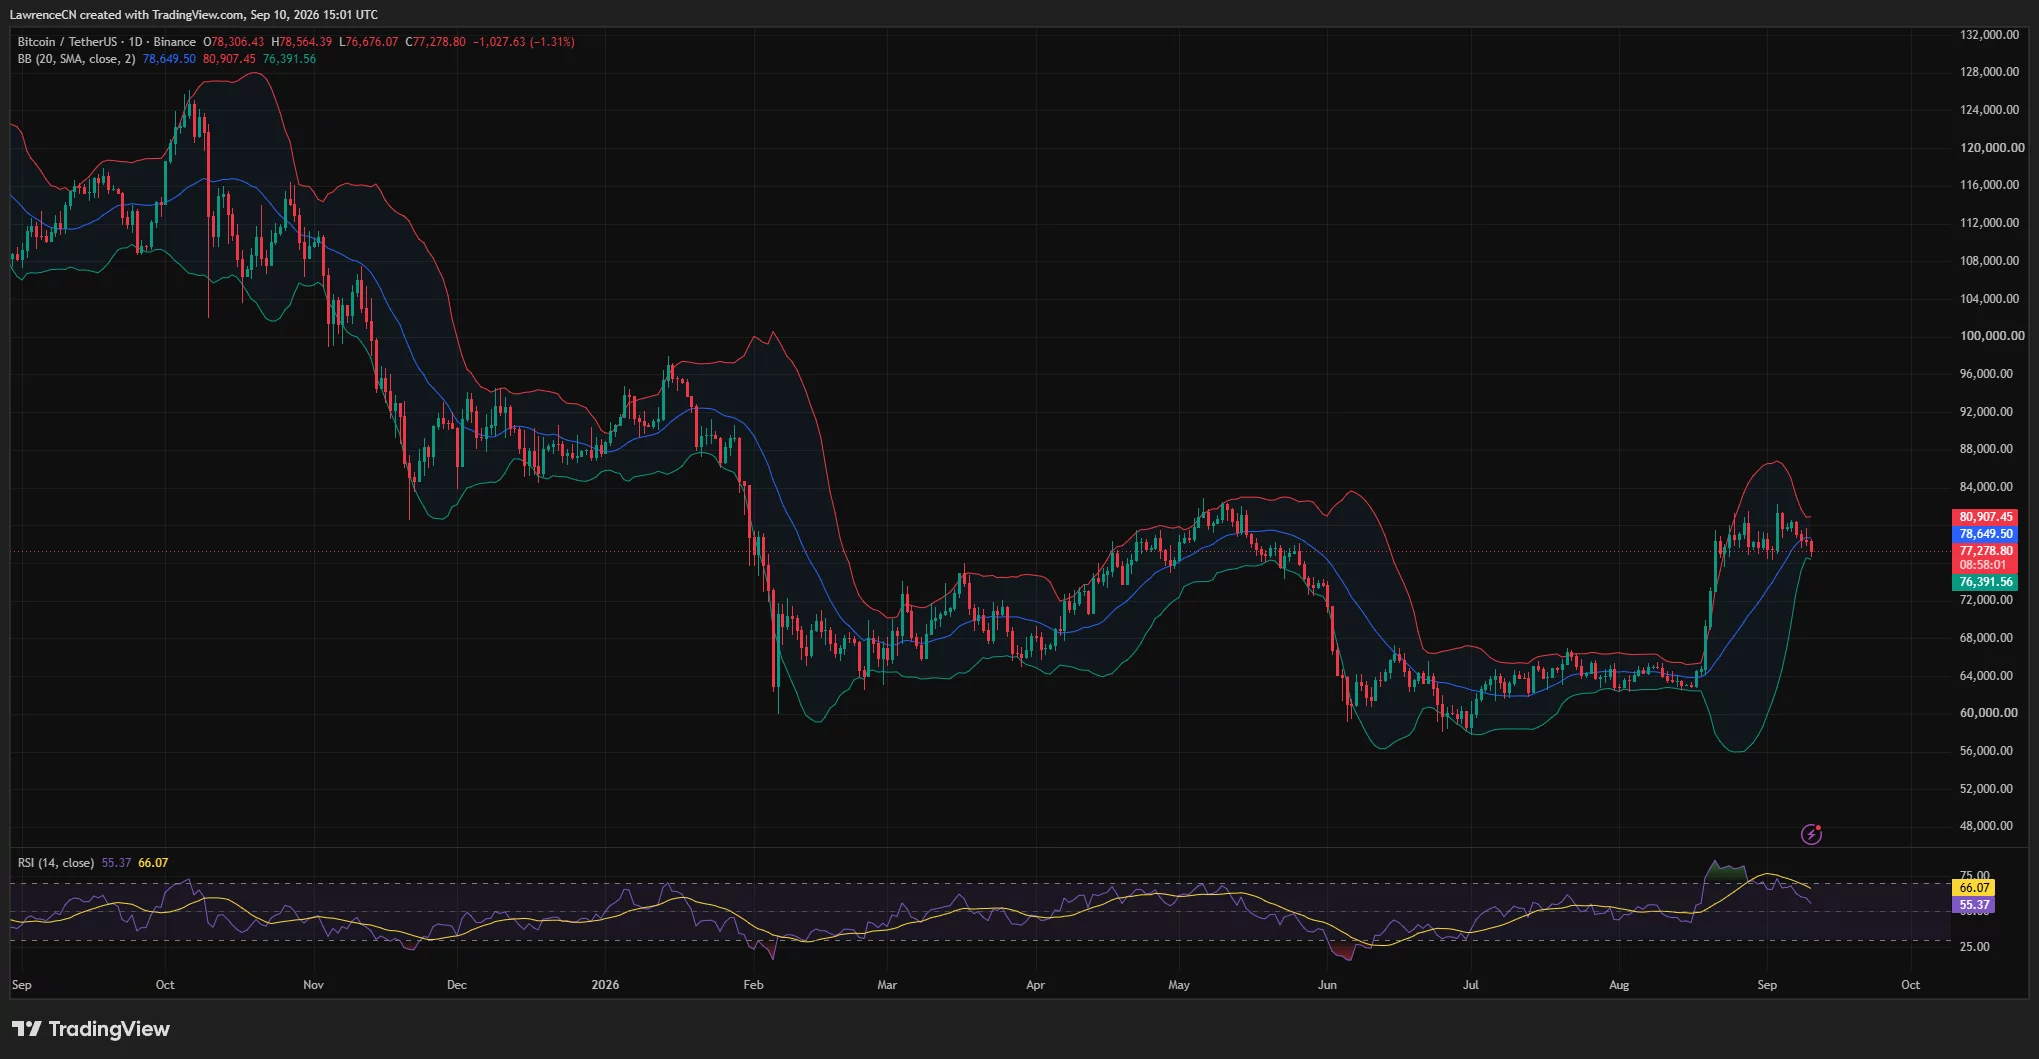
The Bollinger Bands place the upper boundary near $80,907. Bitcoin would need to recover the midpoint before mounting another attempt at that upper resistance.
Daily relative strength has also started to cool. The RSI stood at 55.37, down from its moving average of 66.07. The indicator remains above the neutral 50 mark, but the decline shows that bullish momentum has weakened since the early September rally.
A daily close below $76,392 would confirm a break under the lower Bollinger Band and expose the psychological $76,000 level. If buyers fail to defend that area, the next visible support zones are near $75,000 and $74,000.
Holding the lower band would keep Bitcoin inside its volatility range. A rebound would first face resistance around $78,650, followed by $80,907 and the recent swing area between $82,000 and $82,300.
4-hour Supertrend turns bearish below $79,676
The 4-hour chart presents a weaker short-term setup. Bitcoin closed the latest displayed candle around $77,276 after trading between $76,676 and $77,959.
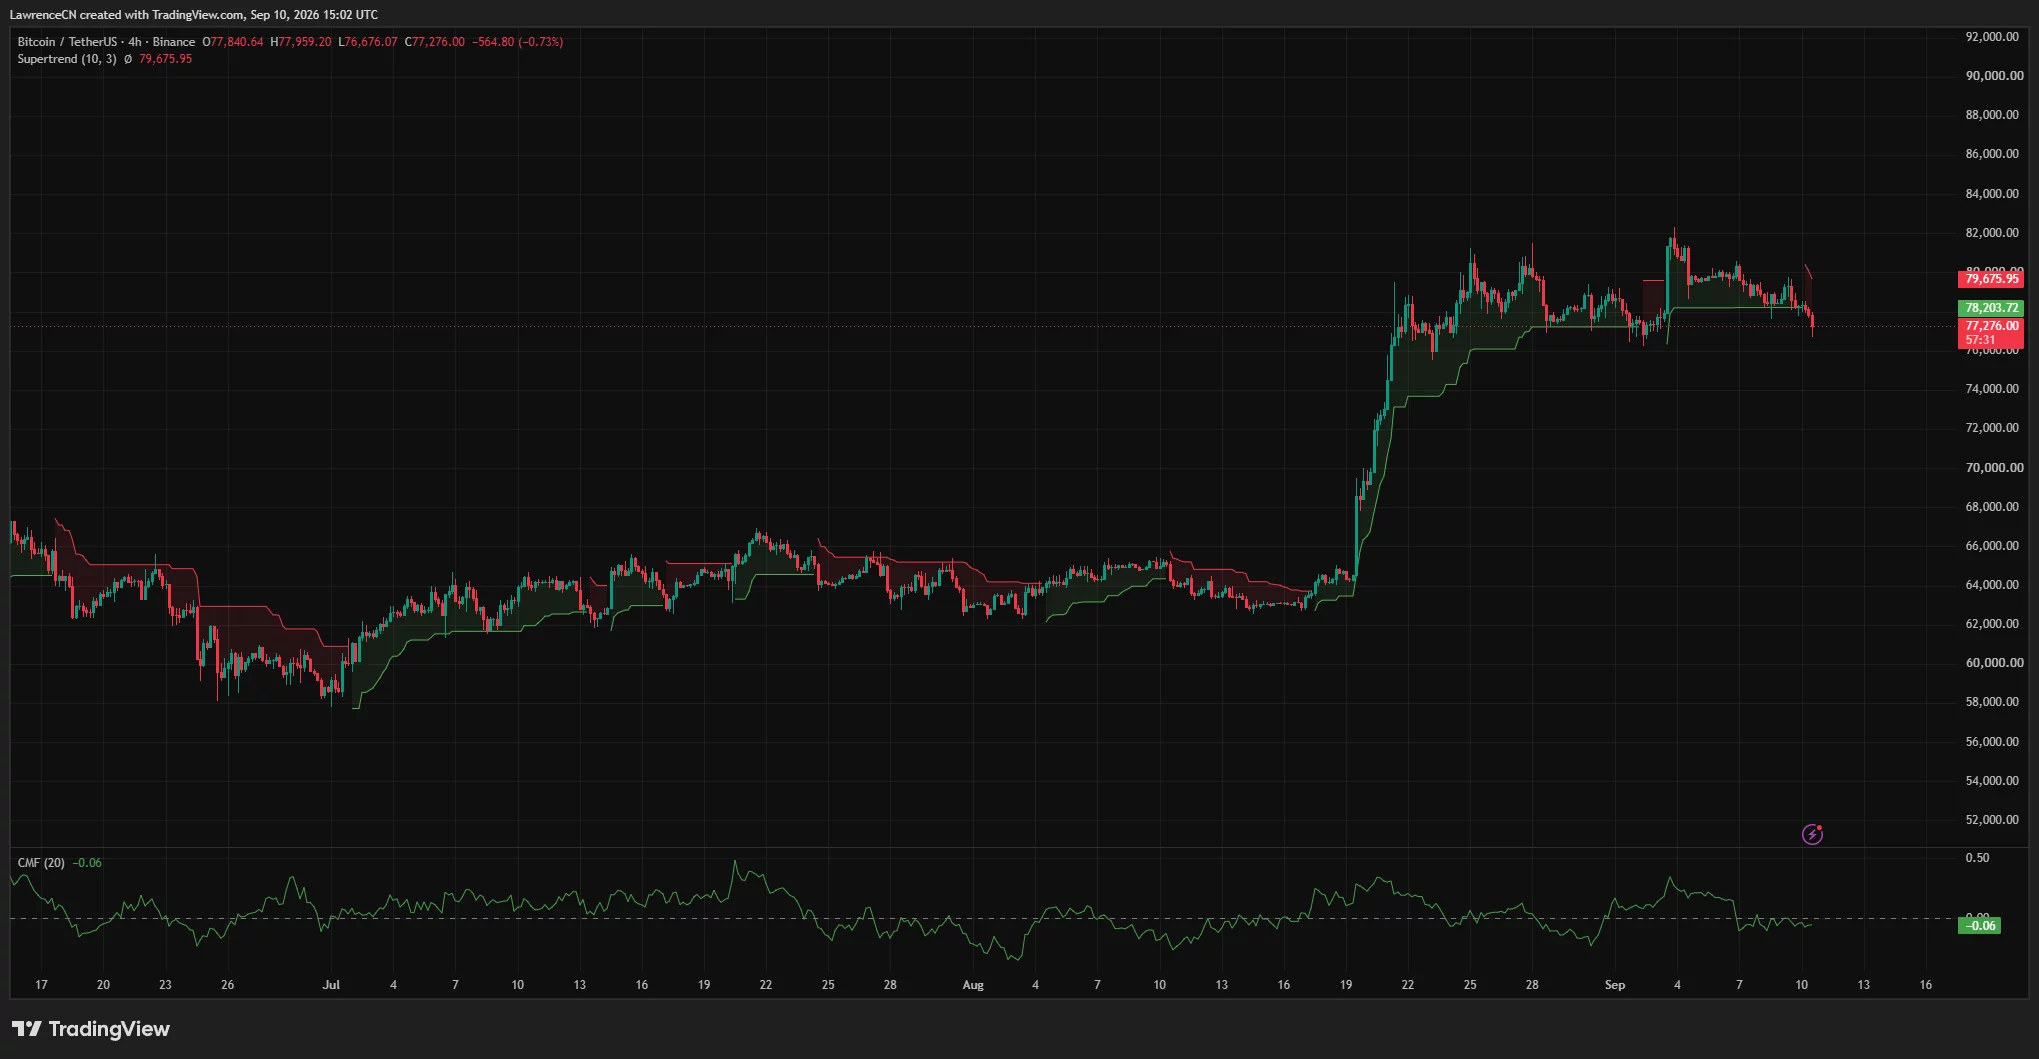
Price has fallen below the former Supertrend support near $78,204. The indicator has switched to a bearish reading, with resistance now positioned at approximately $79,676.
The change means Bitcoin would need to reclaim both $78,204 and $79,676 to weaken the current sell signal. Failure to recover those levels would leave sellers in control of the lower-timeframe trend.
Chaikin Money Flow stood at -0.06 on the 4-hour chart. A negative reading indicates that selling pressure and capital outflows outweighed buying activity during the indicator’s measurement period.
The price decline and negative CMF reading support the bearish Supertrend signal. However, Bitcoin’s bounce from the $76,676 intraday low shows that buyers remain active above the daily lower Bollinger Band.
Liquidation heatmap places major liquidity near $80K
CoinGlass’s three-day liquidation heatmap shows several concentrated liquidity zones on both sides of Bitcoin’s current price.
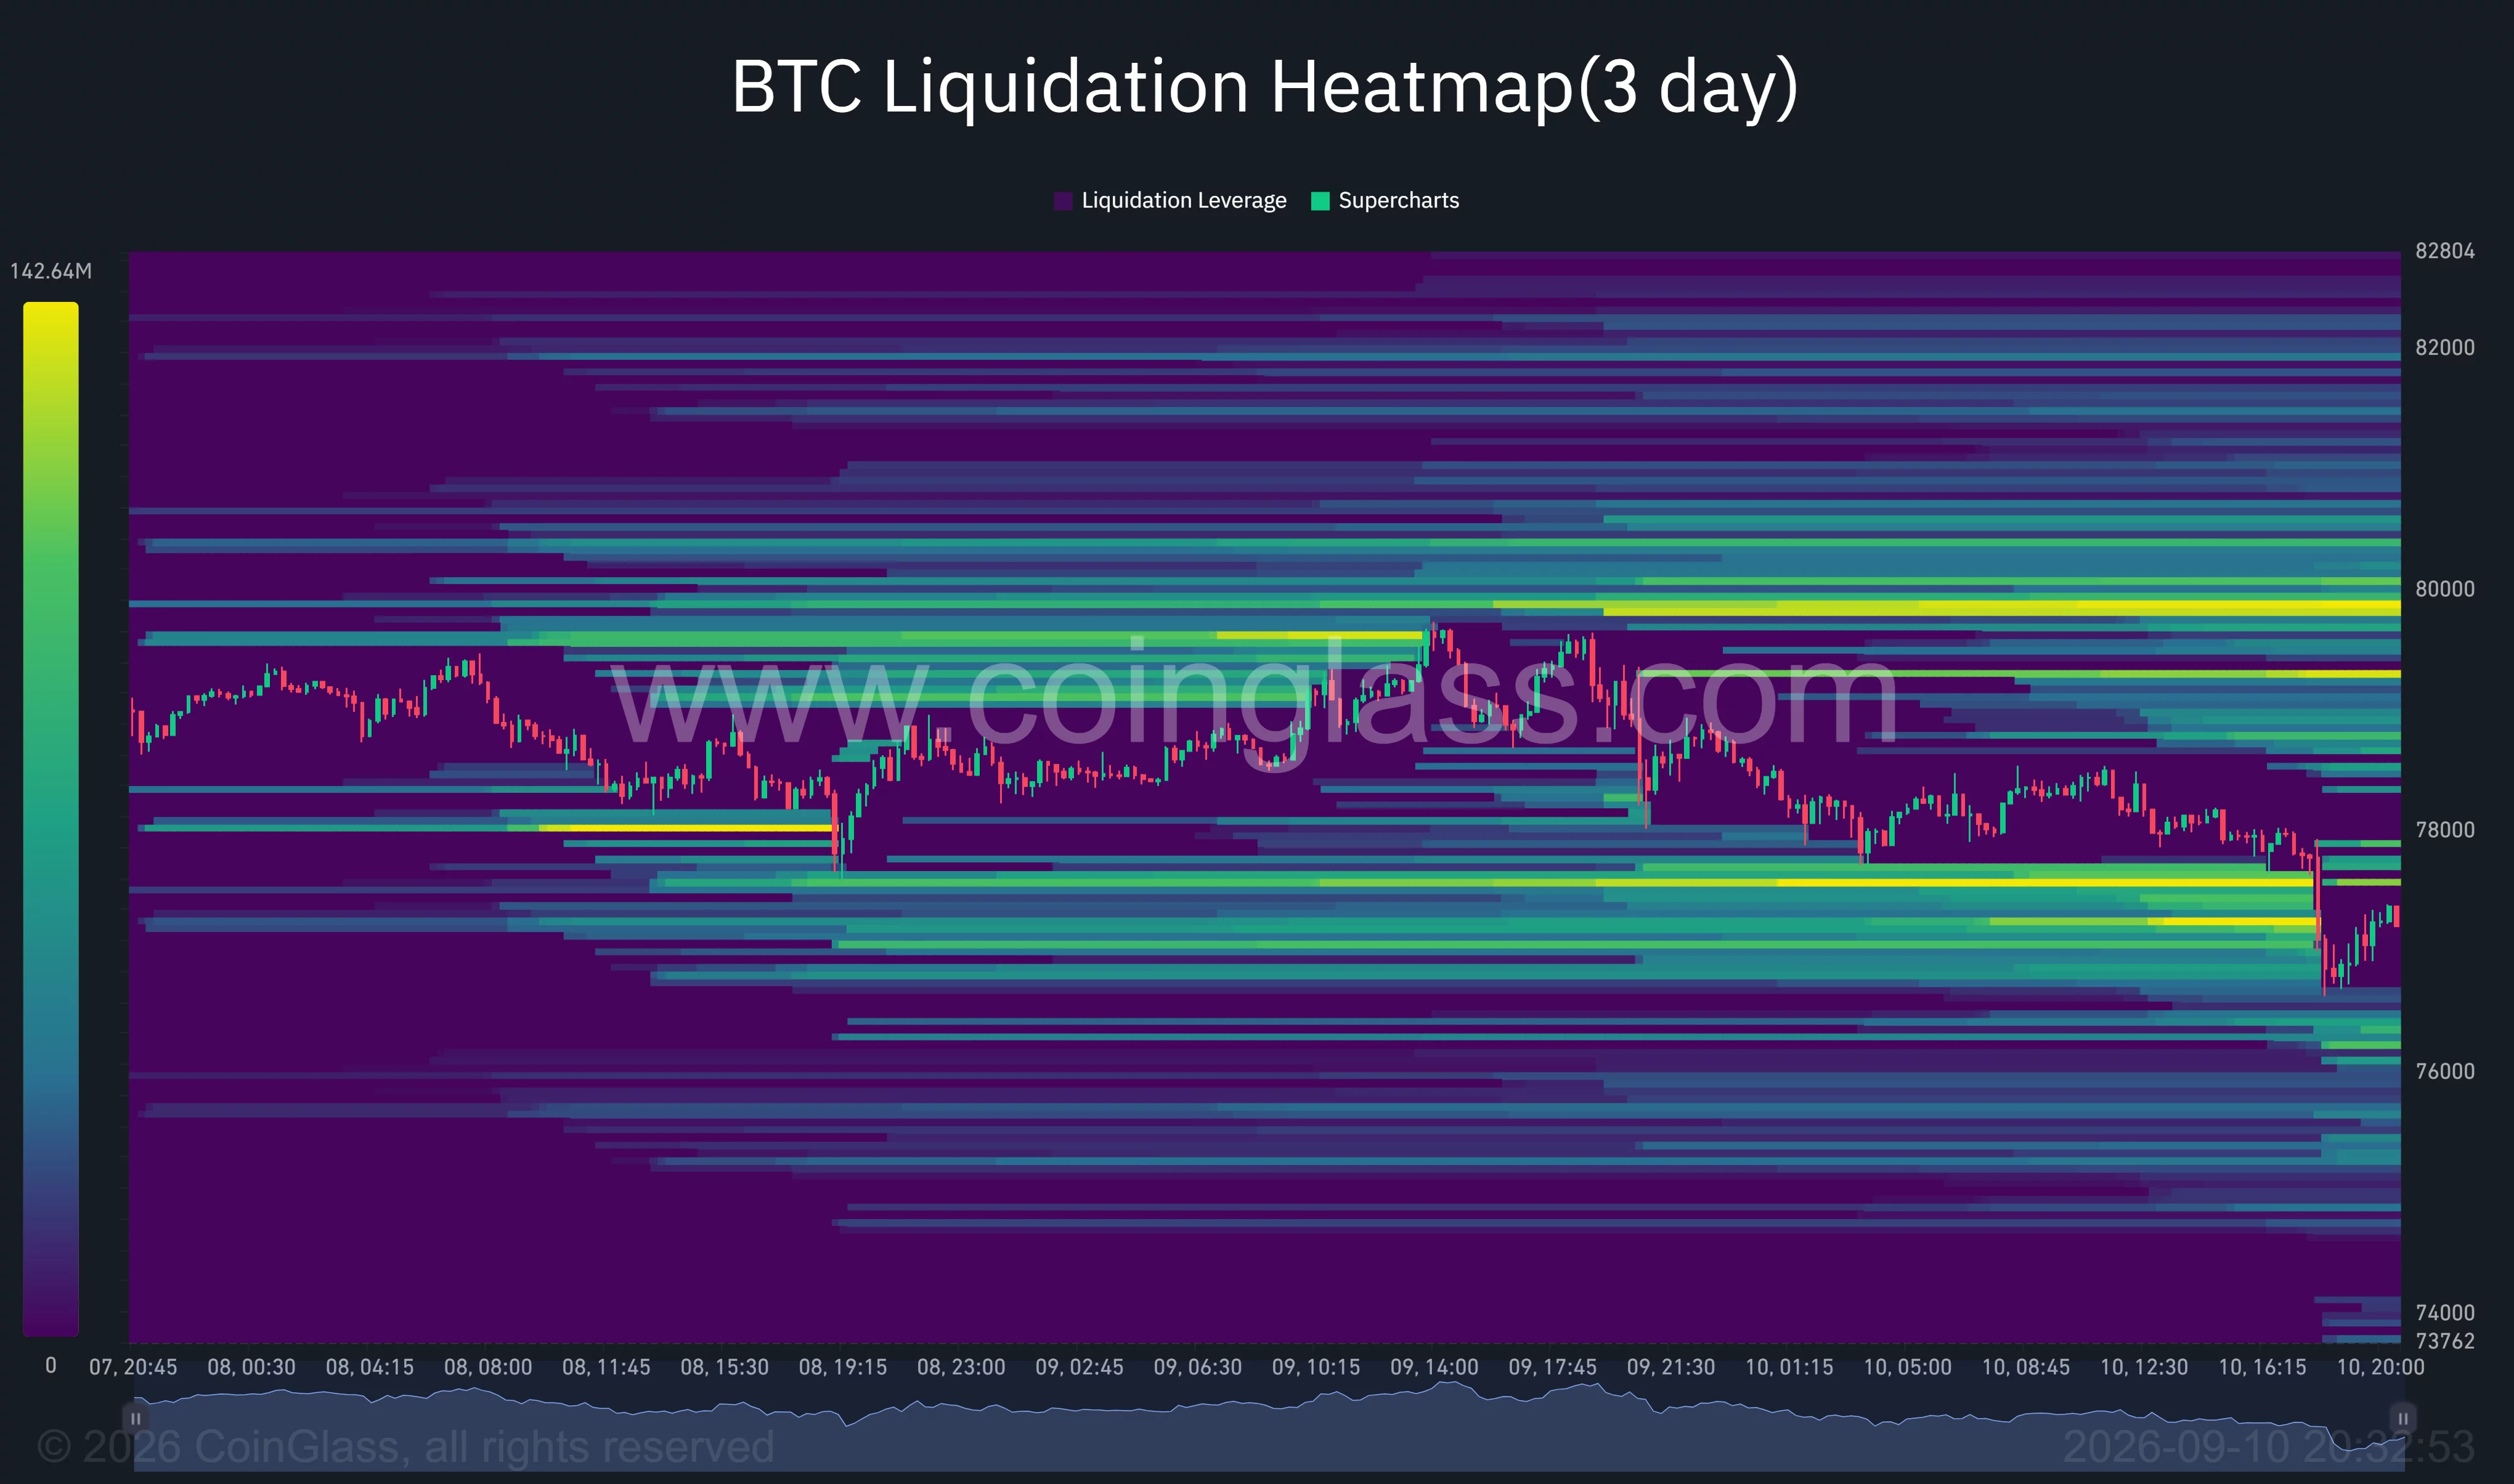
The most notable overhead cluster sits between roughly $79,500 and $80,000. Additional liquidity appears around $79,200, with smaller bands extending above $80,000. A recovery through $78,200 could draw the price toward those levels as short positions face growing liquidation risk.
Liquidity below the market is concentrated around $76,800 to $77,500, where the latest selloff appears to have cleared part of the accumulated leverage. Further bands remain near $76,000 and between $74,000 and $75,500.
Liquidation heatmaps identify areas where leveraged positions may be forced to close, but they do not determine price direction. Bitcoin could move between the nearest clusters as traders reduce exposure before the Fed decision.
US inflation and ETF outflows add pressure
CME FedWatch data placed the probability of a 25-basis-point September rate increase at about 60%, up from earlier expectations. Such a move would lift the federal funds target range from 3.50%–3.75% to 3.75%–4.00%.
Institutional demand also weakened before the meeting. U.S. spot Bitcoin ETFs recorded $201.9 million in net outflows on Aug. 29, ending a nine-day inflow streak, although the week still finished with $924.5 million in net inflows.
The technical setup leaves $76,392 as the main near-term support. A break below it could extend the decline toward $76,000 and $74,000, while a recovery above $78,650 would give bulls another chance to target the liquidation cluster near $80,000.
Disclosure: This article does not represent investment advice. The content and materials featured on this page are for educational purposes only.


Pump.fun said on Wednesday that creators can launch coins paired with tokenized stocks, wrapped bitcoin and ether, and metals, instead of the SOL and USDC pairs the Solana launchpad has offered until now. The product is called Custom Pairs and is live in the create form. The change brings onto… Read the full story at The Defiant
Liquid Network has restarted block production after a major Bitcoin withdrawal from its federation wallet, but it is still operating in a limited recovery mode. According to a Thursday update posted on X by Liquid_BTC, the network resumed producing blocks “without transactions” while teams monitor the system for “full stabilization.”
Peg operations—including peg-outs authorized via PAK—remain suspended as Liquid works to restore its BTC/L-BTC reserve. The restart comes after emergency software changes to Elements, the open-source platform that underpins Liquid.
Key takeaways
- Liquid resumed block production, but transaction processing and peg-outs are still paused during recovery.
- Liquid says functionary and bridge node updates have been deployed, with functionary nodes now signing and validating blocks.
- Peg operations remain halted until the network can rebuild its BTC/L-BTC reserve.
- The incident was tied to a vulnerability involving proof verification cache handling in Elements, addressed by an emergency update.
Block production returns—transactions stay paused
Liquid’s latest status update emphasizes caution. In the X post, Liquid states that block production has resumed as a precautionary measure, but “without transactions.” The network is being monitored to confirm that it has fully stabilized before broader functionality is restored.
Alongside the operational restart, Liquid says required upgrades to critical infrastructure nodes have already been pushed. Functionary nodes are now signing and validating blocks “as intended,” which suggests that core consensus duties are functioning again—even though user-facing activity is still constrained.
For participants, this distinction matters. Restarting block production can help ensure the system remains synchronized and responsive, but pausing transactions and peg operations reduces the risk of further complications while the reserve and related state are repaired.
Elements emergency update addressed a proof-verification cache issue
A day before the block production restart, Liquid issued an emergency update to Elements, the software underlying the network. In an earlier X update from Liquid_BTC, the organization described the fix as a response to a vulnerability involving proof-verification cache handling tied to the incident.
Liquid’s recovery plan includes hardening cache keys used for range proofs as part of the software update. The post states the new release is Elements v23.3.4, designed to strengthen how the system verifies proofs during recovery-related operations.
From an investor and builder standpoint, the key takeaway is that Liquid is not just “restarting”—it is changing the underlying mechanics that were implicated in the exploit pathway. That generally reduces the likelihood of a repeat incident once peg functions and transaction handling return.
What happened to the federation wallet balance
The operational pause was triggered on Sept. 6 after actors described as “white-hat hackers” withdrew approximately 4,000 BTC—valued around $320 million at the time—from Liquid’s federation wallet, according to earlier coverage from Cointelegraph.
Liquid previously indicated that the withdrawal involved L-BTC originating from a bug in Elements. The withdrawing portion represented about 95% of the federation wallet’s balance, which was roughly 4,200 BTC.
Subsequently, Cointelegraph reported that 3,400 BTC—worth about $270 million at the time—was returned after Blockstream confirmed that affected bridge nodes had been patched. Even with the return, 598 BTC—roughly $46 million at current prices—remained outstanding as of Sept. 7.
Liquid’s current emphasis on rebuilding its BTC/L-BTC reserve aligns with that earlier balance reality: peg operations are effectively the bridge between the reserve and minted/burned representations. Until the reserve is restored to safe levels and the system’s node components are verified to be operating correctly, resuming peg-outs would create avoidable settlement and redemption risk.
Why the “no transactions” restart is a meaningful step
The move to resume block production—while still withholding transactions—signals that Liquid believes its recovery controls are working, but that it is not yet comfortable restoring normal user workflows. In practice, it lets the network keep progressing at the protocol level, while limiting the number of moving pieces that could interact with remaining reserve and peg-state uncertainty.
As Liquid continues monitoring, the next practical question for market participants is whether peg operations will resume once reserve restoration is confirmed and node updates have been validated under real operating conditions.
Readers should watch Liquid’s follow-up status updates for any change in peg-out authorization and for confirmation that transaction processing can safely return—especially after the Elements v23.3.4 fix and the earlier bridge-node patching are fully validated against the incident’s root cause.


Hunter Biden has denied profiting from his LAPTOP memecoin after its launch-day price crash, adding that neither he nor his team had sold tokens.
Several X users accused the LAPTOP project of a “rug pull” after the memecoin lost more than 95% of its value in the first hour of trading on Wednesday. At the time of writing, the new token traded at $0.8562, according to CoinGecko data.
“The team’s allocation is locked. Nobody on our side sold, and nobody could have,” Biden said in an X post Wednesday. “I, personally, have not made a single dollar.”
Biden blamed the price action on insufficient liquidity and “snipers,” which are trading bots that quickly swoop up tokens when trading opens.
The Base memecoin takes its name from a MacBook Hunter Biden reportedly left at a repair shop in 2019. Trump allies used the New York Post’s reporting on files purportedly from the device against him and his father, former US President Joe Biden, during the 2020 election.
Before launching his own memecoin, Biden slammed the Trump family’s crypto ventures. In an Aug. 21 post, Biden said World Liberty Financial used political influence and leverage to benefit its founders.
Biden did not respond to Cointelegraph’s request for comment.
Related: Joe Biden’s son to launch memecoin, will send to TRUMP holders: WSJ
LAPTOP team announces liquidity incentives and token burns
The LAPTOP team defended the launch in a community update by claiming it held no token presale and made no allocations to investors or influencers. It said the contract address, token allocations, a Hacken security audit and a white paper were published before trading began.
“There was no stealth deployment, no hidden supply, and no surprise to benefit insiders,” the team said in a Medium post.
It claimed the initial pool launched at $0.05 per token, but the market maker’s liquidity was insufficient to meet demand.
LAPTOP added it would deploy 4 million tokens, or 0.4% of the total supply, as liquidity incentives for Aerodrome pools, starting at midnight UTC on Thursday. It also announced plans to burn 10 million tokens within the first week of launch through its predictions program, equivalent to 1% of the original total supply.
Related: California Senate passes bill to ban memecoin issuance by public officials
According to the project’s disclosures, founders are allocated 300 million tokens, or 30% of the 1 billion token supply. Those tokens are locked for six months and then vest monthly over the following 24 months.
Another 30% is allocated to predictions tied to political, cultural and crypto events. Tokens are burned when specified outcomes occur and allocated to charity otherwise. The disclosures say prediction-related burns affect unvested tokens.
The disclosures reserve 2% of the total supply for wallets that lost money on the TRUMP memecoin and 8% for eligible subscribers to Biden’s “Where’s Hunter” Substack newsletter. A separate 10% is allocated to future airdrops at the foundation’s discretion.
Nansen tracks wallet losses as Bubblemaps flags fresh holders
Nansen data shared with Cointelegraph on Thursday showed one LAPTOP wallet with an unrealized loss of $117,800 and another with a paper loss of $12,300.
Two other wallets showed unrealized gains of $13,100 and $1,800. None of those four addresses had sold LAPTOP at the time of the snapshot. The analysis covered five selected wallets.
Nansen also recorded 46,675 buy transactions and 16,038 sell transactions during the 24-hour period covered by its data, involving 20,085 unique buyers and 8,714 unique sellers.
Meanwhile, blockchain analytics platform Bubblemaps said Wednesday that 60% of LAPTOP’s top-holder wallets had no prior activity.
In a follow-up post, it defined “fresh” wallets as those funded within the previous 10 days and said most had been funded on launch day.
Magazine: Is Bitcoin too volatile to risk your retirement on?


Nasdaq’s venture arm agreed to invest $100 million in Payward, the parent company of Kraken, extending a tokenized-equities partnership the two firms struck in March and adding a market surveillance agreement that installs Nasdaq technology inside Payward’s trading venues, Nasdaq said on Thursday…. Read the full story at The Defiant


Robinhood has added searchable asset pages for JUGGERNAUT and FRONG, helping the Robinhood Chain meme coins climb as much as 500% and 130%, respectively, despite neither token being available for spot trading on Robinhood Crypto.
Summary
- JUGGERNAUT surged more than 500% within an hour before trimming part of the gain.
- FRONG climbed nearly 130% and reached a reported all-time high of $0.0164.
- Robinhood’s additions are searchable asset pages, not confirmed spot-market listings.
- Robinhood Chain generated a reported $4.5 billion in decentralized exchange volume over 30 days.
Robinhood asset pages trigger meme coin buying
Whale Scan first drew attention to searchable Robinhood asset pages for JUGGERNAUT and FRONG on Thursday, although Robinhood did not announce spot trading support for either token.
The pages allow Robinhood users to search for the tokens and monitor their market data. They do not mean Robinhood Crypto has enabled customers to buy or sell either asset on its centralized trading platform.
Confusion over the distinction appears to have contributed to the initial reaction. Myriad Markets co-founder Farokh Sarmad told his followers that Robinhood had created pages for the tokens rather than completed exchange listings.
“Basically, all they make is asset pages on Robinhood and you can search the coin, it’s not a listing,” Sarmad said.
Neither Robinhood nor Robinhood Crypto announced spot support for JUGGERNAUT or FRONG at the time of writing. A future spot listing also remains unconfirmed, meaning the appearance of an asset page should not be treated as a promise that trading support will follow.
Market-data pages are common across financial platforms because they let users follow assets that the platforms do not offer for trading. In this case, however, traders linked the newly searchable pages to possible Robinhood exposure and moved into the tokens on-chain.
JUGGERNAUT price soars more than 500%
JUGGERNAUT recorded the larger move, rising more than 500% within an hour of the asset page becoming visible. The token later gave back some of the advance, but remained approximately 380% higher at the time covered by the source report.
During the 24-hour period, JUGGERNAUT traded between a reported low of $0.0022 and a high of $0.0208. Its trading volume increased by more than 3,000%, showing that the price move came with a sharp rise in market activity.
Such percentage gains can be magnified when a small token trades in pools with limited liquidity. Under those conditions, a wave of purchases can push the quoted price up quickly, while large sales may produce an equally fast decline.
FRONG followed with a gain of nearly 130% before trimming its advance to about 100%. The token traded near $0.0106 and reached an all-time high of $0.0164 during the rally. Its 24-hour trading volume increased by more than 1,300% as activity around the token accelerated.
The gains came while the main crypto market pulled back following hotter-than-expected U.S. producer inflation data. According to the source report, U.S. PPI inflation reached 5.6%, adding pressure to risk assets even as activity in the two Robinhood Chain tokens accelerated.
Robinhood Chain meme coins draw speculative volume
Robinhood built its Ethereum layer-2 network around tokenized stocks and other real-world assets, yet permissionless token creation has also turned the chain into an active venue for meme coin trading.
According to figures in the source report, decentralized exchanges on Robinhood Chain processed $4.5 billion in volume during the previous 30 days. Tokenized stocks, exchange-traded funds, commodities, and U.S. Treasuries accounted for $166.5 million in value on the network.
CASHCAT became an early example of the speculative activity. In July, crypto.news examined the token after its market capitalization reached about $156 million, even though the project had no formal connection to Robinhood Markets.
The report found that CASHCAT had a fixed supply of 1 billion tokens and described itself as “fan fiction with a ticker.” At one stage, its market value stood at roughly 12 times the value of all tokenized real-world assets then recorded on Robinhood Chain.
CASHCAT remains the only meme coin from the network identified in the supplied report as available for spot trading through Robinhood. JUGGERNAUT and FRONG, by comparison, can be traded through on-chain venues but have only received searchable pages on Robinhood’s asset directory.
Early activity also relied heavily on Noxa, a launchpad that supported more than 60,000 token deployments and controlled about 75% of launches on the chain. The platform later halted new launches after generating more than $12 million in fees, while CASHCAT fell by over 33%.
A separate examination of the Noxa platform outage found that its system added single-sided liquidity to Uniswap V3 pools when tokens launched. Noxa stopped accepting new projects on July 11, before its website became unavailable two days later.
U.S. users still face the risks of on-chain trading
Robinhood Markets is a U.S.-listed financial services company, but the presence of a token on Robinhood Chain does not make it an official Robinhood product. Permissionless networks allow outside developers to deploy tokens without the company creating, owning, or endorsing them.
For American users, the difference between a Robinhood asset page and a Robinhood Crypto market affects where and how a trade takes place. Buying an unsupported token through a decentralized exchange may require a self-custody wallet, network fees, and interaction with an on-chain liquidity pool rather than a standard Robinhood brokerage order.
Robinhood’s disclosures for supported crypto assets do not automatically extend to unrelated tokens deployed on its blockchain. Users must therefore check the contract address, available liquidity, and project ownership before making an on-chain transaction.
The Internal Revenue Service treats digital assets as property for U.S. federal tax purposes. A sale, exchange, or disposal of JUGGERNAUT or FRONG may create a reportable capital gain or loss for a U.S. taxpayer, including when the trade takes place through a decentralized exchange rather than a centralized platform.
Robinhood Chain has also faced pressure from heavy trading activity. Demand involving tokenized assets recently contributed to a network outage, temporarily disrupting transactions on a chain carrying stocks, ETFs, commodities and tokenized U.S. Treasuries.

IREN Limited (IREN) shares fell 3.3% on Thursday to $43.87, even as co-CEO Daniel Roberts told investors the company had just passed its hardest operational test.
Roberts published a readout from two days of investor meetings at Goldman Sachs’ technology conference in San Francisco. He said the market has stopped paying for contract announcements and now wants delivered capacity.
Why Mega-Deal Headlines Stopped Working
IREN started as a Bitcoin miner, but it now builds data centers and rents the computing power inside them to companies training AI models, a shift that has lifted several miner stocks this year.

Roberts said in an X post that investors have grown numb to deals worth $20 billion to $40 billion. For customers, such contracts are a cheap option on capacity. For young providers, they are a way to raise money. Neither guarantees anything gets built.
The question he called the fairest of the week was whether IREN can run a cloud business at scale, not simply pour concrete.
The $1 Billion Question Behind the Drop
IREN booked $70.5 million of AI cloud revenue in the June quarter. It also claims roughly $1 billion of operating annualized run rate, meaning the revenue current contracts would produce over a full year.
A further $4 billion is contracted for 2026 capacity. None of that lands in reported revenue until sites switch on and customers formally accept them.
“The biggest debate on our stock: the gap between $71m of quarterly AI Cloud revenue and $1bn of ARR operating, $4bn contracted for year end. Is it real, and will we deliver? Some disappointment with last quarter traces to ramp assumptions that ran ahead of anything we guided. That’s on us to manage better. Specific sites, tighter windows,” Roberts noted.
Microsoft accepted the first block, a 50 megawatt site called Horizon 1, in August under a $9.7 billion five year agreement. Three more are due before year end.
Meanwhile, ten analysts still carry an average target of $75.67, roughly 72% above Thursday’s price.

BeInCrypto flagged $47 in July as the level IREN had to reclaim to confirm the AI trade. The stock ran to $45.37 on Thursday morning and faded, leaving that ceiling untouched two months later.
The post IREN Stock Falls as Investors Demand Proof Over AI Promises appeared first on BeInCrypto.

Ethereum (ETH) exchange supply has fallen to roughly 15.5 million coins, the lowest reading in years. Meanwhile, MVRV momentum turned positive in late August.
ETH trades near $2,464 after a 0.87% decline over 24 hours. The token holds above the 0.618 Fibonacci retracement at $2,438.85, a level that capped rallies from March through May.
Ethereum Exchange Supply Drops to a Multi-Year Low
Glassnode data shows total ETH held across all exchanges at roughly 15.5 million coins. That marks a decline of about 38% from the May 2023 peak near 25.2 million. Most of the drawdown arrived after June 2025, when balances still sat close to 21.5 million.
However, the trend alone has proved a weak timing tool. Exchange balances fell steadily from September 2025 through June 2026. Over that same window, ETH slid from about $4,850 to roughly $1,550.

Shrinking supply, therefore, looks like a condition rather than a signal. It removes sellable float without setting a direction.
MVRV Momentum Turns Positive for the First Time Since November 2025
That missing direction may now have arrived. Ethereum’s Market Value to Realized Value (MVRV) ratio sits near 1.05, above its 160-day moving average at roughly 0.88.
The crossover happened in the second half of August. It ended a negative momentum phase that ran for about nine months from November 2025.

The moving average has also stopped falling and has begun to curve higher. Historically, that shift separates durable regime changes from brief whipsaws. Still, the signals remain roughly three weeks old.
ETH Price Prediction and the $2,438 Line That Decides It
ETH now trades at $2,464.81, down 0.87% on the day, with a market capitalization near $300.8 billion. Price sits just above the 0.618 retracement at $2,438.85. That zone acted as resistance from mid-March to mid-May and now appears to support.
Volume has declined every week since the late-August surge. The Bollinger Band Width Percentile (BBWP) also sits near the floor of its range. Compression of that kind usually precedes expansion, although it does not indicate direction. The Relative Strength Index (RSI) reads about 60, cooling from roughly 80 in late August.
A sustained hold could open the 0.5 retracement at $2,919.89, roughly 18% higher. In contrast, a loss of $2,438.85 leaves little structure until $1,980. That gap makes the current outlook unusually binary.

The two on-chain readings supply the directional lean that compression cannot. Ethereum has spent more than a year losing exchange float without reward. The difference now is that valuation momentum has turned alongside it. A drop back below the 160-day average would remove that support.
The post Ethereum Exchange Supply Falls to 15.5M ETH as On-Chain Momentum Turns Bullish appeared first on BeInCrypto.

The Dumbest Guest In Financial Audit History
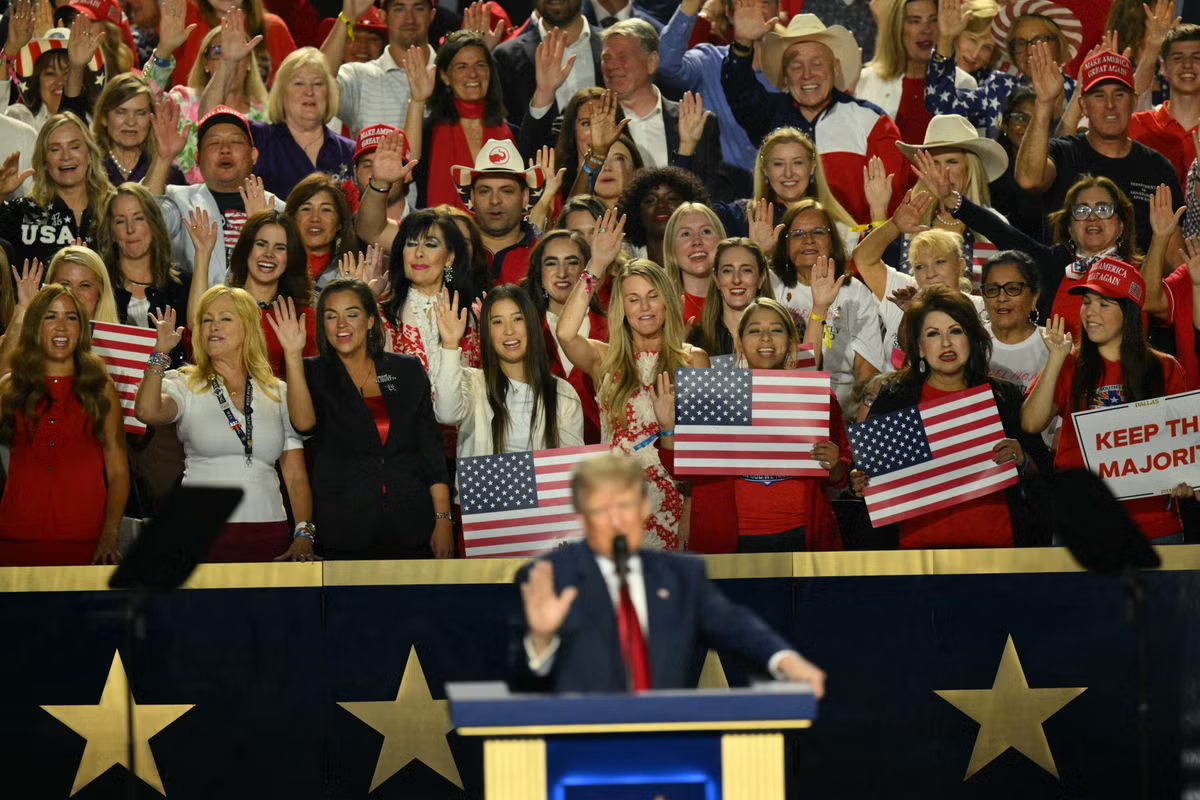
Trump makes convention audience swear pledge of allegiance to vote Republican – or go to hell

‘Monster ore bodies’: Greatland boss on Paterson potential


-
 Tech3 days ago
Memory prices are slowing because buyers ran out of money
-

 Business1 day ago
Micron Stock Climbs Above $1,031 as AI Memory Crunch and a $50 Billion Outlook Fuel the Rally
-
 Crypto World2 days ago
Bitcoin price risks $76K drop as $78K support weakens
-

 Business1 day ago
AMD Stock Climbs After Management Lifts 2027 Data Center Outlook Toward $70 Billion in AI Sales
-
 Crypto World2 days ago
Ethereum price stalls below $2,500 as ADX drops to 11
-

 Crypto World2 days ago
Robinhood Stock: How To Take Advantage With Reduced Risk
-

 NewsBeat2 days ago
What went right this week: an ‘historic’ fall in violent crime, plus more
-
 Crypto World1 day ago
Bitcoin price risks $70K if $78K neckline breaks
-
 Crypto World3 days ago
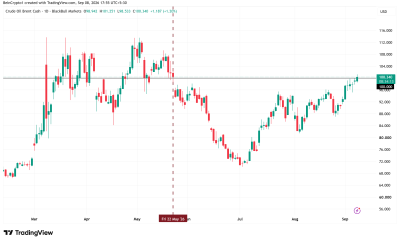
Brent Crude Oil Moves Above $100 for the First Time in 3 Months
-
 Crypto World2 days ago
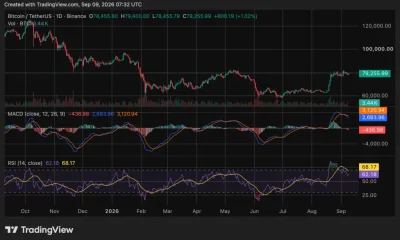
Bitcoin price holds near $79K as cycle drawdowns narrow
-

 Business2 days ago
Meta debuts long-awaited personal AI agent, Muse
-
 Sports3 days ago
Phones confiscated, players sent home: Pakistan’s England tour turmoil revives memories of Mohammad Amir, Salman Butt and Mohammad Asif’s 2010 Lord’s spot-fixing scandal | Cricket News
-

 NewsBeat3 days ago
England up in reading, maths and science rankings as Scotland and Wales dip
-
 Crypto World2 days ago
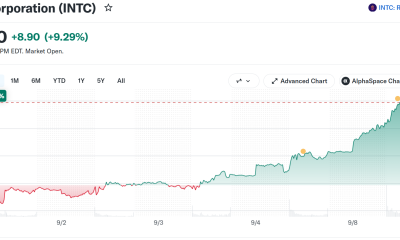
Intel Stock Jumps 9% on Chip Price Hike Report, US Stake Gains $36 Billion
-
 Crypto World1 day ago
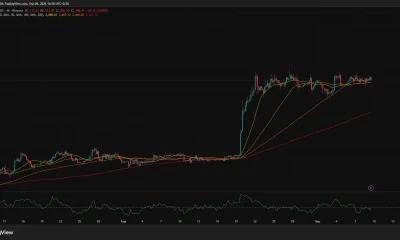
Ethereum price breakout hinges on a close above $2,535
-

 Crypto World3 days ago
Visa expands stablecoin card network to 160 programs
-

 Crypto World3 days ago
Pump Fun and Kraken delete Hunter Biden $LAPTOP promotion
-
 Tech3 days ago
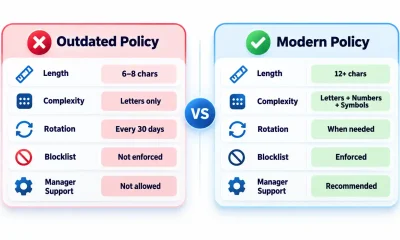
Strong Password Policy and Password Manager Guide
-

 Business3 days ago
Egyptian TV Presenter Sarah Khalifa, 11 Others Sentenced To Death In Major Drug Trafficking Case In Cairo
-
Business2 days ago
Xometry at Goldman Sachs Communacopia + Technology Conference 2026: growth, AI and Siemens
You must be logged in to post a comment Login