
Crypto World
Bitcoin ETFs Now Own 6.29% of Every Bitcoin. What Happens When They Hit 10%?


Quick Read
-
Four Bitcoin ETFs experienced losses in the week ending September 18, with the ARK 21Shares Bitcoin ETF leading at $141.9 million. This demonstrates that funds can release coins as easily as they accumulate them.
-
The funds have accumulated $55.161 billion in net inflows over 32 months, averaging roughly $1.71 billion per month. At this rate, achieving an additional $60.5 billion will take about three years, targeting around mid-2029.
-
Bitcoin and Ethereum ETFs together hold $68.4 billion in committed capital across two product lines that did not exist three years ago.
-
Just released. Our analysts combed the entire stock market and named the ten best stocks to buy right now, and Franklin Templeton Digital Holdings Trust didn’t make the cut. Enter your email to see the names that beat EZBC. The report is free. Enter your email and see if any of your stocks made the cut.
As of September 18, 2026, spot Bitcoin ETFs in the US managed $102.532 billion in assets, equating to 6.29% of the total market capitalization of Bitcoin (CRYPTO:BTC).
To reach 10%, these ETFs would need to increase their holdings by $60.5 billion, bringing the total to $163.0 billion. So how long will that take, and what would it mean for Bitcoin?

What 6.29% of Bitcoin Actually Looks Like

With $102.532 billion representing 6.29% of Bitcoin, Bitcoin’s implied market capitalization stands at about $1.630 trillion. This means roughly one Bitcoin in every sixteen is currently held within a US spot ETF. These coins are stored in cold storage with custodians, meaning they cannot be spent, staked, or otherwise used, except as backing for shares traded on exchanges.
Since their launch, Bitcoin ETFs have attracted $55.161 billion in net inflows, while Ethereum ETFs have garnered an additional $13.250 billion, totaling $68.4 billion across two new product lines.
Reaching 10% Takes $60.5 Billion and Three More Years

Free Report, Just Released
Why Didn’t EZBC Make The Top 10 List?
24/7 Wall St has helped investors make money for over two decades, and our top analysts just finished ranking the definitive Top 10 Stocks To Buy Now. Not the ten biggest companies. Not the ten everyone is arguing about. The ten best stocks to buy right now.
And EZBC didn’t make the cut!
The report is free, and you can see why we think each stock is a top investment today.
Enter Your Email and See the Ten →
If Bitcoin’s market capitalization remains around $1.630 trillion, the ETFs will need an additional $60.5 billion in assets to reach $163.0 billion, or 1.59 times their current holdings. If Bitcoin’s price rises, the target will rise proportionally, meaning the funds may need to acquire even more.



With a market cap. of $25.4 billion, Houston, Texas-based CenterPoint Energy, Inc. (CNP) is an energy delivery company providing electric and natural gas services across Indiana, Minnesota, Ohio, and Texas. The company serves more than 7 million metered customers through its electric transmission and distribution, power generation, and natural gas distribution operations.
Companies valued between $10 billion and $200 billion are generally classified as “large-cap stocks,” and CenterPoint Energy comfortably fits this category. As of June 30, 2026, CenterPoint Energy owned approximately $48.3 billion in assets and employed around 8,800 people, with a history spanning more than 150 years.
More News from Barchart
CNP stock has slipped 15.3% from its 52-week high of $45.26, reached on Jul. 28. Over the past three months, CNP shares have dipped 10.5%, underperforming the Nasdaq Composite ( $NASX), which has declined marginally over the same period.

CNP stock is down marginally on a YTD basis, lagging behind NASX’s 13.6% gain. Moreover, shares of the company have risen marginally over the past 52 weeks, compared to NASX’s 17.5% return over the same time frame.
The stock has been trading below its 50-day and 200-day moving averages since August.

CenterPoint Energy has underperformed due to its substantial capital requirements and reliance on external financing, which may increase dilution risk. The company also faces pressure from its relatively low dividend yield, elevated valuation, and the need to convert expected data-center and large-load electricity demand into contracted, rate-base-producing assets.
In comparison, rival Duke Energy Corporation (DUK) has declined 2.6% over the past 52 weeks, lagging behind CNP stock over the same period.
Despite the stock’s underperformance relative to the NASX, analysts remain moderately optimistic on CNP. The stock has a consensus rating of “Moderate Buy” from 19 analysts in coverage, and the mean price target of $45.29 implies 17.5% upside from its current price.
On the date of publication, Sohini Mondal did not have (either directly or indirectly) positions in any of the securities mentioned in this article. All information and data in this article is solely for informational purposes. This article was originally published on Barchart.com
Crypto World
SailPoint’s (SAIL) Falcon Next-Gen SIEM Arrangement Fits Its Broader Identity Security Push

SailPoint Inc. (NASDAQ:SAIL), a leading player within the enterprise identity security space, recently expanded its strategic alliance with CrowdStrike. As part of the revised arrangement, the company’s SailPoint SecOps Identity Intelligence will be integrated with CrowdStrike Falcon Next-Gen SIEM. This will help in expediting threat detection procedures, and will also incorporate access data and identity governance into the overall investigation process. The expanded partnership will facilitate security teams in lining up the identity insights with Falcon’s existing security telemetry.

Copyright: franckito / 123RF Stock Photo
Strategic Alignment
The announcement aligns strongly with SailPoint’s broader strategic narrative revealed in its Q2 FY27 print. It builds upon several recent initiatives undertaken by the management, such as introduction of the SailPoint Identity Security solution. This is aimed toward integrating SailPoint Agentic Fabric with SailPoint Human Fabric for real-time discovery and security of complex digital ecosystems. The company also launched its Cursor Enterprise connector, which helps organizations to leverage a highly-integrated control plane to manage human developers and autonomous AI agents.
The recently released financials also back this narrative as the company delivered a 25% year-over-year growth in its annual recurring revenue, which stood at $1.231 billion. SailPoint generated $45 million in operating cash flow during the second quarter, along with $37 million in free cash flow.
By weaving SailPoint’s identity intelligence into Falcon Next-Gen SIEM, customers gain extra context inside workflows they already rely on, making it easier to probe identity-related risks. The integration augments SailPoint’s position at a time when identity threats are on a rise. This leads to an opportunity for SailPoint to cement itself as a leading provider of advanced security solutions.
Adoption Will Be A Real Test
A certain degree of caution is still warranted despite the promising prospects related to this expanded partnership. There is a view that such vendor partnerships tend to overstate short-term impact, and the actual outcomes are more dependent on adoption trends and the follow-through.
For the announced integration to succeed, the targeted customers will need to utilize both platforms at scale. However, several organizations operate mixed security stacks where rival SIEM or identity tools can limit the underlying potential of new partnerships.

Join Our Telegram channel to stay up to date on breaking news coverage
The US Treasury has sanctioned BitBank, a Tehran-based bitcoin exchange it says Iran used to move hundreds of millions of dollars in cryptocurrency to the Islamic Revolutionary Guard Corps and to pass on tanker tolls charged at the Strait of Hormuz.
The Office of Foreign Assets Control, the Treasury arm that administers US sanctions, designated BitBank and Pishtaz Simorgh Electronic Trade Company, the software firm that built the exchange, in an action under Operation Economic Outcast confirmed in the announcement. OFAC says the exchange was set up in 2024. The designation freezes its property in US jurisdiction and bars Americans from dealing with it.
The allegations reach further. Iran has spent this year charging tankers between $1 million and $2 million to cross the Strait of Hormuz, and the Treasury said that since June, part of that money has moved through the exchange. The Hormuz Safe Marine Services Authority, the outfit Tehran uses to sell ships “safe passage” insurance, was itself sanctioned on July 29 and, per OFAC, began using BitBank in June to pass what it collected on to regime entities.
Every designation also carries a secondary sanctions tag. That means a foreign firm still processing BitBank’s flows is exposed to US penalties, a direct compliance risk for exchanges and banks outside the United States.
Treasury Secretary Scott Bessent framed the action as a warning to anyone financing the Iranian government with digital assets. “Today’s designations of Iranian digital asset infrastructure make perfectly clear that efforts to finance the Iranian regime using cryptocurrencies are not beyond OFAC’s reach,” he said in the release.
One break from precedent stands out: the action listed no wallet addresses. OFAC’s January designation of the Zedcex exchange, by contrast, published seven tron wallets that compliance teams could screen against. Without addresses, on-chain screening software has nothing to load for BitBank, and no independent check of the alleged flows is possible from the announcement alone.
Iran has not commented on the designations, and no vessel operator has confirmed paying through the exchange.
Join Our Telegram channel to stay up to date on breaking news coverage

Shareholders of International Business Machines (NYSE:IBM) have had a difficult 2026. The stock is down about 22% year to date as of this writing, trading near $230 — roughly 30% below the record close of $329.23 it set on June 2.
Most of that damage arrived in a single session. Shares fell about 25% on July 14, when IBM reported preliminary second-quarter results that fell short of the company’s own expectations. The lowered full-year outlook came on July 22, with the final report.
Missed Nvidia in 2009? This Rare Signal Is Flashing Again. In 2009, a “Double Down” signal flashed for a little-known chipmaker called Nvidia. For the first time in years, that same “Total Conviction” signal is flashing for a company 1/100th the size of Nvidia. Continue »
A sell-off like this invites a longer view, though. Where could IBM stock be five years from now?

Image source: The Motley Fool.
Growth slowed, and guidance followed
What made July especially painful was how strong the year had looked. IBM increased revenue 8% in 2025, to $67.5 billion. Free cash flow of $14.7 billion was up $2 billion from the previous year.
The momentum carried into 2026. First-quarter revenue rose 9% year over year, and software revenue jumped 11%.
Then the second quarter broke the pattern. Revenue of $17.2 billion was up just 1% year over year. Software revenue growth slowed to 5%, under half the first quarter’s pace. Consulting revenue was flat. And infrastructure revenue fell 7%, with IBM Z, the mainframe business, down 42% as the z17 launch cycle wound down.
Management now expects revenue to increase 4% to 5% this year in constant currency, down from the more than 5% it still expected in April.
In a July 14 letter to investors, CEO Arvind Krishna pointed to clients moving spending toward servers, storage, and memory ahead of expected price increases, and to large deals that did not close on time.
“These conditions require our teams to execute perfectly, and this quarter we faltered,” he said.
However you assess those explanations, the slowdown that concerns me is software’s. It’s the segment that underpins IBM’s growth case. Mainframe cycles come and go. But a software slowdown is more difficult to dismiss.
Cash flow and the dividend
For all the top-line problems, IBM’s cash generation has held up. Management still expects free cash flow to grow by about $1 billion in 2026, which would put the full-year total near $15.7 billion.
That cash supports one of the longest dividend growth records in technology. April’s increase, to $1.69 per share quarterly, was IBM’s 31st in a row, and the company has paid quarterly dividends since 1916. At the current share price, the stock yields just under 3%.
Crypto World
A 63-Year-Old Inherited $118,000 of Savings Bonds From Her Father and Owes Tax on 30 Years of Interest He Never Reported

Quick Read
-
Inherited savings bonds are classified as income in respect of a decedent, meaning all 30 years of deferred interest, which can amount to somewhere between $70,000 and $90,000, is taxable as ordinary income to the heir.
-
Executors have a one-time election to report all accrued bond interest on the decedent’s final return, potentially saving tens of thousands if the deceased was in a lower tax bracket.
-
Cashing all bonds in one year can push heirs into the 32% bracket, trigger Medicare surtaxes, and raise IRMAA premiums two years later at age 65.
-
Two retirees, same $1 million, same 4% rule, buy one finished with $1.4 million, the other hit $0 in 12 years. Our free reader guide explains the flaw that separated them, and the income-first method built to avoid it.
Inheriting a shoebox of paper savings bonds sounds like a windfall until the IRS shows up. A 63-year-old daughter receives $118,000 of bonds her father bought over three decades, discovers he never paid tax on any of the interest, and learns the entire accrued balance is now her problem. This scenario plays out in thousands of estates every year because Series E, EE, and I bonds allow interest to compound tax-deferred.

The Bogleheads and Reddit r/personalfinance forums are full of near-identical stories: a parent dies, an executor finds bonds in a safe deposit box, and the family realizes the interest has been quietly accruing since the Clinton administration. The tax bill is almost always larger than the heir expects.
Why This Inheritance Triggers a Six-Figure Tax Bill
Savings bond interest is classified as income in respect of a decedent (IRD). Unlike a brokerage account or a house, IRD assets keep the decedent’s original cost basis, so every dollar of deferred interest inside those bonds remains fully taxable as ordinary income to whoever ends up cashing them.
The 4% Rule is Broken, Built On A World That No Longer Exists
Every retiree knows about the 4% rule, but it frames retirement as a slow liquidation and still causes retirees with seven-figure accounts to agonize over a dinner out.
There’s a different way to run the math that makes more sense today. Build an income floor — dividends, interest, and Social Security that cover your essential bills every month — and you never have to sell shares into a down market just to pay them.
Our free reader guide, The 4% Rule Is Broken, walks through it in about 15 minutes. Access the report here.
On a $118,000 face-and-accrual position built over 30 years, the taxable interest portion could easily run $70,000 to $90,000 depending on issue dates and rates. Series E and EE bonds hit final maturity at 30 years and stop earning. Once a bond reaches final maturity, the IRS treats the interest as taxable in that year whether the bond is redeemed or not. Many heirs discover the tax is already technically due on bonds that matured years before the parent died.

The Sept. 15, 2026, estimated tax deadline has come and gone, and retirees who pulled a large sum from a traditional Individual Retirement Account (IRA) this summer without directing enough to federal withholding now face a penalty that accumulates week by week.
The standard 10% default withholding rate on IRA distributions rarely covers the full tax bill on a five-figure withdrawal, and the estimated payment that should have closed the gap never arrived, IRS Publication 505 confirms.
The IRS adjusts the underpayment penalty rate each quarter, pegging it to the federal short-term rate plus three percentage points. The rate has stood at 7% annualized for the first, third, and fourth quarters of 2026 and dipped to 6% for the second quarter.
Section 6654(g)(1) of the Internal Revenue Code draws a hard line between how the IRS credits estimated payments and how it credits withholding from retirement distributions, creating a narrow window for retirees to act before year-end.
How federal withholding reaches back to cover earlier quarters
Estimated tax payments are credited on the exact date the IRS receives them, and each payment only satisfies the installment period in which it arrives, IRS Publication 505 confirms.
This rule means no future payment can erase penalties that have already started accruing from earlier quarters.
Federal income tax withheld from pensions, Social Security, and retirement distributions follows a completely different provision.
The IRS treats that withholding as paid evenly across all four installment periods regardless of when the money was collected, IRS Publication 505 confirms.
More Taxes:
A retiree who contacts the IRA custodian, requests a new distribution before Dec. 31, and directs a large portion to federal withholding can retroactively apply that payment against the underpaid first-, second-, and third-quarter installments in one transaction, 24/7 Wall St reported.
The distribution itself is taxable, so the withholding amount must cover both the original shortfall and the new tax the withdrawal generates.
Only traditional IRA, 401(k), and pension balances qualify, because Roth IRA distributions produce no taxable income and generate no withholding, IRS Publication 505 confirms.
Ed Slott: why withholding outperforms estimated payments late in the year
IRS Publication 505 confirms that the penalty disappears when withholding and timely estimated payments reach at least 90% of the current year’s tax liability or 100% of the prior year’s.


The sticker price on a phone stopped being the price anyone actually pays a long time ago.
What you pay is a blend of a trade-in credit, a monthly installment, a plan tier you may not have chosen on your own, and a commitment that outlasts most car leases.
That structure is why two people can buy the identical phone in the same week and pay very different amounts for it. One trades in a three-year-old handset on a premium unlimited plan and pays almost nothing each month. The other buys outright and pays full retail on the spot.
Apple (AAPL) raised the price of its Pro iPhones by $100 this year. The Pro starts at $1,199 and the Pro Max at $1,299, and for a lot of households that jump is the difference between upgrading now and waiting another year.
Then the three major U.S. carriers made their counteroffer, and Bank of America (BAC) spent this week working out what it is really worth to you.

How carrier trade-in credits actually reach your bill
Carrier promotions work as credits rather than discounts, and that distinction decides how much cash leaves your account on day one.
When a carrier advertises $1,200 off, the full retail price of the phone goes onto a 36-month installment plan, and the credit comes back to your bill in monthly slices across those same 36 months.
Related: Bank of America flags surprising iPhone 18 pre-order trend
Leave early and the remaining credits stop. That structure is the point, because it keeps you on the account and on a plan tier that bills more each month than an entry-level one.
Apple sells the same phones outright with no strings. The trade-off is that you pay for all of it at once.
What the $1,200 iPhone 18 trade-in credit actually covers
Maximum trade-in credits for the iPhone 18 Pro Max have climbed to $1,200 at Verizon (VZ), AT&T (T) and T-Mobile (TMUS), Bank of America analyst Wamsi Mohan wrote in a Sept. 17 research note.
More Apple News:
That is $100 more than the top credit on the iPhone 17 Pro Max last year and $200 more than the iPhone 16 Pro Max the year before. The richer promotions largely cancel out Apple’s price increase, according to Mohan.
Here is the part that matters at the register. Even at the maximum credit, you are not walking out for nothing.
Carriers charge an activation or upgrade fee of $35 to $40, and sales tax is calculated on the full retail price of the phone rather than the discounted amount. On BofA’s figures, using New York City sales tax, that lands at $142 to $147 for the Pro and $250 to $255 for the Pro Max.

Nobody knows when the next stock market crash will happen. It could be next week. It could be years from now. But I know what I’d want to buy if it happened.
The Vanguard Dividend Appreciation ETF (NYSEMKT: VIG) is a portfolio of high-quality companies that generate big cash flow and demonstrate a history of paying and growing dividends over time.
Missed AI’s “Act 1”? Act 2 Could Be 15x Bigger. Most investors think they missed the AI boat because they didn’t buy Nvidia in 2005. But according to our analysts, we’re only at the end of “Act 1″—the R&D phase. “Act 2” is the global rollout. Continue »
But that’s not the biggest selling point in a down market. It provides the combination of growth and income that helps cushion against downside risk when weaker companies are getting hit hard, yet maintains a more growth-oriented profile that should capitalize on an eventual recovery.
In a sense, it potentially allows you to take advantage of both the crash and the rebound.

In this case, VIG isn’t really a dividend story
The Vanguard Dividend Appreciation ETF tracks an index that requires companies to have grown their annual dividend for at least 10 consecutive years. It eliminates the highest-yielding stocks right off the bat, helping to avoid companies that could be signaling financial trouble.
That last piece effectively serves as a quality screen for the fund, which is incredibly important during crashes. In volatile markets, investors often turn to safer, more durable stocks that can withstand tough environments. The dividend growth requirement and high yield elimination essentially help create a portfolio of those very stocks.
The fund’s portfolio is a bit unique for a dividend ETF. Technology accounts for around 25% of the portfolio, which is one of the highest allocations in this category. While that could increase volatility, I’d point out that half of that allocation goes to Broadcom, Microsoft, and Apple. Those are three heavyweight tech companies with huge revenue streams that should be able to hold up. These aren’t speculative growth names.
The additional sector weightings to financials (22%) and healthcare (18%) provide an attractive combination for an eventual recovery, quality companies with meaningful exposure to economically sensitive areas of the market.
The Vanguard Dividend Appreciation ETF will almost certainly fall in the next market crash. Investing in this fund isn’t meant to be a way to avoid it altogether. But it’s got durability, balance sheet strength, cash flows, and an improving income stream. These are the kinds of companies that are built for down markets.
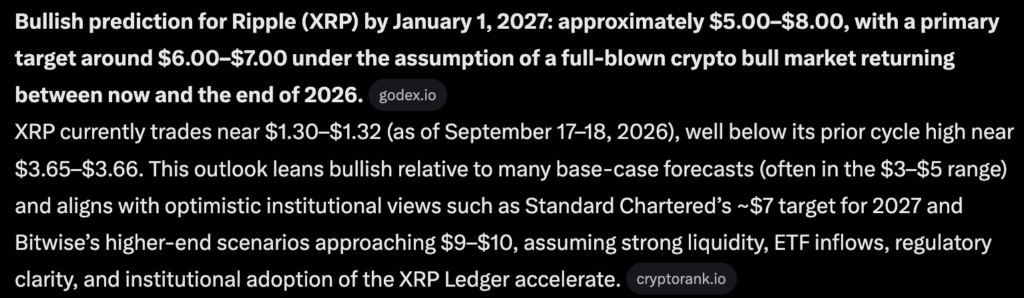
When prompted, Google Gemini AI predicts that under a full bull market structure between now and 2027, XRP could surge as high as $7, a 5x move from current prices, which will be sure to excite the Ripple army.
XRP currently trades near $1.30–$1.32, as of September 18, well below its prior cycle high near $3.65–$3.66. This outlook leans bullish relative to many base-case forecasts ($3–$5 range) and aligns with optimistic institutional views such as Standard Chartered’s ~$7 target for 2027 and Bitwise’s higher-end scenarios approaching $9–$10.

However, all of these forecasts assume strong liquidity, ETF inflows, regulatory clarity, and accelerated institutional adoption of the XRP Ledger. The core premise is a late-2026 return to sustained risk-on conditions, driven by improving macro liquidity, expanded XRP ETF inflows, growing use of XRPL for cross-border payments and tokenization, and broader altcoin rotation once Bitcoin leads higher.
In prior cycles, XRP has delivered sharp, high-beta moves once momentum returns; a move from the current ~$1.30 area through the prior highs near $3.65 and into the mid-to-high single digits would be consistent with a full bull-market environment and XRP’s positioning as a major large-cap asset with expanding institutional infrastructure.
Google Gemini AI Predicts the XRP Price: Does Technical Analysis Support the $7 Target?
Good Morning $XRP Family!
After touchdown on the 20 WEMA, price has bounced back into the 0.5 midline of the parallel channel and prior $1.33/6 support floor. This area has a strong flipped S/R potential if all fails to reclaim it.
Break it? Descending resistance awaits. https://t.co/MnpuYMQBEs pic.twitter.com/AIds6sUsYq—
ChartNerd
(@ChartNerdTA) September 18, 2026

On the higher timeframes, XRP has been consolidating after a significant pullback from recent highs, currently holding above key demand zones near $1.25–$1.30 while facing stacked short-term resistance around $1.33–$1.40 and higher supply near $1.50–$1.65.
A sustained break and weekly close above $1.40–$1.50 (with volume confirmation) would strengthen the intermediate bullish structure and open the path toward the prior cycle high near $3.65.
In a full bull-market regime, reclaiming that prior high often acts as a powerful psychological and technical catalyst for further extension; Fibonacci projections and measured moves from the multi-year base and recent recovery low project into the $5–$8 zone on continued momentum.
Price is holding above longer-term moving averages (such as the 50- and 100-day), with RSI in neutral-to-oversold territory on shorter timeframes, favoring mean-reversion upside once resistance is cleared.
Key supports to defend on any retests include the $1.20–$1.28 zone and the broader $1.00–$1.10 area; a decisive break below those would weaken the near-term recovery thesis.
Overall, the chart setup favors a multi-leg advance with strong upside potential if risk appetite returns, consistent with XRP’s historical pattern of sharp rallies once key resistances are cleared in bull-market conditions.
Earn $50 and Enter $300K Prize Draw on EdgeX
LiquidChain Targets Early Mover Upside as XRP Tests Key Levels
For traders watching the ongoing XRP price action, rotating capital toward earlier-stage projects with room to grow makes sense, especially when the alternative is waiting for a multi-billion-dollar market cap coin to reclaim ground it’s already lost twice.
Enter LiquidChain ($LIQUID), a Layer 3 infrastructure project fusing Bitcoin, Ethereum, and Solana liquidity into a single execution environment. The presale is priced at $0.014956 with $967,410.09 raised so far.
Its core pitch, Deploy-Once Architecture, lets developers build a single application and reach all three ecosystems without rewriting code for each chain, backed by a Unified Liquidity Layer and Single-Step Execution for cross-chain trades.
Those curious can dig into the background on its cross-chain approach, which is also covered in this earlier breakdown.
Gain Special Access to Layer 3 Trading Here
Discover: The Best Token Presales
The post Google Gemini AI Predicts an Explosive End to 2026 for XRP appeared first on Cryptonews.

Every energy shock teaches the same lesson, and nobody enjoys learning it. When fuel stays expensive long enough, people stop buying it. Not because a rule told them to, but because the math at the pump stopped working.
That math broke in late February, when strikes on Iran began and tanker traffic through the Strait of Hormuz seized up. Brent crude settled at $104.82 a barrel on Sept. 17, according to CNBC.
The national average for a gallon of regular reached $4.4386 that same day, and diesel in California averaged $8.3496, according to AAA.
Seven months of those prices do predictable things. Airlines thinned schedules, Asian petrochemical plants idled, and car buyers from Jakarta to Berlin went looking for anything with a plug.
The International Energy Agency (IEA) now expects global oil consumption to shrink by 2.5 million barrels per day in 2026, a 2.4% drop from 2025 levels.
Which brings us to a figure published Sept. 16 that the market barely registered. Global emissions from fossil fuels are set to fall by roughly 0.5% this year, according to Carbon Brief.
That would be the first annual decline since the pandemic year of 2020. No treaty produced it.
How the Hormuz shutdown rewired global fuel demand
About a fifth of the world’s oil trade moves through a 21-mile-wide channel between Iran and Oman, along with a similar share of seaborne liquefied natural gas (LNG). Close it, and everything downstream reprices within weeks.
The forecasting record tells this story better than any headline does. In January, the IEA expected global oil demand to grow by 930,000 barrels per day in 2026. By September, it was modeling a 2.5 million barrel per day contraction, according to the IEA.
More Oil & Gas:
I ran those two numbers against each other, and the swing comes to roughly 3.4 million barrels a day in nine months. That is not a forecast being trimmed at the edges. That is a demand curve snapping.
Demand destruction is the polite term for it. Jet fuel got too expensive to fly certain routes. Naphtha got too expensive to crack. Gasoline got too expensive to commute on five days a week.
The scale is without precedent. The agency has called the loss of Gulf barrels the largest supply disruption in the history of the global oil market, a point TheStreet covered when Exxon’s CEO warned the shock was not fully priced.


Is CenterPoint Energy Underperforming the Nasdaq?

Jenni ‘JWoww’ Farley Reveals Truth Behind Rapid Weight Loss

Will HMRS or IRS question you about your gold? #coin #money #currency




-

 Fashion1 day ago
Weekend Open Thread: Talbots – Corporette.com
-
 Tech6 days ago
The Latest Weird Thing to Play Doom Is the Mapped-Out Brain of a Fruit Fly
-
 Crypto World5 days ago
Kraken Lets xStocks Holders Earn Yield Through DeFi
-
 NewsBeat1 day ago
Trump says US has reached an agreement to take permanent control of Greenland’s security
-

 Crypto World5 days ago
Revolut Attackers Warn of Ongoing Daily Customer Data Leaks
-

 Crypto World4 days ago
What Is the Status of the U.S.-Iran Peace Talks? Here's What Both Sides Are Saying
-

 Crypto World3 days ago
US Charges Robinhood Engineers Over Crypto Listing Trades
-

 Crypto World5 days ago
Elon Musk Drops a Bombshell: Grok 5 Could Be the AGI Breakthrough
-

 Crypto World4 days ago
Robinhood engineers charged over $50K crypto scheme
-

 Business7 days ago
Rivals Sam Altman and Elon Musk Rally Behind Dario Amodei’s Call for a Slowdown in AI Development
-
 Crypto World6 days ago
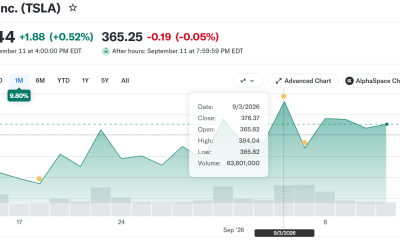
New Tesla Roadster Uses SpaceX Tech. Will It Impact the Stock Price?
-
 Crypto World1 day ago
Bitcoin price breaks channel as RSI climbs to 63
-
 NewsBeat5 days ago
‘Sick conspiracy’: Trump says only guardrails AI needs is ‘a strong and smart (High IQ!) president’ in all-caps rant
-
 Crypto World5 days ago
NVIDIA Analysis: Attempted Rising Wedge Breakout Amid Pressure on the AI Sector
-

 Crypto World23 hours ago
Circle launches Arc Studio AI agent for building onchain apps
-
Business5 days ago
SK Hynix ADRs Fall More Than 6% as Memory Rally Breaks on Fears of Slower AI Spending
-

 Crypto World5 days ago
DOJ Seeks to Seize $61M in Iran Oil Funds From Binance Accounts It Vouched For
-
Crypto World5 days ago
Can Circle’s Arc Repeat Robinhood Chain’s Meme Coin Boom?
-
 NewsBeat7 days ago
Last Night of the Proms pays moving tribute to Dolly Parton as Sheridan Smith wears a gold sequin jumpsuit in memory of the Queen of Country
-

 Crypto World6 days ago
3 Token Unlocks to Watch in the Third Week of September 2026
You must be logged in to post a comment Login