

Crypto World
Bitcoin Falls Below $70K Again: 3 Key Reasons

The flagship cryptocurrency has retreated from its recent momentum, slipping back into the month’s trading band beneath the $70,000 threshold after a roughly 5% decline over the past two days. Investors and traders are watching for how on-chain activity and derivatives signals align with price action, as data point to renewed selling pressure near the key level. Market participants also noted thinning spot volumes and shifting futures positioning, which together suggest a cautious stance ahead of the next price move. A four-hour view from a widely used charting platform captured the oscillation, underscoring a tussle between buyers aiming to reassert control and sellers eager to cap downside.
Key takeaways
- Short-term holders realized profits aggressively as the price rallied above $74,000, with more than 27,000 BTC moving to exchanges from short-term holder wallets in the last 24 hours.
- The profit-taking occurred predominantly from levels accumulated in the week prior, with the realized price sitting near $68,000 as selling activity intensified after the test of $70,000.
- Futures data showed a broad pattern of selling pressure, with the cumulative volume delta turning negative in both spot and perpetual markets. Specifically, spot delta reached a sizable negative read of about –$202.49 million, while perpetuals hovered around –$185.60 million.
- Coinbase-based liquidity signals showed demand cooling near critical inflection points; the Coinbase Premium Index briefly spiked above 0.08 during the rally to the $73,000–$74,000 range but faded as price retraced.
- Analysts pointed to a nearby fair value gap around $66,500 as a potential magnet for liquidity, suggesting a zone where price could pause and liquidity could rebalance if downside pressure persists.
- Market sentiment in late sessions reflected broader risk-off pressure across equities, with observers noting that Friday’s sessions often weighed on risk assets including the Nasdaq.
Tickers mentioned: $BTC
Sentiment: Neutral
Price impact: Negative. A renewed wave of selling near $70k and the negative CVD readings point to softer near-term momentum.
Trading idea (Not Financial Advice): Hold. The price remains in a narrow range around key support and resistance, with near-term liquidity considerations likely to dictate direction before a clearer breakout or breakdown.
Market context: The latest price action comes as on-chain and derivatives metrics underscore a cautious mood among market participants. The combination of profit-taking from short-term holders, negative delta signals, and weakening US spot demand paints a picture of a market still determining a sustainable path above or below the $70,000 threshold, even as macro factors and risk sentiment continue to influence flows.
Why it matters
The current dynamics highlight how on-chain behavior and derivatives data can diverge from simple price movement. When more than 27,000 BTC in profit moves to exchanges from short-term holders within 24 hours, it signals a cohort that is willing to crystallize gains rather than let profits ride into further upside. That pattern, coupled with a realized price near $68,000, suggests the market could experience episodic selling pressure as traders rebalance risk in a choppy environment.
From a technical standpoint, negative delta readings across spot and perpetual futures imply that sellers have the upper hand in immediate order-flow dynamics. The negative CVDs indicate that the market’s buy-side interest is being overwhelmed by sell-side activity, which tends to coincide with price softness and a willingness to test support zones rather than push decisively toward new highs. This cadence of selling pressures can also be reinforced by liquidity dynamics around key liquidity pockets, such as the fair value gap noted near $66,500, where liquidity-minded traders expect price to revisit to re-establish balanced order books.
On the demand side, the Coinbase Premium Index’s retreat from the intraday spike above 0.08—while fleeting—highlights how demand can evaporate quickly as price moves past critical levels. The erosion of the premium suggests that the surge of Coinbase-based buying that once accompanied the move toward $74,000 did not sustain, contributing to a softer near-term outlook. Analysts have connected these micro-movements to broader risk-off impulses that have been altering how US participants approach risk assets, including equities tied to the tech-heavy Nasdaq.
Looking ahead, observers are watching whether BTC can defend the $67,000–$68,000 zone as a near-term anchor or whether selling pressure intensifies to drive the price toward the lower bound of the current consolidation range. Titan of Crypto has highlighted a nearby fair value gap around $66,500 that could act as a magnet for liquidity should selling accelerate. Such a scenario would likely require a phase of cautious accumulation by larger holders before a renewed attempt at the $70,000 threshold. For now, the mood remains mixed: buyers are present, but the momentum needed to sustain a breakout above $70,000 remains uncertain. A related discussion online raises questions about whether the move to $74,000 was a bull trap, with traders diverging on the implications for a longer-term recovery.
Visual references to the market’s price action can be found in TradingView’s BTCUSDT chart, which has been used to illustrate the four-hour dynamics during this period. The broader context continues to unfold as market participants parse on-chain signals, futures data, and spot-market activity for clues about the next major step in BTC’s path.
Related: Bitcoin price drops to near $68K as US jobs weakness fails to rescue bulls
Note: This narrative summarizes market developments and does not constitute investment advice. Market conditions can change quickly, and readers should conduct their own research before making trading or investment decisions.
https://example.com/placeholder.js
What to watch next
- Monitor BTC around the $66,500–$68,000 zone for possible liquidity-driven rebalancing.
- Watch spot and futures delta for signs of a shift toward positive accumulation or further selling pressure.
- Track Coinbase Premium Index movements to gauge whether demand from US-based participants re-accumulates near the $70k–$74k region.
- Assess the influence of US macro data and risk-on/risk-off sentiment on a potential break above or below the current range.
Sources & verification
- CryptoQuant QuickTake on STH selling pressure and profit transfers (27,000 BTC moved to exchanges in 24 hours).
- IT Tech’s analysis of CVD movements in spot and perpetual futures (negative readings: spot around –$202.49 million, perpetual around –$185.60 million).
- Coinbase Premium Index data showing decay after a brief spike near $73,000–$74,000.
- Titan of Crypto’s analysis of a nearby fair value gap near $66,500 and liquidity considerations.
- Related coverage: “Was $74K a bull trap? Bitcoin traders diverge on 2022 crash repeating.”
- TradingView BTCUSDT four-hour reference chart for price action context.
- Cointelegraph coverage referencing Bitcoin price dynamics near $68K amid US jobs data.
Bitcoin price action and near-term outlook
Bitcoin (CRYPTO: BTC) moved to test the lower end of its immediate range after failing to sustain a push above the $70,000 mark, a level that has repeatedly acted as a psychological magnet for bulls. The day’s price action reflected a tug-of-war between demand from speculators looking to re-enter momentum trades and longer-term holders who remain more comfortable booking profits at elevated levels. The substantial transfer of profits from short-term holders to exchanges underscored a cautious stance among market participants who prefer crystallizing gains rather than chasing further upside in a market that has shown fragility in the face of macro and sector-wide risk signals.
The negative delta readings in both spot and perpetual futures markets emphasize the immediate pressure that price action is facing. With bid liquidity pulling back and on-chain activity signaling profit realization, even a modest dip can invite additional selling, particularly if market participants recalibrate risk exposure in response to incoming macro data or shifting regulatory narratives. Yet the presence of liquidity in place—evidenced by the level of bids near a crucial support zone—suggests that a flush to the downside may be met with renewed accumulation rather than a wholesale capitulation, should demand return to the scene.
As the market digests these signals, a potential rebound could emerge if buyers manage to defend the $67,000–$68,000 area and push back toward the $70,000–$72,000 zone. The interplay between short-term profit-taking behavior and longer-term conviction will likely shape the next wave of liquidity provision, setting the tone for the next phase of the market’s evolution. Traders and researchers will be watching not only price levels but also the behavior of major on-chain cohorts and the evolution of sentiment across futures and spot markets, waiting for a clear sign that the current pullback is a temporary pause or the beginning of a more meaningful correction.


Bitcoin outlook remains mixed as on-chain analyst Willy Woo warns of a potential bull trap ahead of a broader downtrend return. In a Saturday post on X, Woo cautioned that a short-lived breakout could lure investors into believing a sustainable rally is underway, potentially persisting into the end of April. His assessment centers on liquidity dynamics rather than price levels, suggesting that if fresh capital returns with patient, long-term investors, the view could shift. The door for a test of resistance remains open, but the broader context continues to tilt toward a bear market narrative, with price action and flow data painting a sobering picture for near-term bulls.
From a long-range liquidity perspective, Bitcoin (CRYPTO: BTC) is described as being “solidly in the middle of its bear market.” Woo noted that after swift downward moves, BTC often enters a sideways phase during which resistance is tested but not decisively breached. The comments come as Bitcoin trades around $67,012, a level cited by market trackers after it slid from October’s all-time highs near $126,000. The retreat marks a loss of roughly 46.82% from the pinnacle, underscoring the depth of the bear cycle. While a brisk rally could form a temporary countertrend, the broader trajectory remains bearish until liquidity conditions brighten and longer-horizon buyers re-emerge with conviction.
Despite the fresh pullback and the struggling price action, some investors have pointed to a return of flows in a more constructive light. Woo has stressed that inflows from longer-term holders could alter the outlook, but the current signal is still dominated by liquidity constraints rather than outright bullish catalysts. Other analyses echo a cautious stance: Santiment highlighted a pattern where whales have been selling while retail buyers accumulate near the $70,000 zone, a dynamic that historically signals that the correction could extend further before a durable bottom is formed. The firm’s assessment, noted in commentary on the broader market, aligns with a tendency for significant holder activity to precede any sustained upturn rather than a rapid, self-sustained rally in the near term.
Bitcoin is “solidly” in the middle of a bear market
Willy Woo’s liquidity-centric view sits alongside a broader cadre of voices that view Bitcoin as mired in a structural bear phase. He argued that the most decisive moves tend to unfold after liquidity cycles shift—not solely after price tests or chart patterns. “Typically, after fast downward flushes like we have had, BTC likes to go sideways and mount a rally where resistance is tested,” Woo said, articulating a mechanism by which a surface-level bounce can obscure the continuing risk of a deeper retracement. For investors watching the tape, the implication is that any up-leg must be judged within the context of liquidity healing and the willingness of patient capital to participate meaningfully.
Data points reinforce the bearish backdrop. Bitcoin has retraced from its October peak, and the market has witnessed a broad risk-off mood that has persisted through much of the current cycle. As of the time of publication, CoinMarketCap prices pegged BTC in the mid-$60,000s, reflecting the struggle to sustain a meaningful break above key resistance zones. The combination of a deeply entrenched downtrend and limited willingness among market participants to chase momentum complicates the odds of a durable recovery in the near term. The ongoing debate about whether this cycle marks the start of a new bull phase or a protracted bear market continues to polarize analysts, with some arguing for a secular low kind of consolidation before new highs can be revisited.
In a separate line of analysis, CryptoQuant underscored that “Bitcoin is still in a bear market despite the recent rally,” a reminder that price gains do not, by themselves, confirm a reversal of the longer-term trend. The nuance matters for traders who historically watch on-chain indicators for liquidity shifts and capitulation signals rather than purely price action. The fear-and-greed gauge recently registered a retreat into extreme fear after a brief uptick, echoing the sentiment that the market remains skittish and hesitant to commit capital at elevated levels. This confluence of factors — on-chain dynamics, whale/retail flow patterns, and volatility in sentiment measures — helps explain why a meaningful up-leg may still be contingent on a more favorable liquidity backdrop and a broader shift in risk appetite among investors.
As the debate rages over Bitcoin’s four-year cycle and whether a new all-time high is on the horizon, the current data paint a cautious picture. The bear-market narrative is not purely a price story; it’s a liquidity story, a pattern of holder behavior, and an evolving sentiment environment that must align before bulls regain the upper hand. The interplay between on-chain signals, macro backdrop, and investor psychology will likely dictate whether the next several weeks bring a durable shift or another retest of the bear-market lows.
For readers seeking points of reference, Bitcoin’s price references persist in the public data feeds and price trackers, with CoinMarketCap offering a widely cited snapshot of levels around $67,000 to $68,000 in the current window. The ongoing discourse among analysts, from Woo to Santiment and CryptoQuant, illustrates the spectrum of views on whether a relief rally can morph into a lasting reversal or will fade under the weight of liquidity constraints and risk-off sentiment. The market remains at a crossroads where the outcome hinges on the balance between sellers’ conviction and new real long-term capital entering the space, a dynamic that will be critical to watch in the weeks ahead. For context on how the broader ecosystem is reacting to these signals, the fear-and-greed gauge, as well as coverage of spot ETF activity and related liquidity shifts, offer additional layers of insight into potential catalysts or headwinds for BTC in the near term.
Willy Woo’s perspective also sits within a wider chain of research into Bitcoin’s price dynamics and cycle theory. In particular, researchers have noted that the four-year cycle debate continues to generate discussion about whether macro timing, halving cycles, and investor behavior will align in a way that produces a new set of all-time highs. While the consensus remains unsettled, the prevailing view across a subset of on-chain analysts is that the market may see a period of consolidation and liquidity-driven volatility before any sustained upside materializes. The critical takeaway for traders is that the absence of a robust influx of patient capital reduces the probability of a clean breakout, even if a short-term rally captures attention and drives a temporary surge in volume.
Related:Bitcoin relief rally hits wall as spot ETFs log $228M in outflows

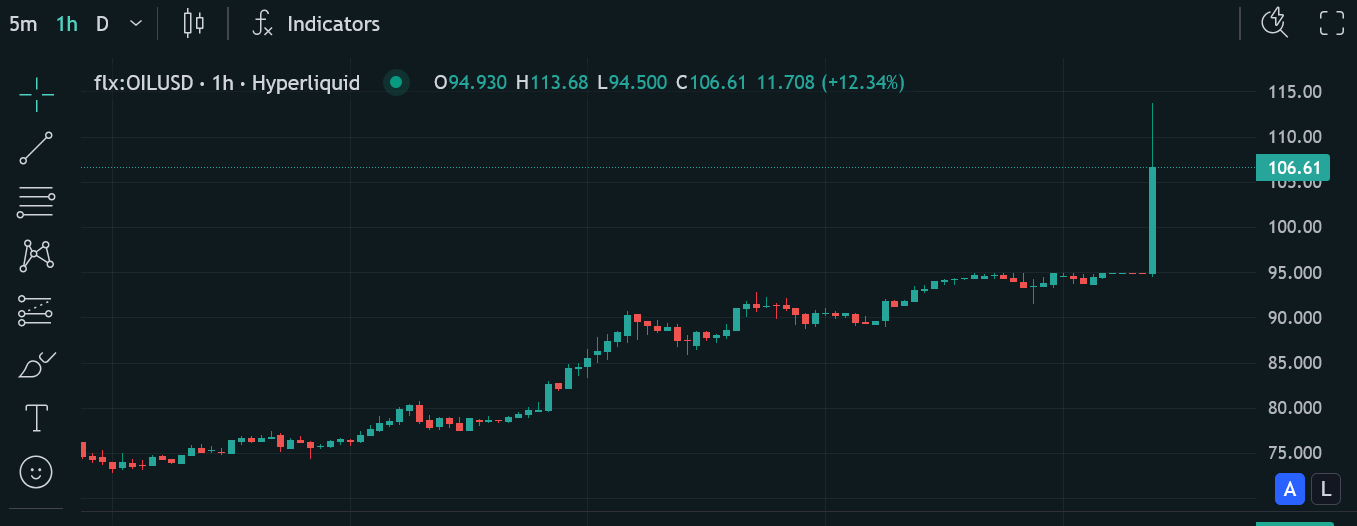
Bitcoin fell nearly 2% within a 15-minute window on Sunday as oil surged on escalating Middle East tensions, underscoring how energy-market shocks can ripple into the crypto space. Data from the decentralized derivatives platform Hyperliquid showed crude prices jumping from about $95 to $113.7 per barrel shortly after U.S. futures markets opened, driven by Iraq’s warning that roughly 3 million barrels per day of production could be disrupted amid Iranian threats against tankers in the Strait of Hormuz. The move marked the steepest one-day spike in oil in years, and it came as traders weighed the broader risk environment. In the immediate crypto reaction, Bitcoin briefly fell from $66,960 to $65,725 before rebounding toward $66,272 as funding and futures trading kicked in after the open.
Hyperliquid’s oil data also captured a later cooling, with prices easing back to around $105 per barrel, offering some relief to risk-assets that had roiled in the wake of the invasion-era proxy tensions. The narrative around energy and risk sentiment was already dynamic, as last week’s surge followed a broader fuel-price rally triggered by U.S.-Israel actions against Iran and the ensuing regional countermeasures. The same period saw Bitcoin rally off a dip, climbing from sub-$64,000 levels to roughly $73,770 mid-week after earlier volatility tied to geopolitical headlines, only to retreat again as the latest flare-ups unfolded. The price action illustrates a pattern where macro shocks can impose quick, non-linear moves on a market that remains highly sensitive to risk-off dynamics.
In a separate layer of context, former U.S. President Donald Trump commented that the run-up in oil prices would be temporary, arguing that any advance would come down quickly. “We figured oil prices would go up, which they will. They’ll also come down. They’ll come down very fast,” he told reporters, signaling to investors that energy-market pressures might ease, though the practical transmission to crypto markets remains nuanced. The broader environment—characterized by geopolitical risk, commodity volatility, and macro uncertainty—continues to shape crypto price formation in ways that can amplify short-term moves even as long-term narratives remain undecided.
Last week’s activity had already highlighted Bitcoin’s sensitivity to geopolitical risk. By midweek, the benchmark crypto had moved from a sub-$64,000 base to a recent peak near $73,770, a swing driven in part by headlines on Iran and allied regional actions. The latest cycle, however, shows a retreat from those highs, with the weekend data painting a more mixed picture as oil markets swung on supply expectations and geopolitical headlines. The net effect for the sector is a reminder that Bitcoin—often framed as a hedge by proponents—continues to trade in step with broader risk-on and risk-off cycles, even as its decoupling thesis remains a point of contention for researchers and market observers.
As traders digest the evolving scenario, several threads are converging: the reliability of energy supplies in a geopolitically tense region, the willingness of futures and options markets to provide liquidity during a flare-up, and the extent to which crypto markets price in these cross-asset risk factors. The oil-price path, with a peak well above $110 per barrel and subsequent consolidation around $105, acts as a barometer for how quickly risk appetite can toggle in digital-asset markets. For now, the price action around Bitcoin shows resilience after the initial decline, but the longer arc will depend on how the Strait of Hormuz risk evolves and how quickly production disruptions can be mitigated through alternative supply and policy responses.
Key takeaways
- Oil spiked to $113.7 per barrel after the open, driven by Iraq’s warning of potential disruptions in roughly 3 million barrels per day of output due to Iranian threats against tanker traffic in the Strait of Hormuz.
- Bitcoin traded a volatile path, dropping from about $66,960 to $65,725 during the early session before bouncing to roughly $66,272 as futures trading commenced.
- Oil prices later cooled to around $105 per barrel, offering a partial reprieve for risk assets amid ongoing geopolitical risk considerations.
- Bitcoin climbed through the prior week amid regional tensions, rising from below $64,000 to around $73,770, before retreating in the recent volatility cycle.
- Trump signaled that the move in oil would be temporary, a stance that markets weighed as they assessed the persistence of energy-market pressure and its impact on crypto liquidity and investor risk sentiment.
- The events underscore how energy-market dynamics and geopolitical risk can translate into rapid, cross-asset moves, including in digital assets and decentralized finance platforms.
Tickers mentioned: $BTC
Market context: The episode highlights how macro shocks—especially energy-market volatility tied to geopolitical frictions—can influence crypto liquidity and price action, even as investors weigh longer-term narratives around adoption, regulation, and institutional participation.
Why it matters
The weekend moves emphasize the ongoing sensitivity of digital-asset markets to macro developments. While Bitcoin has at times been framed as a hedge against traditional market risk, recent episodes suggest it remains intricately linked to broader risk sentiment, liquidity conditions, and policy signals. For traders and investors, the immediate takeaway is to monitor cross-asset channels—oil, credit, and equities—alongside crypto-specific indicators and on-chain signals to gauge potential follow-through in Bitcoin and related assets. Corporations, funds, and retail participants alike are watching how geopolitical risk translates into volatility across the crypto ecosystem, and how liquidity providers respond when traditional markets exhibit stress.
From a risk-management perspective, the situation underscores the value of diversification and hedging strategies that can operate across asset classes. It also raises questions about the resilience of crypto markets during sustained energy-price shocks and the potential for spillovers from geopolitical risk into DeFi protocols and spot markets. As observers track the evolving narrative—from tanker-route tensions to potential diplomatic or policy steps—the overall message is that crypto markets remain a dynamic and reactive frontier, where macro headlines can rapidly redefine sentiment and price trajectories.
What to watch next
- Oil price trajectory: Will prices stabilize near the $105–$110 range, or head higher if tensions persist or escalate further?
- Bitcoin price path: Will BTC hold above crucial levels around the mid-60,000s, or test new support as macro risk continues to shape liquidity?
- Geopolitical developments: Fresh statements or actions from Iraqi, Iranian, or regional actors that could affect oil flow and risk appetite.
- Market messaging: Any new commentary from policymakers or major financial institutions that might recalibrate energy and crypto risk premia.
Sources & verification
- Hyperliquid data on crude oil (OIL) price movements and intraday spikes in response to Middle East tensions.
- Iraq’s public warnings regarding potential disruptions to production in the context of Iranian threats against tanker routes.
- Bitcoin price moves described in the session, including the drop to $65,725 and rebound to $66,272 as U.S. futures opened.
- Historical context of Bitcoin’s rally in the prior week during geopolitical developments, with prices rising toward $73,770.
- Trump’s comments on oil-price dynamics and the implied expectation of a rapid reversion, as reported in the coverage.
- Related coverage: Iranian crypto outflows spike after geopolitical events (linked in the source material) for cross-verification of crypto-market responses to cross-border tensions.
Market reaction and key details
Bitcoin (CRYPTO: BTC) movements during the latest flare-up illustrate how crypto markets respond to energy-market volatility and geopolitical risk. After a sharp intraday dip, BTC retraced higher as futures and spot liquidity interacted with macro headlines. The oil market’s swing from the mid-$90s to well above $110 a barrel and back toward the $105 level served as a backdrop for a crypto market that continues to navigate evolving liquidity conditions, central-bank expectations, and the broader risk-on/off environment. The interplay between oil shocks and digital-asset pricing remains a focal point for traders looking to understand the sensitivity of decentralized markets to traditional macro indicators.
Why it matters
The episode reinforces that crypto markets are not insulated from real-world risk factors. Energy-price volatility can alter risk appetite, liquidity provision, and cross-asset correlations, influencing how quickly traders move in and out of Bitcoin and other digital assets. For long-term holders, the event highlights the importance of monitoring macro headlines and cross-market signals, as short-term volatility can be driven by geopolitical developments even when fundamental narratives for the technology remain intact. For builders and investors, it underscores the need for robust risk management, liquidity planning, and diversification strategies that can weather multi-asset shocks as geopolitical dynamics evolve.
What to watch next
- Watch oil-market action over the coming days for signs of sustained escalations or de-escalations, with attention to any new disruptions to supply or tanker traffic.
- Monitor Bitcoin price levels around critical thresholds (in the 60k–70k area) and the depth of liquidity during U.S. market hours.
- Track official statements and policy responses from Middle East stakeholders, which could alter energy-price expectations and risk sentiment.
Sources & verification
- Hyperliquid’s oil-price feed and its reported intraday spike to $113.7/bbl and later retreat to around $105/bbl.
- The Iraqi production-disruption warning related to Iranian threats against Strait of Hormuz traffic.
- Bitcoin price trail: decline to $65,725 and rebound toward $66,272 as U.S. futures markets opened.
- Mid-week Bitcoin rally to roughly $73,770 during the period of heightened geopolitical activity.
- Public commentary from Donald Trump regarding the oil-price trajectory and expected quick normalization.
- Related coverage on Iran-related crypto flows and broader regional developments for cross-verification of market responses.
Market reaction to oil shock and bitcoin price moves
In summary, the latest price action around Bitcoin and oil demonstrates the evolving dynamic between energy markets and digital assets. While Bitcoin has shown resilience at times, its short-term movements appear closely tied to macro risk signals, especially in moments of heightened geopolitical risk. As the situation continues to unfold, market participants should prepare for continued volatility and pay close attention to cross-market indicators that can illuminate the path forward for both energy prices and cryptocurrency prices.
Bitcoin fell nearly 2% in just 15 minutes on Sunday while oil prices rose almost 20% as the escalating Middle East conflict prompted fears of a major supply shortage in the global energy market.
Data from decentralized derivatives platform Hyperliquid shows oil prices rose from $95 to $113.7 per barrel shortly after US futures markets opened, as Iraq warned that roughly 3 million barrels per day of production could be disrupted due to Iranian threats against tankers in the Strait of Hormuz.
It’s the highest price oil has reached since April 2022, a few weeks after Russia commenced its invasion of Ukraine, TradingView data shows.
The price of oil rose more than 30% last week after the US and Israel struck Iran, leading the war-torn nation to counterstrike against several of its Middle Eastern neighbors.
Bitcoin (BTC) fell from $66,960 to $65,725 by 10:30 pm UTC on Sunday as US futures markets opened before bouncing back up to $66,272 at the time of publication.
Hyperliquid data also shows that oil prices have cooled off to $105 per barrel.

Bitcoin climbed during the Middle Eastern conflict last week, which saw the death of Iranian Supreme Leader Ayatollah Khamenei, rising from below $64,000 to $73,770 by Wednesday.
But since then, Bitcoin’s price has fallen over the last four consecutive days.
Trump not worried about oil prices
Despite the boom in oil prices, Trump expects the rapid rise in oil prices to be short-lived:
“We figured oil prices would go up, which they will. They’ll also come down. They’ll come down very fast,” Trump told reporters on Saturday.
Related: Iranian crypto outflows spike 700% after US-Israeli airstrikes
Trump also shrugged off the idea that the US may need to tap its Strategic Petroleum Reserve, stating:
“We’ve got a lot of oil. Our country has a tremendous amount,” Trump said. “There’s a lot of oil out there. That’ll get healed very quickly.”
Magazine: South Korea gets rich from crypto… North Korea gets weapons
Crypto World
Vitalik Buterin Urges Crypto Community to Rethink Democratic Tools Amid Global Authoritarian Shift

TLDR:
- Vitalik Buterin warns that enthusiasm for DAOs, quadratic funding, and ZK voting tools is rapidly declining globally.
- Buterin contrasts the stable 2000s era of bold democratic vision with today’s chaotic, power-driven political landscape.
- He argues that democratic tools must now focus on consensus-finding rather than building hard binding governance mechanisms.
- Buterin calls for sanctuary tools that give politically vulnerable groups like Iranians a real, collective voice right now.
Vitalik Buterin, co-founder of Ethereum, has called for a fresh look at democratic tools across the blockchain space.
In a widely circulated post, he questioned the direction of DAOs, quadratic funding, and decentralized voting systems.
He noted growing disillusionment with democratic structures across political, corporate, and social media settings alike.
He also pointed to zero-knowledge proofs and artificial intelligence as powerful new resources for building more effective democratic mechanisms going forward.
Enthusiasm for Democratic Crypto Tools Is Fading
Vitalik Buterin recently raised concerns about declining interest in democratic tools across the crypto industry. He observed that enthusiasm for mechanisms like DAOs, quadratic voting, and ZK-based governance has dropped noticeably in recent years.
This shift, he argued, is not isolated to blockchain — it mirrors broader societal changes playing out globally.
Buterin pointed to what he described as an “authoritarian wave” affecting multiple areas of modern life. The trend is not confined to nation-state politics, he noted in his detailed post.
Corporations have increasingly become more founder-centric, and social media platforms have faced mounting public disillusionment as well.
He warned that defending democratic structures without offering a positive vision will ultimately prove insufficient. Buterin stated that such defense today carries the feel of conservatism rather than genuine progress.
He argued that if advocates only work to preserve the existing order, they will gradually lose ground to more aggressive and better-organized forces over time.
Stable vs. Chaotic Eras Shape What Democratic Tools Can Realistically Achieve
Buterin drew a clear contrast between the stable 2000s and 2010s and the chaotic conditions defining the 2020s. During the earlier decades, large-scale democratic visions seemed genuinely achievable and attracted widespread interest from builders.
Ambitious goals like global UBI, DAO-funded public goods, and wholesale electoral reform all felt within reach at that time.
Today, those same goals appear far more distant to most observers in the crypto and governance space. In a chaotic era, the average intervention in any political order tends to reflect raw power-grabbing rather than principled mechanism design.
Buterin noted that pushing for ranked-choice voting in the United States feels unrealistic when basic gerrymandering bans still cannot pass.
This context changes what democratic tools should realistically aim to accomplish right now. Rather than building hard binding governance systems, the focus should shift toward consensus-finding mechanisms instead.
These tools would surface broadly supported positions and present them to decision-making actors, giving distributed groups a credible and meaningful voice in outcomes.
New Technologies Offer a Credible Path Toward Collective Voice
Despite the difficult political climate, Buterin sees genuine opportunity in a new generation of technological tools. Zero-knowledge proofs, AI, and stronger cybersecurity all provide new ways to build effective democratic systems at scale.
He argued that today’s toolkit is considerably more powerful than anything available to builders just a decade ago.
He pointed to platforms like Pol.is and assurance contract-style voting as practical models worth developing further.
Anonymous votes that become public only after reaching a set threshold could give distributed groups a credible collective voice.
Such tools would also allow centralized actors to identify which policy shifts carry widespread support and hold genuine legitimacy.
Buterin also used the ongoing situation in Iran as a real-world case for what he called “sanctuary tools for collective voice.”
He argued that ordinary Iranians need mechanisms to express their collective positions in ways that carry actual weight right now.
He called for building tools that serve people seeking democratic expression while living under unstable and politically volatile conditions.

TLDR:
- Private Credit giant BCRED received $3.7B in Q1 2026 redemptions, nearly triggering a formal gate
- Average BDCs now trade at a 20% NAV discount with yields of 10–11%, signaling rising credit stress.
- DeFi risks becoming exit liquidity for distressed private credit products offloaded by Wall Street.
- Smart contracts can enforce redemption rules transparently, giving onchain private credit an edge.
Private credit markets are under mounting pressure as elevated interest rates and AI-driven uncertainty shake investor confidence. Redemption requests have surged across major funds, raising liquidity concerns.
At the same time, the crypto and DeFi space is watching closely. Real-world asset strategies built on private credit are now drawing scrutiny.
The question is whether DeFi can offer a safer, more transparent alternative — or whether it risks becoming an exit route for distressed Wall Street products.
Rising Rates Have Strained Private Credit Borrowers
Private credit funds operate much like private banks. They lend capital to businesses and collect interest in return. Investors range from pension funds and insurance companies to retail participants via publicly traded Business Development Companies (BDCs) and semi-liquid vehicles.
The Federal Reserve began its aggressive rate-hiking cycle in March 2022, lifting rates from near zero to over 5% by mid-2023. Rates have stayed elevated through early 2026, with only modest cuts along the way.
This has made borrowing considerably more expensive for businesses that locked in debt during the low-rate era.
As Stani Kulechov noted on X: “The problem arises when the cost of capital stays elevated for too long, creating unmanageable expenses for borrowers.”
For many middle-market companies, this squeeze has lasted long enough to push credit quality lower across the private lending space.
Redemption Pressure Is Building Across Major Funds
The strain is showing up clearly in fund-level data. Blackstone’s flagship private credit vehicle, BCRED, manages roughly $82 billion. During Q1 2026, it received $3.7 billion in redemption requests — about 8% of NAV.
Blackstone injected $400 million of its own capital to manage the pressure. The fund narrowly avoided formal gating.
BlackRock’s HPS Corporate Lending Fund, a $26 billion vehicle, was not as fortunate. Redemption requests hit a point where gating became necessary, with approximately $580 million in requests going unfulfilled.
Blue Owl’s retail private credit fund saw $2.9 billion in redemptions during Q4 2025, partly due to heavy exposure to software lending.
The broader market has repriced accordingly. The average BDC now trades at roughly a 20% discount to net asset value, offering yields of 10 to 11%. Historically, these funds traded at a premium.
Some fund-level default metrics have climbed as high as 9%, a level that signals rising credit stress across the sector.
DeFi Must Avoid Becoming Wall Street’s Exit Liquidity
The private credit dislocation carries direct relevance for the DeFi ecosystem. Many real-world asset strategies in DeFi are built on private credit instruments.
Retail-oriented DeFi users often commit capital into high-yielding RWA products without fully understanding the duration or liquidity risks embedded in them.
Kulechov put the concern plainly: “My greatest fear is that institutional opportunists could view DeFi as a channel to offload illiquid and distressed products that Wall Street has already soured on.”
RWA opportunities are harder to assess than native DeFi strategies, as they lack the same onchain verifiability and transparency.
There is, however, a constructive path forward. Smart contracts can encode redemption windows, withdrawal limits, and collateral ratios in ways that traditional funds cannot match.
Unlike BCRED or HLEND, where terms were tightened at the manager’s discretion, onchain rules are transparent from the start and enforced by code.
For private credit done properly in DeFi, that structural advantage could ultimately benefit retail participants — provided the industry builds the right safeguards, risk disclosures, and governance frameworks first.


In what’s become a familiar scenario in crypto over the past few months, prices are starting the week on the wrong foot.
After little sign over the weekend of any de-escalation in the U.S. war against Iran, the price of oil has exploded higher in Sunday evening U.S. trade. April WTI crude oil futures are currently up 19.1% to $108.35 per barrel. That’s roughly double the price at the start of 2026 and the highest level in about four years.
That surge, in turn, has sent U.S. stock index futures down by nearly 2% across the board. Futures for Japan’s Nikkei 225 are lower by 3.1% shortly before that stock market opens for Monday trade.
Bitcoin is lower by 2% and trading just below $66,000. Ether (ETH) and solana (SOL) are down closer to 1.4%.
A check of other commodity prices finds the precious metals and copper all trading modestly lower.
TLDR:
- Bitcoin anchors the 3-Layer Architecture as Digital Capital with a fixed supply and no central issuer or counterparty.
- Stretch functions as Digital Credit, using Bitcoin as collateral to create a superior alternative to traditional fiat-backed credit.
- Strategy operates as Digital Equity, deploying a reflexive flywheel that compounds Bitcoin Per Share for common equity holders.
- The 3-Layer Architecture is the first unified capital stack where treasury, credit, and equity are all backed by Bitcoin.
The 3-Layer Architecture enabling Strategy to revolutionise finance is drawing attention across global capital markets.
Strategy has built a vertically integrated capital stack that connects Bitcoin, credit, and equity into one coherent system. Each layer feeds the one above it, creating a structure that compounds over time.
This architecture did not exist before Bitcoin made it technically possible. It represents a new category of financial institution that operates entirely outside the traditional monetary framework.
How the Architecture Is Structured Across Three Distinct Layers
The 3-Layer Architecture is composed of Digital Capital, Digital Credit, and Digital Equity. Each layer serves a separate function and targets investors with different financial goals.
Bitcoin sits at the bottom as Digital Capital, providing the foundation for everything built above it. Stretch occupies the middle as Digital Credit, while Strategy sits at the top as Digital Equity.
Bitcoin is the only asset with a fixed supply, no issuer, and no central point of failure. No government or central bank can dilute, debase, or seize it.
These properties make it the most reliable foundation for a new financial system. Analyst Chris Millas described it as “the soundest money humanity has ever discovered.”
The architecture is intentionally built from the bottom up. Each layer derives its strength from the layer beneath it. Without sound capital at the base, neither the credit nor the equity layer could function with the same level of integrity.
Digital Credit Bridges Bitcoin and Equity in the Stack
Stretch, the Digital Credit layer, acts as the bridge between Bitcoin and Strategy’s equity. Unlike traditional credit, Stretch is collateralised by Bitcoin rather than fiat currency.
This changes the fundamental risk profile of the credit instrument entirely. As Millas noted, “the quality of a credit instrument is only as good as the quality of the collateral backing it.”
Traditional credit rests on fiat — a centralised asset that governments can inflate or seize at any time. Bitcoin-backed credit cannot be manipulated by any central authority.
That structural difference gives Digital Credit a clear advantage over conventional credit products. It also opens a new income category for investors who want Bitcoin exposure without direct price volatility.
Strategy raises capital by issuing these Digital Credit products to investors with varying risk tolerances. That capital flows directly into Bitcoin acquisitions. The credit layer is therefore not passive — it actively powers the equity layer above it.
Strategy’s Digital Equity Completes the Self-Reinforcing System
At the top of the 3-Layer Architecture sits Strategy as Digital Equity. It offers a leveraged, reflexive claim on Bitcoin’s appreciation, amplified through the financial engineering of the credit layer below.
As Bitcoin holdings grow, the balance sheet strengthens, attracting more investor capital. That capital then purchases more Bitcoin, and the cycle continues.
Millas described this loop clearly: “More Bitcoin → Stronger Balance Sheet → Stronger Credit Rating → Attract More Capital → More Bitcoin.”
Each rotation through this cycle compounds Strategy’s Bitcoin Per Share for common equity holders. The flywheel accelerates with each pass, not slows down.
Strategy is the first institution to unify treasury, credit, and equity under one Bitcoin-backed capital structure. Millas called this “a new financial primitive” with no direct predecessor in conventional finance.
The 3-Layer Architecture is not a theory — it is already operating and scaling across global capital markets.

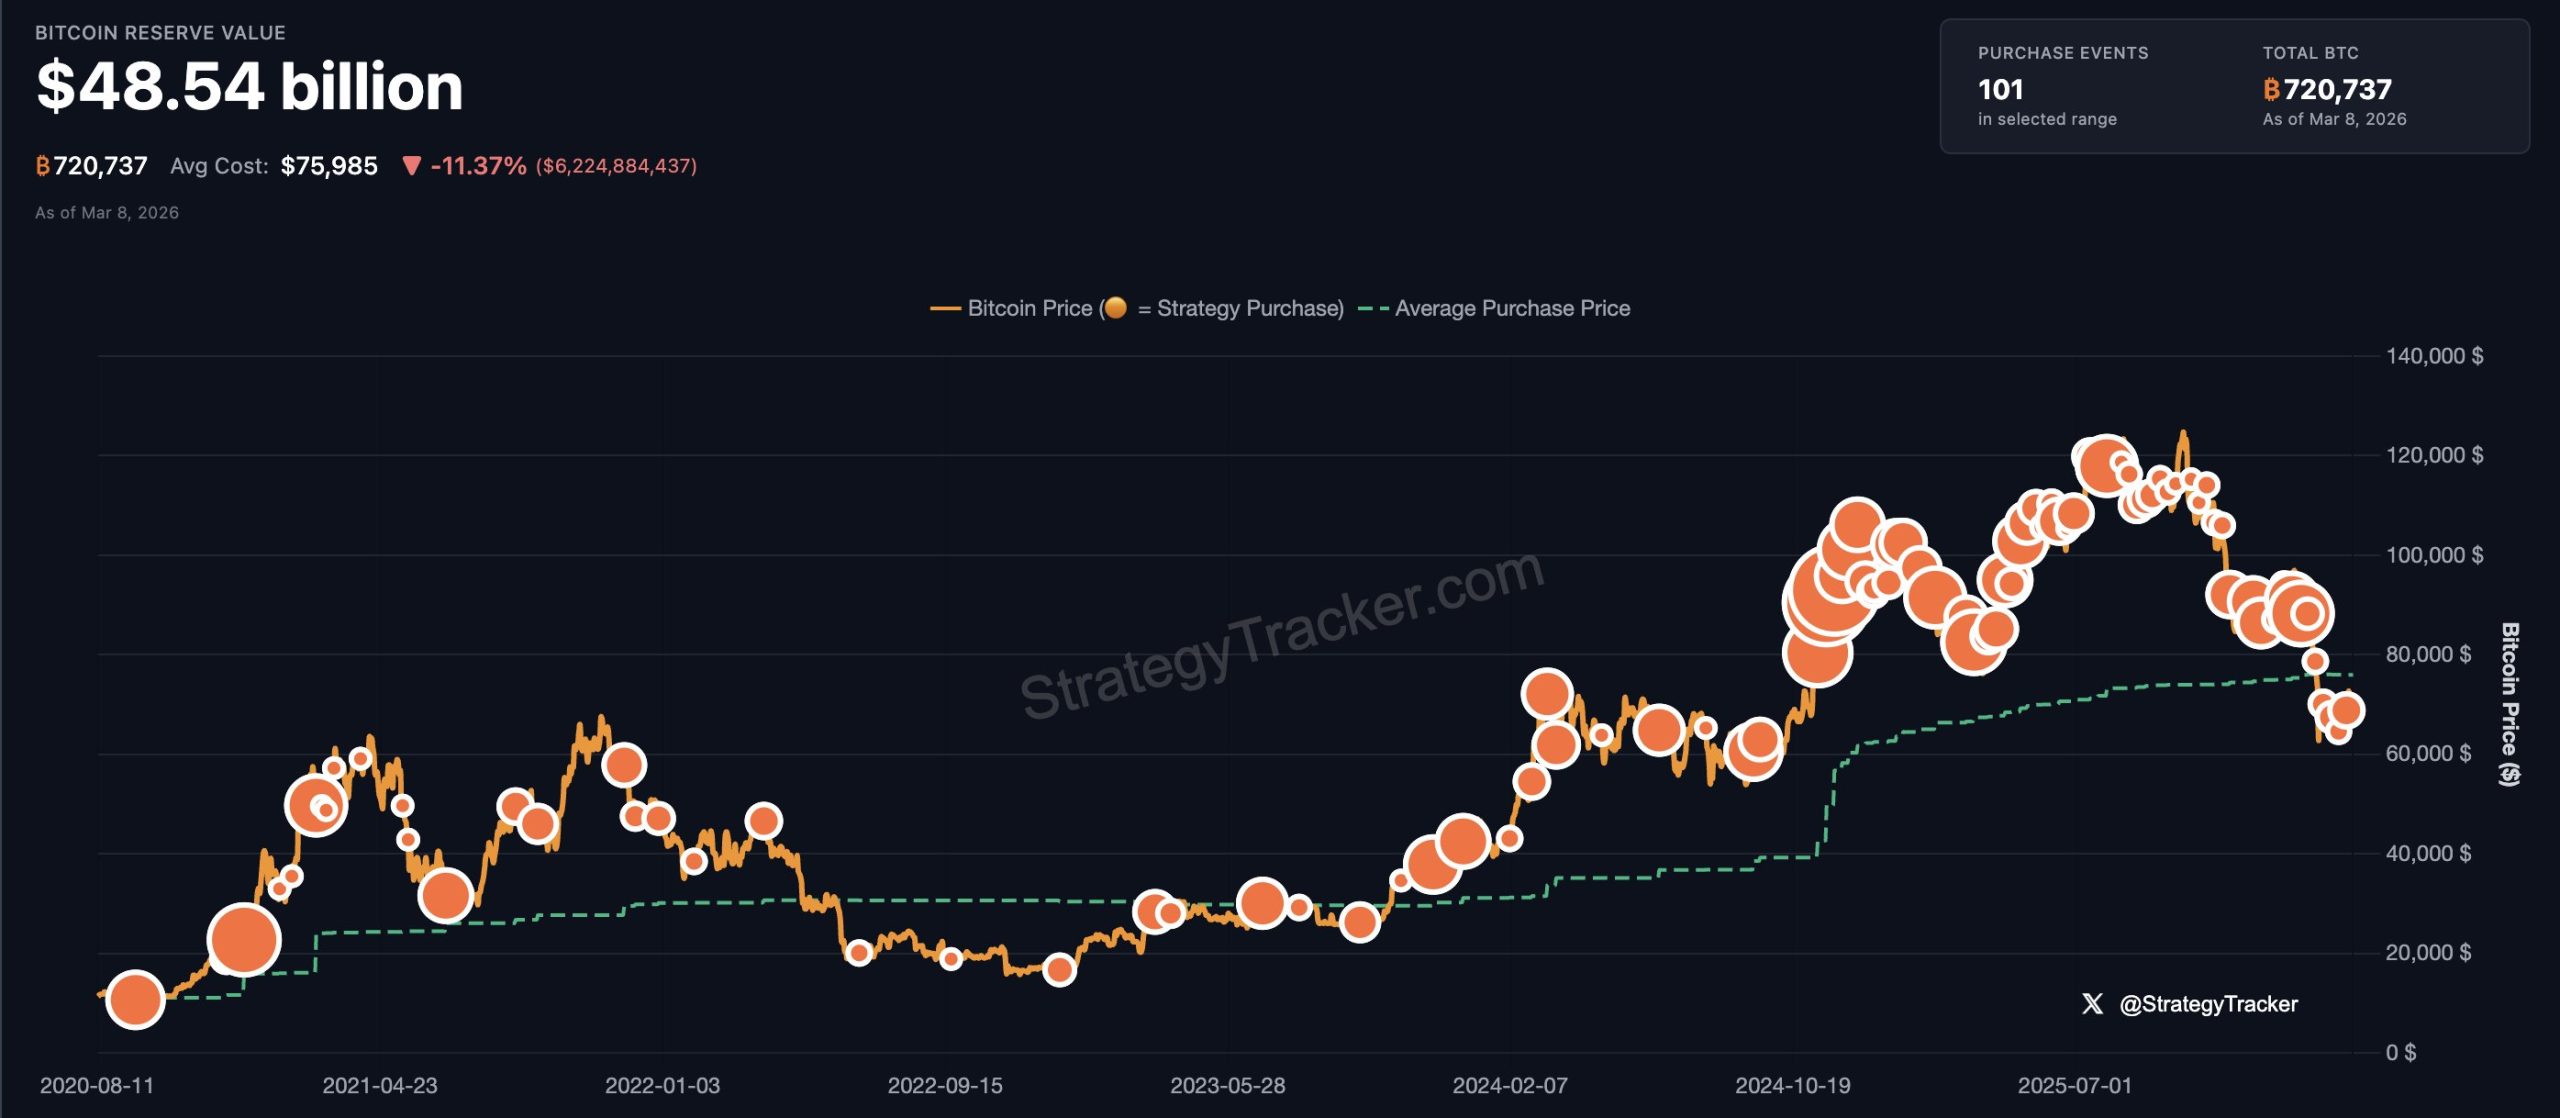
Bitcoin (CRYPTO: BTC) remains a focal point for Strategy, the BTC treasury vehicle co-founded by Michael Saylor, as the digital asset trades near the $66,000 level. In late February, the firm disclosed a fresh round of accumulation: 3,015 BTC bought for more than $204 million, expanding Strategy’s total holdings to 720,737 BTC and placing the value of its stash at roughly $48.1 billion at the time. On X, Saylor echoed a familiar refrain—“The Second Century Begins”—accompanying the post with the company’s BTC-accumulation chart, a touchstone for investors watching for additional purchases.
The most recent buy is part of a persistent strategy to grow the bitcoin reserve through leverage and equity financing, even as the broader market displays broad-based weakness. The company has signaled it will continue to accumulate BTC despite headwinds, underscoring a conviction that the asset remains core to Strategy’s long-term value proposition. The purchase occurred against a backdrop of a broader crypto downturn and a governance landscape that has strained many digital assets treasuries, complicating capital allocation decisions for players that manage digital-asset exposures on behalf of clients or as stand-alone holdings.
Market observers note that Strategy’s basic NAV sits just below 1, effectively meaning the company is trading at a discount to its BTC treasury. The dynamic highlights the tension between market pricing and the underlying BTC stake, particularly when the treasury’s net asset value is a proxy for the value of its holdings. The Saylor-led team has repeatedly emphasized that the BTC position is strategic, and the NAV discount can reflect external pressures rather than changes in the BTC position’s intrinsic value.
The data trail surrounding Strategy’s purchases is publicly trackable. SaylorTracker records place-and-time context for average entry costs, with the most referenced figure showing an average cost per BTC of around $75,985, against current prices that remain well below that level. These figures underscore the disparity between the market’s short-term moves and the long-run thesis that Strategy advocates for BTC as a treasury asset. Readers can verify the cost context at SaylorTracker.
Beyond the numbers, the public narrative around Strategy remains closely tied to Saylor’s messaging and the accumulation chart he routinely shares. The “Second Century” slogan has become a shorthand for a continuing program of accumulation, signaling a long horizon for Strategy’s BTC strategy even as prices oscillate. The link to the corresponding post on X is included in his communications and remains a reference point for followers watching for any shift in buy cadence or financing structure.
The ongoing accumulation is set against a backdrop of the evolving role of crypto treasury firms. Market participants have argued that 2026 could resemble a consolidation phase as firms with cash-flow-generating activities buy or merge with pure accumulation players that hold BTC. In this view, consolidation could unlock synergies—scale, liquidity, and cross-services potential—that help treasury players weather NAV volatility and regulatory headwinds. As Wojciech Kaszycki, chief strategy officer of treasury firm BTCS, put it, “If you consolidate with another player, sometimes two plus two equals six or more, you can win faster, because everybody in this market trading below net asset value is struggling.”
BitcoinTreasuries, a widely cited data source on BTC holdings across treasuries, ETFs, and related wrappers, illustrates the broader ecosystem in which Strategy operates. The charting and data context help explain why some investors view Strategy’s approach as part of a broader trend toward asset-backed vaults within the crypto space. While some treasuries grapple with NAV fluctuations or the liquidity constraints of the current environment, Strategy’s explicit emphasis on growing BTC reserves remains a defining characteristic of its business model.
Despite the continued emphasis on accumulation, Saylor has previously signaled caution about pursuing aggressive M&A activity. He has dismissed the idea of buying up competitors or distressed BTC-treasury peers, arguing that such deals can take months to execute and may not endure as markets evolve. “These things tend to stretch out six to nine months or a year,” he noted, adding that a plan that looks viable at inception might not look so six months down the line. This tempered stance highlights the complex calculus behind NEV-driven strategies within crypto treasuries and the emphasis on disciplined capital deployment rather than rapid consolidation.
Key takeaways
- Strategy added 3,015 BTC in the last week of February for more than $204 million, increasing total holdings to 720,737 BTC and placing the position’s value at roughly $48.1 billion at the time.
- The firm’s average cost per BTC is reported as about $75,985, per SaylorTracker, with current prices beneath that level, underscoring a valuation gap relative to the entry price.
- Strategy’s basic NAV sits just below 1, indicating the BTC treasury trades at a discount to the company’s net asset value, a dynamic that weighs on market perception but may not reflect the asset’s long-term value.
- Industry observers anticipate 2026 as a potential consolidation year among crypto treasuries, driven by NAV pressures and the quest for scale, according to BTCS’s Kaszycki.
- Michael Saylor has signaled a cautious approach to mergers, emphasising time horizons and the risk that acquisitions may not pay off as originally envisioned.
Tickers mentioned: $BTC, $STRC
Sentiment: Bullish
Market context: The ongoing tension between NAV discounts, capital-formation needs, and macro risk sentiment frames Strategy’s actions, while industry chatter points to a possible wave of consolidation among crypto treasuries as participants seek scale and improved liquidity.
Why it matters
The continued BTC accumulation by Strategy highlights a broader theme in the crypto treasury space: even in periods of pronounced volatility, some corporate treasuries view BTC as a core reserve asset that can anchor long-term value. The purchases conducted through debt and equity financing reflect a disciplined, capital-formation approach rather than opportunistic timing, suggesting a strategic bet on BTC’s macro resilience and potential price appreciation over time.
From a market perspective, the combination of large, publicly disclosed BTC holdings and explicit signals from Saylor on social channels contributes to a narrative that BTC remains a legitimate treasury asset for corporate balance sheets. The NAV dynamic—trading below asset value—adds nuance, signaling that relative pricing and investor sentiment can diverge from the underlying asset’s value. Observers emphasize that such gaps can close if the market turns favorable or if liquidity conditions improve, but they also underscore the importance of financing terms and risk management when increasing BTC exposure via leverage or equity issuance.
For the broader crypto ecosystem, Strategy’s actions—and the commentary around potential consolidation—touch on the strategic role of these treasury vehicles. The prospect of consolidation could facilitate greater operational breadth, risk-sharing, and diversified revenue streams beyond pure BTC accumulation. Yet observers also caution that mergers and acquisitions in this space carry complexity and timing risks, reinforcing Saylor’s insistence on careful, evidence-based decision-making rather than rapid expansion.
What to watch next
- Upcoming BTC purchases or financing announcements from Strategy, particularly in the next quarter, and any changes in leverage or equity issuance terms.
- Signs of consolidation activity among digital-asset treasuries in 2026, including potential new partnerships or mergers and the impact on NAV dynamics.
- BTC price movements around key levels—whether the price can converge toward Strategy’s average acquisition cost or surpass major resistance zones.
- Any updates to Strategy’s NAV composition and how the market prices the BTC treasury relative to the underlying asset value.
SOURCES & verification
- Strategy’s February 2026 BTC purchase report (3,015 BTC for >$204 million) and total holdings: Cointelegraph report on Strategy’s BTC buys
- The Second Century Begins post by Michael Saylor on X: https://x.com/saylor/status/2030630059573207263
- SaylorTracker cost data: https://saylortracker.com/?tab=home
- BitcoinTreasuries overview: https://bitcointreasuries.net/
- Digital asset treasuries NAV considerations and related coverage: https://cointelegraph.com/news/digital-asset-treasuries-mnav-collapse-standard-chartered
- Bitcoin price reference page: https://cointelegraph.com/bitcoin-price
- Mysterious Mr Nakamoto – Magazine excerpt (contextual reference): https://cointelegraph-magazine.com/benjamin-wallace-mysterious-mr-nakamoto-review/
Why it matters
Strategy’s ongoing BTC accumulation underlines a long-horizon view on Bitcoin as a treasury asset, reinforcing the perception that BTC can serve as a strategic reserve in corporate balance sheets. The deployment through debt and equity financing signals a proactive approach to scaling holdings even in a challenging macro environment, while NAV discounts suggest impatient pricing in the market that may not fully reflect the asset’s intrinsic value. This dynamic matters for investors evaluating exposure to treasury-style strategies and for builders seeking to understand how corporate treasuries navigate funding constraints under volatility.
At the same time, the discussion around 2026 consolidation provides a roadmap for how the sector might evolve. If scale and operational synergies can be achieved, consolidation could enhance liquidity, risk management, and the ability to provide broader services around BTC holdings. However, the caution voiced by Saylor about mergers—highlighting the risk that a seemingly attractive move can lose value over time—grounds this trend in prudent, long-term thinking rather than hype. The market will be watching whether any consolidation stories gain traction and how they impact NAV valuations and BTC price dynamics over the coming quarters.
What to watch next
- Next reported BTC purchase cadence from Strategy, including the use of debt or equity financing to fund new buys.
- Regulatory or market developments affecting crypto treasuries’ ability to manage NAVs and raise capital.
- Any formal consolidation announcements among treasury players and their potential impact on market liquidity and valuation premia/discounts.


The new hardware is expected to add about 3.05 exahash per second (EH/s) of mining power when deployed at the company’s site in Drumheller.
American Bitcoin (ABTC) is expanding its Bitcoin mining operations by purchasing 11,298 new ASIC equipment.
The acquisition is expected to increase the company’s total capacity by 12%, supporting its strategy of accumulating BTC through mining operations.
The 12% Capacity Expansion
ABTC said in a March 3 press release that the new miners will add 3.05 exahash per second (EH/s) to its owned capacity, with the machines scheduled for deployment in March 2026 at the Drumheller site in Alberta, Canada.
Each unit is expected to operate at an efficiency rate of approximately 13.5 joules per terahash (J/TH), compared with the company’s current fleet average of 16 J/TH.
“As Bitcoin matures, the priority is clear: grow American-owned, professionally operated hashrate,” said co-founder Eric Trump. “That’s how we protect the network, drive innovation, and lead the future of Bitcoin in America.”
Following this purchase, American Bitcoin’s owned fleet will increase by 12% to 89,242 miners, representing about 28.1 EH/s of total owned capacity. The managed fleet contains all miners held by the company, including units that may not currently be operational.
Once the new equipment is online, the working fleet will comprise 58,999 miners delivering around 25.0 EH/s with an average efficiency of approximately 14.1 J/TH. For comparison, the largest publicly listed BTC miners currently operate at roughly 50 EH/s.
Bitcoin Accumulation Strategy
Matt Prusak, president of ABTC, said the company makes every decision to maximize its accumulation of the OG cryptocurrency. The miner firm previously reported that it ended 2025 with 5,041 BTC on its balance sheet, which has since grown to more than 6,000 BTC.
You may also like:
He also explained that the firm’s fleet strategy focuses on deploying high-efficiency hardware, optimizing energy costs, and maintaining the flexibility to scale operations in response to network and market conditions.
Following the recent deployment of high-efficiency machines, the company aims to produce BTC at a structurally advantaged cost basis and grow its total holdings per share through disciplined mining operations and capital allocation.
Meanwhile, the expansion comes when several public miners are redirecting capital and infrastructure toward AI workloads. Companies such as Core Scientific, Riot Platforms, Cipher Mining, and Bitdeer have repurposed parts of their data center capacity to support the technology.
American Bitcoin itself reported a net loss of $59.45 million in the fourth quarter of 2025, compared to a $3.48 million profit a year earlier.
For the three months ending December 31, the company’s revenue was $78.3 million, up from $64.2 million during the same period last year, but slightly lower than the $79.6 million analysts had anticipated.
Binance Free $600 (CryptoPotato Exclusive): Use this link to register a new account and receive $600 exclusive welcome offer on Binance (full details).
LIMITED OFFER for CryptoPotato readers at Bybit: Use this link to register and open a $500 FREE position on any coin!
Michael Saylor, the co-founder of Bitcoin (BTC) treasury company Strategy, indicated on Sunday that the firm is buying more BTC, as the price hovers near the $66,000 level.
“The Second Century Begins,” Saylor said on X, as he shared the Strategy BTC accumulation chart that has become synonymous with impending BTC purchases.
Strategy’s most recent BTC purchase occurred during the last week of February, when the company bought 3,015 BTC for more than $204 million, bringing its total holdings to 720,737 BTC, valued at about $48.1 billion using market prices at the time of publication.
The price of Bitcoin is currently below Strategy’s average purchase cost of about $75,985 per BTC, according to data from SaylorTracker.

The company continues to accumulate BTC through debt and equity financing, even amid a broad market downturn and a collapse in net asset values (NAVs) for Treasury companies.
Strategy’s basic NAV is just below 1, according to the company, meaning it is trading at a discount to its BTC treasury.
Related: Strategy boosts monthly STRC preferred dividend to 11.5% for March 2026
2026 may be the year of consolidation for crypto treasury companies, but Saylor isn’t buying
The digital asset treasury market could consolidate in 2026, as companies with operating businesses that generate cash flow will buy up treasury companies that simply accumulate BTC, according to Wojciech Kaszycki, chief strategy officer of treasury company BTCS.
“If you consolidate with another player, sometimes two plus two equals six or more, you can win faster, because everybody in this market trading below net asset value is struggling,” he told Cointelegraph.

Crypto treasury companies can provide validation services for blockchain networks, mine cryptocurrencies, offer private or public credit instruments, or start any business unrelated to digital assets to generate revenue, he added.
Saylor has dismissed the idea of buying up competitors or distressed BTC treasury companies, citing financial uncertainty as the main reason for avoiding mergers and acquisitions.
“These things tend to stretch out six to nine months or a year,” he said. “An idea that looks good when you start might not still be a good idea six months later,” he added.
Magazine: Mysterious Mr Nakamoto author: Finding Satoshi would hurt Bitcoin

Red Wings’ John Gibson injured in win over Devils

Mac Studio set to get its M5 update next this summer
Tesco F&F releases beautiful summer dress that shoppers find ‘absolutely lovely’


-

 Politics6 days ago
Alan Cumming Brands Baftas Ceremony A ‘Triggering S**tshow’
-
Business3 days ago
Form 8K Entergy Mississippi LLC For: 6 March
-

 Fashion2 days ago
Weekend Open Thread: Ann Taylor
-

 Entertainment7 days ago
Baby Gear Guide: Strollers, Car Seats
-

 Tech4 days ago
Bitwarden adds support for passkey login on Windows 11
-
 Sports3 days ago
499 runs and 34 sixes later, India beat England to enter T20 World Cup final | Cricket News
-

 NewsBeat7 days ago
Is it acceptable to comment on the appearance of strangers in public? Readers discuss
-

 News Videos7 days ago
How to Build Finance Dashboards With AI in Minutes
-

 Sports1 day ago
Three share 2-shot lead entering final round in Hong Kong
-

 Sports22 hours ago
Braveheart Lakshya downs Lai in epic battle to enter All England Open final | Other Sports News
-

 Business5 days ago
Guthrie Disappearance Enters Fifth Week as Family Visits Memorial
-
 NewsBeat7 days ago
Ukraine-Russia war latest: Belgium releases video showing forces boarding Russian shadow fleet oil tanker
-

 Crypto World7 days ago
Why Nexo Is Reentering the US After the 2023 Crypto Lending Crackdown
-

 News Videos7 days ago
LPP + Financial Maths + Numerical Applications | One Shot | Applied Maths | Target Board Exams 2026
-

 NewsBeat3 days ago
Piccadilly Circus just unveiled ‘London’s newest tourist attraction’ and it only costs 80p to enter
-

 Business9 hours ago
Search for Nancy Guthrie Enters 37th Day as FBI Probes Wi-Fi Jammer Theory
-

 Tech6 days ago
Cynus Chess Robot: A Chess Board With A Robotic Arm
-

 Entertainment2 days ago
Hailey Bieber Poses For Sexy Selfies In New Luscious Lip Thirst Traps
-
 NewsBeat6 days ago
Handcuffed presenter Jonathan Ross’ sweet admission about marriage to wife of 38 years
-
 Sports6 days ago
Jack Grealish posts new injury update as Man City star enters crucial period