
Crypto World
Bitcoin Policy Institute Pushes Fed to Revise Bitcoin Risk Rules

U.S. regulators are preparing to release new banking rules that will affect how banks handle digital assets on their balance sheets. The Bitcoin Policy Institute plans to challenge how the framework classifies Bitcoin risk. The group aims to influence upcoming Federal Reserve proposals linked to international banking standards.
Bitcoin Policy Institute Challenges Bitcoin Risk Treatment
The Bitcoin Policy Institute plans to respond to the Federal Reserve’s upcoming proposal on bank asset risk weighting. The organization intends to review the proposal and submit formal comments. It seeks regulatory changes that could reshape how banks treat Bitcoin exposure.
The Federal Reserve recently announced plans to issue a public consultation on implementing global Basel standards. These standards guide how banks measure asset risk and determine capital requirements. Consequently, regulators will define how digital assets appear within bank balance sheets.
The institute argues that the current Basel framework assigns Bitcoin an extremely high risk classification. Under the rules, banks must treat Bitcoin holdings as high-risk assets. Therefore, financial institutions face stricter capital requirements when holding cryptocurrency.
Basel Rules Assign High Capital Requirements To Bitcoin
The Basel Committee on Banking Supervision created global rules that guide banking risk management. These rules classify assets according to their potential financial risk. As a result, banks must hold different levels of capital depending on the asset category.
Within this system, Bitcoin falls into a high-risk category that carries a 1,250 percent risk weighting. Such a rating requires banks to hold equivalent capital for any Bitcoin exposure. Consequently, banks must fully back Bitcoin positions with approved collateral.
Other assets receive far lower classifications under the same regulatory framework. Cash, government bonds, and physical gold carry zero percent risk weighting. Therefore, banks can hold these assets without allocating additional regulatory capital.
The Bitcoin Policy Institute argues that the classification places digital assets at a structural disadvantage. The organization claims the treatment limits financial institutions that want to offer Bitcoin-related services. As a result, banks may avoid integrating Bitcoin into their operations.
Federal Reserve Moves Toward Final Basel Implementation
The Federal Reserve plans to introduce rules that complete the final stage of Basel implementation in the United States. Regulators intend to strengthen financial stability while maintaining support for economic activity. Therefore, the proposal aims to balance growth and financial safety.
Supervisory officials stated that the rules should improve regulatory efficiency across the banking sector. They also intend to maintain strong risk management across financial institutions. Consequently, banks will adjust capital strategies based on the finalized guidelines.
The upcoming proposal will open a public comment period before regulators finalize the framework. Organizations, financial institutions, and policy groups will submit feedback during this stage. Therefore, regulators may revise aspects of the proposal before issuing final rules.
The debate over Bitcoin’s classification has grown since the Basel Committee introduced crypto guidelines in 2021. The committee placed digital assets in a high-risk category called Group Two. Under that structure, banks can hold only limited amounts of these assets.
Group Two assets remain capped at a small percentage of a bank’s overall holdings. The rule restricts exposure to assets considered volatile or uncertain. Consequently, the classification continues to shape how global banks approach cryptocurrency services.

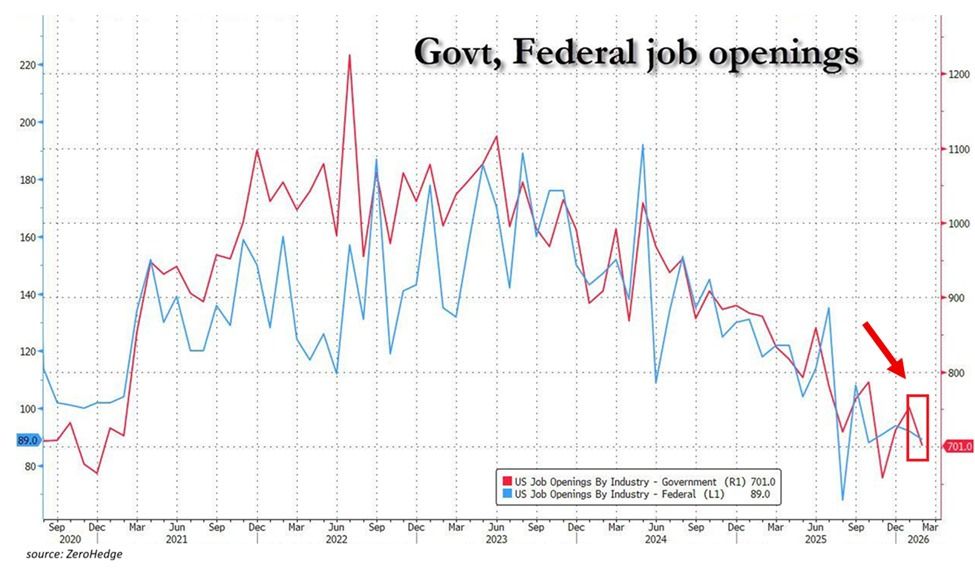
The US job market is showing alarming deterioration. According to The Kobeissi Letter, government job openings dropped 51,000 in February to 701,000.
This marked the second-lowest reading since December 2020. Available government vacancies have fallen 524,000 since their 2022 peak and now sit at pre-pandemic levels.
In addition, federal government openings fell to 89,000, the second-lowest since the pandemic low. This level is also in line with readings from 2017 and 2018.
Follow us on X to get the latest news as it happens
“Meanwhile, the government hiring rate stood at 1.4%, one of the lowest levels since mid-2020 and matching the 2016 and 2017 lows. Government hiring is frozen,” the post read.
Meanwhile, the private sector is shedding jobs at scale. Oracle reportedly laid off up to 30,000 employees on March 31. Amazon cut 16,000 corporate roles in January, and Block eliminated over 4,000 positions. These were just some of the many companies that made job cuts.
Consumer Sentiment Signals Trouble Ahead
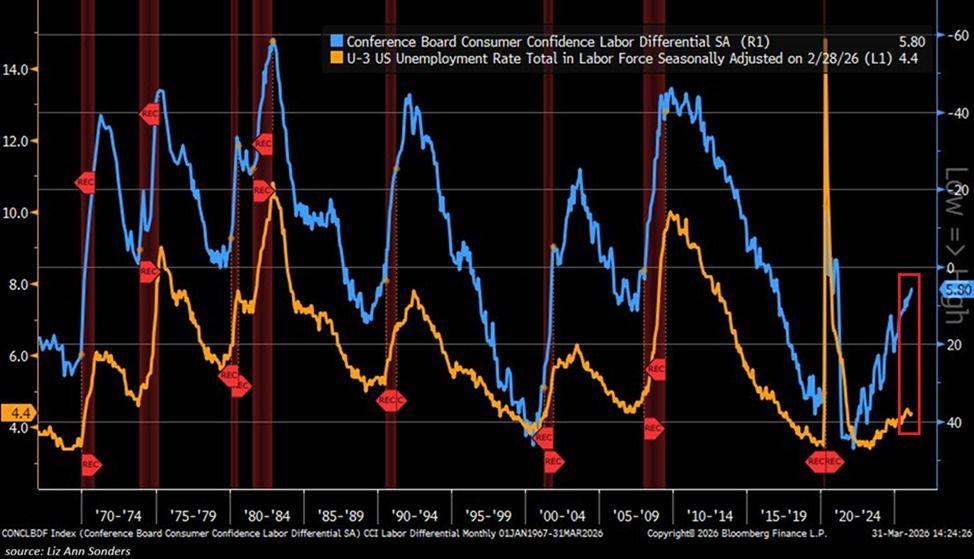
In a separate post, The Kobeissi Letter suggested that forward-looking indicators” point to a further increase in US unemployment.” The Conference Board’s March survey showed that only 27.3% of consumers described jobs as “plentiful.”
This was a marginal uptick from 26.7% in February, but still well below the roughly 55% who felt that way in 2022. At the same time, 21.5% said jobs were “hard to find,” up from approximately 10% over the same period.
The gap between these two readings, known as the labor market differential, fell to just 5.8 points. That represents the lowest level since the 2020 pandemic.
The Kobeissi Letter noted that historically, this indicator has been one of the most reliable leading signals of rising unemployment.
“Furthermore, current levels in this indicator have only been seen prior to or during a US recession since the 1990s. The job market is set for even more weakness,” the analysts added.
With these indicators pointing in the same direction, the March jobs report will be closely watched to determine whether underlying deterioration is cyclical or marks a deeper shift.
Subscribe to our YouTube channel to watch leaders and journalists provide expert insights
The post US Job Market Flashes Warning Signs Last Seen During 2020 Pandemic appeared first on BeInCrypto.


Circle plans to launch its own version of wrapped Bitcoin on the Ethereum network to target institutional markets.
Summary
- Circle plans to launch cirBTC on Ethereum, a 1:1 bitcoin backed wrapped asset targeting institutional markets.
- Wrapped Bitcoin allows BTC to be used on networks like Ethereum, giving institutions access to decentralized finance applications.
In a Thursday announcement, stablecoin issuer Circle said it plans to introduce cirBTC, a token that is backed 1:1 by bitcoin and aimed at over-the-counter desks, market makers, lending protocols, and other institutional participants, framing the asset as a “highly secure and neutral version of wrapped BTC.”
Wrapping allows a native asset like Bitcoin to be tokenized and used across other blockchains. In this case, wrapped Bitcoin lets BTC be brought onto networks such as Ethereum, which gives users access to decentralized finance applications.
The token will also launch on Circle’s layer-1 blockchain Arc and integrate with the Circle Mint platform.
Circle joins a growing list of participants that have introduced wrapped Bitcoin as demand for decentralized finance continues to expand among institutional users.
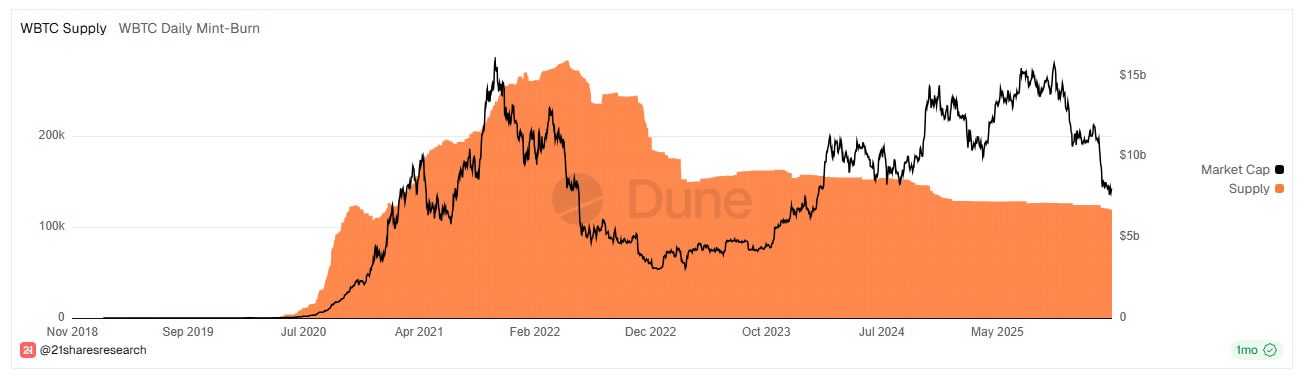
The sector is currently led by BitGo’s Wrapped Bitcoin, which currently holds a market capitalization of about $8 billion.
Coinbase also launched its own version, Coinbase Wrapped Bitcoin (cbBTC), in September 2024, which has since grown rapidly to reach a market capitalization of $5.9 billion. Last year, Coinbase launched Wrapped ADA (cbADA) on the Base blockchain to facilitate cross-chain liquidity.
Meanwhile, several other exchanges have released their own wrapped assets, including Kraken Wrapped BTC (kBTC), Binance Wrapped BTC (BBTC), Bitget Wrapped BTC (BGBTC), and OKX Wrapped BTC (okBTC), among others. These offerings are often paired with proof-of-reserve transparency to assure institutional traders that the underlying assets are held in secure, 1:1 custody.
Japanese Gen Z stands out as the most scam-conscious generation when it comes to crypto. A new survey of 1,486 people across Japan found that younger users are far more alert to fraudulent pitches on social media than their older peers.
The gap between generations reveals that Japan’s crypto trust problem is not uniform — it varies by age and online habits.
Gen Z Watches for Scams, Boomers Struggle With Basics
The survey, conducted by Tokyo-based consulting firm Clabo in February 2026, asked respondents why they view crypto as suspicious. The top answer overall was “I don’t understand how it works,” chosen by 23.3% of respondents. Price swings came second at 21.1%, followed by fraud concerns at 19.2%.
But generational breakdowns tell a different story. Gen Z respondents flagged social media scams as their primary worry. They encounter fake giveaways and shady promotions on platforms they use daily. Older cohorts, including Japan’s bubble generation, pointed instead to the complexity of blockchain technology itself.

Millennials showed the highest rate of actual crypto investment among all age groups. They also reported the most active information-seeking behavior.
Across all groups, half of the respondents said they had never invested in crypto. Only 33.7% said they currently hold digital assets. Another 15.7% said they once invested but have since stopped.
YouTube Leads for Investment Decisions
When it comes to where people get crypto news, traditional news sites ranked first at 38.4%. Social media followed at 36.7%, with YouTube at 31.6%. But for actual investment decisions, YouTube jumped to first place at 27%.
The survey suggests that Japan’s crypto industry still faces a basic education gap. Clabo, which offers wallet recovery and security consulting, recommended more accessible educational content tailored to each generation’s specific concerns.
The post Japanese Gen Z Fears Crypto Scams More Than Any Other Generation appeared first on BeInCrypto.
Stablecoin issuer Circle said it plans to launch its own version of a wrapped Bitcoin, which would put it against incumbents Coinbase and BitGo as it targets institutional users.
The asset, called cirBTC and announced on Thursday, is set to launch on Ethereum, backed 1:1 by bitcoin (BTC) and aimed at over-the-counter desks, market makers and lending protocols.
Circle said the asset is designed to provide institutions with a “highly secure and neutral version of wrapped BTC.”
Financial institutions, which have become significant buyers of Bitcoin, have been actively exploring decentralized finance. Wrapped versions of Bitcoin would allow the asset to be used on other chains, such as Ethereum, giving them access to DeFi.
In addition to Ethereum, the new asset will also launch on Circle’s layer-1 blockchain Arc and its Circle Mint platform, said Circle.
Cointelegraph contacted Circle for further details, but did not receive an immediate response.
Circle joins race led by Coinbase and BitGo
Circle’s new wrapped Bitcoin joins a market currently led by BitGo’s Wrapped Bitcoin (WBTC) and Coinbase Wrapped Bitcoin (cbBTC).
Coinbase’s cbBTC was launched in September 2024 and has a current market capitalization of $5.9 billion and a current supply of 88,800 tokens.
BitGo’s wBTC is the dominant wrapped Bitcoin token, with a market capitalization of about $8 billion and 119,157 tokens in circulation. However, that figure is roughly half its November 2021 peak, when Bitcoin hit its cycle all-time high.
Related: WBTC expands to Hedera as Bitcoin liquidity flows into new DeFi rails

Crypto exchanges launched their own wrapped Bitcoin
Several crypto exchanges have launched variations of wrapped Bitcoin, including Kraken Wrapped BTC (KBTC), Gate Wrapped BTC (GTBTC), Binance Wrapped BTC (BBTC), Huobi BTC (HBTC) and OKX Wrapped BTC (XBTC), but their market caps are a fraction of the two leaders.
The total combined supply of wBTC and cbBTC stands at roughly 208,000 BTC, according to CoinGecko.
Stablecoin transaction volume surpassed the US Automated Clearing House network for the first time in February, a significant milestone for an asset class that has existed for less than 12 years.
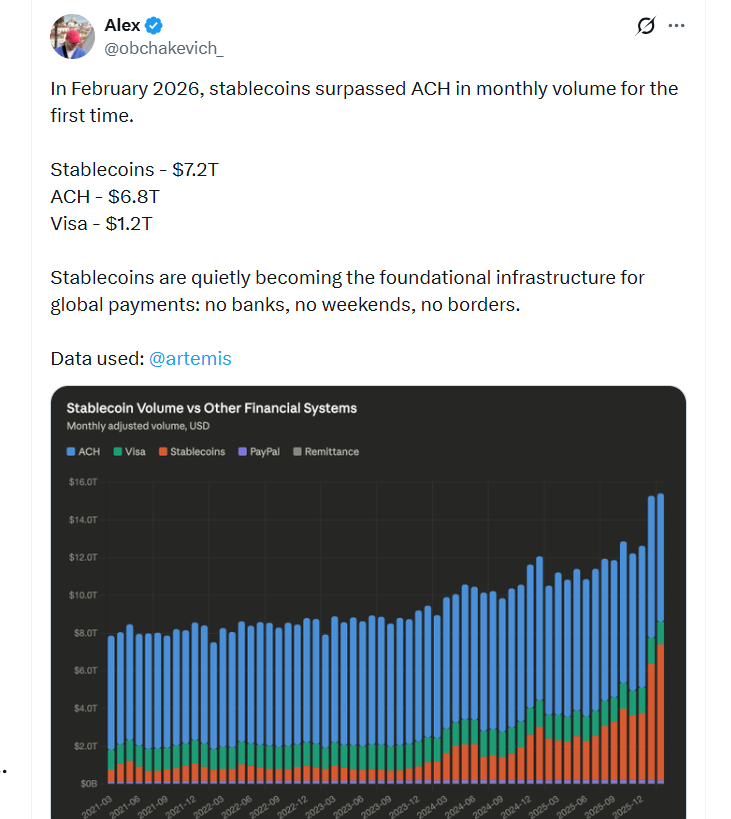
According to data from blockchain analytics platform Artemis, the total 30-day adjusted rolling stablecoin volume hit $7.2 trillion in February, beating the Automated Clearing House network at $6.8 trillion.
The data is based on 30-day rolling adjusted volume of stablecoin transactions in US dollars, excluding MEV activity and intra-centralized exchange transactions, comparing this to the daily average volume of other financial systems.
“Stablecoins are quietly becoming the foundational infrastructure for global payments: no banks, no weekends, no borders,” said analyst Alex Obchakevich in an X post on Friday.
Surpassing the ACH is significant, given that the network functions as the backbone of the US payments system. Data from Nacha, one of the primary forces governing the ACH alongside the Federal Reserve, indicates that the ACH network processes about 93% of salary payments in the US.

The data also shows that stablecoin market volumes have consistently grown over the past few years relative to the other major financial systems, such as Visa and PayPal.
Artemis data for March show that stablecoin volume continued to hit new highs, notching $7.5 trillion for the month and matching the ACH over that 30-day period.
Stablecoin supply continues to surge
Meanwhile, in the first quarter of 2026, total stablecoin supply hit $315 billion, increasing by $8 billion from the first quarter of 2025, according to data from CEX.IO.
Stablecoins also accounted for 75% of total crypto trading volume in the quarter, marking the highest levels on record, Cointelegraph previously reported.
Related: US Treasury seeks public input for state-level stablecoin regulations
An important catalyst for stablecoins has been the growing adoption by institutions amid a warming regulatory climate in the US.
Analysts from major traditional finance institutions such as Standard Chartered have tipped the total stablecoin market cap to hit $2 trillion by 2028, which would mark an increase of over 530% from current levels.
In a post on Tuesday, Frank Chapparo, the content head at trading firm GSR, argued that banks or fintech firms are “toast” if they ignore the explosive growth of the sector.
“The signals are everywhere,” he said, pointing to the total supply growing from less than $30 billion in 2020 to over $300 billion since then. Chapparo highlighted the GENIUS Act as a key piece of regulation that has unlocked institutional adoption.
Magazine: AI agents will kill the web as we know it: Animoca’s Yat Siu
The International Monetary Fund said tokenization has the potential to remove friction and boost transparency in finance, but warned that the technology could also create challenges that affect financial stability.
“The net effect of tokenization on financial stability is uncertain,” the IMF said in a 23-page report on Thursday, stating that “atomic settlement and enhanced transparency reduce some traditional risks, but speed and automation introduce new ones.”

More than $27.6 billion worth of real-world assets, minus stablecoins, is currently tokenized onchain, data from RWA.xyz shows. Boston Consulting Group estimated in 2022 that the tokenization market could rise to $16 trillion by 2030, while McKinsey & Co in 2024 predicted a more conservative $2 trillion over the same time frame.
The IMF acknowledged that tokenization expands how securities and other financial products are issued, traded, settled and managed but said it shifts risks from the banking system to shared ledgers and smart contract code.
“Stress events in tokenized markets are likely to unfold faster than in traditional systems, leaving less time for discretionary intervention.”
The agency also said tokenization offers opportunities in emerging markets, such as faster cross-border payments and financial inclusion but added that it “raises the risk of volatile capital flows, rapid currency substitution, and erosion of monetary sovereignty.”
Wall Street advocates for tokenization
Blockchain tokenization has been pushed by Wall Street leaders such as BlackRock CEO Larry Fink, who is among those seeking to tokenize everything from stocks and bonds to money market funds and real estate.
The biggest RWA project by total value locked is Securitize — the tokenization platform behind the BlackRock USD Institutional Digital Liquidity Fund — at $3.38 billion, according to CryptoDep, citing data from April 1.
Tether Gold and Ondo Finance are close behind at $3.35 billion and $3.21 billion, respectively.

The New York Stock Exchange’s parent, Intercontinental Exchange, is also taking action, announcing in January that it would launch a tokenization platform for 24/7 trading and instant settlement of stocks and exchange-traded funds with a blockchain post-trade system.
Related: Liquidity, not novelty, determines tokenization’s value
However, the IMF said legal challenges present another obstacle, stating that without legal clarity over ownership records and settlement finality, tokenized markets risk being “fragmented and peripheral.”
The crypto industry has been developing solutions to address this problem, such as the Ethereum ecosystem’s ERC-3643 permissioned token standard, which ensures that only certain investors have access to tokenized products.
Coinbase Asset Management launched tokenized shares for the Coinbase Bitcoin Yield Fund on Ethereum layer 2 Base on March 20, with the help of financial services firm Apex Group, which implemented the ERC-3643 standard to ensure that token holder identity and eligibility were checked for compliance.
Magazine: Big Questions: Can Bitcoin save you from the dreaded Cantillon Effect?
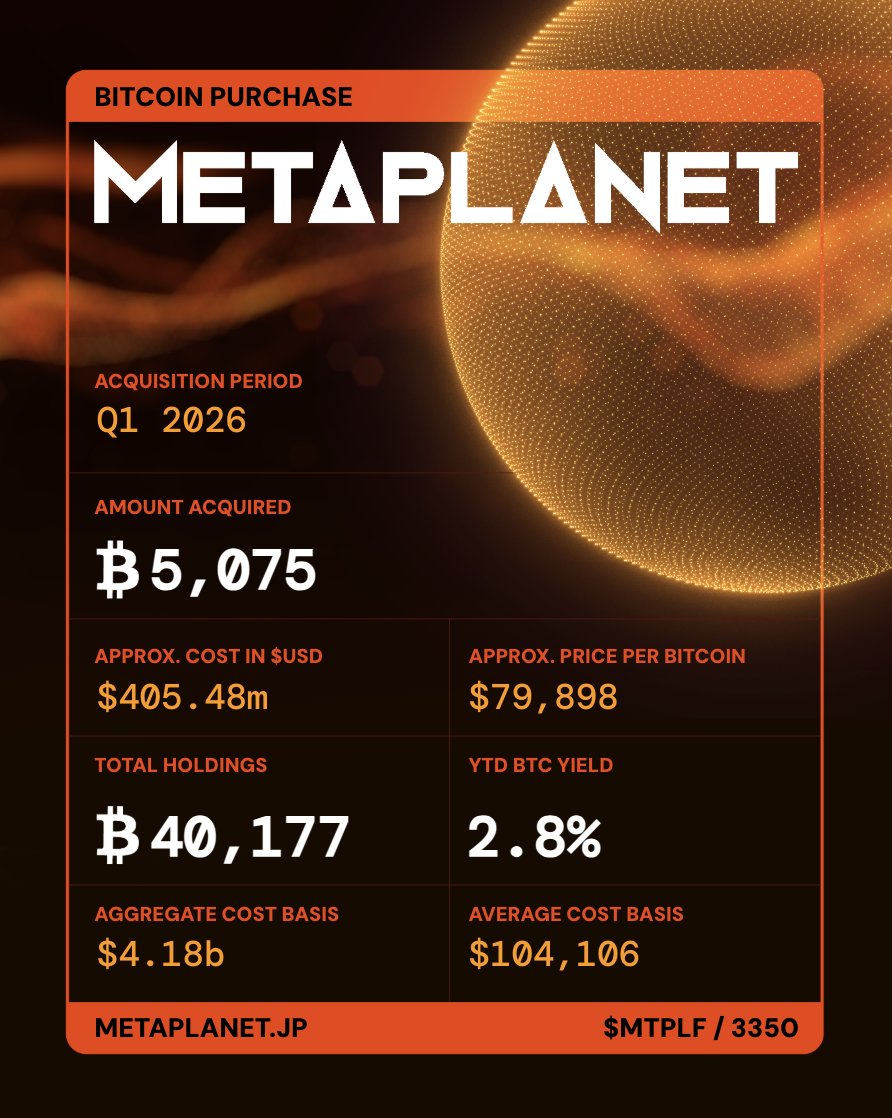
Metaplanet said it acquired 5,075 Bitcoin during the first quarter of 2026 for around $405 million or about $79,898 per coin, making the company the third-largest publicly-listed Bitcoin treasury, according to Bitcoin Treasuries data.
The Tokyo-listed company now holds a total of 40,177 Bitcoin (BTC) on its balance sheet, with an aggregate cost basis of roughly $4.18 billion and an average cost of $104,106 per coin, according to investor materials shared by chief executive Simon Gerovich.
Metaplanet also reported a year-to-date BTC Yield of 2.8% for 2026, a company metric that tracks growth in Bitcoin holdings on a per-share basis rather than income generated across the treasury.
The company separately announced first-quarter fiscal 2026 operating revenue of 2.97 billion Japanese yen (about $18.6 million) from its Bitcoin Income Generation business, which uses collateral-secured Bitcoin option strategies within a dedicated portfolio that is segregated from its long-term BTC stash.
That compares with full-year fiscal 2025 revenue of roughly $53.7 million from the same segment, taking trailing 12-month revenue to around $71.5 million, according to an April 2 filing.
The filings show Metaplanet is pursuing a two-track Bitcoin strategy by expanding its long-term treasury while using a ring-fenced options business to generate revenue that can later be recycled into additional Bitcoin purchases.

Capital strategy and market reaction
Capital from the income generation can be rolled into long-term Bitcoin holdings after option cycles conclude, allowing Metaplanet to convert derivatives revenue into additional BTC over time, the filing states.
Related: Twenty One Capital now 2nd-largest publicly traded BTC holder after MARA sale
The company left its consolidated revenue and operating profit forecast for the year ending Dec. 31, 2026, unchanged from guidance issued on Jan. 26, 2026. Metaplanet shares traded lower on Thursday, at $302 per share, down 1.95% from $308 at yesterday’s close, even after the announcement, according to data from Yahoo! Finance.

In the broader Bitcoin treasury space, fellow holding company Nakamoto disclosed Wednesday that it sold 284 BTC for $20 million in March and exited a large part of its Metaplanet stake at a loss in the first quarter, reflecting how listed Bitcoin vehicles remain highly sensitive to price swings and capital market conditions.
Magazine: Bitcoin may take 7 years to upgrade to post-quantum — BIP-360 co-author
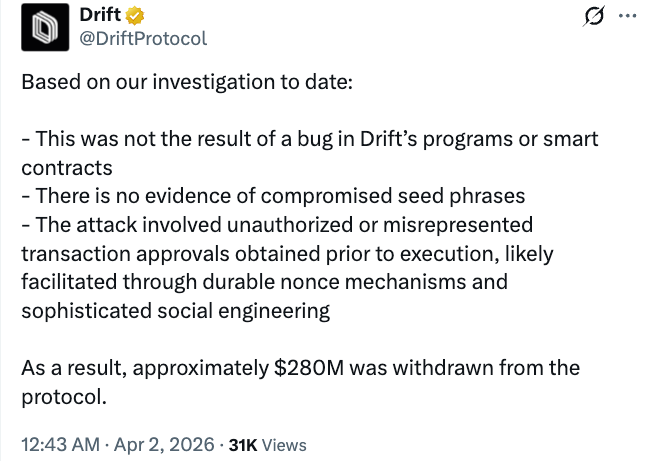
Drift Protocol, a Solana-based decentralized exchange (DEX), confirmed Thursday it was targeted in a roughly $280 million exploit, describing it as a “highly sophisticated operation.”
The platform took to X on to share its findings from a preliminary investigation, saying that the attackers exploited Solana’s durable nonces, a mechanism enabling pre-signed transactions, to seize control and drain funds. The protocol had earlier said it was experiencing an active attack and suspended deposits and withdrawals while coordinating with security firms, bridges and exchanges.
The attack began on Wednesday, with the theft involving multiple assets, including Circle’s USDC (USDC) and various altcoins. Onchain data later showed that the exploiter swapped the majority of assets into USDC, with the funds later bridged to Ethereum.
The incident has attracted scrutiny not only because it appears to involve abuse of a legitimate Solana transaction feature rather than a plain smart contract failure, but also for how funds moved across chains for hours without being frozen, raising questions about intervention by centralized stablecoin issuers.

What is Solana’s durable nonce feature?
Solana’s durable nonces are a unique feature allowing transactions to bypass certain expiration windows and enabling users to pre-sign transactions for future execution, offline signing, or complex multisig workflows.
Drift said the attacker used durable nonce-based, pre-signed transactions to gain unauthorized administrative access and execute malicious actions quickly after submission.

Durable nonces have not been widely associated with major exploits on their own, but developers have noted that features enabling delayed execution can introduce complexity and potential risks if misused or combined with other vulnerabilities.
Questions over Circle’s response
The incident has sparked criticism of the USDC issuer Circle, as the attacker took hours to swap $270 million to the stablecoin before bridging to Ethereum.
Onchain sleuth ZachXBT and others said the company had at least six hours to freeze funds but did not act, contrasting the response with previous cases where wallets were blacklisted.

Some industry figures pointed to the gap between Circle’s ability to freeze funds and any obligation to do so.
“Circle could freeze it. But they’re not required to,” pseudonymous user Molu wrote on X, adding that proposed regulatory frameworks such as the GENIUS Act could change that dynamic by requiring intervention under finalized rules.
Related: Balancer Labs shuts down 4 months after $100M+ exploit, protocol to continue
The incident marks yet another case in the ongoing debate over intervention by centralized platforms during attacks, with ZachXBT repeatedly criticizing Circle over the issue.
The investigator previously questioned Circle’s response to USDC tied to a Bybit-related hack in late February, prompting a response from Circle CEO Jeremy Allaire, who said the company acts on law enforcement requests before freezing funds.
Magazine: Nobody knows if quantum secure cryptography will even work

Big Tech names have joined the Linux Foundation’s newly formed x402 Foundation to govern and standardize the x402 protocol for agentic AI payments that bridge crypto rails with fiat. The Linux Foundation announced the formation of the x402 Foundation on Thursday with Coinbase as a contributor, positioning the open standard as a neutral, nonprofit home for the evolving payments layer that AI agents could use to autonomously pay for API access, data, and digital services.
Among the founding members are Google, Microsoft, and Amazon Web Services, alongside traditional payments and tech players such as American Express, Mastercard, Visa, Cloudflare, Shopify, Stripe, Circle, Base, Polygon Labs, the Solana Foundation, Thirdweb, and KakaoPay. The coalition signals broad industry appetite for a unified approach to AI-enabled payments that can operate across both crypto and traditional financial rails.
Linux Foundation CEO Jim Zemlin framed the move around open protocols, saying that “the internet was built on open protocols” and arguing for an open-source governance approach to x402. Coinbase emphasized that situating the protocol under the Linux Foundation lends a neutral, nonprofit ecosystem that could attract more widespread support from tech firms and developers than a corporate-branded launch would.
Beyond the structural shift, the effort taps into a longer-running market thesis: AI agents could become some of the dominant users of blockchain payments. Coinbase CEO Brian Armstrong echoed a view shared by Circle CEO Jeremy Allaire that AI-driven on-chain activity could reach scale fast, with Allaire predicting billions of AI agents transacting on-chain within a few years. Former Binance CEO Changpeng Zhao has also suggested crypto could serve as the “native currency for AI agents,” handling tasks from ticket purchases to bill payments without credit cards.
x402 is described as an open payment standard designed to enable AI agents and web services to autonomously pay for API access, data, and digital services. The protocol’s goal is to create a seamless, programmable payment layer that can operate across both blockchain networks and fiat rails, enabling new automated service models at scale.
Key takeaways
- Founding coalition includes Google, Microsoft, AWS, AmEx, Mastercard, Visa, Cloudflare, Shopify, Stripe, Circle, Base, Polygon Labs, Solana Foundation, Thirdweb, KakaoPay, and Coinbase, with Linux Foundation hosting the initiative.
- The Linux Foundation’s stewardship aims to lend legitimacy and openness to x402, potentially broadening developer and enterprise participation beyond corporate sponsorships.
- Industry leaders frame AI agents as major future users of on-chain payments, with optimistic projections about billions of autonomous transactions in coming years.
- On-chain activity data shows a dramatic surge in x402 transactions last November, followed by a sharp drop through 2026, suggesting early enthusiasm outpaced durable, broad-based adoption.
Founding members and the mission behind x402
The launch of the x402 Foundation marks a concerted effort to govern an open standard that could standardize how AI agents access paid services, from APIs to data feeds. By bringing together technology giants and payments specialists, the project aims to reduce fragmentation and foster interoperable payment flows across multiple rails. The Linux Foundation’s role as a trusted steward is central to this strategy, offering governance, governance processes, and an established ecosystem for collaboration among developers, researchers, and enterprises.
Jim Zemlin, the Linux Foundation’s chief, underscored the rationale for openness: the internet’s early growth relied on shared protocols that anyone could build upon. His framing points to a broader industry belief that AI agents will require a universal, permissionable, and auditable payment layer to function across devices, platforms, and geographies. Coinbase’s stance reinforces the value of a neutral venue that can welcome a broader constituency of participants, from tech platforms to merchant networks and fintech providers.
The Linux Foundation as a neutral hub for open protocols
The decision to anchor x402 within the Linux Foundation reflects a longstanding industry preference for governance through an impartial organization rather than a single corporate entity. Such positioning could be critical as regulators, enterprises, and developers weigh the regulatory and operational implications of autonomous payments that operate at the intersection of crypto rails and fiat systems. Coinbase noted that a nonprofit home could improve collaboration, reduce friction for newcomers, and help scale adoption beyond a handful of early pilots.
AI agents and the future of on-chain commerce
At the heart of the x402 push is a belief that AI agents will soon be one of the principal drivers of on-chain payment activity. Armstrong’s comment—“There will be more AI agents transacting online than humans very soon”—aligns with a broader industry forecast, including Allaire’s earlier observation that billions of AI agents could transact on-chain in three to five years. Zhao’s remark about crypto as the “native currency for AI agents” suggests a future where autonomous software agents handle routine financial tasks—ranging from ticketing to bill payment—without human intervention or traditional card rails.
In practice, x402 would enable autonomous agents and web services to procure API access, data streams, and digital services via programmable payments. If widely adopted, this could accelerate the automation of many online workflows and introduce new monetization models for AI-enabled tools. Yet the path to broad adoption will depend on ecosystem incentives, proven security and reliability, and the ability to demonstrate cost efficiency at scale.
As AI agents move from concept to deployment, the question for investors and builders is where true value will accrue. Will open, interoperable payment standards like x402 unlock durable business models for AI-driven services, or will fragmentation persist as competing standards and gatekeepers emerge? The answer will hinge on concrete pilots, measurable ROI, and regulators’ evolving stance on programmable payments and data access across borders.
Signals from on-chain activity: a tale of initial hype and later cooling
For a sense of traction, data from Dune Analytics tracks weekly activity on the x402 protocol. After peaking in November with a weekly total around 13.7 million transactions, followed by 13.66 million in the next week, activity has since cooled significantly. Current weekly totals have fluctuated between roughly 29,000 and 1.1 million transactions, illustrating a stark drop from the early frenzy. The chart labeled “Weekly transactions via the x402 protocol since May 2025” shows the post-peak erosion in use, raising questions about what it will take to sustain momentum in the near term.
The numbers reflect a broader challenge facing new open standards: translating theoretical potential into durable, real-world usage. While the coalition’s membership signals strong strategic interest, the actual adoption curve for x402 will likely hinge on successful pilots, clear return on investment, and the establishment of practical payment flows for AI-enabled services at scale.
What to watch next
Observers should monitor how the x402 Foundation evolves its governance, onboarding of additional partners, and real-world pilots that demonstrate repeatable, scalable use cases. Key uncertainties include whether large enterprises will embed x402 into mission-critical AI workflows, how regulators will treat autonomous payments across crypto and fiat rails, and whether the ecosystem can sustain higher-frequency, low-latency transactions that AI agents require. As AI agents become more prevalent in API access and digital service consumption, the coming quarters will reveal whether x402 can translate early interest into durable, long-term adoption.


Bitcoin is trading choppily around $66,600, as the extended holiday weekend sidelines potential buyers and gives bears greater control over price action.
With CME futures and ETF flows set to pause over Good Friday, the market is heading into a liquidity gap just as its most reliable source of support is already weakening.
Bitcoin’s $65,000 support is starting to look fragile as the market’s most active buyers turn out to be its most macro-dependent. In a recent report, CryptoQuant data show 30-day apparent demand at about -63,000 BTC, even as ETF and corporate purchases climb to multi-month highs, while Singapore-based market maker Enflux told CoinDesk in a note that the price floor is “partly underwritten by rate-cut expectations.”
ETF purchases rose to roughly 50,000 BTC over the past 30 days, the highest since October 2025, while Strategy accumulated about 44,000 BTC over the same period. Yet overall demand remained negative, with selling from other participants overwhelming those inflows.
The pressure is most visible among large holders, CryptoQuant wrote in a recent report. Wallets holding 1,000 to 10,000 BTC have flipped to net distribution, with their one-year balance change dropping to about negative 188,000 BTC from a positive 200,000 BTC at the 2024 cycle peak. Mid-sized holders have also slowed accumulation sharply, while the Coinbase Premium has remained negative, signaling weak U.S. spot demand.
The result is a market where rising institutional activity does not translate into stronger price support. As more capital shifts toward ETF wrappers and regulated futures markets, bitcoin is increasingly priced through macro-sensitive positioning such as hedging and allocation shifts rather than broad-based spot accumulation.
That positioning is now being tested by inflation data, Enflux wrote. The ISM prices-paid index jumped to 78.3 in March, its highest since June 2022, undermining expectations for near-term rate cuts. Enflux said the repricing has already begun to show up in flows, with $296 million in net ETF outflows during the week of March 24 and muted inflows in early April.
The long weekend removes a key stabilizer. With CME closed and ETF creation and redemption paused, the institutional bid that has increasingly anchored bitcoin’s price will be largely absent, leaving trading to spot markets where selling pressure has been most persistent.
CryptoQuant said any relief rally could face resistance between roughly $71,500 and $81,200, levels that have capped prior rebounds in the current bear-market structure.
The broader test comes with U.S. inflation data on April 9. If March core PCE exceeds February’s 3.1%, rate-cut expectations could fade further, strengthening bearish case in bitcoin.

IF YOU HOLD XRP ONDO & XLM YOU BETTER SEE THIS (HUGE MOVES MADE)

North East chippy food hygiene ratings for Good Friday

Knot Offshore Partners LP Common: Focus On The Expected Recovery


-

 NewsBeat6 days ago
The Story hosts event on Durham’s historic registers
-

 NewsBeat11 hours ago
Steven Gerrard disagrees with Gary Neville over ‘shock’ Chelsea and Arsenal claim | Football
-

 Sports6 days ago
Sweet Sixteen Game Thread: Tide vs Michigan
-
Entertainment4 days ago
Fans slam 'heartbreaking' Barbie Dream Fest convention debacle with 'cardboard cutout' experience
-
 Entertainment5 days ago
Lana Del Rey Celebrates Her Husband’s 51st Birthday In New Post
-
Crypto World3 days ago
Dems press CFTC, ethics board on prediction-market insider trades
-

 Crypto World1 day ago
Gold Price Prediction: Worst Month in 17 Years fo Save Haven Rock
-

 Tech4 days ago
The Pixel 10a doesn’t have a camera bump, and it’s great
-

 Sports3 days ago
Tallest college basketball player ever, standing at 7-foot-9, entering transfer portal
-

 Tech3 days ago
EE TV is using AI to help you find something to watch
-

 Business5 hours ago
No Jackpot Winner and $194 Million Prize Rolls Over
-

 Fashion5 days ago
Amazon Sundays: Soft Spring Layers
-

 Business1 day ago
Login and Checkout Issues Spark Merchant Frustration
-

 Tech3 days ago
How to back up your iPhone & iPad to your Mac before something goes wrong
-

 Tech4 days ago
Apple will hide your email address from apps and websites, but not cops
-

 Politics3 days ago
Should Trump Be Scared Strait?
-

 Crypto World3 days ago
U.S. rule change may open trillions in 401(k) funds to crypto
-

 Tech3 days ago
Flipsnack and the shift toward motion-first business content with living visuals
-

 Tech4 days ago
Avatar Legends: The Fighting Game comes out in July and it looks pretty slick
-

 Tech5 days ago
Elon Musk’s last co-founder reportedly leaves xAI
You must be logged in to post a comment Login