
Crypto World
Bitcoin price could crash further, Standard Chartered slashes target
The Bitcoin price has already crashed by nearly 50% from its all-time high, and a top long-term bull believes there is more downside to come in the near term.
Summary
- Bitcoin price has slumped from the all-time high to $66,000.
- Standard Chartered warned that the coin may drop to $50k.
- Technical analysis suggests that the coin may fall before rebounding.
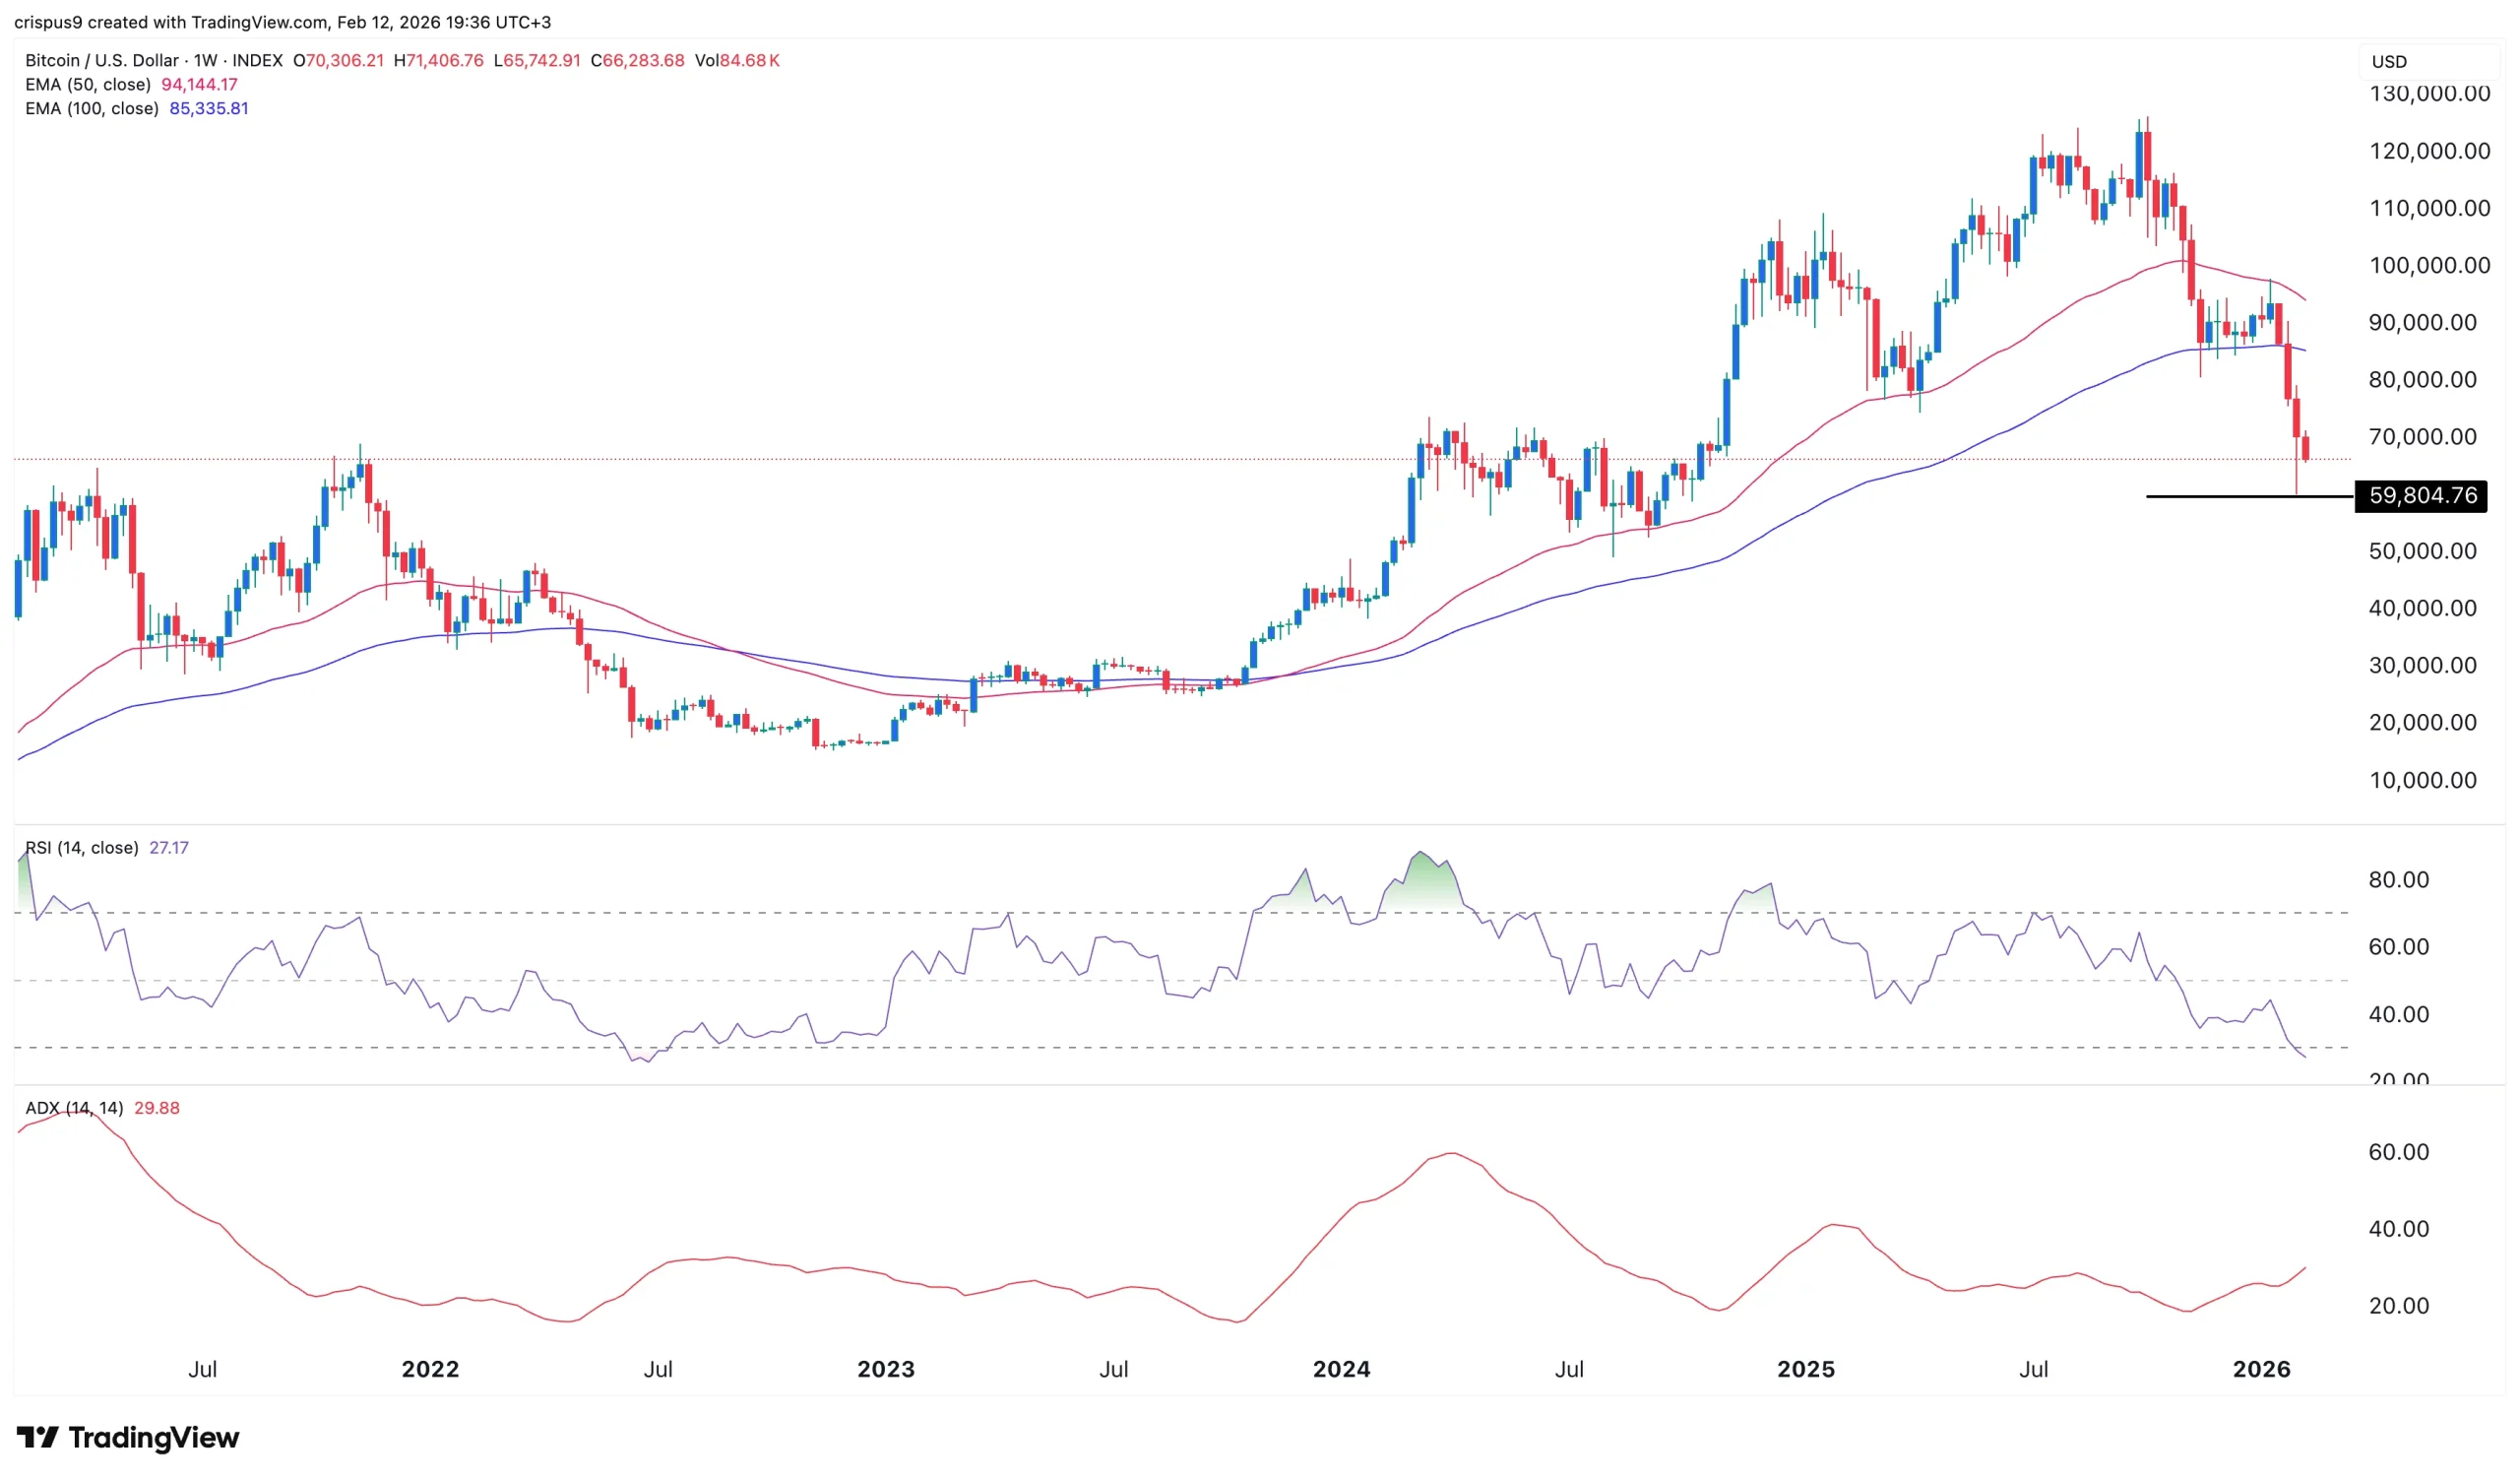
Bitcoin (BTC) retreated to $66,000 on Thursday, a few points above the year-to-date low of $60,000. This decline has persisted as its divergence from American stocks has widened, with leading indices such as the Dow Jones and the Nasdaq 100 hovering near their record highs.
Bitcoin’s price may have further downside in the near term, according to Standard Chartered, which warned that the coin may crash to $50,000.
The bank then lowered its Bitcoin price target for the year to $100,000, down from its previous estimate of $150,000. It was the second major downgrade as the bank had previously set the target price to $300,000.
Geoffrey Kendrick, the bank’s head of digital assets, predicts there will be more capitulation in the coming months. At the same time, he pointed to the ongoing Bitcoin ETF outflows, plunging futures open interest, and lack of a clear narrative.
“I think we are going to see more pain and a final capitulation period for digital asset prices in the next few months. The macro backdrop is unlikely to provide support until we near [Kevin] Warsh taking over at the Fed,” Kendrick told The Block. “On the downside I think this will see BTC to $50,000 or just below, ETH to $1,400.”
SoSoValue data shows that spot Bitcoin ETFs have shed over $282 million in assets this month. They have lost close to $6 billion in the last four months, a sign that investors are capitulating, with some moving their cash to the booming stock market.
Meanwhile, the futures open interest has tumbled to $44 billion from last year’s high of $96 billion. Falling open interest is a sign that investors are reducing their exposure to Bitcoin.
Bitcoin price technical analysis
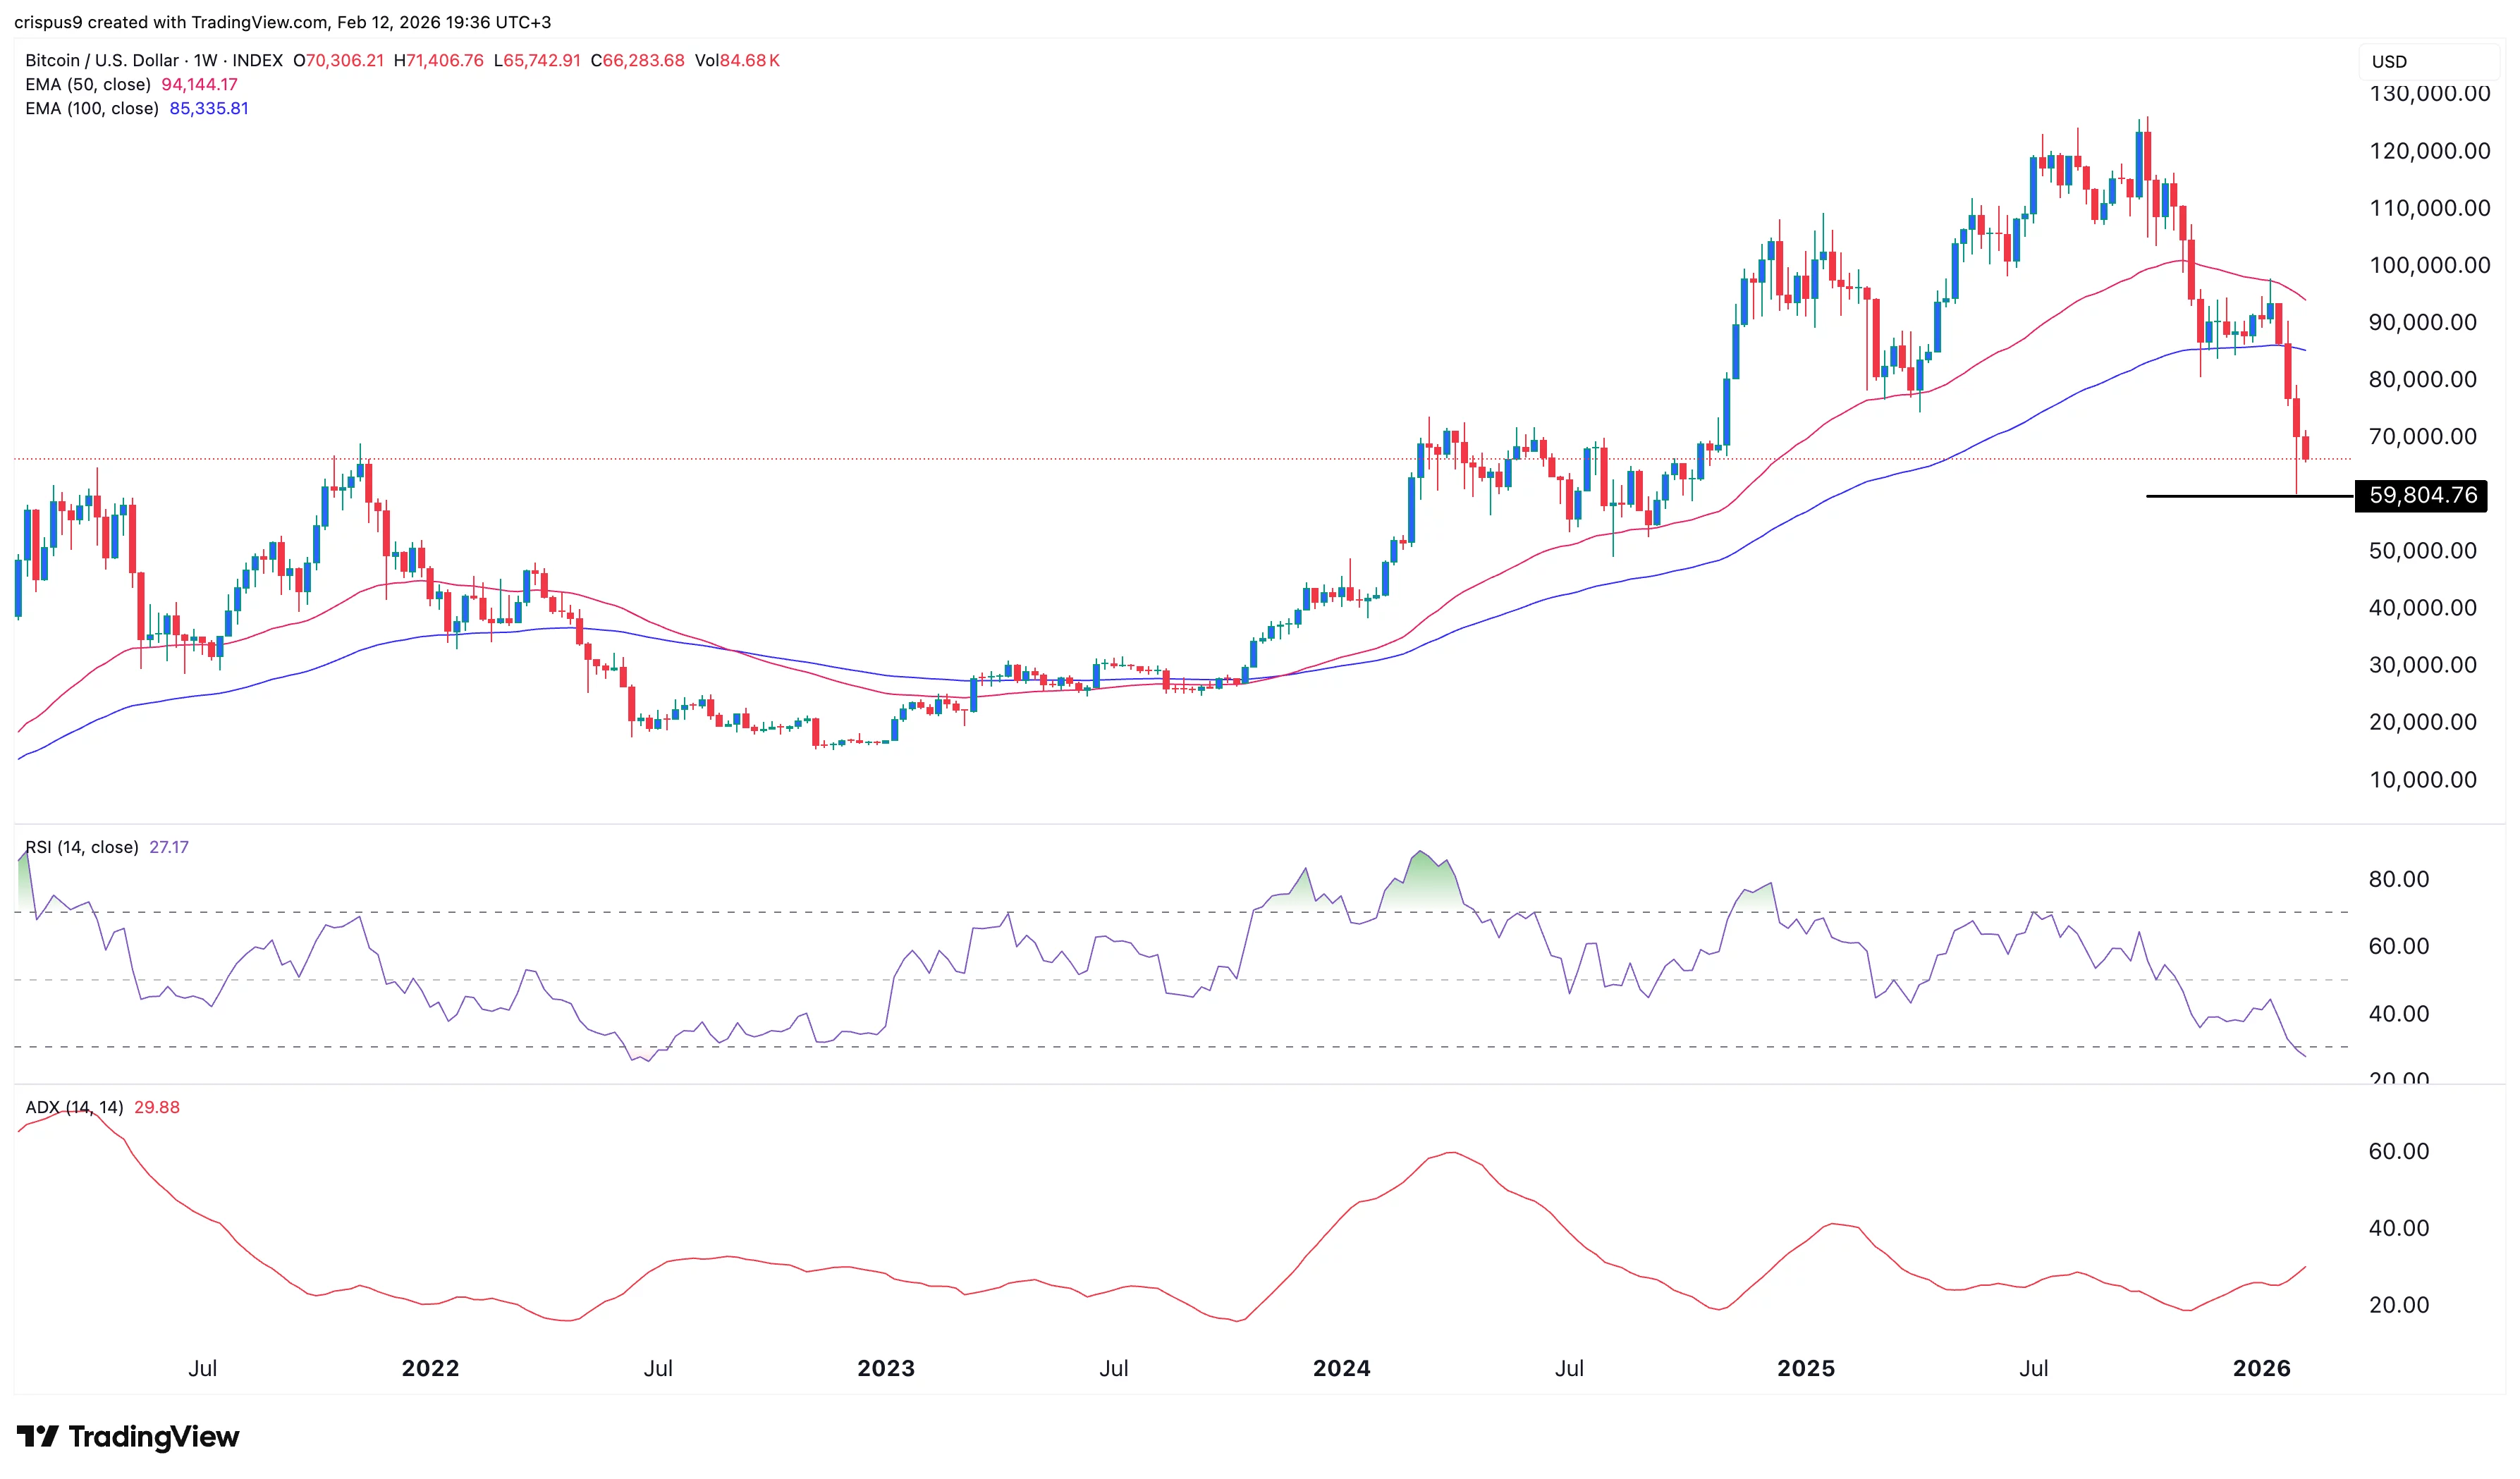
The weekly chart shows that the BTC price has declined over the past few months and is now hovering near its lowest point of the year. It has already dropped below the 50-week and 100-week Exponential Moving Averages. Also, the Average Directional Index has jumped to 30, a sign that the downtrend is strengthening.
Therefore, the most likely outlook is bearish, with the initial target being at $60,000. A drop below that level will signal further downside to $50,000, as Standard Chartered predicts.

Michael Saylor’s Strategy (MSTR) looks set to restart its Bitcoin (BTC) accumulation engine after a short pause, with its STRC preferred stock likely funding fresh crypto purchases this week.
Key takeaways:
-
Strategy may purchase at least $76.25 million in Bitcoin this week.
-
Combined with a technical setup, Bitcoin may rise to $80,000 in April.
Strategy may buy at least 1,111 BTC this week
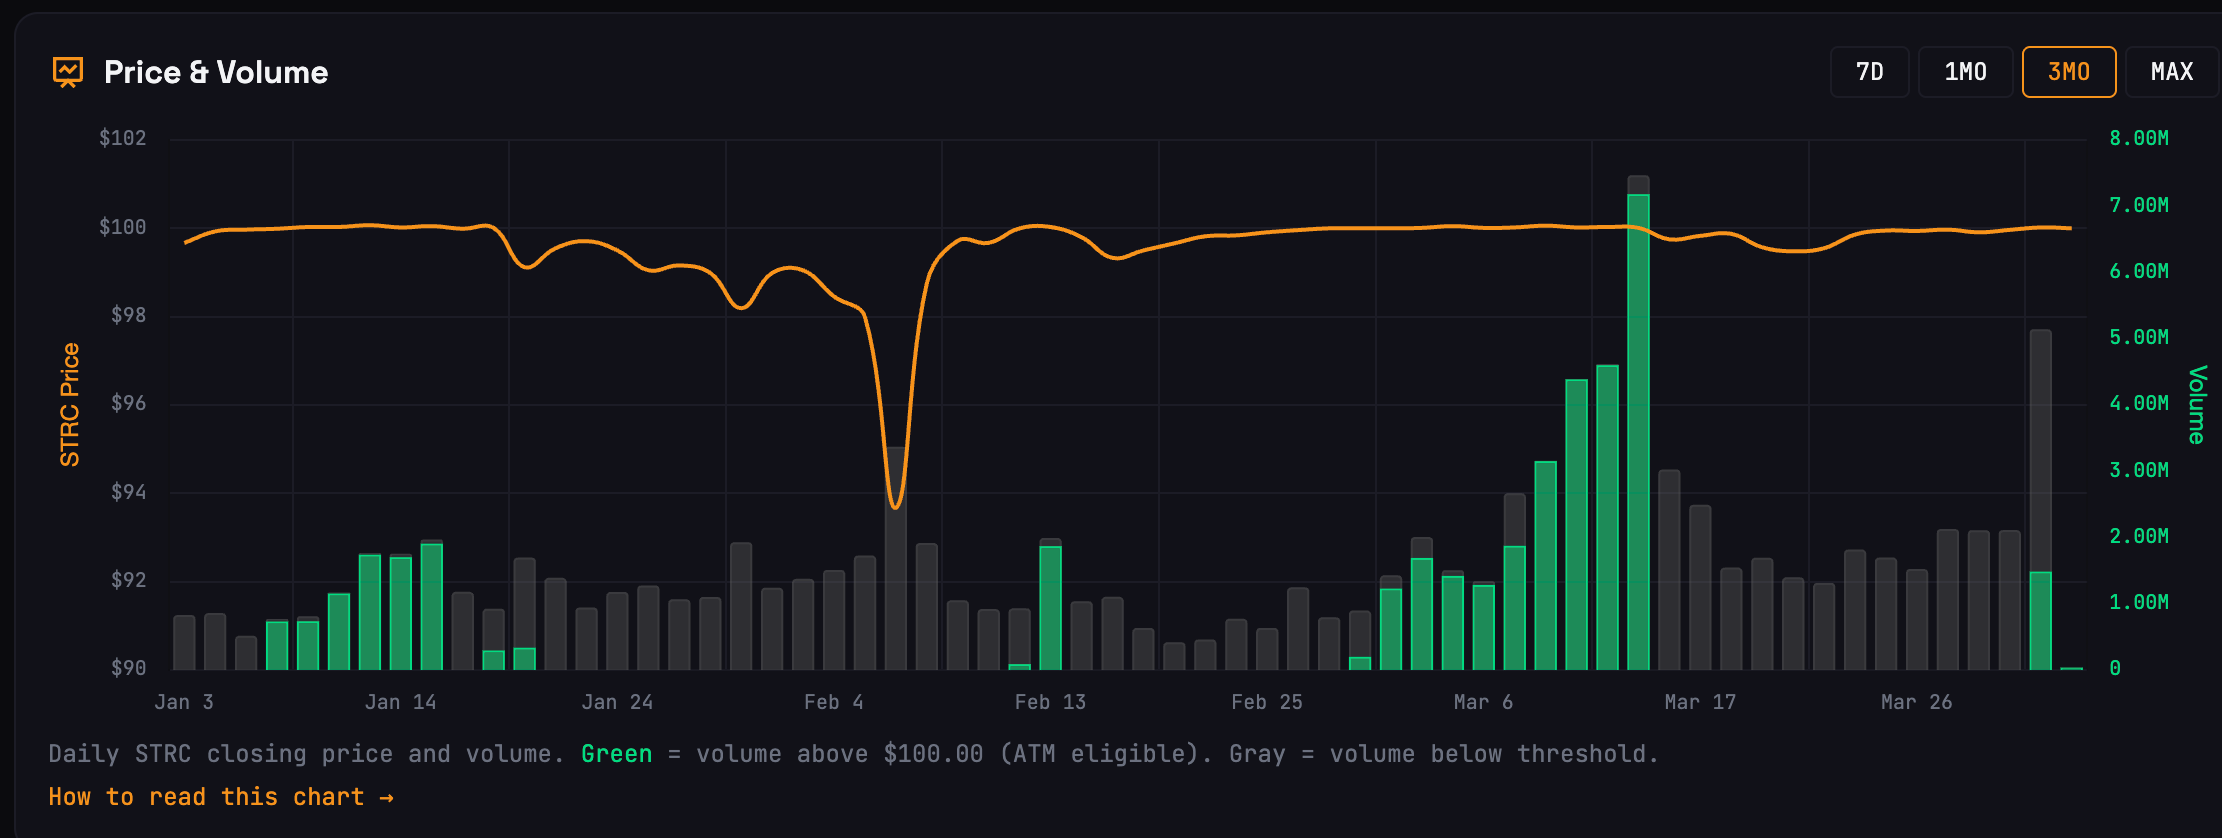
On Tuesday, STRC closed at $100.02, just above its $100 par value. Trading at or above par gives Strategy room to issue new shares, raise fresh capital and deploy the proceeds into Bitcoin.

Estimates from STRC.LIVE suggest Strategy had raised enough by Tuesday’s close to fund the purchase of more than 1,085 BTC, with the weekly total rising to over 1,111 BTC. That is equivalent to around $76.25 million.

This is a shift from the previous week, when STRC traded mostly below par and generated no estimated BTC purchases.
As of late March, the company held 762,099 BTC at an average acquisition price of about $75,694, according to its latest filings.
BTC rebounds as Strategy’s buying window reopens
The renewed buying window has coincided with a bounce in Bitcoin prices.
Since Tuesday, BTC/USD has climbed more than 5%, briefly reaching nearly $69,300. The move mirrors earlier gains seen during periods when Strategy was actively raising capital through STRC to buy Bitcoin.

One example came in the week ending March 15, when Bitcoin rose more than 10% despite weak broader risk sentiment. Over the same period, Strategy purchased 22,337 BTC worth about $1.57 billion.
The opposite dynamic emerged afterward. Bitcoin fell 14.55% over the next two weeks, roughly aligning with Strategy’s pause in purchases as STRC slipped below its $100 par value.
On March 23, Strategy unveiled a $44.1 billion capital-raising capacity to buy more Bitcoin via the sales of STRC and other preferred stocks, indicating that it would remain a meaningful source of Bitcoin demand in the coming months.
Stretch Dividend Rate maintained at 11.50% for April 2026. $STRC pic.twitter.com/8Jl0QlfNhK
— Michael Saylor (@saylor) April 1, 2026
Bitcoin eyes $80K after bouncing from flag support
From a technical standpoint, Bitcoin’s rebound began after it retested the lower boundary of its prevailing bear flag pattern as support.
BTC could advance toward the flag’s upper trendline near $80,000 in April if the recovery gains further traction, particularly if boosted by renewed Strategy buying and signs of easing Iran war tensions.

The $80,000 upside target also aligns with the 50-period exponential moving average on the three-day chart, making the area a key near-term resistance zone.
Related: Bitcoin ETFs post $1.3B in March inflows, first monthly gain of 2026
Conversely, Bitcoin risks losing the flag’s lower trendline support and confirming the pattern’s typical bearish breakdown if those supportive catalysts fade.
In that scenario, the measured downside target would come in near the $49,000–$50,000 zone. That aligns with the downside projections shared by multiple analysts in the past.
This article is produced in accordance with Cointelegraph’s Editorial Policy and is intended for informational purposes only. It does not constitute investment advice or recommendations. All investments and trades carry risk; readers are encouraged to conduct independent research before making any decisions. Cointelegraph makes no guarantees regarding the accuracy or completeness of the information presented, including forward-looking statements, and will not be liable for any loss or damage arising from reliance on this content.
Global asset manager Franklin Templeton is set to expand its crypto footprint by acquiring a spinoff of the crypto-native investment firm CoinFund.
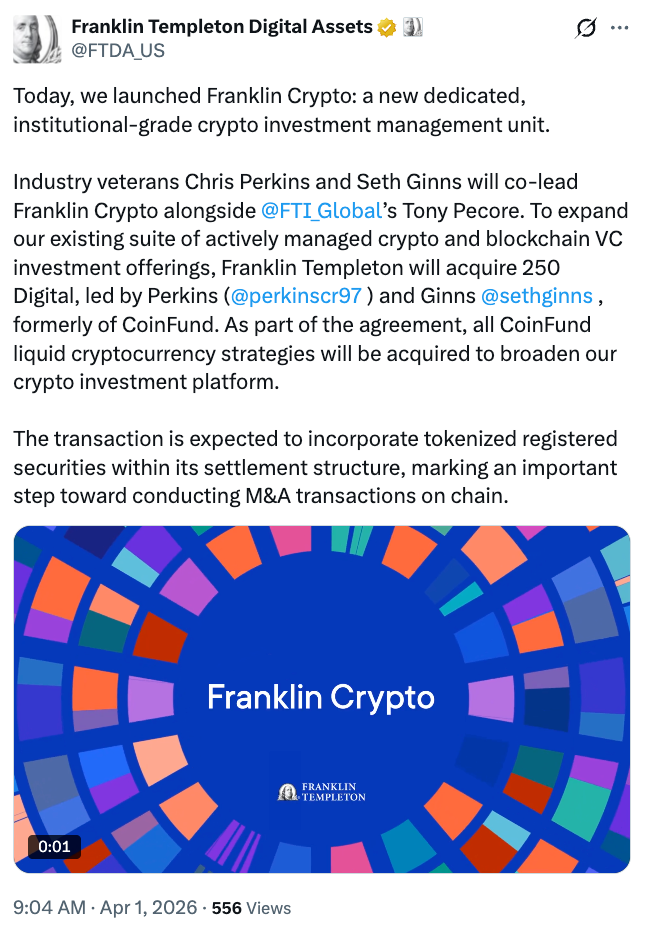
Franklin Templeton said Wednesday it plans to acquire 250 Digital, a CoinFund spinoff that runs liquid crypto investment strategies, expanding the asset manager’s digital asset business. The deal will form part of a new unit called Franklin Crypto once it closes.
The move follows CoinFund’s decision earlier this year to spin out its liquid strategies business into 250 Digital as the company sharpened its focus on venture investing.
Christopher Perkins will lead the new Franklin Crypto, and Seth Ginns will serve as chief investment officer alongside Franklin Templeton digital assets veteran Tony Pecore, as the company broadens its crypto investment platform for institutional clients.
The deal will incorporate BENJI tokens, which represent ownership shares in the Franklin OnChain US Government Money Fund (FOBXX), a regulated money market fund tokenized by Franklin Templeton in 2021.
Acquisition involves all liquid strategies previously run by CoinFund
Franklin said the undisclosed transaction includes the 250 Digital investment team and all liquid cryptocurrency strategies previously run by CoinFund, and that it will also invest in those strategies as part of the agreement.
The transaction is expected to close in the second quarter of 2026, subject to the execution of definitive transaction agreements, client consents and other customary closing conditions.

Franklin Templeton’s digital asset arm manages around $1.8 billion in assets and is a major institutional player in the crypto industry, where it has been building a presence since 2018.
The company is known for being one of the first to launch a US-listed spot Bitcoin ETF alongside other major asset managers such as BlackRock in 2024.
Related: Franklin Templeton, Ondo to launch tokenized ETFs with 24/7 trading via crypto wallets
The acquisition comes during a prolonged slump in the crypto market, with Bitcoin down around 45% from its peak above $126,000 recorded in October 2025.
However, Franklin Templeton says the environment is attracting talent and creating opportunities to build long-term infrastructure.
Franklin’s head of innovation, Sandy Kaul, told The Wall Street Journal the recent market selloff helped create an opening to expand.
“This big selloff that we had in the crypto markets is creating a very unique opportunity that really made us all decide that this is the right time to pull the trigger,” Kaul said.


Ripple has added digital asset capabilities to its treasury management platform, allowing corporate finance teams to hold, track and manage cryptocurrencies and fiat balances within a single system, the company said.
According to a company announcement, the update introduces Digital Asset Accounts and a unified dashboard that aggregates balances across bank accounts, custody providers and onchain wallets, giving treasury teams real-time visibility into both cash and digital assets.
The system supports assets including XRP (XRP) and Ripple USD (RLUSD), with balances updated in real time and recorded alongside fiat transactions. APIs connect external custodians and sync activity into the platform, according to Ripple.
Ripple said the update embeds digital asset functionality directly into its treasury system, rather than requiring separate crypto platforms. The company said this could reduce reliance on manual reconciliation and fragmented reporting across banking and custody systems.
Mark Johnson, chief product officer at Ripple, told Cointelegraph the shift is about making digital assets “a core part of treasury operations,” allowing companies to manage them alongside traditional balances while enabling use cases such as stablecoin settlement and yield on idle cash.
The launch follows Ripple’s October acquisition of GTreasury for $1 billion. The company said the product is already live for customers in beta ahead of a broader rollout, with availability varying by jurisdiction depending on regulatory requirements and geography.
Related: Ripple CEO says stablecoins could be crypto’s ‘ChatGPT moment’ for businesses
Digital assets move into financial infrastructure
A survey published by Ripple in March found that 72% of more than 1,000 global finance leaders believe companies must offer digital asset solutions to remain competitive, reflecting growing focus on custody, security and infrastructure.
The findings point to a broader shift from adoption to integration, as institutions look to incorporate these assets into existing financial systems rather than manage them separately.
That transition is driving increased activity across financial infrastructure. In July, Visa expanded its settlement platform to support additional stablecoins and blockchain networks, building on its initial use of USDC (USDC) for settlement in 2021.
Banks have also begun integrating tokenized money into their operations. In November, JPMorgan expanded access to its JPM Coin deposit token, allowing institutional clients to move funds on blockchain networks for real-time settlement.
Similar efforts are emerging in credit and capital markets. In October, Securitize and BNY said they would collaborate to bring instruments such as collateralized loan obligations onchain.
Magazine: XRP yet to ‘price in’ 3 bullish catalysts, Bitcoin to $80K? Trade Secrets
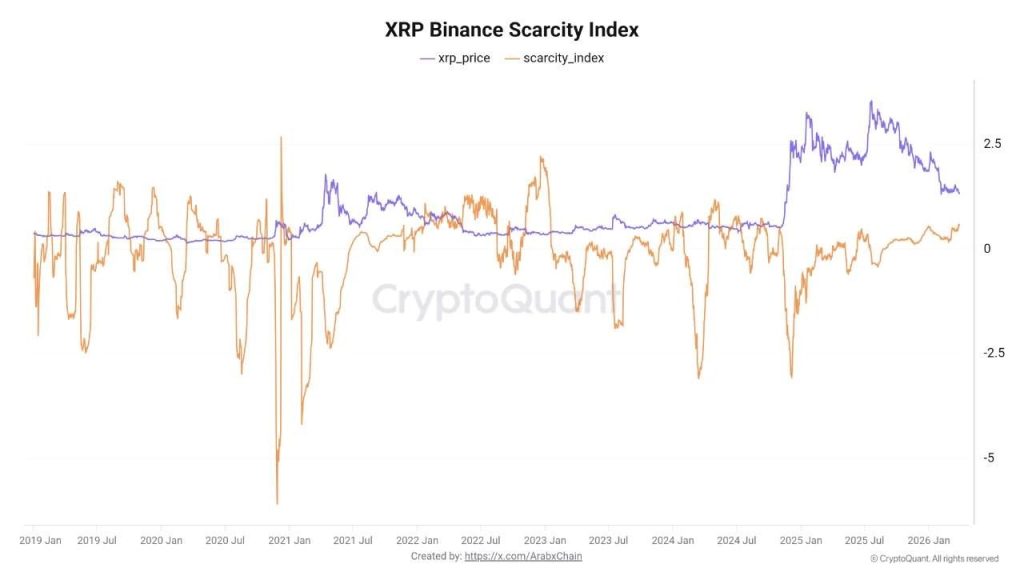
XRP crypto is trading at $1.32, and while the price chart looks fragile, the on-chain data underneath it is telling a different story.
Chain’s scarcity indicator for XRP on Binance has hit 0.59 – its highest reading since 2024 – as coins leave exchanges at a pace that is mechanically compressing the available sell-side pool.
The magnitude is not subtle. On March 10 alone, approximately $738 million worth of XRP was withdrawn from major platforms in a single 24-hour window, described by analysts as one of the most substantial single-day net outflows recorded year-to-date.

February saw 7.03 billion XRP exit centralized exchanges entirely, with Binance accounting for roughly 3.38 billion of that volume. The supply mechanics are shifting – but the price hasn’t fully priced it in yet.
Discover: The best pre-launch token sales
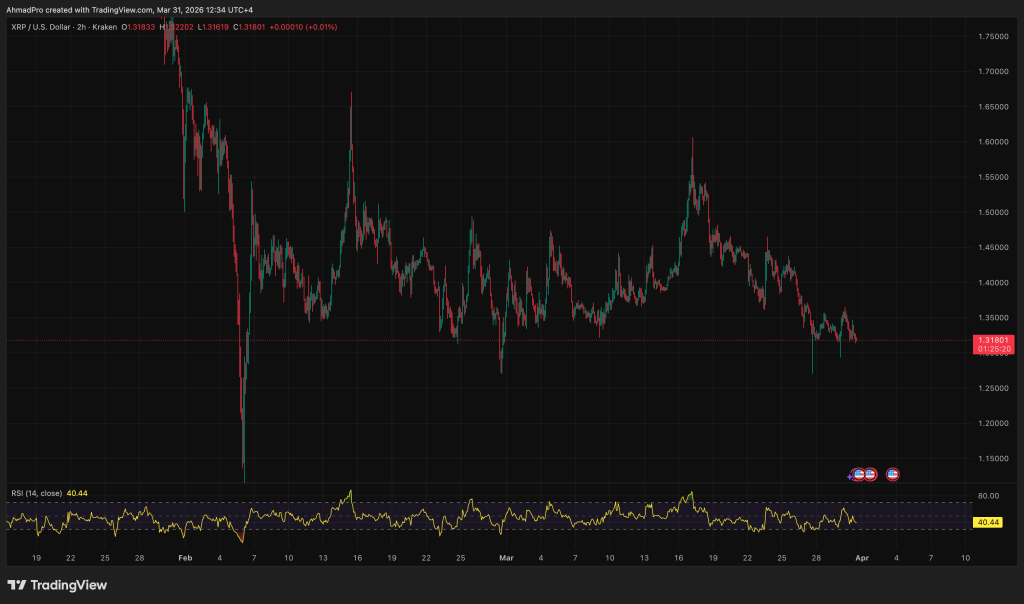
XRP Crypto Price Prediction: Can $1.40 Hold as Exchange Balances Drop?
XRP is pressing against the $1.40 resistance zone that analysts have flagged as the critical battleground. Below it, the $1.27–$1.30 band represents the next meaningful support cluster.
The RSI on the daily is hovering near 42 – not oversold, but not generating momentum signals either. The 50-day EMA sits just above spot price, capping intraday recovery attempts.
The on-chain divergence is the real tension here. Whale wallets accumulated approximately 40 million XRP in March even as US-listed XRP spot ETFs – now holding a combined $1.02 billion in assets – recorded $30.12 million in net outflows over the same period.
CoinShares data puts global XRP fund outflows at $130 million for the month. Institutional selling and whale buying are colliding directly at $1.40.
On the chart, $1.27 is the line that really matters, because as long as price holds above it, the accumulation story stays intact, especially with whales stepping in and ETF flows starting to stabilize, which could open the door for a push through $1.40 and a move higher if momentum follows.
But right now it is more of a tug of war, with XRP likely chopping between $1.27 and $1.40 while the market figures itself out, because you have strong accumulation on one side and lingering sell pressure on the other, and neither has fully taken control yet.
If that $1.27 level breaks clean with volume, the whole setup starts to fall apart fast and opens the door for a deeper pullback, because at that point price is no longer respecting the accumulation zone, and that always takes priority over any on chain signal.
What makes this cycle different is the institutional layer, with players like Bitwise holding massive chunks of XRP through ETF products, meaning even small outflows can hit the order book hard, while Ripple keeps building out its infrastructure in the background, which is exactly the kind of long term story bigger players tend to front run.
Explore: Best crypto assets to diversify your portfolio
The post XRP Crypto Holders Pull Coins Off Exchanges, On-Chain Data Signals Supply Shock appeared first on Cryptonews.


Pearl is Olas’s consumer gateway to a future where narrow AI agents quietly trade, curate and create prediction markets at a scale humans will never touch, says co‑founder David Minarsch.
Summary
- Olas co‑founder David Minarsch traces Pearl back to early agent work at Fetch.ai and Valory, then pivots from B2B DAO tools to a consumer app for owning AI agents.
- Pearl backs tightly scoped, long‑running agents like Polystrat, which filters Polymarket markets, applies prediction tools and has at times outperformed human traders by 2–3x.
- Minarsch sees prediction markets as economic training grounds for AI, with agents already a large share of activity and the long tail of markets increasingly served by machines, under real regulation.
David Minarsch sat down with crypto.news on March 31 on the sidelines of ETHCC to explain why Pearl’s narrow, long‑running AI agents are remaking prediction markets from the inside out.
From Fetch.ai to Pearl
Minarsch’s route into autonomous agents is textbook crypto‑AI convergence. “I got drawn into the space by my background in economics and game theory,” he told crypto.news, recalling his move into crypto after several years working on machine learning applications.
At Fetch.ai, where he spent two years, his team built one of the first agent frameworks in crypto, anchored on a simple but loaded idea: wallets controlled by machines, not humans.
“We actually wrote a detailed paper on this, which was way ahead of its time,” he adds. In 2021, he spun those lessons out into Valory, the core lab behind Olas, which has since experimented with a range of applications and go‑to‑market strategies.
The first bet was B2B: autonomous agents sold to DAOs such as CowSwap, Balancer and Ceramic. “That went okay but never sort of really took off,” Minarsch concedes. The real pivot came in 2023, when “general purpose usable large language models like ChatGPT” landed and Olas “switched more to B2C.” Pearl is the result: “a B2C application which has different agents in it,” built for users, not governance forums.
By the time Pearl launched in February 2025, the rest of the industry had caught up to Olas’s early agent thesis. “The crypto space and the AI space had moved towards agents, now everyone is building agents or using agents or both,” Minarsch says. But he argues most people’s idea of an agent is still shaped by chat interfaces like ChatGPT: “a co‑pilot synchronous experience” where you prompt and it replies, in front of you, in real time.
Olas is explicitly betting against that dominant pattern. “When you have long long‑running agents with like autonomy but tightly scoped so they can’t just do anything but they can do interesting things within a certain scope. That’s where it becomes very interesting,” he says. Pearl is designed around those tightly scoped, background processes rather than generalist assistants, Minarsch points out.
“With Pearl we intentionally go very narrow in terms of the capabilities of an agent,” he explains. He points to new tools like OpenClaw—as both validation and warning. “OpenClaw validated a lot of our core assumptions that people do want llocal first experiences with AI agents,” he says, but “the product can do too much, which causes a bunch of problems, including secruity, but also just a problem for the user.”
In his view, that kind of system is built for tinkerers “who just sort of want to mold this thing into something that’s useful to them.” The “low friction user” wants to “just press a button” and get a consistent result. “I have one and I asked it to send me daily report and half the time it’s broken,” he says of OpenClaw. “That’s not a good product experience.” Pearl’s agents, by contrast, are designed to do one thing—trading, yield seeking, market creation—reliably. Limited scope, high definition, low problem latency.
Polystrat is the cleanest demonstration of that philosophy. Polystrat is an example because here’s just the idea: provide some capital, have it trade in prediction markets,” Minarsch says. Instead of facing Polymarket’s UX—wallet setup, funding, market selection, position sizing—the user delegates funds to Polystrat and lets the agent do the work.
“Polystrat is just like a user of Polymarket,” he stresses. “If you want to use Polymarket you as a human need to set up a wallet, fund it and then you’re faced with the decision of what market to trade in. Polystrat abstracts all this and the idea is for it to simply trade on your behalf.” The agent focuses on geopolitical and political news markets, “not so short‑lived” and generally closing “within the next four to five days.”
Technically, the flow is simple but ruthless. The agent filters markets using rules like liquidity and time to close, then applies “prediction tools,” which Minarsch describes as “workflows that sit on top of models and data sources.” “There’s many different prediction tools and the agent learns over time which ones to take and which ones not to take,” depending on the market. A local pricing and sizing engine converts those predictions into positions and the system trades autonomously on your behalf.
Performance wise, Polystrat ranges between 56 and 69% accuracy, Minarsch says. As a fleet, “our agents… have performed two to three times as well as human traders,” although they are “not yet at a fleet‑wide break even.” Individual Polystrat instances, however, can deliver “up to 100% ROI overall and like several 100% ROI per individual trade.” The goal is not anecdotes but a statistical edge: “to have a Polystrat fleet on average a positive ROI.”
Trading is only half the story. As more agents enter Polymarket and its predecessors, Minarsch sees prediction markets becoming “early prototypes for these market‑driven AI systems… environments that encode truth discovery at an economic scale.”
He doesn’t pretend the rails are clean. On controversial questions—or markets with contested outcomes—information lags and disputed outcomes are common. Polystrat nor other agents on Pearl attempt to solve that. “Polystrat itself is just a trading agent on top of Polymarket,” it’s neither consensus building nor a truth serum.
But AI is already reshaping participation, creation and policing. “It’s unclear exactly how many traders in prediction markets are already AI agents but it’s probably more than 30%,” Minarsch believes. “Potentially already more than half,” he adds. As such, humans have limited attention, so “the whole long tail of prediction markets will basically be served to AI agents,” he predicts.
Crucially, Minarsch breaks from crypto libertarianism on governance. “We take the view that there should be regulation of prediction markets,” he says flatly, citing markets that “effectively look like assassination markets” or “incentivizing bad behaviors.” With “a certain degree of regulation or self‑regulation,” more markets and more AI participants should “drive prices to equilibrium” and “improve the information embedded in the markets,” opening the door to derivatives, hedging and other instruments built on top.
Asked whether Olas agents could become “data liquidity providers operating autonomously across multiple networks,” Minarsch shrugs off the distinction. “Liquidity provision is effectively also trading strategy,” he says.
In that framing, Pearl is less a single app and more an operating system for narrow, long‑running agents: Polystrat for prediction markets, Optimus for yield, Omenstrat for market creation and whatever comes next for liquidity across venues. The consistent design choice is scope: each agent does one thing, over long horizons, with as little human intervention as possible.
“We were just very early to something that a lot of people are now doing,” Minarsch says of the agent wave. The difference now is that Pearl is pushing those agents into retail‑facing products, turning prediction markets into both a playground and a proving ground for AI‑driven liquidity and truth discovery.
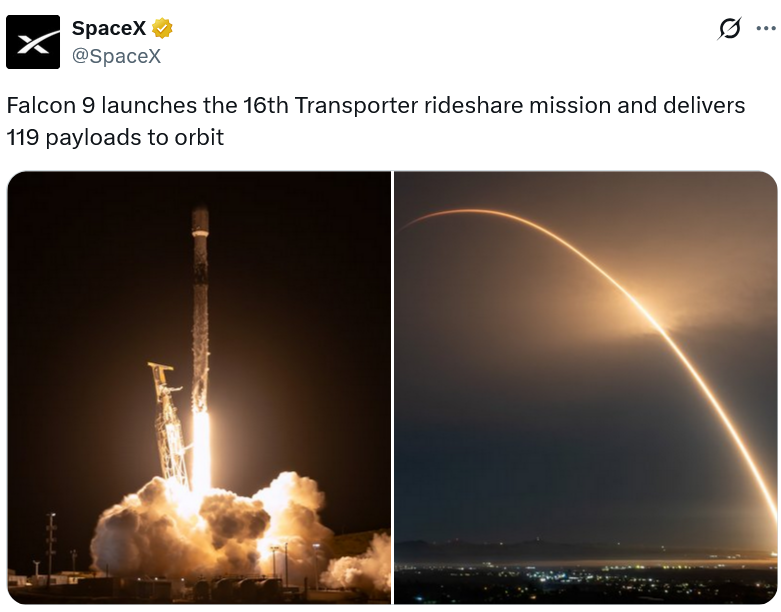
Elon Musk’s aerospace company SpaceX has reportedly filed confidentially for an initial public offering, moving it closer to what could be the biggest public listing in US history.
SpaceX submitted its IPO confidentially to the US Securities and Exchange Commission, according to a report from Bloomberg on Wednesday, citing people familiar with the matter. The IPO could be finalized as early as June, the sources said.
SpaceX could seek a valuation exceeding $1.75 trillion in the IPO, sources told Bloomberg in February. A valuation of that size would make the aerospace company more valuable than Meta (META), Tesla (TSLA) and Bitcoin (BTC).
SpaceX could also raise up to $75 billion from the IPO, a size that would more than double Saudi Aramco’s record $29 billion debut in 2019.

SpaceX’s potential IPO follows its acquisition of Musk’s AI startup xAI in early February, putting the company in an AI race against OpenAI, Anthropic and other private AI startups.
OpenAI, the creator of ChatGPT, closed its last funding round with $122 billion in committed capital on Tuesday, bumping its valuation to $852 billion.
IPO investors to be briefed on more details this month
SpaceX reportedly told prospective IPO investors to expect briefings from company executives later this month, Bloomberg noted.
SpaceX is weighing a dual-class share structure that would give insiders, including Musk, greater voting control.
The IPO is expected to allocate up to 30% of shares for individual investors.
Wall Street firms Bank of America, Goldman Sachs, JPMorgan Chase, Morgan Stanley and Citigroup are expected to be involved in SpaceX’s transition to a public company.
SpaceX also continues to hold 8,285 Bitcoin worth more than $565 million on its balance sheet.
However, the company shifted its Bitcoin to a new wallet address in October, prompting speculation over whether it intends to hold the cryptocurrency in the long term.
Related: OpenAI kills off AI video app Sora after 6 months
Trading platforms such as Robinhood and Kraken have been seeking to offer tokenized shares in high-profile private companies like SpaceX, OpenAI and others on the blockchain, giving retail investors a way to invest in nonpublic companies.
Robinhood CEO Vladimir Tenev said in February 2025 that investors have had limited access to these private tech firms, but that blockchain tokenization could help broaden participation.
However, OpenAI is expected to file for an IPO in 2026, and Anthropic is also exploring a public listing, which would make their shares available for trading on regular stock exchanges.
Magazine: IronClaw rivals OpenClaw, Olas launches bots for Polymarket — AI Eye


Opinion by: Francesco Mosterts, co-founder of Umia.
Crypto prides itself on being a market-driven system. Prices, incentives, and capital flows determine everything from token valuations to lending rates and blockspace demand. Markets are the industry’s primary coordination mechanism. Yet, when it comes to governance, crypto suddenly abandons markets altogether.
Recent governance disputes at major protocols have once again exposed the tensions inside DAO decision-making. Participation remains extremely low and influence is highly concentrated. A study of 50 DAOs found “a discernible pattern of low token holder engagement,” showing that a single large voter could sway 35% of outcomes and that four voters or fewer influence two-thirds of governance decisions.
This is not the decentralized future crypto originally set out to build. The early vision of the industry was to remove concentrated power and replace it with systems that distributed influence more fairly. Instead, DAO governance often leaves most tokenholders passive while a small group determines the protocol’s direction.
Token voting was crypto’s first attempt at decentralized governance. It is a broken incentive system, and it needs to change.
The promise of token governance
The original “DAO” launched in 2016 as a decentralized venture fund where token holders would vote on which projects to finance. The earliest DAOs were inspired by the idea that organizations could run purely through code.
At crypto’s conception, token voting felt intuitive. It borrowed from familiar concepts like shareholder voting, yet DAOs promised a new form of management called “decentralized governance.” Tokens would represent both ownership and decision rights, meaning anyone who held them could participate in shaping the direction of a protocol.
Related: ‘Raider’ investors are looting DAOs
Token voting was supposed to solve problems seen across many industries, including centralized control, opaque decision-making, and misalignment between teams and users. It offered a simple promise: if the community owned the token, the community would run the project. In practice, however, this miraculous solution hasn’t delivered on its promise.
The reality of why token voting fails
Token voting comes with three core problems: participation, whales, and incentives.
Participation is self-explanatory: most token holders don’t vote. With lots of material to review, particularly when many governance decisions need to be made, governance fatigue is a real problem. The result of this, which we now see every day in crypto, is that most token holders are ultimately passive and a small minority decides the outcomes.
When it comes to whales, it is obvious that large holders are dominating. It’s demoralizing for ordinary voters who feel like their opinions don’t matter, even though the original promise of DAOs was that they would have a real voice. What is the point of voting if whales have the final say?
Finally, there’s an incentive problem. Voting has no economic signal. Votes hold the same weight whether you’re informed or not. There’s no cost to being wrong and no incentive for being right. There’s nothing motivating participants to research and vote according to their beliefs.
Realistically, in current governance, voting simply expresses opinions. It does not express conviction.
The missing piece lies in pricing decisions
Crypto is fundamentally market-driven, and it works remarkably well. Markets aggregate information, price risk, and reveal conviction in ways few other systems can. The industry has built markets for practically everything, including tokens, derivatives, blockspace, and lending rates. They sit at the core of how crypto coordinates economic activity. Yet when it comes to governance, the system suddenly abandons markets entirely.
Decision markets introduce pricing into governance. Instead of merely voting on proposals, participants trade outcomes, pricing the possible decisions and backing their views with capital. This transforms governance from a system of expressed preferences into one of measurable conviction.
By tying decisions to economic incentives, participants are encouraged to research proposals and think carefully about outcomes. The result is a governance process that reflects informed expectations rather than passive opinion.
This matters now
Crypto is reaching a turning point in how it coordinates decisions. Governance conflicts, treasury disputes, and stalled proposals have exposed the limits of token voting. Even major protocols struggle to translate tokenholder input into clear, effective action. This has left governance slow, contentious, and dominated by a small group of participants.
At the same time, interest in market-based coordination is resurging across the ecosystem. Prediction markets have demonstrated how effectively markets can aggregate information, while broader discussions around mechanisms like futarchy are returning to the forefront. These systems highlight markets as powerful tools for revealing conviction and aligning incentives.
If crypto believes in markets as coordination engines, the next step is applying that same logic to governance. The next phase of crypto coordination will move beyond simply trading assets and toward pricing and executing decisions themselves.
Token voting was crypto’s first attempt at decentralized governance, and it was an important experiment. It gave tokenholders a voice, but it didn’t solve the deeper incentive problem.
Markets already power nearly every part of the crypto ecosystem. They aggregate information, reveal conviction, and align incentives at scale. Extending that same mechanism to decisions is the natural next step.
Decision markets also extend beyond governance votes into capital allocation itself. If markets can price decisions about a protocol’s direction, they can also price decisions about what to build and fund. This opens the door to a new generation of ventures built directly on crypto rails, where projects can raise capital and allocate resources through transparent, incentive-aligned mechanisms from day one. Instead of relying on passive token voting, markets can actively guide how onchain organizations form and grow.
Governance without pricing is incomplete. If crypto truly believes in markets as coordination engines, the future of onchain organizations cannot be decided by votes alone, but by markets.
Opinion by: Francesco Mosterts, co-founder of Umia.
This opinion article presents the author’s expert view, and it may not reflect the views of Cointelegraph.com. This content has undergone editorial review to ensure clarity and relevance. Cointelegraph remains committed to transparent reporting and upholding the highest standards of journalism. Readers are encouraged to conduct their own research before taking any actions related to the company.


Summary
- Gnosis, Zisk and the Ethereum Foundation unveiled the Ethereum Economic Zone (EEZ) at EthCC in Cannes to unify fragmented Ethereum layer-2 networks.
- The framework targets over 20 L2s securing roughly $40 billion in value, enabling synchronous composability without relying on bridges and standardizing ETH as gas.
- Early backers include Aave and Centrifuge, with developers calling EEZ a “new era” for on-chain applications as Ethereum grapples with slowing fee revenue and a weaker deflationary narrative.
The Ethereum (ETH) ecosystem took aim at one of its biggest structural weaknesses at EthCC 2026, as Gnosis, Zisk and the Ethereum Foundation publicly launched the Ethereum Economic Zone (EEZ), a rollup framework designed to knit together an increasingly fractured layer‑2 landscape. Revealed on March 29 at the Palais des Festivals in Cannes, the initiative seeks to make dozens of Ethereum L2s behave “like one unified system,” in the words of project backers, by restoring synchronous composability between rollups and Ethereum mainnet while keeping security anchored to the base chain.
Ethereum Economic Zone launches
More than 20 operational Ethereum L2s currently secure about $40 billion in assets, yet function largely as isolated ecosystems, each with its own liquidity pools, deployments and bridge infrastructure. “Ethereum doesn’t have a scaling problem. It has a fragmentation problem,” Gnosis co‑founder Friederike Ernst said in comments shared with crypto media, arguing that “every new L2 that goes live has its own liquidity pool and bridging, creating another isolated walled garden.” The EEZ framework instead allows smart contracts on participating rollups to perform synchronous calls with each other and with Ethereum mainnet in a single atomic transaction, using ETH as the default gas token and removing the need for separate bridge protocols.
At EthCC, Ernst and Zisk developer Jordi Baylina presented the EEZ as an explicitly Ethereum‑aligned answer to the user‑experience and capital‑efficiency frictions created by the network’s L2‑centric scaling roadmap. According to coverage from outlets such as The Block and CoinDesk, the collaboration is co‑funded by the Ethereum Foundation and launches with Aave, Centrifuge and a Swiss‑based EEZ Alliance among its early partners, underscoring that DeFi blue chips see value in shared liquidity and cross‑rollup settlement. “The zone will facilitate a new era of blockchain innovation,” Zisk’s CEO Maria Roberts told conference attendees, adding that developers will be able to plug existing applications into the framework “pretty easily.”
The timing is not accidental. Ethereum’s shift of activity toward cheaper L2s has reduced fee revenue on mainnet and softened the narrative of ether as a strongly deflationary asset, with ETH trading near $2,000 even as the network still secures roughly $53 billion in DeFi total value locked and about $163 billion in stablecoins, according to recent market data cited by Phemex. By unifying L2 liquidity and simplifying cross‑network flows, EEZ’s architects are betting that a more cohesive Ethereum stack can keep capital and users inside the ecosystem, even as competing smart contract platforms and modular architectures fight for market share.
Kaiko reports Alameda gap still existsIn separate reporting on EthCC, organizers have described 2026 as “the year of professionalisation of Ethereum and the wider crypto ecosystem,” with the conference’s move to Cannes and the launch of institutional‑focused forums like Kaiko’s Agora strengthening the sense that Ethereum’s next phase will be defined as much by market structure and infrastructure as by new token launches.

Michael Selig, US President Donald Trump’s nominee leading the Commodity Futures Trading Commission (CFTC), said the agency was prepared to oversee the entire $3 trillion crypto industry, with no timeline for Congress to pass a crucial market structure bill.
In a Wednesday statement about his first 100 days as CFTC chair, Selig said that the commission was “ready to take responsibility” for the crypto market and reiterated his claim that it was the sole regulator to oversee prediction markets.
His comments come as the US Senate considers the CLARITY Act, a crypto market structure bill that has been effectively stalled in committee amid discussions over stablecoin yield and other issues.
“The same regulatory clarity being delivered to the crypto industry is being developed for prediction markets, which can serve as powerful tools for information discovery and are regulated by the CFTC under the Commodity Exchange Act,” said Selig.
Under Selig, who was confirmed by the Senate in December, the CFTC has adopted many policies signaling that the agency would soften its enforcement and regulation of digital assets compared to previous administrations. In March, the agency announced a memorandum of understanding with the Securities and Exchange Commission (SEC) as part of efforts to coordinate on regulation, including digital assets.
Related: Crypto exchange KuCoin agrees to $500K settlement, ending CFTC case
Although early drafts of the market structure bill suggested the legislation could give the CFTC additional authority to oversee digital assets, the SEC is expected to continue regulating cryptocurrencies it considers to be securities.
Lawmakers pressing CFTC on insider trading claims over prediction markets
US state authorities and federal lawmakers have been targeting prediction market platforms like Kalshi and Polymarket over alleged violations of gaming laws and claims of politicians using insider information to profit.
While many of the state-level actions continue to be litigated in court, Selig has claimed that the CFTC has “exclusive jurisdiction” over prediction markets and threatened legal action against any challenges to its authority.
In a Tuesday event, CFTC enforcement director David Miller said that the agency’s position was that event contracts on prediction markets were not “gaming” but rather “swaps” that fall under its purview.
Some lawmakers have also proposed legislation to ban elected officials with insider information from profiting from event contracts after suspicious trades on military actions involving Iran and Venezuela.
Naoris Protocol has launched its mainnet, introducing a layer-1 blockchain designed to use post-quantum cryptography for transaction validation and network security. The network is live with limited, invite-only participation, allowing early users to run validator nodes and process transactions.
According to an announcement shared with Cointelegraph, it integrates cryptographic standards finalized by the National Institute of Standards and Technology (NIST) to address risks in existing blockchains, where current encryption methods could become vulnerable over time.
Before mainnet, the protocol’s test network processed more than 100 million transactions and identified hundreds of millions of potential threats, according to the project, with activity spanning millions of wallets and nodes.
The system uses a consensus model called distributed proof of security (dPoSec) to verify transactions across nodes, while the NAORIS token is intended to support network operations as the economic model develops.
The rollout begins with a restricted group of validators and partners, with broader access expected to expand in phases.
The project lists advisers with backgrounds in cybersecurity, government and enterprise technology, and is backed by investors including Draper Associates.
Related: Is $450B in Bitcoin vulnerable to the quantum threat? Analysts weigh in
New research suggests quantum computing may arrive sooner than expected
The launch comes as revised estimates for quantum computing, which uses qubits and quantum states to process information differently from classical computers, are driving efforts to move away from current cryptographic standards.
New research from Google released on Monday suggests quantum computers may need far fewer resources than previously thought to break blockchain encryption. The study found fewer than 500,000 physical qubits could crack systems securing Bitcoin (BTC) and Ether (ETH), a roughly 20-fold reduction from earlier estimates.
The findings point to a shorter timeline for quantum risk, with Justin Drake, a researcher at the Ethereum Foundation, estimating at least a 10% chance that a quantum computer could recover a private key by 2032.

Researchers at California Institute of Technology working with Oratomic reached similar conclusions, recently finding that improvements in error correction (which reduce the number of qubits needed to stabilize computations) could lower the requirements for practical systems to 10,000 to 20,000 qubits, down from earlier assumptions of millions.
Based on these reductions, the researchers said a viable quantum computer could emerge by around 2030.
Blockchain developers are beginning to respond. In January, developers in the Solana ecosystem introduced a quantum-resistant vault that uses hash-based signatures to generate new keys for each transaction, reducing the exposure of public keys.
On March 24, developers from the Ethereum Foundation launched a “Post-Quantum Ethereum” resource hub outlining plans to upgrade the network’s cryptography, targeting protocol-level changes by 2029 while also noting the multi-year complexity of such a transition.

UK firms hit by energy and supply shocks but confidence remains resilient

Will BTC Price Hit $80K?

DWP Universal Credit complaints rocket


-

 News Videos7 days ago
Parliament publishes latest register of MPs’ financial interests
-

 Business6 days ago
Instagram, YouTube Found Responsible for Teen’s Mental Health Struggle in Historic Ruling
-
 Tech6 days ago
Intercom’s new post-trained Fin Apex 1.0 beats GPT-5.4 and Claude Sonnet 4.6 at customer service resolutions
-

 NewsBeat5 days ago
The Story hosts event on Durham’s historic registers
-

 Sports5 days ago
Sweet Sixteen Game Thread: Tide vs Michigan
-
Entertainment2 days ago
Fans slam 'heartbreaking' Barbie Dream Fest convention debacle with 'cardboard cutout' experience
-
 Entertainment4 days ago
Lana Del Rey Celebrates Her Husband’s 51st Birthday In New Post
-
Crypto World2 days ago
Dems press CFTC, ethics board on prediction-market insider trades
-

 Tech3 days ago
The Pixel 10a doesn’t have a camera bump, and it’s great
-

 Crypto World4 hours ago
Gold Price Prediction: Worst Month in 17 Years fo Save Haven Rock
-

 Sports1 day ago
Tallest college basketball player ever, standing at 7-foot-9, entering transfer portal
-

 Tech2 days ago
EE TV is using AI to help you find something to watch
-

 Tech2 days ago
Apple will hide your email address from apps and websites, but not cops
-

 Entertainment7 days ago
HBO’s Harry Potter Series Will Definitely Fail For One Big Reason, And It’s Not J.K. Rowling Or Snape
-

 Tech2 days ago
How to back up your iPhone & iPad to your Mac before something goes wrong
-

 Tech2 days ago
Flipsnack and the shift toward motion-first business content with living visuals
-

 Fashion6 days ago
En Vogue in Brown Leather and Tailored Neutrals by Atelier Savoir, Styled by J Bolin
-

 Politics2 days ago
Should Trump Be Scared Strait?
-

 Crypto World2 days ago
U.S. rule change may open trillions in 401(k) funds to crypto
-

 Fashion5 days ago
Weekly News Update, 3.27.26 – Corporette.com
You must be logged in to post a comment Login