
Crypto World
Bitcoin Price Faces 40% Risk Despite Improving US Demand
The Bitcoin price has rebounded nearly 20% after slipping close to $60,000 on February 6. The move has revived “buy-the-dip” hopes and fueled talk of a local bottom. At the same time, US demand indicators have started to recover from recent lows.
But beneath the surface, volume signals, on-chain data, and price structure suggest the rally may be fragile. Several warning patterns now resemble setups that preceded major declines in this cycle.
Bear Flag Shows Big Money Is Not Fully Committed
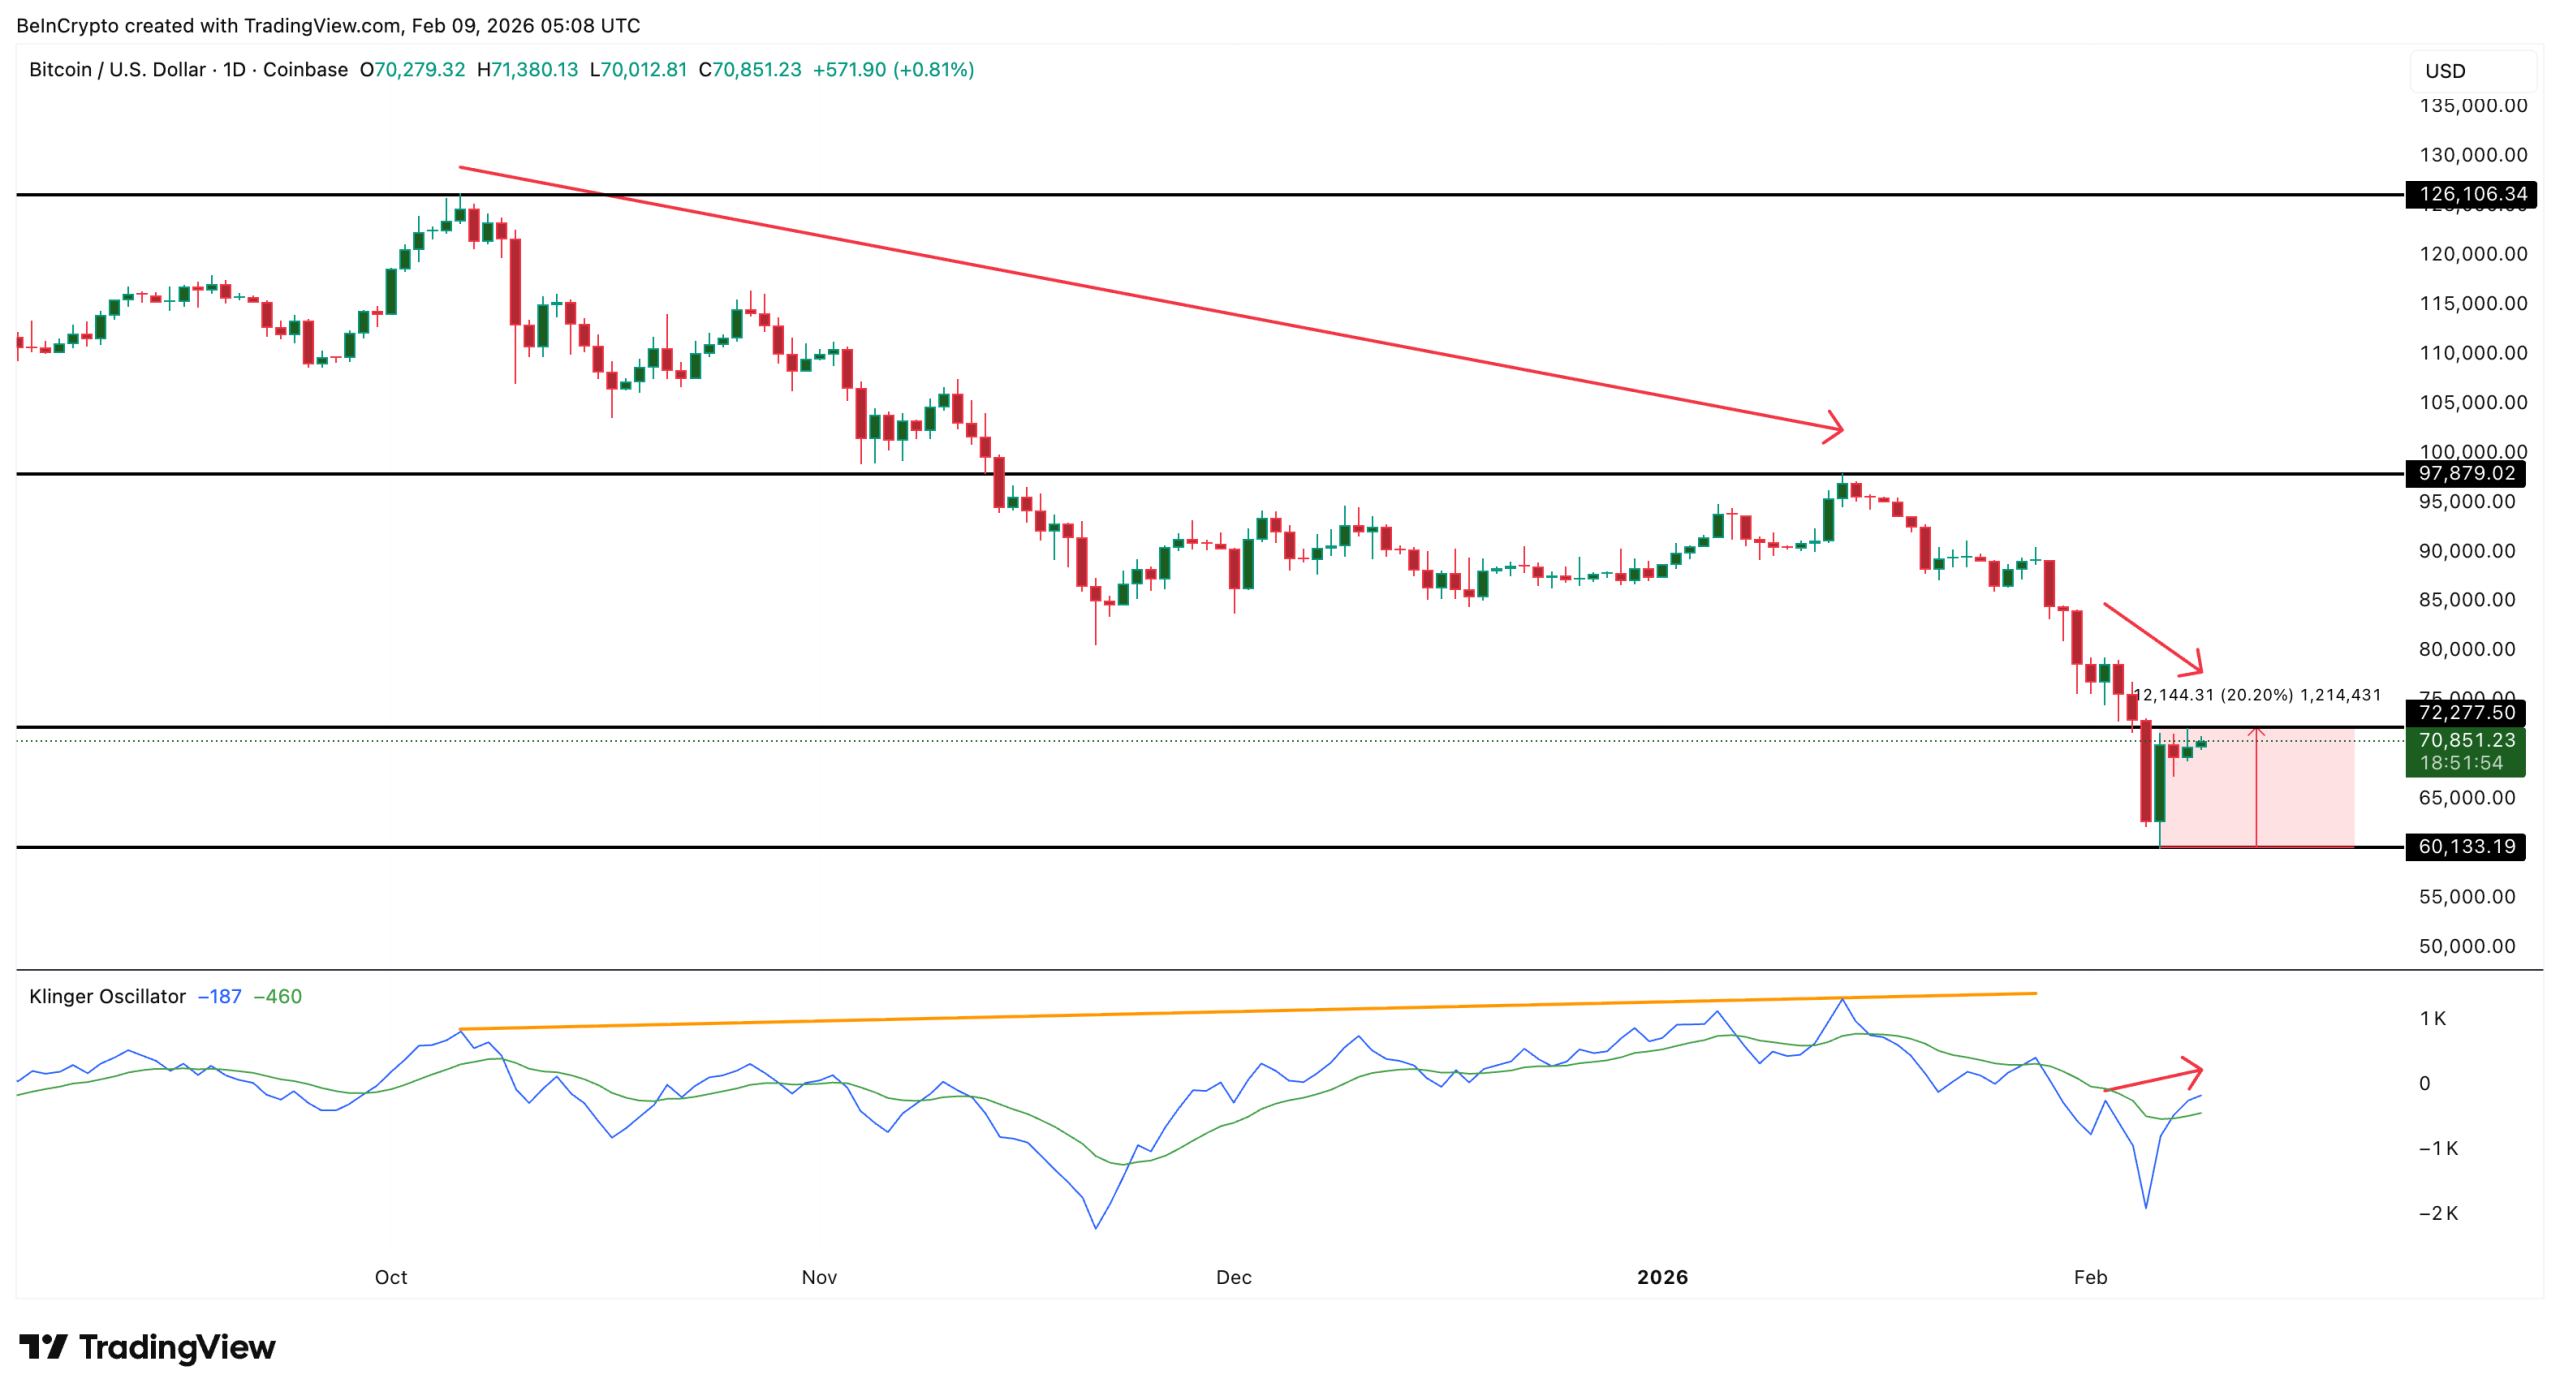
One of the clearest warning signals comes from the Klinger Oscillator, a volume-based indicator that tracks big money flow.
Sponsored
Sponsored
Unlike indicators such as the CMF, which focus mainly on short-term big-money pressure, the Klinger Oscillator measures large-wallet volume intensity across trends. It is designed to highlight how large players position themselves over time, not just day-to-day activity.
In simple terms, it shows whether big money is quietly accumulating or preparing to sell into rallies.
Between October 6 and January 14, Bitcoin fell from around $126,000 to $97,800, a decline of roughly 22%. During that period, the Klinger Oscillator moved higher while the price weakened. This created a bearish divergence.

That divergence warned that volume strength by large wallets (possibly whales and institutions) was not supporting price recovery. Within weeks, Bitcoin extended its decline toward $60,000 as the Klinger reading dropped sharply (possible big money outflows).
A similar pattern is forming again.
Between February 2 and February 9, the price drifted lower while the Klinger Oscillator trended upward. This suggests large players may be positioning (recent buys) to sell into rebounds rather than build long-term exposure.
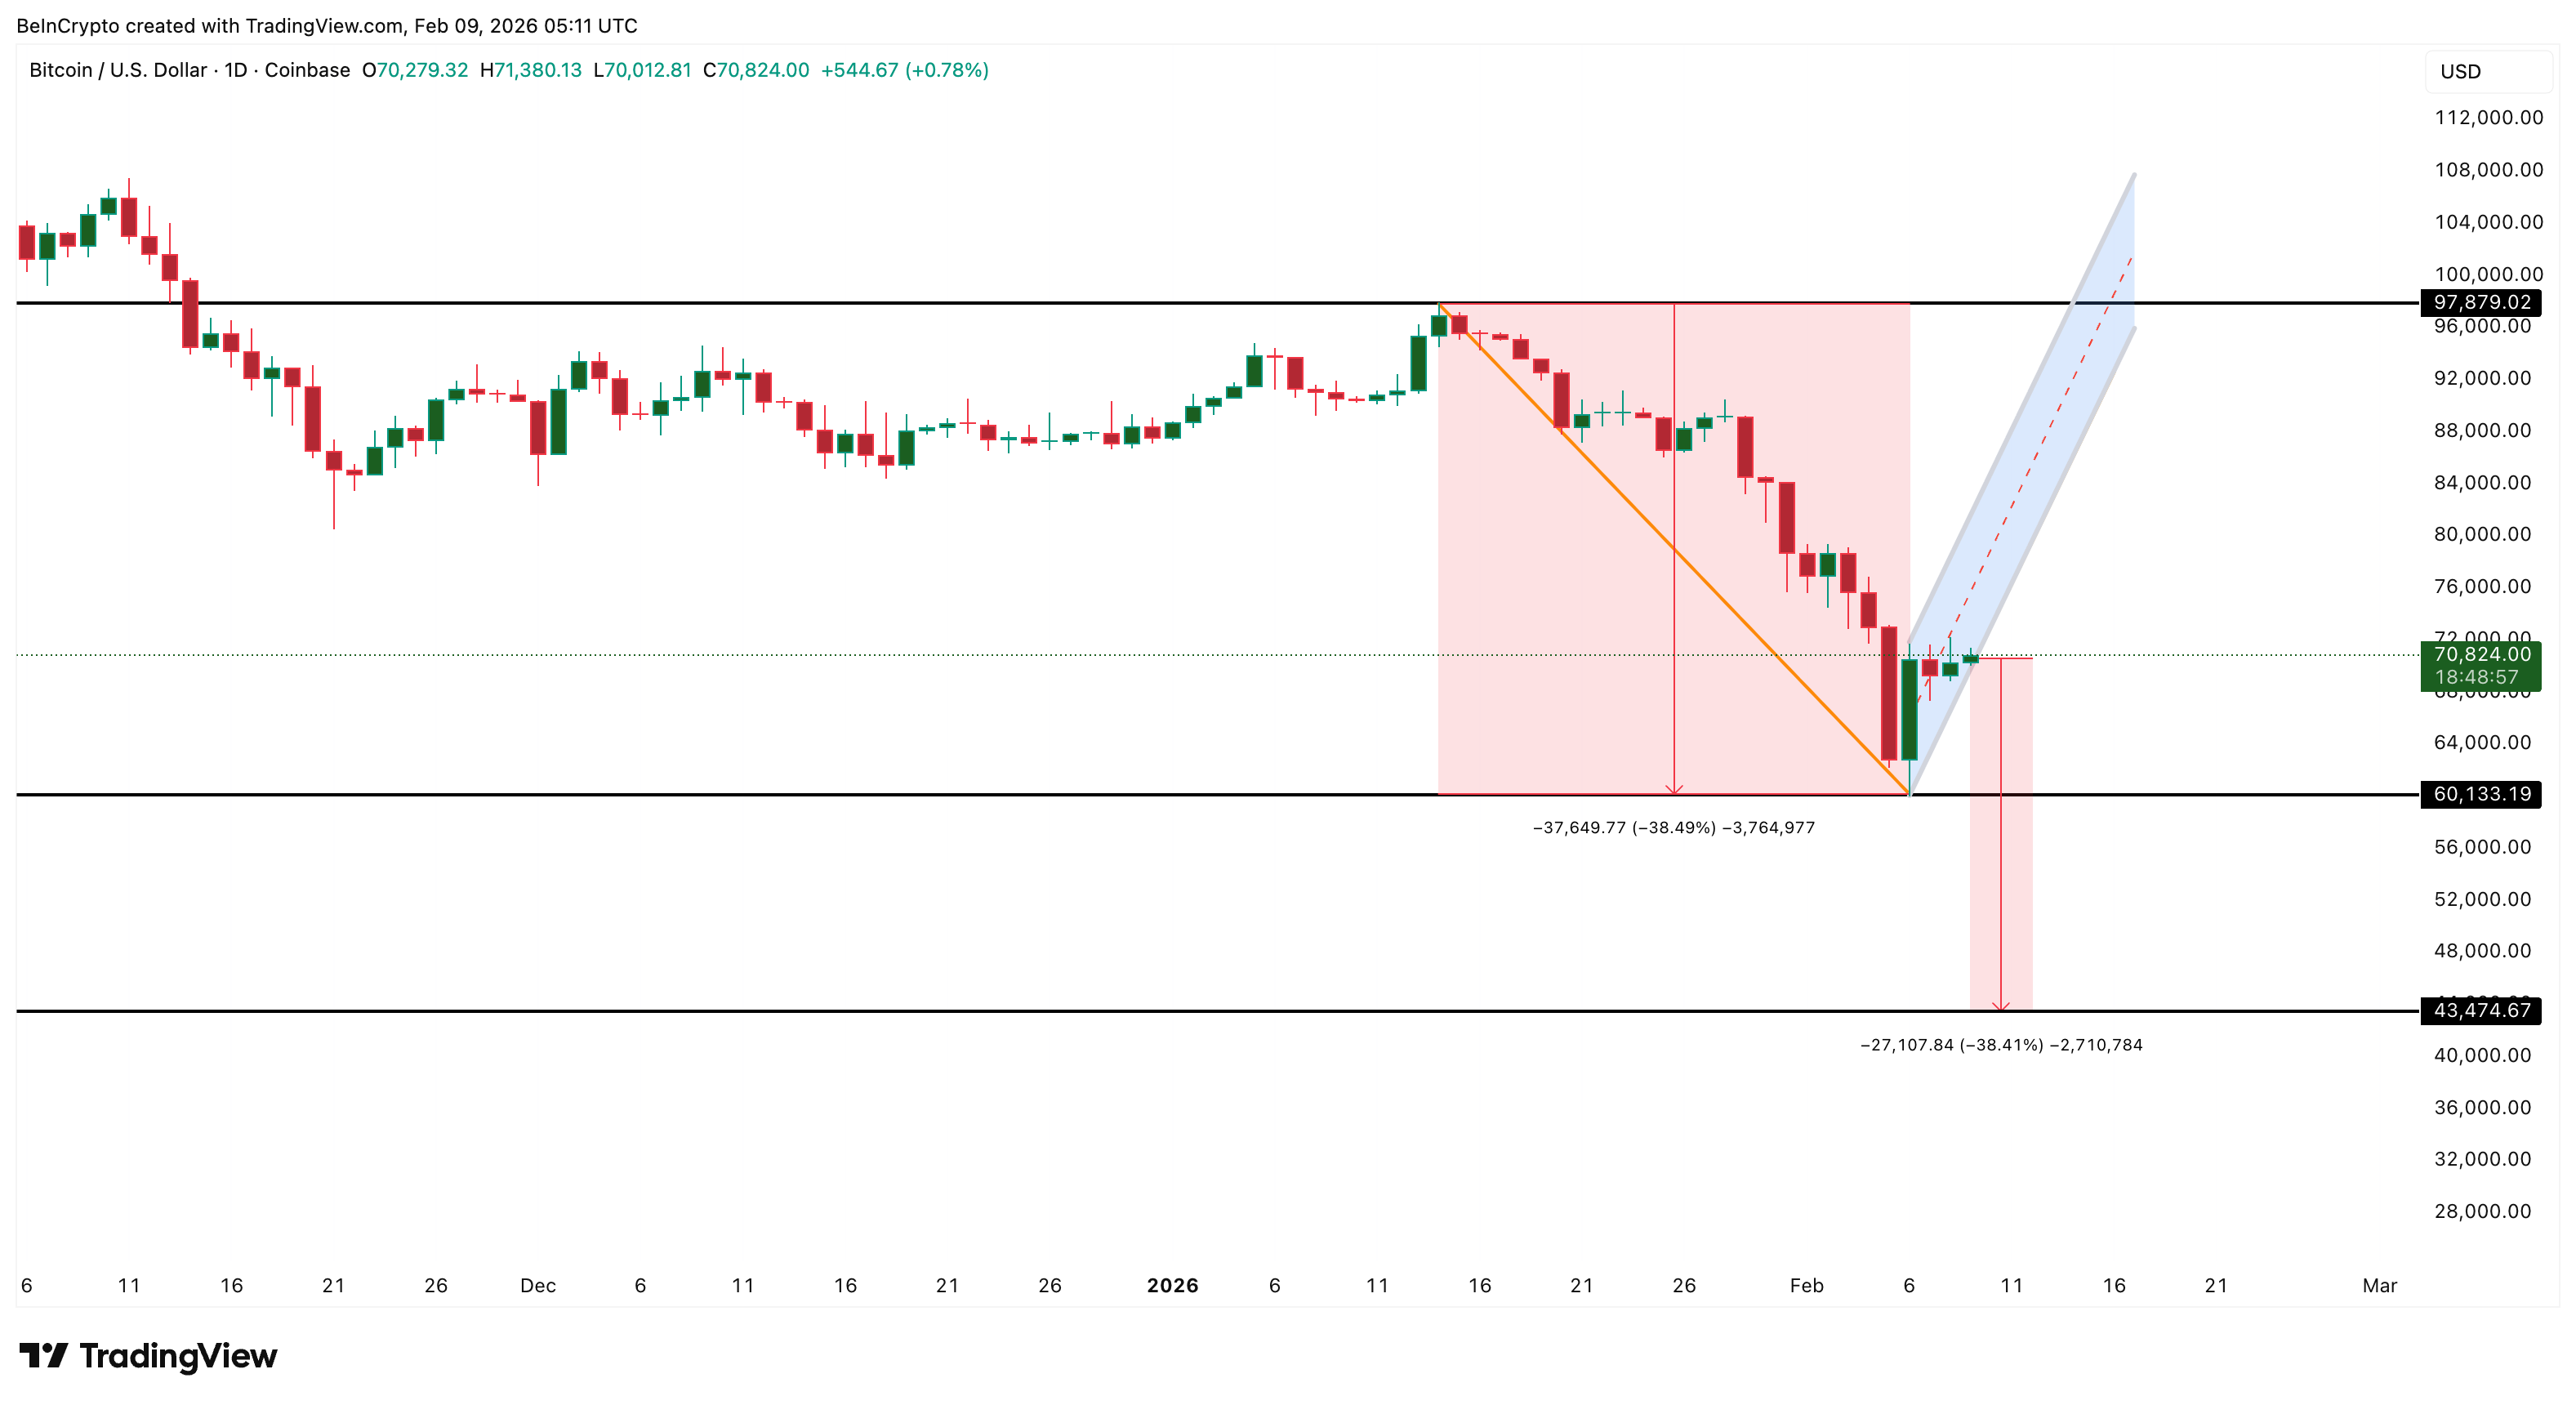
At the same time, Bitcoin’s drop from mid-January to early February formed a sharp downside “pole.” The current price bounce movement resembles a bear flag, a pattern that often signals a continuation of the lower trend, with a near 40% crash possibility if the lower trendline support gives way. That could trap the bulls buying into the bounce.
Sponsored
Sponsored
When rising Klinger readings align with a bear flag, it usually means rallies lack deep institutional support. Big players are active, but not in accumulation mode, and might distribute at any given chance. Days of BTC ETF outflows in the near term would validate the Klinger-led hypothesis.
Improving US Demand Has Failed to Mark Bottoms Before
This technical weakness does not exist in isolation. It comes even as US demand has started to improve.
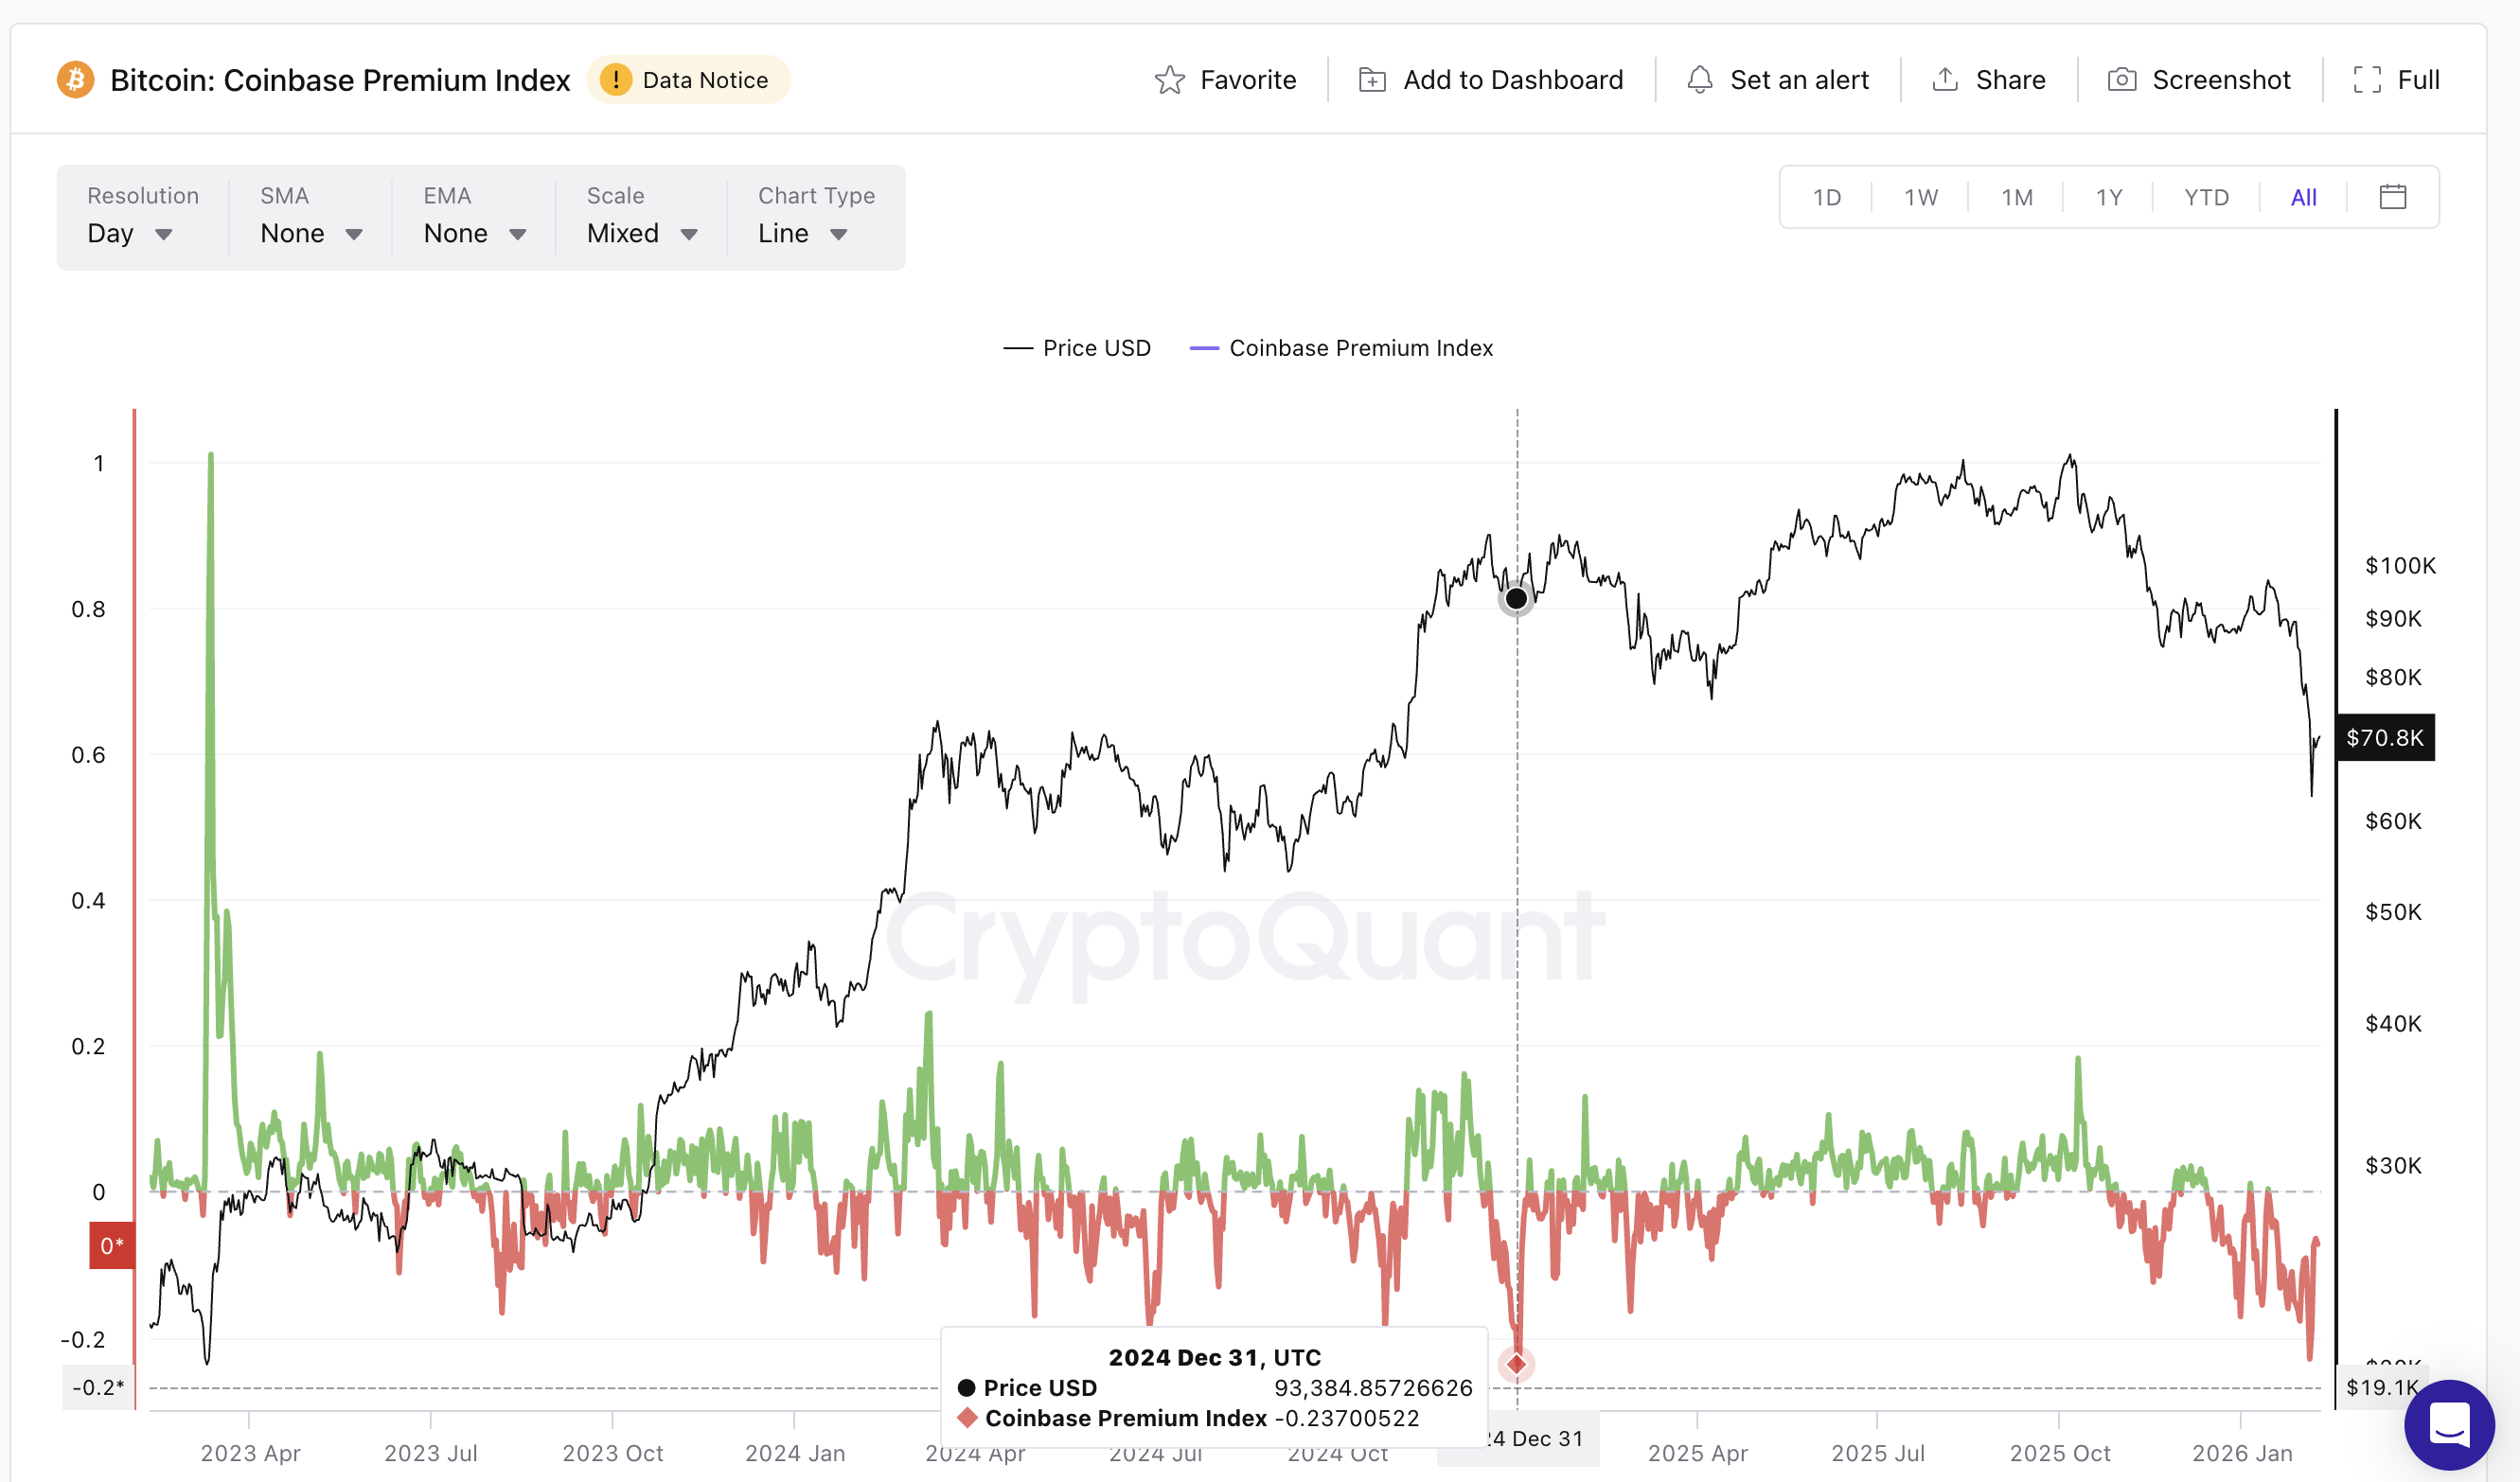
The Coinbase Premium Index tracks whether Bitcoin trades at a premium or discount on US-based Coinbase compared with global exchanges. It primarily reflects American institutional demand.
On February 4, the index fell to around -0.22, showing weak US participation. This level closely matched December 31, 2024, when the index dropped to -0.23. At that time, Bitcoin traded near $93,300.
Sponsored
Sponsored
Want more token insights like this? Sign up for Editor Harsh Notariya’s Daily Crypto Newsletter here.
Many traders believed a bottom had formed. Instead, the price later fell to about $76,200, a decline of nearly 18%.
Since early February, the index has recovered to near -0.07, signaling improving US interest and aligning with the Klinger oscillator’s rising reading. However, history shows that demand recovery often comes before price bottoms, not after. In 2024, US demand improved first. The deeper correction came later.
On-chain data adds another layer of risk.
The 1-day to 1-week holder group, made up of short-term traders, increased its share of supply from about 2.05% to over 3.3% since February 5 (during the 20% rebound). That is a rise of more than 60% in just days, as highlighted by HODL Waves, a metric segregating wallets by time.
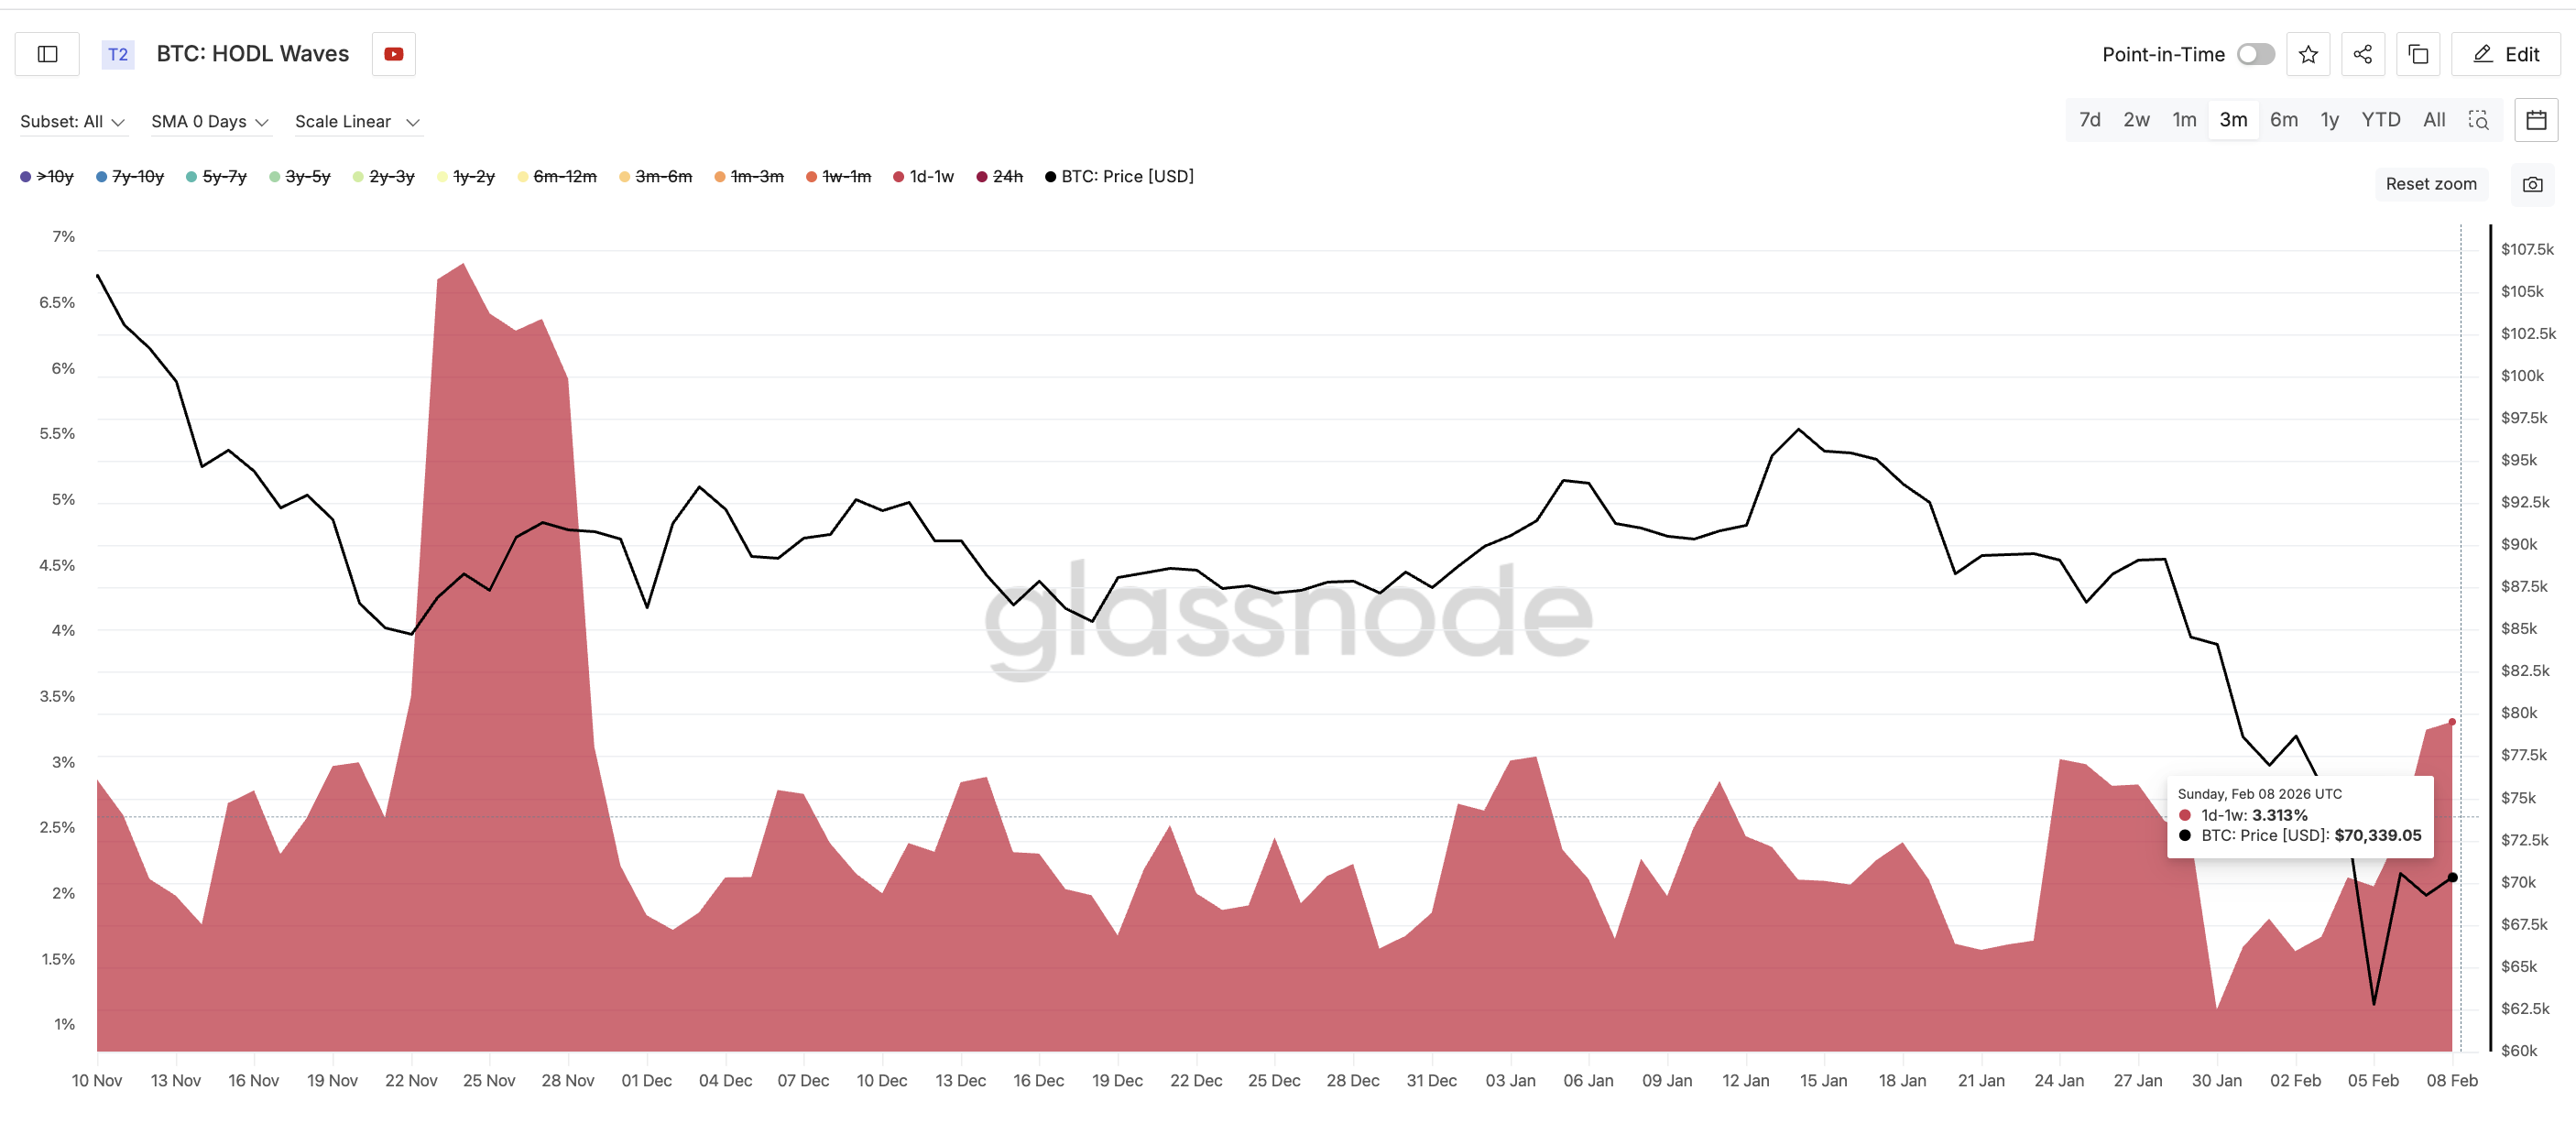
This cohort tends to sell quickly when prices weaken. Their growing presence makes the market more unstable. A similar surge in short-term holders in late January was followed by a rapid 3% pullback. So far, improving US demand is being matched by rising speculation, not strong conviction.
Sponsored
Sponsored
Key Bitcoin Price Levels Show Where the Bounce Could Fail
All signals now converge around a few critical Bitcoin price zones.
The first major support sits near $67,350. A daily close below this level could restart selling pressure.
If that breaks, the next downside targets are:
- $60,130, the recent low
- $57,900 (a key Fibonacci support and a mear 18% correction zone from the current levels)
- $53,450 a major retracement zone
- $43,470, the bear flag projection
A move from current levels to $43,400 would represent a further decline of roughly 35%. On the upside, Bitcoin must reclaim $72,330 to stabilize and get out of the possible bull trap. This level capped recent rallies.
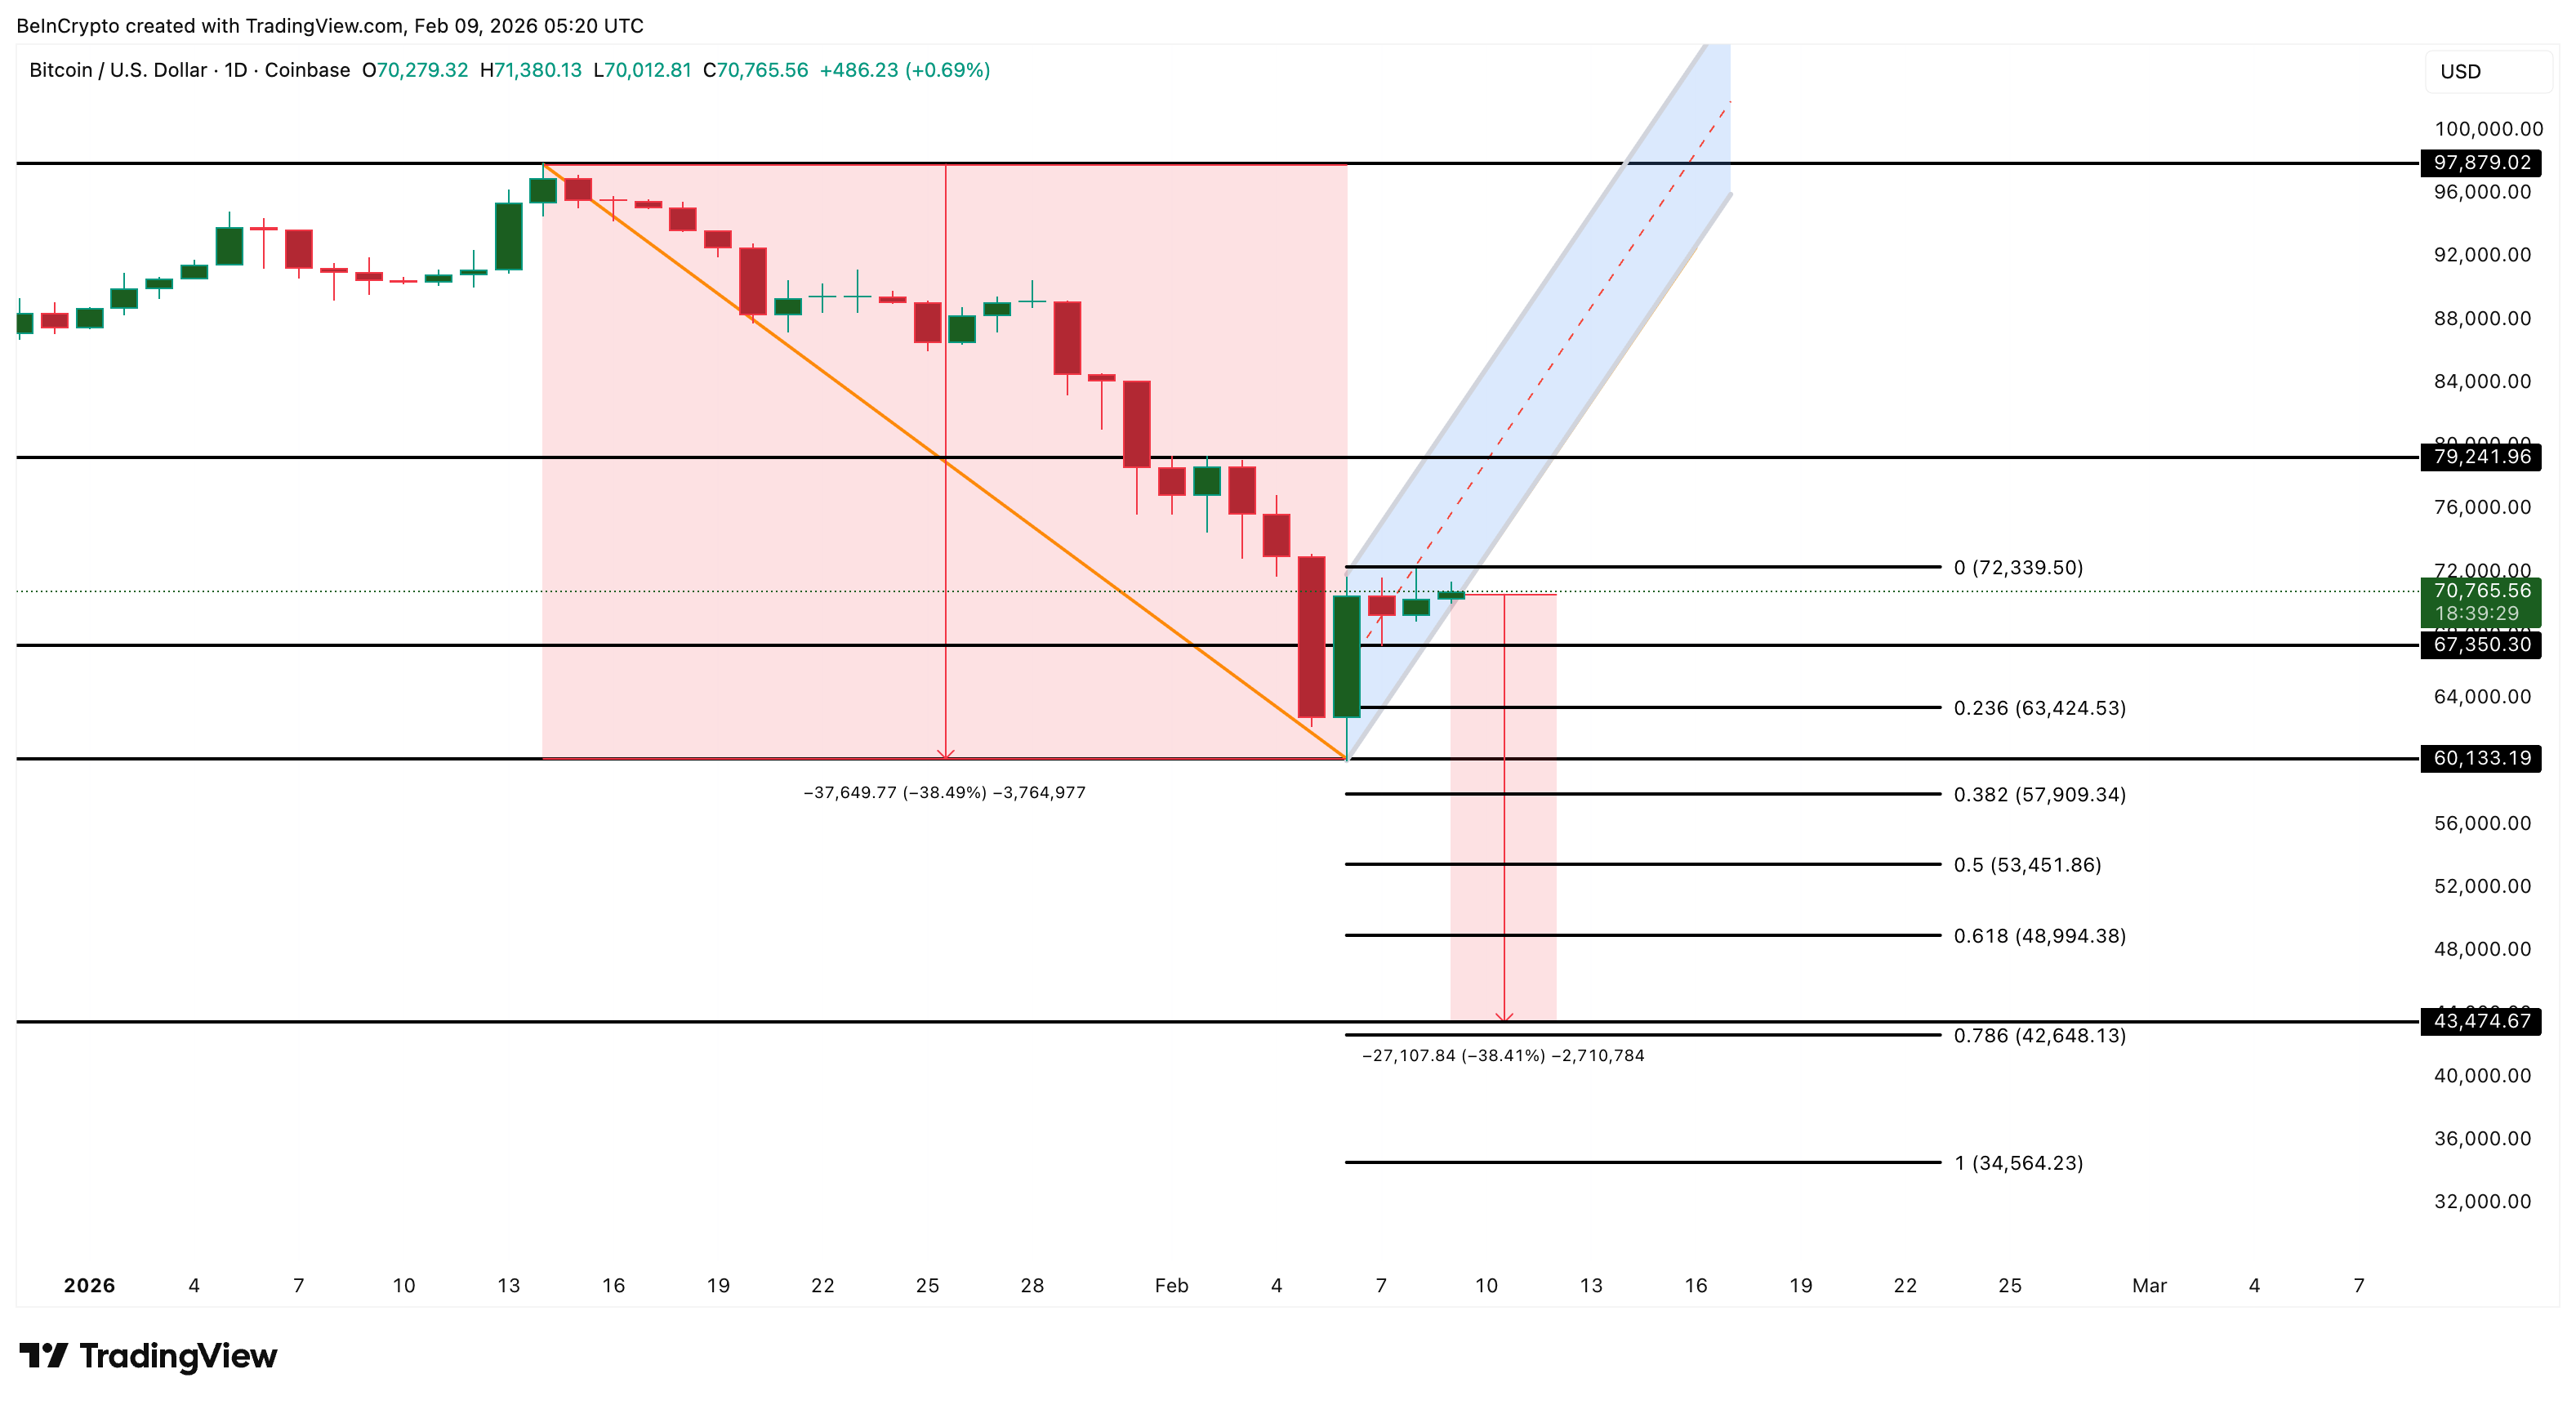
Above that, $79,240 remains decisive. Recovering this zone would retrace about half of the prior fall and likely invalidate the bearish structure. Only then would the path toward $97,870 reopen. Until that happens, all Bitcoin price rallies remain vulnerable.

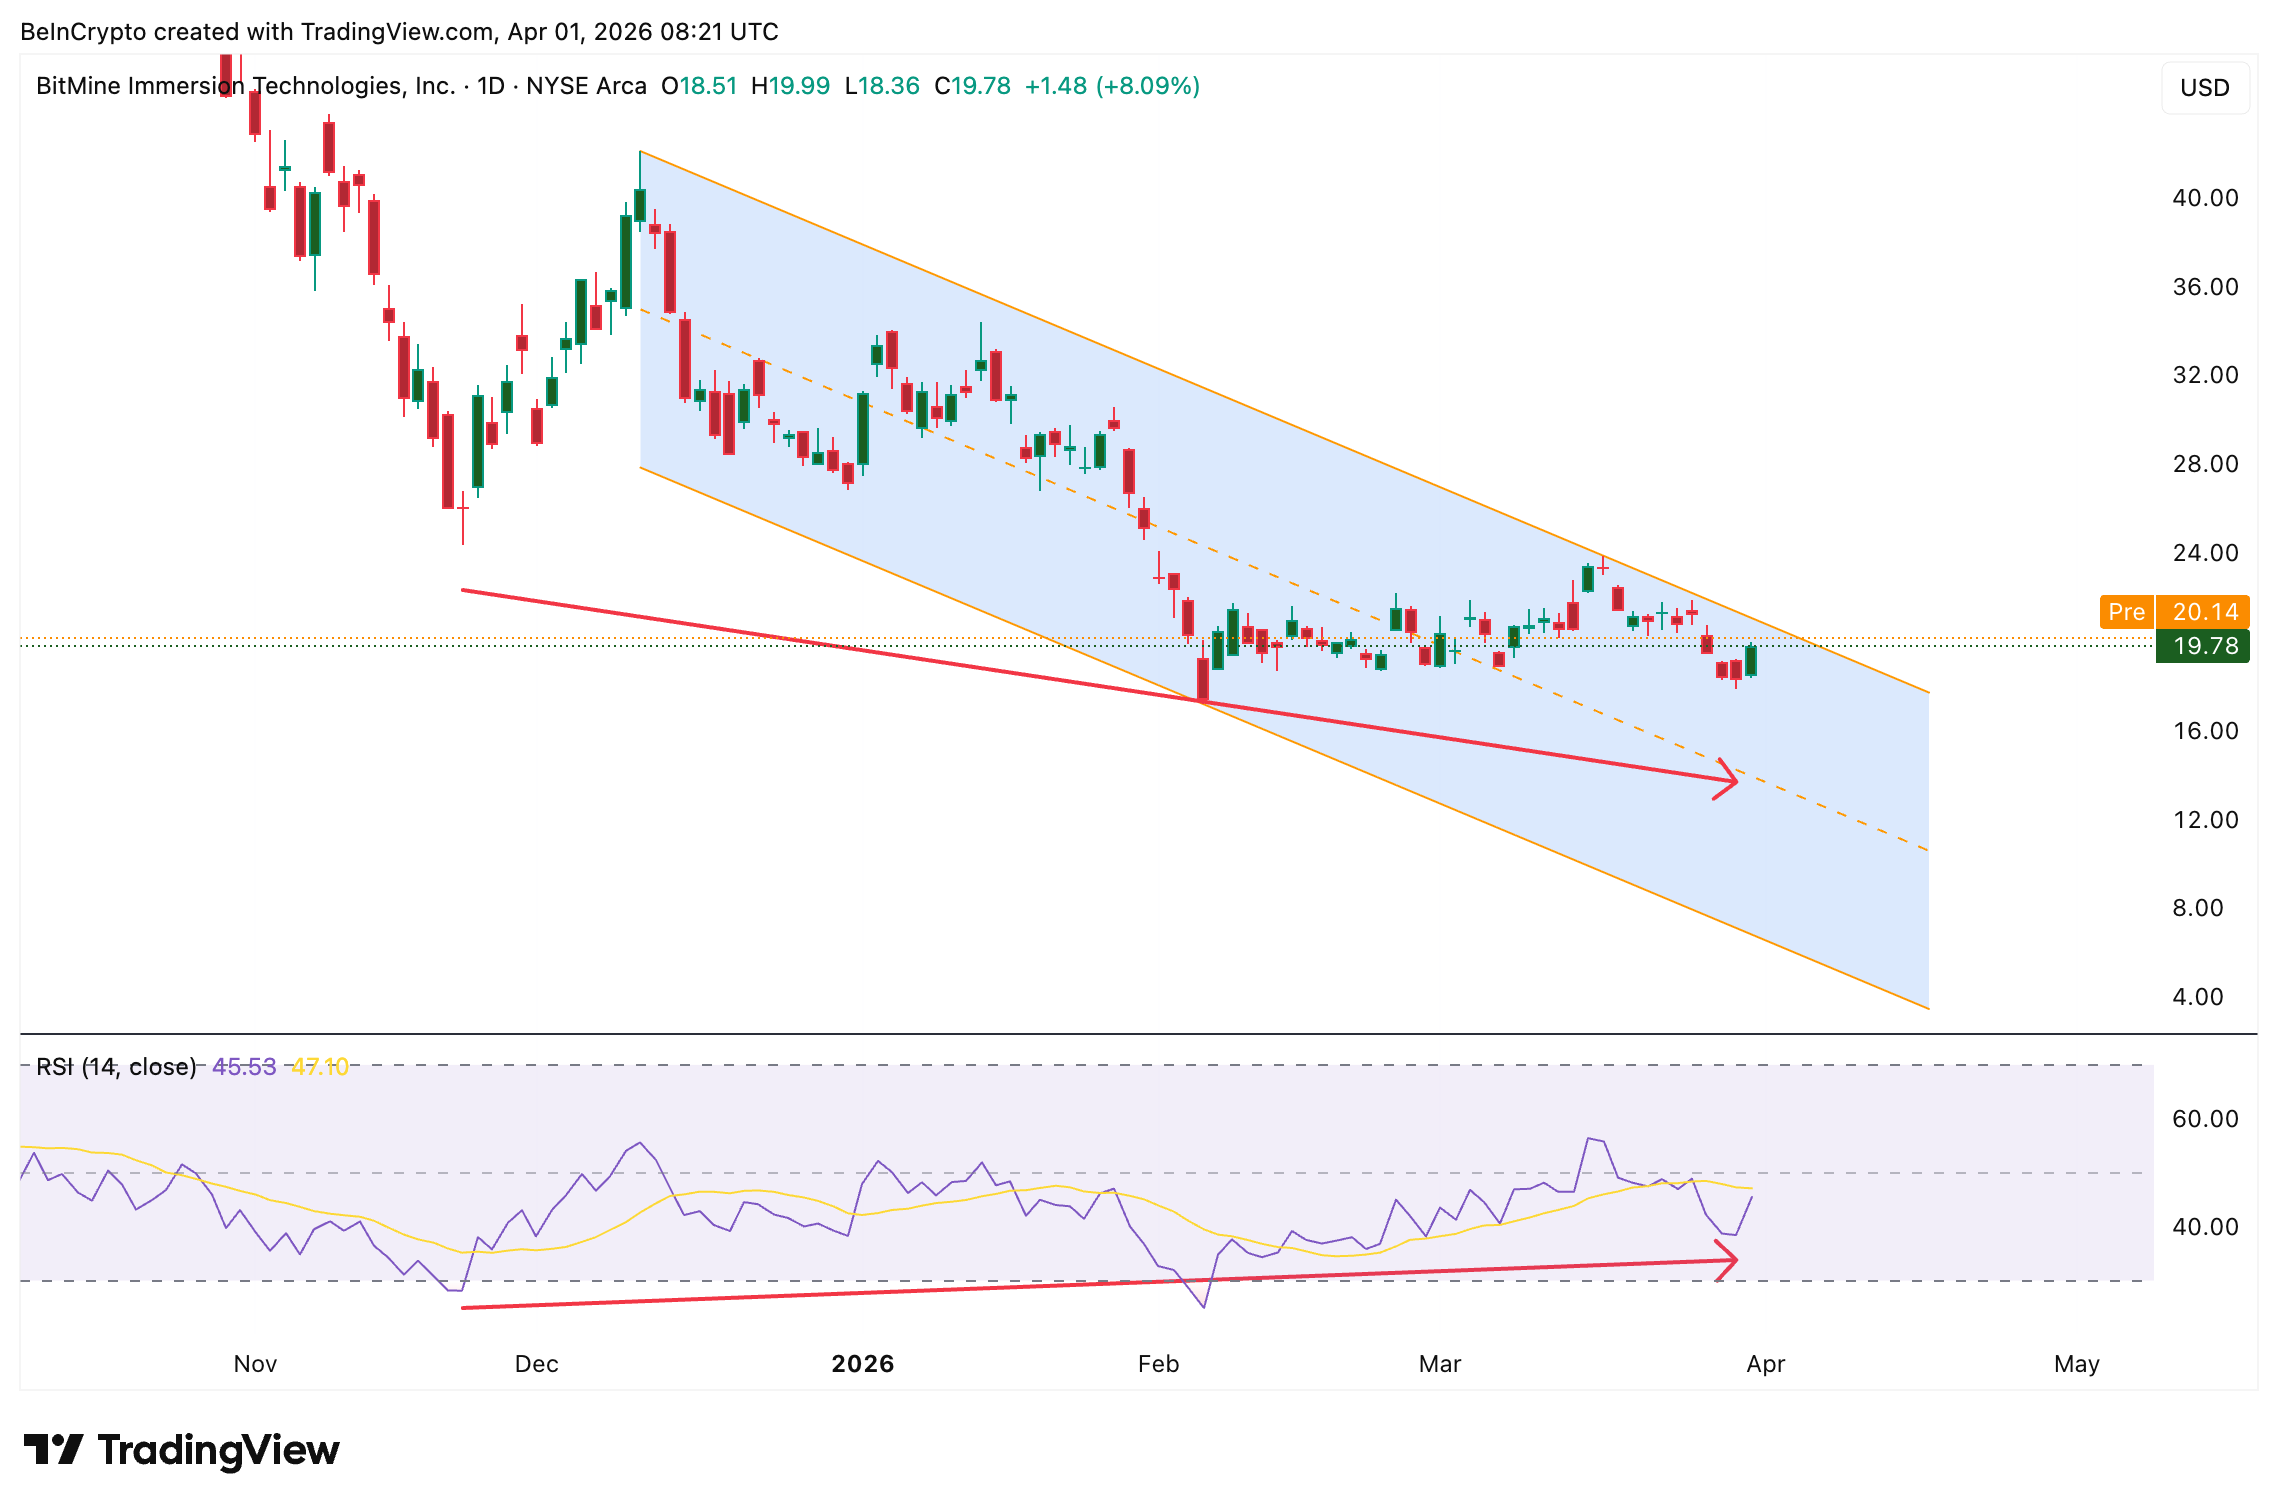
BitMine Immersion Technologies (BMNR) stock jumped 12% on March 31 to close at $19.78, its strongest single-session gain in a while, as a sharp shift in options positioning coincided with B. Riley raising its price target to $33 from $30.
The move pushed BitMine stock close to the upper trendline of a descending channel that has contained the price since early December. However, the nature of the rally and the absence of institutional buying pressure raise the question of whether this attempt will succeed where prior ones failed.
A Short Squeeze Drove the 12% Move, Not Fresh Buying
The put-call ratio, which compares bearish put option volume to bullish call option volume, tells the story of what happened between Friday and Monday.
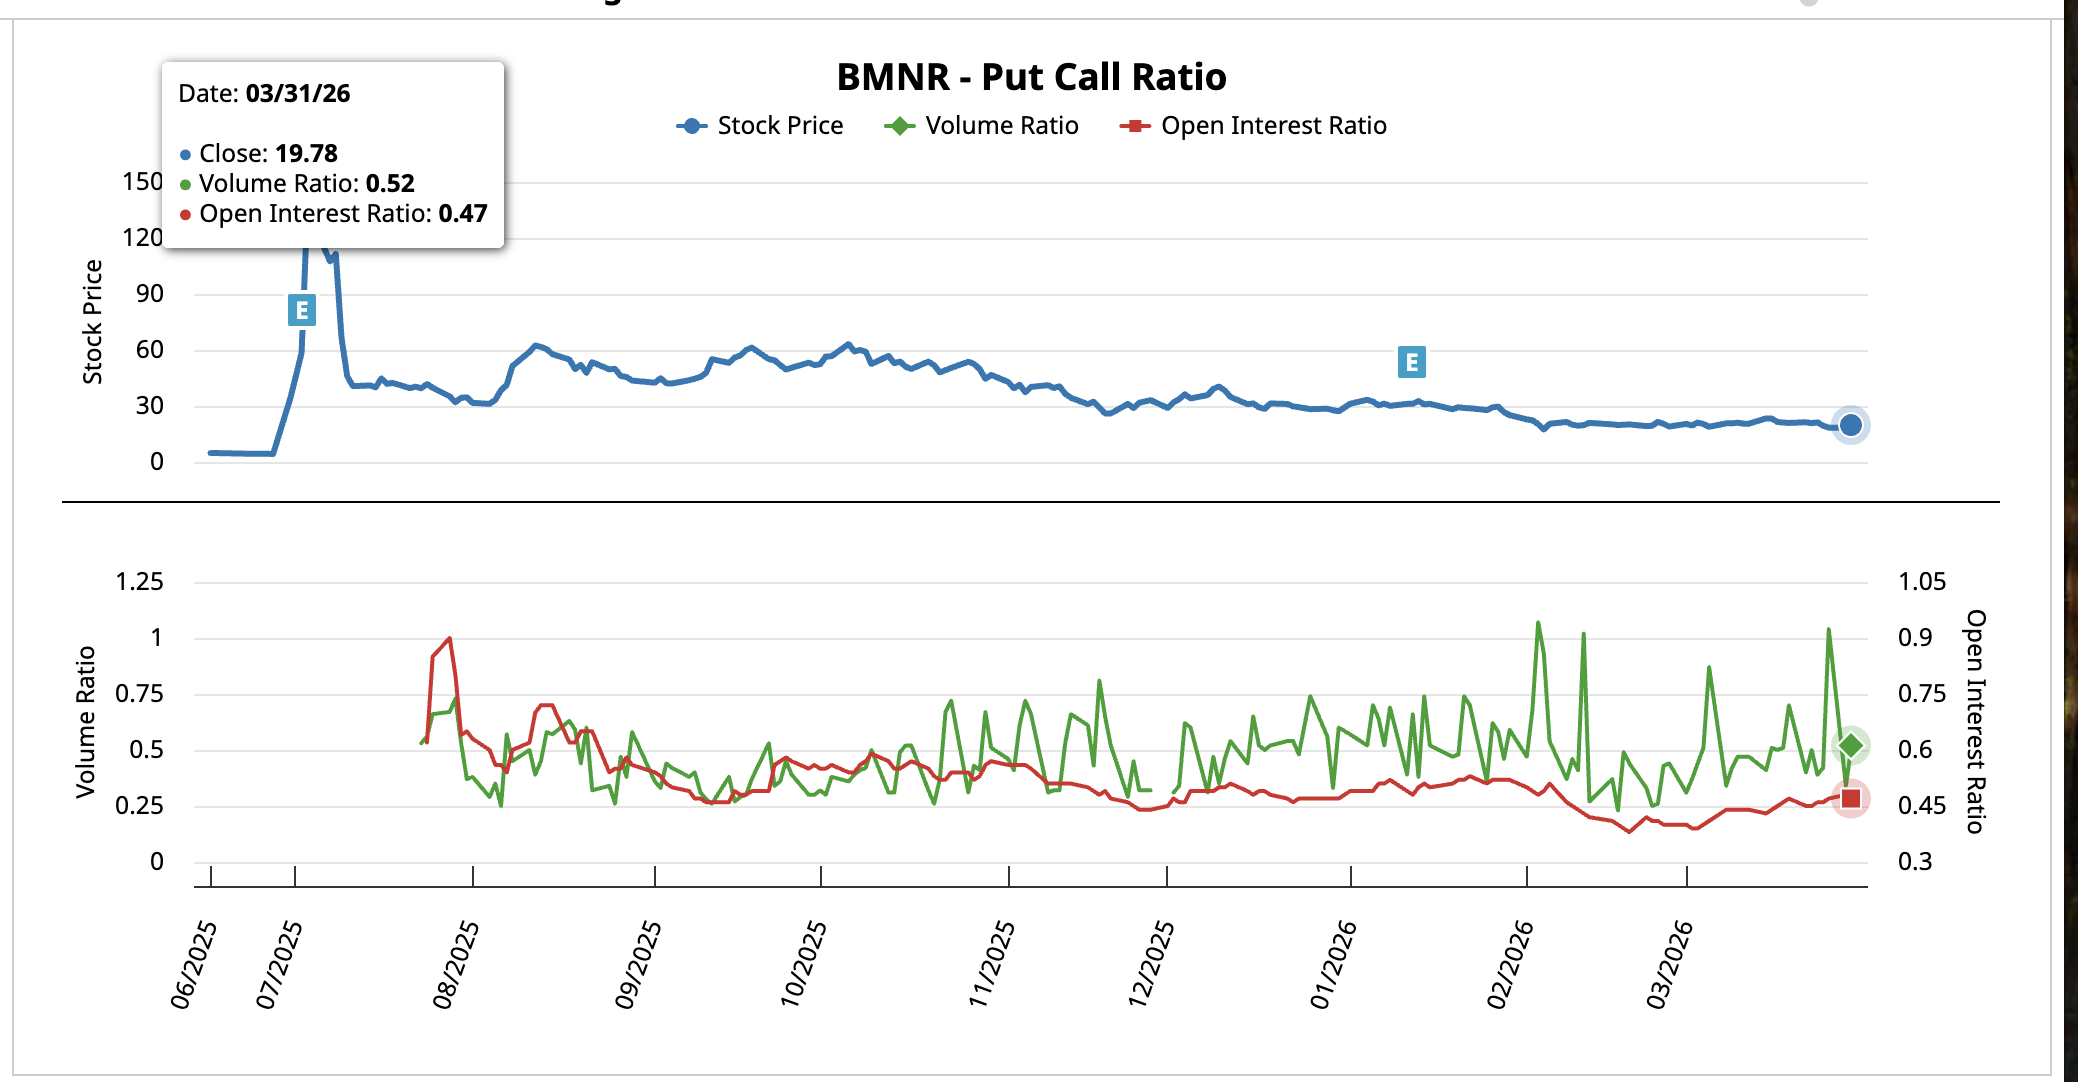
On March 27, the volume ratio spiked to 1.04, meaning put trading exceeded call trading for the first time in weeks. The open interest ratio sat at 0.47. That is aggressive bearish positioning heading into the weekend. By March 31, the volume ratio had collapsed to 0.52 while the open interest ratio remained flat at 0.47.
Want more insights like this? Sign up for Editor Harsh Notariya’s Daily Crypto Newsletter here.
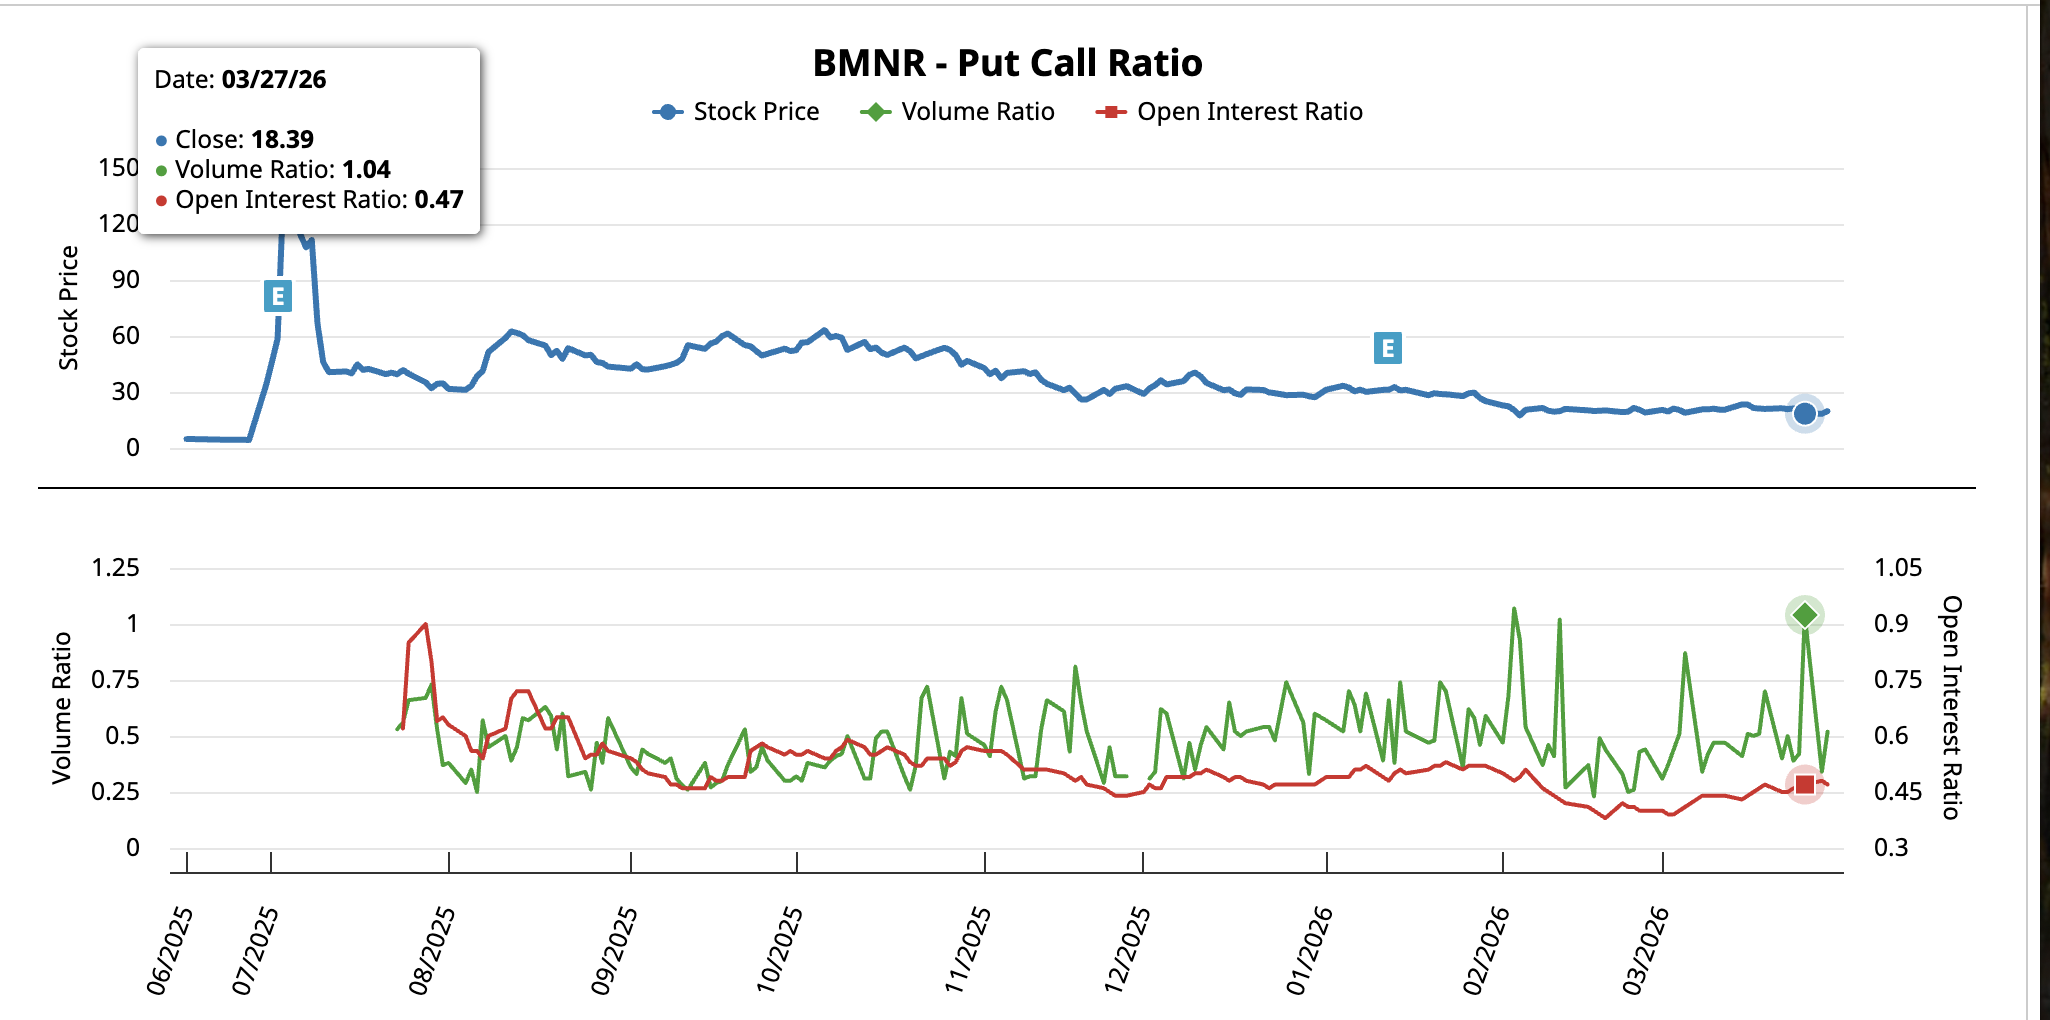
The unchanged open interest means no significant new positions were opened. The volume ratio collapse means existing bearish bets were being closed. That combination points to a classic short squeeze where traders covering put positions drove the BMNR stock price higher rather than new buyers entering with fresh conviction.
If the put-call ratio now rises again alongside rising open interest, it would signal new bearish positions being opened against the rally, which could stall the move on sentiment. However, the squeeze coincided with a fundamental catalyst that could extend the bounce.
ETH Treasury Growth and B. Riley’s $33 Target Support the Bull Case
BitMine added 71,179 ETH last week, its largest weekly purchase of 2026. That five-week buying streak pushed total holdings to 4.73 million ETH, representing 3.92% of Ethereum’s circulating supply. The company’s total crypto and cash treasury now stands at $10.7 billion, with approximately $177 million in annualized staking revenue.
B. Riley raised its BitMine stock price target to $33 from $30 on March 26, maintaining a Buy rating. The firm cited the launch of MAVAN, BitMine’s institutional-grade Ethereum staking platform, and noted that approximately 67% of holdings are already staked with potential annualized rewards of roughly $285 million at full deployment.
With Ethereum up 3.6% over the past 24 hours, the BitMine stock price has an external tailwind. ETH strength directly benefits BitMine’s treasury valuation and staking revenue outlook.
Yet the Chaikin Money Flow (CMF), a volume-weighted indicator that tracks institutional buying and selling pressure, remains below the zero line on the daily chart. Between February 23 and March 30, CMF trended lower alongside price.
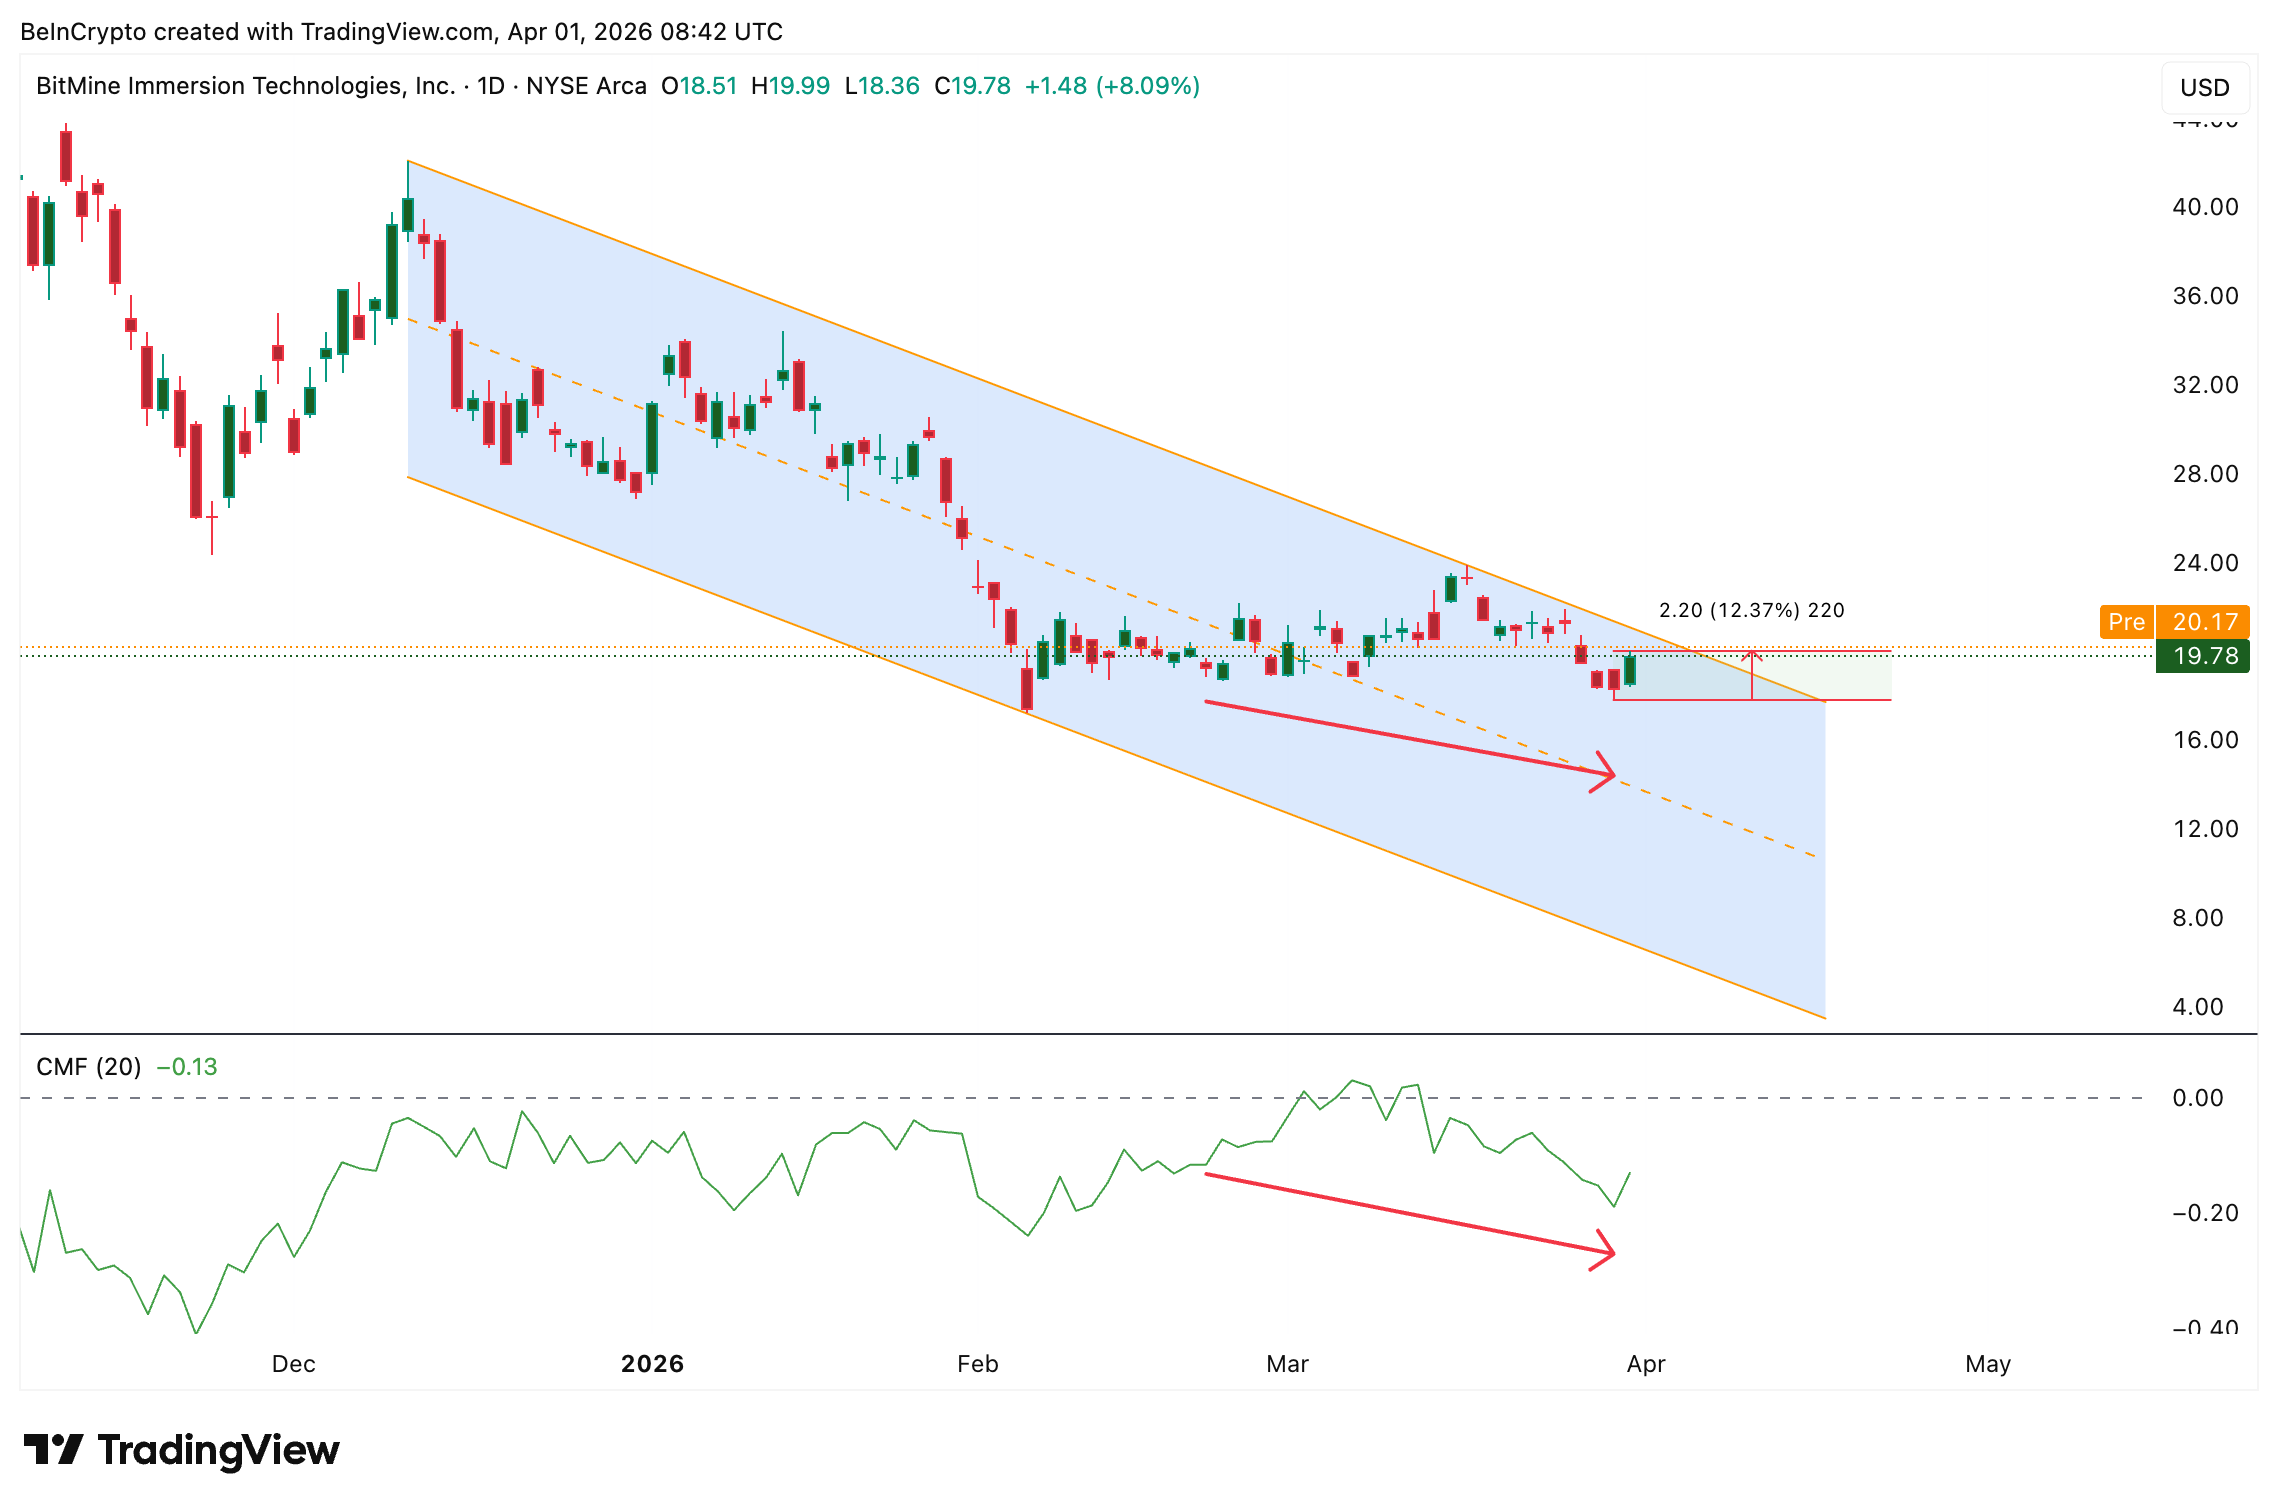
That pattern shows large money has not backed this rally with sustained buying. The bounce is running on short covering and Ethereum momentum rather than direct institutional accumulation into BMNR shares.
BitMine Stock Still Needs $21 to Confirm a Channel Breakout
Despite the short squeeze and fundamental tailwinds, the daily chart shows BitMine stock pressing against the same upper trendline of a descending channel that has rejected every breakout attempt since December. Early January and mid-March also saw a failed attempt out of this 4-month trap.
A bullish divergence on the Relative Strength Index (RSI), a momentum indicator, does support the case for a broader reversal now. Between November 21 and March 30, price trended lower while RSI printed a higher low. That divergence suggests selling momentum is weakening even as price continued to fall. Combined with the Ethereum tailwind and MAVAN catalyst, it gives bulls a technical reason to stay engaged.
However, a daily close above $21.22 (the $21 zone) is needed to confirm that the upper trendline has broken. That level aligns with the 0.5 Fibonacci level and would represent a 7% move from the current close. A push above $22.01 would strengthen the breakout case and open a path toward $24.56 and potentially $28.69. Beyond that sits B. Riley’s upgraded target.
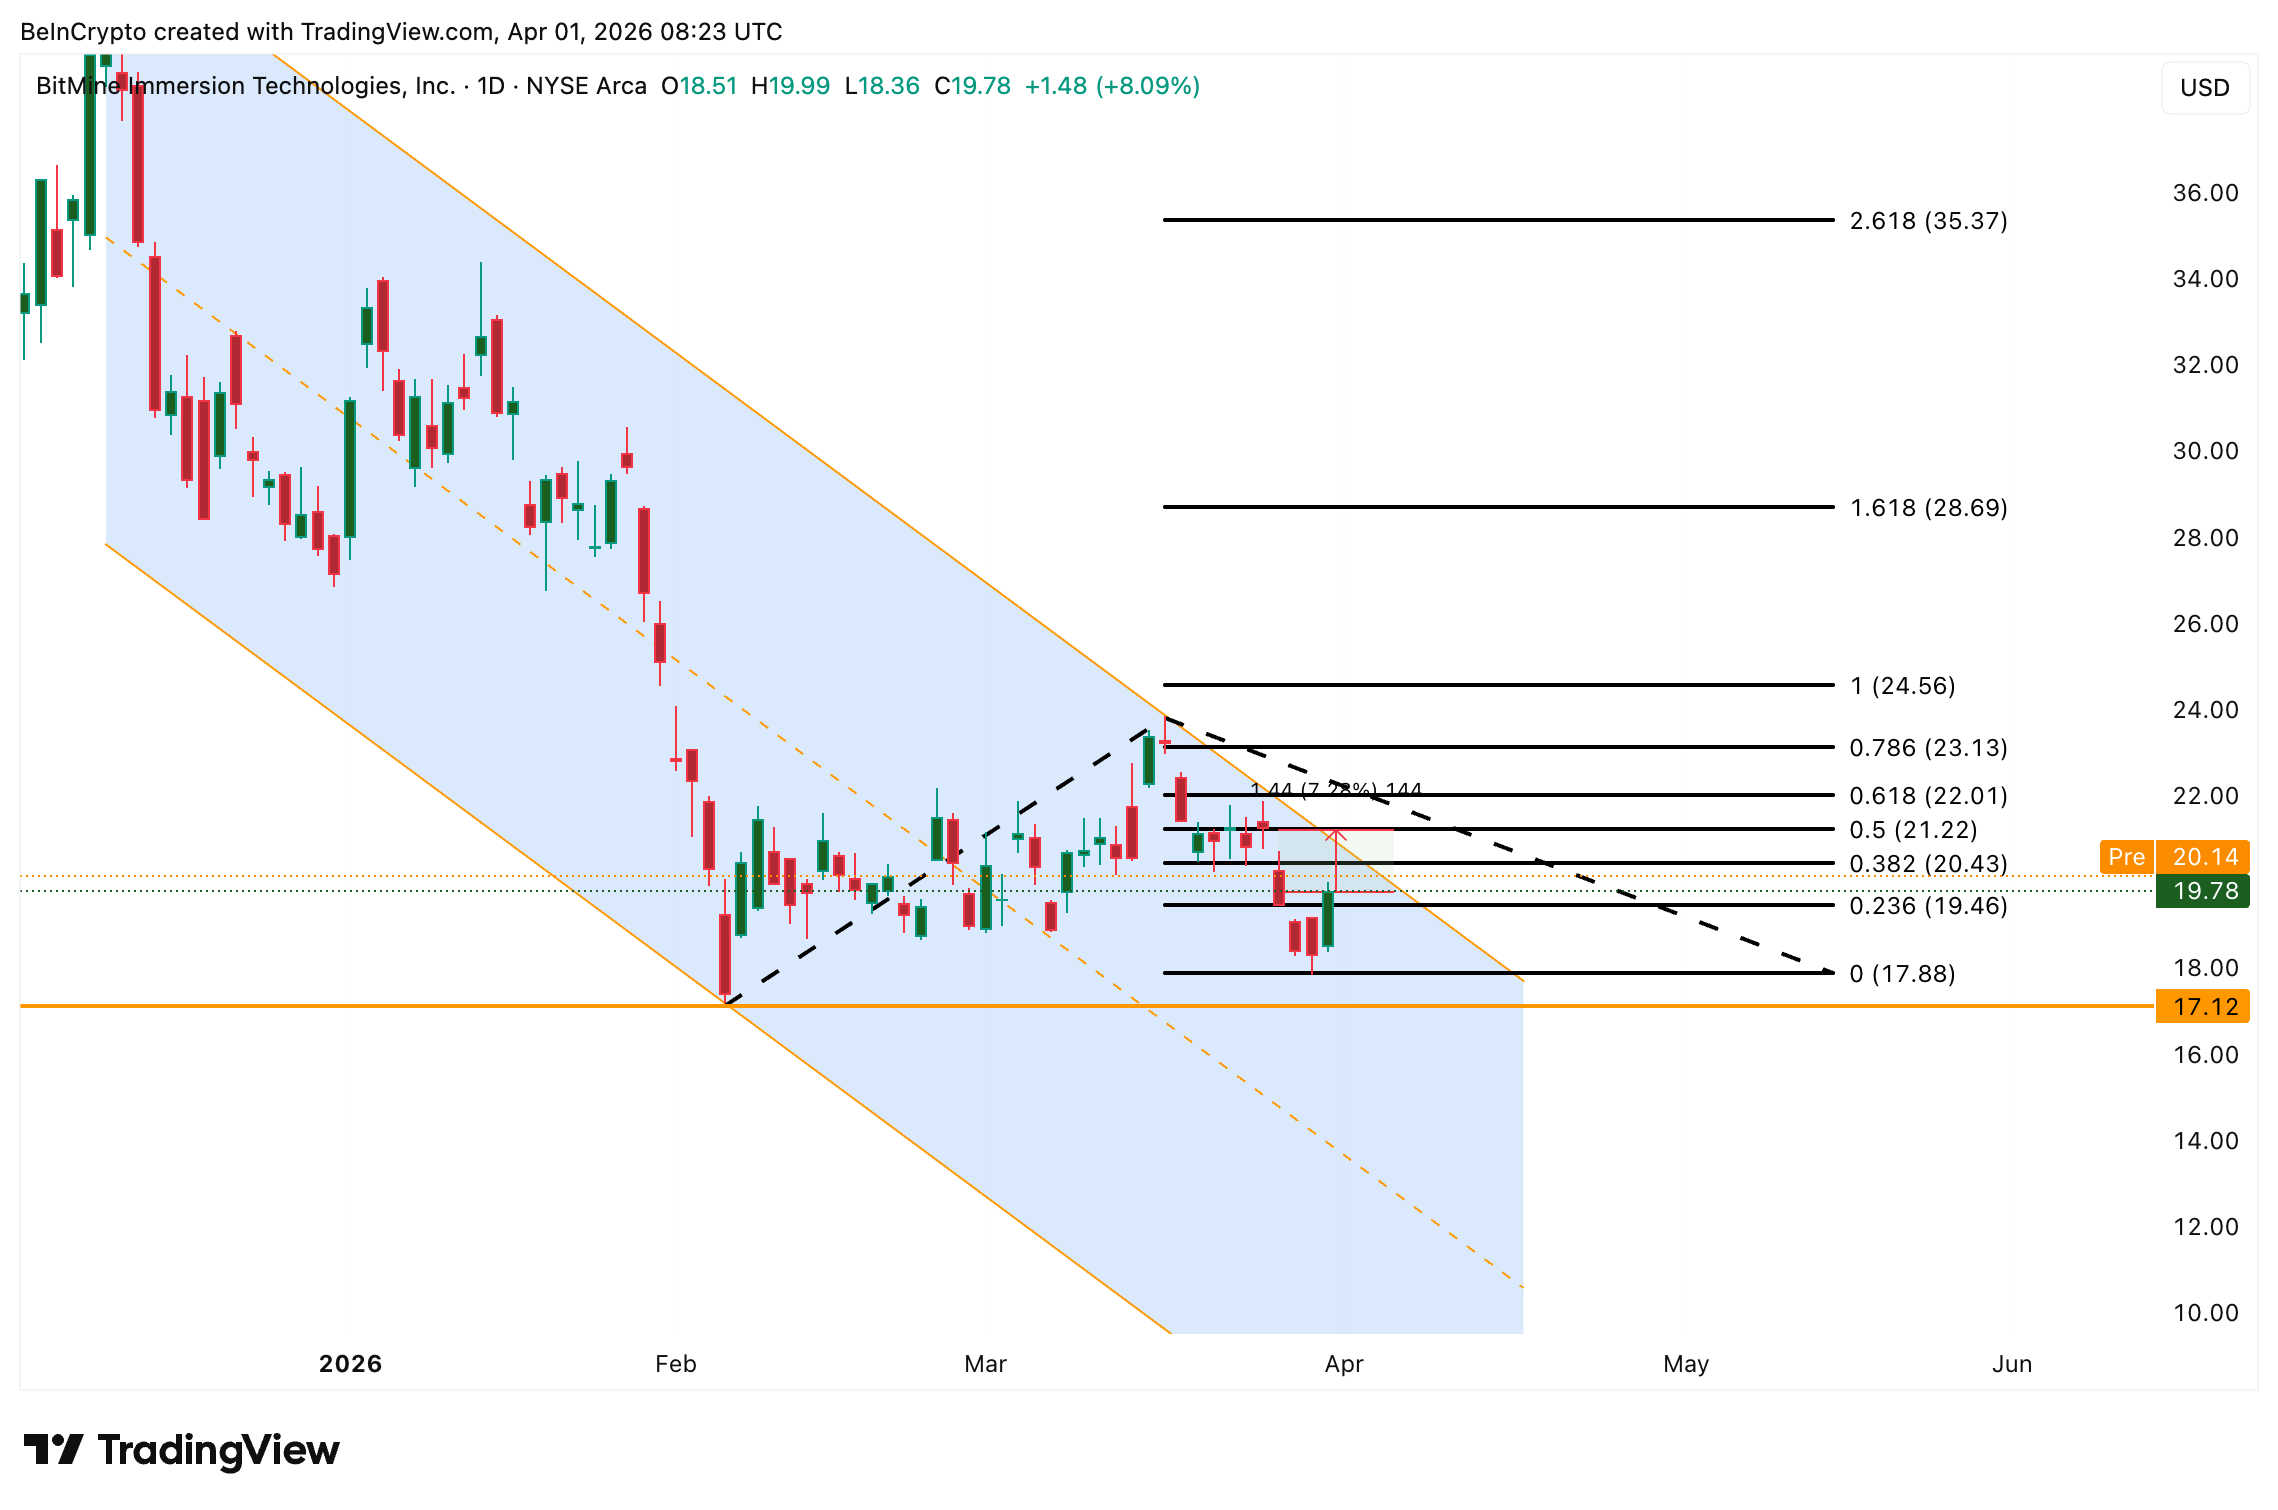
On the downside, failure to hold $19.46 would signal that the squeeze has exhausted itself. A close below $17.88 reopens the lower channel for BMNR stock and puts the $17.12 support at risk.
The $21 zone now separates a confirmed channel breakout fueled by ETH momentum and MAVAN staking revenue from another failed trendline rejection that sends BitMine stock price back toward $17.88.
The post BitMine Stock Gets a Bullish Upgrade, but a 4-Month Trap Still Holds appeared first on BeInCrypto.
Key points:
-
Buyers will have to sustain Bitcoin above $69,000 to gain the upper hand in the short term.
-
Select major altcoins may break above their near-term resistance, signaling buying at lower levels.
Bitcoin (BTC) is facing resistance at $69,000, but the bulls continue to exert pressure. A minor positive in favor of the bulls is that the US spot BTC exchange-traded funds have recorded $186.9 million in inflows this week, according to Farside Investors data.
Is this a good level to buy BTC, or could it fall further? That’s a question troubling investors. Alphractal founder Joao Wedson said in a post on X that BTC’s previous market cycles suggest a historical bottom may form “in late September or early October 2026.”

Veteran trader Peter Brandt also believes that BTC could bottom in September or October. Brandt told Cointelegraph that a complete recovery to a new all-time high may happen only by the second quarter of 2027 but he added that it “is all guesswork.”
Could BTC and select major altcoins rise above their overhead resistance levels? Let’s analyze the charts of the top 10 cryptocurrencies to find out.
Bitcoin price prediction
Buyers are attempting to sustain BTC above the moving averages, indicating solid buying at lower levels.

If they succeed, the BTC/USDT pair may remain inside the bullish ascending triangle pattern. Buyers will have to thrust the BTC price above the $76,000 level to seize control. The pair may then surge to the $84,000 level.
This positive view will be negated in the near term if the BTC price turns down and breaks below the $65,000 level. That will invalidate the positive setup, resulting in long liquidation. The pair may then tumble to the $62,500 to $60,000 support zone.
Ether price prediction
Ether (ETH) closed above the 20-day exponential moving average ($2,085) on Tuesday, and the bulls are attempting to push the price to the $2,200 overhead resistance.

If buyers overcome the barrier at $2,200, the ETH/USDT pair is expected to pick up momentum and rise to $2,400. Sellers will attempt to vigorously defend the $2,400 level, as a close above it opens the gates for a rally to the $3,050 level.
Time is running out for the bears. They will have to quickly pull the price below the $1,916 level to stay in the game. If they do that, the ETH price may plummet to the critical $1,750 support.
BNB price prediction
Buyers are attempting to push BNB (BNB) above the moving averages, but the bears have held their ground.

Sellers will strive to pull the BNB price below the immediate support at $596. If they manage to do that, the BNB/USDT pair may slip to the vital support at $570. Buyers are expected to defend the $570 level with all their might, as a close below it signals the resumption of the downtrend. The next stop on the downside may be $500.
Alternatively, a close above the moving averages may push the price to the stiff overhead resistance of $687. A close above the $687 level will be the first sign of strength. The pair may then march to $730 and thereafter to $790.
XRP price prediction
XRP (XRP) is trying to form a base near the $1.29 level, but the bulls are struggling to push and maintain the price above the moving averages.

That suggests the bears have kept up the pressure. If the XRP price turns down and breaks below the $1.27 level, it signals that bears have overpowered the bulls. The XRP/USDT pair may then decline to the $1.11 level.
On the contrary, a break above the moving averages indicates that the bulls are back in the game. The pair may rise to the breakdown level of $1.61 and then to the downtrend line. A close above the downtrend line signals a potential trend change.
Solana price prediction
Solana (SOL) is attempting to form a floor at the $76 level, but the relief rally is facing stiff resistance at the moving averages.

The flattish moving averages and the relative strength index just below the midpoint do not give a clear advantage either to the bulls or the bears. If the price breaks above the moving averages, the bulls will endeavor to push the SOL/USDT pair above the $95 resistance. If they succeed, the rally may extend to the $117 level.
Contrarily, if the SOL price turns down sharply from the $95 level, it suggests that the range-bound action may continue for a while. Sellers will be back in command on a close below the $76 level.
Dogecoin price prediction
Dogecoin (DOGE) remains stuck between the moving averages and the critical $0.09 support, but the tight range trading is unlikely to continue for long.

If buyers thrust the DOGE price above the moving averages, the relief rally may reach $0.10 and then the $0.12 resistance. Sellers are expected to fiercely defend the $0.12 level. If the price turns down from the overhead resistance, the DOGE/USDT pair may consolidate between $0.09 and $0.12 for a few more days.
Sellers will seize control on a close below the $0.09 level. The pair may then sink to the Feb. 6 low of $0.08 and eventually to the $0.06 level.
Hyperliquid price prediction
Hyperliquid (HYPE) fell below the breakout level of $36.77 on Tuesday, but the bears are struggling to sustain the lower levels.

The bulls are attempting to make a comeback by swiftly pushing the HYPE price back above the 20-day EMA ($37.57). If they can pull it off, the HYPE/USDT pair may rise to $41.59 and subsequently to the $43.76 level. Sellers will attempt to halt the up move at $43.76, but if the bulls prevail, the pair may climb to $50.
This positive view will be invalidated in the near term if the price turns down and breaks below the 50-day simple moving average ($33.97). That suggests the market has rejected the break above the $36.77 level.
Related: Strategy set to resume buying Bitcoin via STRC: Will BTC price hit $80K?
Cardano price prediction
Cardano (ADA) is facing resistance at the $0.25 level, but a positive sign is that the bulls have not ceded ground to the bears.

Buyers will attempt to overcome the barrier at the moving averages. If they do that, the ADA/USDT pair may reach the downtrend line, which is a crucial resistance to watch out for. A close above the downtrend line signals a potential short-term trend change.
Sellers are likely to have other plans. They will attempt to defend the moving averages and pull the ADA price below the $0.23 level. If that happens, the pair may slide to the Feb. 6 low of $0.22.
Bitcoin Cash price prediction
Bitcoin Cash (BCH) has been trading between the 50-day SMA ($485) and the $443 support for the past few days.

The failure of the bulls to clear the 50-day SMA suggests that the bears are active at higher levels. Sellers will attempt to strengthen their position by pulling the BCH price below the $443 level. If they manage to do that, the BCH/USDT pair will complete a bearish head-and-shoulders pattern. That opens the doors for a drop to the $375 level.
Instead, if buyers drive the price above the 50-day SMA, it signals demand at lower levels. The pair may then ascend to the $520 to $540 zone.
Chainlink price prediction
Chainlink (LINK) is facing resistance at the moving averages, but a positive sign is that the bulls have kept up the pressure.

That improves the prospects of a close above the moving averages. If that happens, the LINK price may rally toward the $10 level. Sellers will attempt to defend the $10 level and keep the LINK/USDT pair range-bound for some more time.
The next trending move is expected to begin on a close above $10 or below $8. If buyers pierce the $10 level, the pair may rise to $10.94 and later to the $11.61 level. Alternatively, a drop below the $8 support may sink the price to $7.15 and then to $6.
This article does not contain investment advice or recommendations. Every investment and trading move involves risk, and readers should conduct their own research when making a decision. While we strive to provide accurate and timely information, Cointelegraph does not guarantee the accuracy, completeness, or reliability of any information in this article. This article may contain forward-looking statements that are subject to risks and uncertainties. Cointelegraph will not be liable for any loss or damage arising from your reliance on this information.
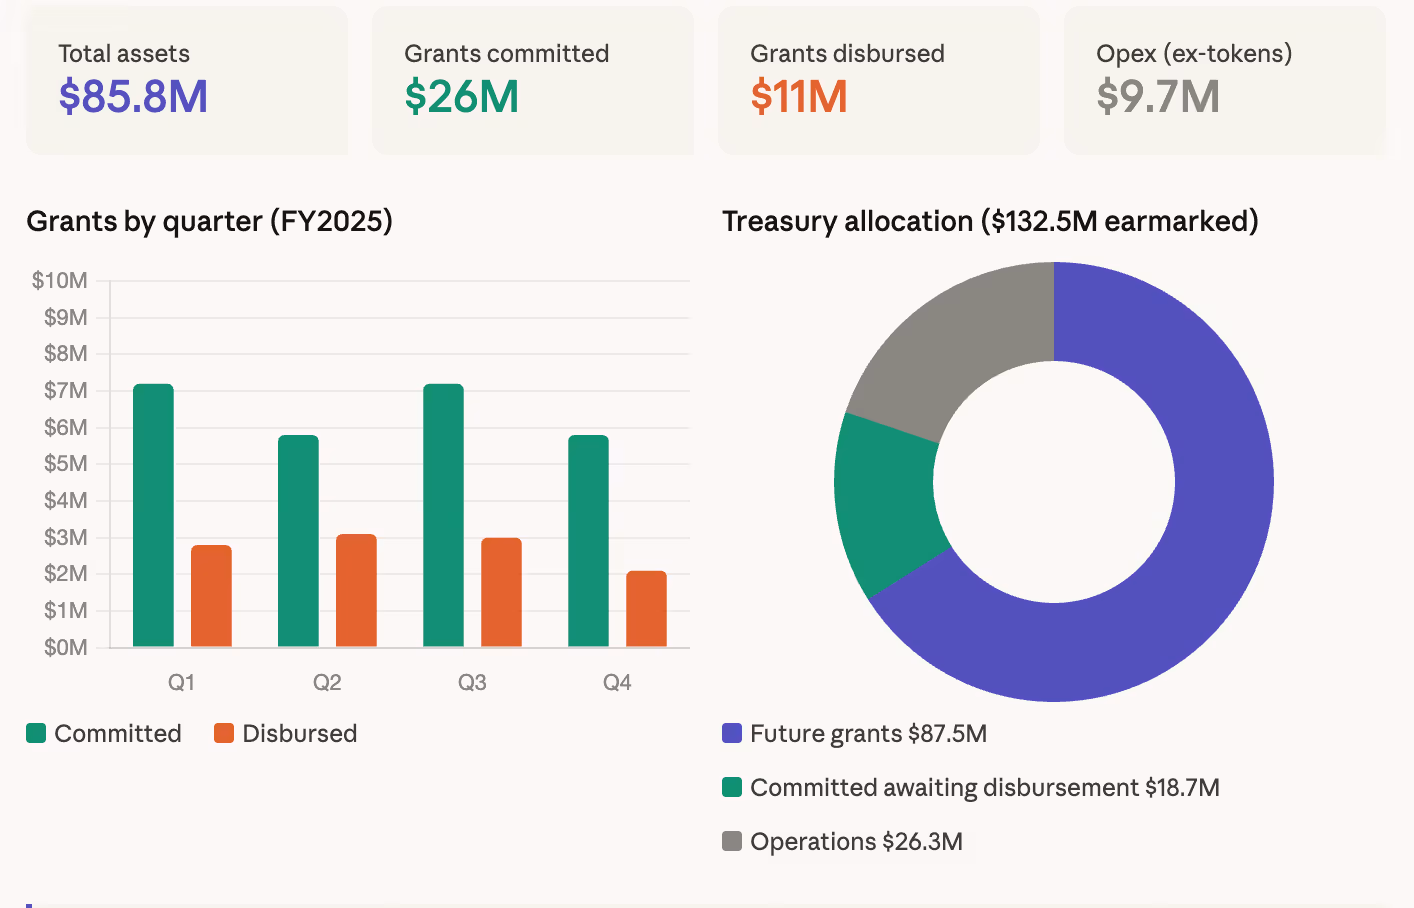
The Uniswap Foundation held $85.8 million in total assets at the end of 2025, split between $49.9 million in cash and stablecoins, 15.1 million UNI tokens, and 240 ETH, according to unaudited summary financials published Tuesday.
The foundation committed $26 million in new grants during 2025 and disbursed $11 million against prior commitments. In Q4 alone, $5.8 million in new grants were committed and $2.1 million disbursed. Operating expenses for the full year came to $9.7 million, excluding employee token awards of 450,000 UNI.
On the revenue side, the foundation received 20.3 million UNI, worth roughly $114 million at year-end prices, from the Uniswap Treasury through the Uniswap Unleashed governance proposal. It also earned $1.7 million in interest on fiat holdings.
The numbers reflect the foundation’s financial position before the UNIfication proposal, approved by governance on Dec. 26, which restructures the relationship between the foundation and the broader Uniswap ecosystem. A new legal entity called DUNI was formed as part of that process.
Of the total funds, $106.2 million was earmarked for grants ($87.5 million to be committed, $18.7 million reserved for previously committed grants awaiting disbursement) and $26.3 million for operations and employee token awards.
The projected runway extended through January 2027, though the foundation said that timeline will be updated in its Q1 2026 report to reflect the post-UNIfication organizational changes.

The report lands alongside a year of significant protocol milestones, including the launch of Uniswap v4, which introduced hooks and a programmable architecture for on-chain liquidity, and Unichain, a dedicated chain for high-performance DeFi applications. The foundation said more than 1,500 developers onboarded to v4 during the year.
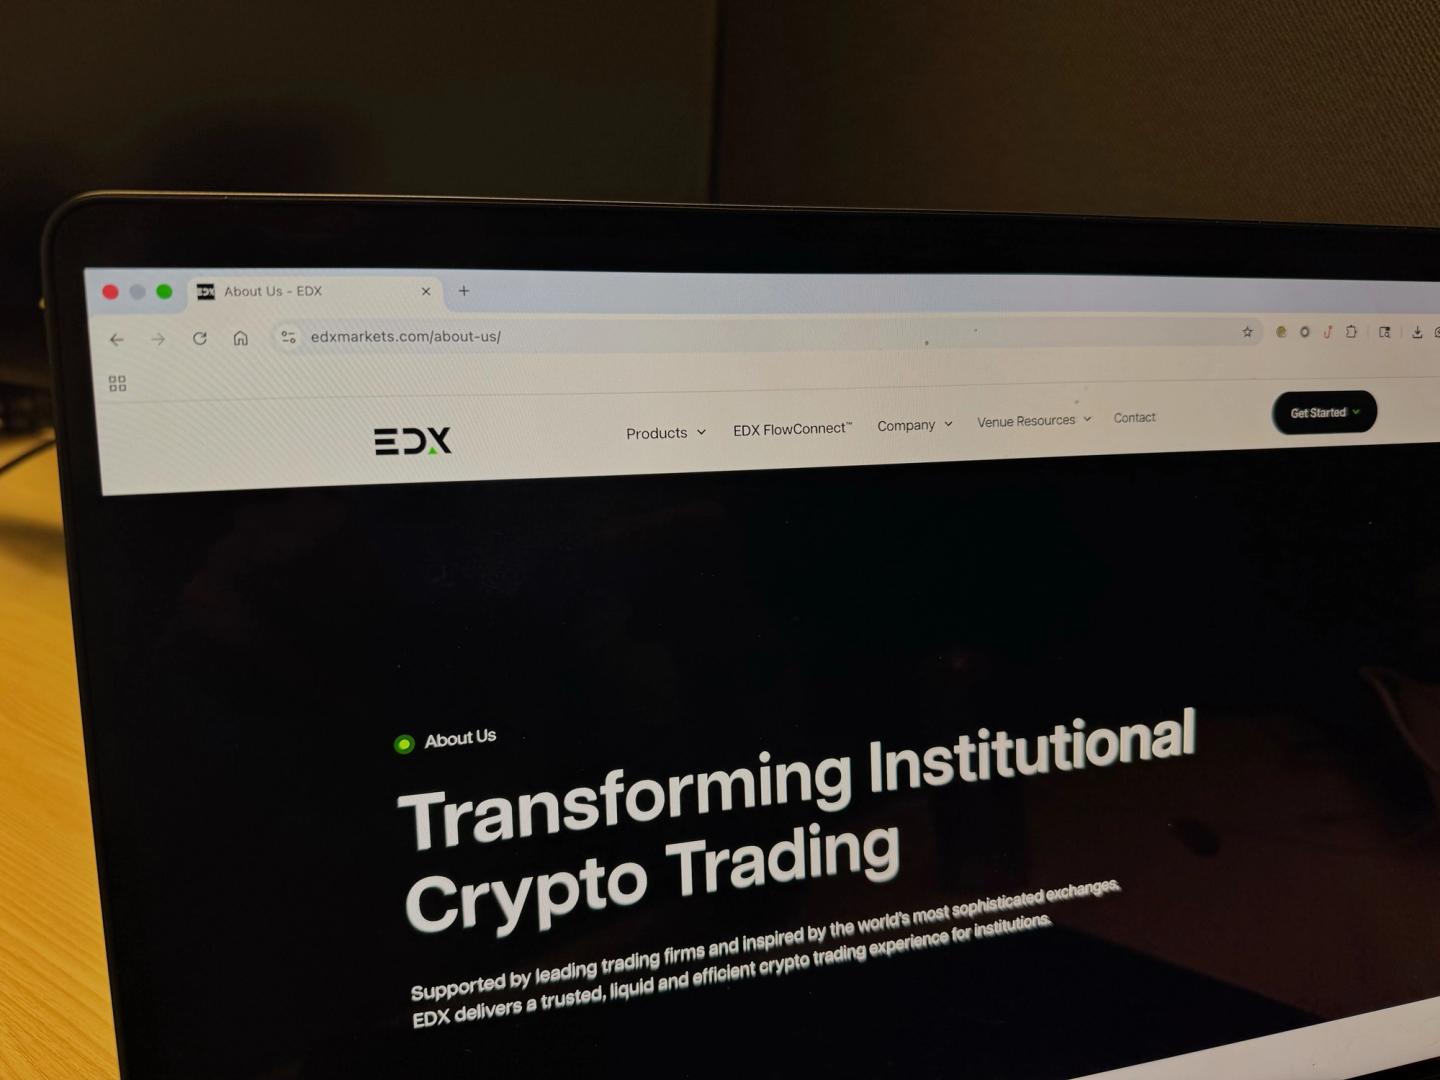

EDX Markets, the crypto exchange backed by Citadel Securities, has applied for a national trust bank charter, marking a new step in its push to serve institutional clients.
The exchange submitted its filing to the Office of the Comptroller of the Currency on Wednesday, according to documents seen by CoinDesk. The move comes about three and a half years after the firm launched.
If approved, the charter would allow EDX to offer custody, asset management and principal trading services, while continuing to run its core order-matching platform. The filing outlines a structure where custody and settlement sit within a regulated trust entity, separate from trading operations.
EDX Markets targets traditional finance firms entering digital assets. Its backers include Fidelity Digital Assets and Charles Schwab Corp, alongside Citadel Securities. The platform went live in the summer of 2023 with four cryptocurrencies: bitcoin , ether (ETH), and bitcoin cash (BHC). It has since expanded to include 17 additional tokens.
“EDX Trust is a key step in bringing traditional market structure to digital assets,” CEO Tony Acuña-Rohter told CoinDesk. “By separating custody and settlement into a regulated trust, we’re building the kind of infrastructure banks and institutional investors expect as they scale into the space.”
EDX is not alone in seeking this type of regulatory footing. Several crypto firms have applied for and received trust bank charters in recent years, using them to offer custody and other services under U.S. oversight. These approvals have become a key pathway for firms looking to attract institutional capital.
Competition for those clients has intensified. Large asset managers and trading firms want platforms that mirror the safeguards and structure of traditional markets. In practice, that can mean segregated custody, clear settlement processes and regulated entities that reduce counterparty risk. For exchanges like EDX, securing a trust charter could help bridge that gap.

Bitcoin treasury holders have faced a renewed wave of scrutiny as market stress spread through the sector. Nakamoto (NAKA), a prominent crypto treasury company, disclosed March sales that locked in losses, a signal that broader capital discipline could intensify in the coming weeks. The disclosures come on the heels of a difficult year for digital-asset treasuries, marked by a collapse in net asset value premiums and a downbeat price environment that preceded a notable market downturn in October 2025.
In its latest disclosures, Nakamoto revealed a March sale of 284 BTC for roughly $20 million, implying a sale price near $70,000 per coin. The firm also reduced its stake in Metaplanet by divesting shares at a loss. End-2025 figures show Nakamoto’s BTC treasury at 5,342 coins, with a fair value of about $467.5 million and a quarterly fair-value loss of $166.1 million, according to the company’s 10-K filing with the U.S. Securities and Exchange Commission.
The broader crypto treasury space has faced mounting headwinds. A period of deteriorating NAV premiums for digital asset treasuries persisted into the third quarter of 2025, and equity prices of related treasury vehicles declined even before the October 2025 market crash that underscored a protracted bear cycle and the ensuing downturn in crypto prices. These dynamics underscore a sector-wide struggle to manage reserves amid volatile asset prices and tightening capital conditions.
Key takeaways
- Nakamoto sold 284 BTC in March for about $20 million, a move that appears to have been executed around $70,000 per BTC and coincided with other treasury adjustments, including a loss-laden stake reduction in Metaplanet.
- The company’s year-end 2025 10-K shows 5,342 BTC valued at $467.5 million, accompanied by a $166.1 million Q4 loss on the fair value of its crypto holdings.
- The crypto treasury space experienced a notable drop in NAV premium strength during Q3 2025, a trend that predated the October market crash and helped set a challenging backdrop for treasury managers.
- MAR A, another bitcoin miner turned treasury holder, disclosed a March sale of 15,133 BTC—valued at more than $1 billion—to retire about $1 billion in convertible debt, signaling a tactical liquidity move rather than a wholesale shift away from treasury holdings.
- Industry observers warn of potential contagion risk if more treasuries respond to stress with further sales, especially amid macro pressures and regional conflicts that could weigh on BTC price action.
Nakamoto’s March dispositions and what they signify
According to Cointelegraph’s coverage of Nakamoto’s activities, the March sale of 284 BTC for roughly $20 million demonstrated a realized loss relative to prior valuation and raised questions about the persistence of losses across digital-asset treasuries. The firm also reduced its exposure to Metaplanet by offloading shares at a loss, a move that points to broader capital-allocation considerations rather than an outright pivot away from crypto reserves. The combination of these actions illustrates how treasuries are navigating a high-volatility environment where mark-to-market losses can quickly accumulate, even as some holdings remain substantially valuable on an on-paper basis.
End of year 2025 reporting reinforces the scale of Nakamoto’s holdings and the accompanying valuation pressures. The 10-K shows Nakamoto’s 5,342 BTC reserve valued at $467.5 million, with a $166.1 million loss recorded in the fourth quarter on the fair value of digital assets. That quarterly loss aligns with a period when the broader digital-asset sector faced multiple crosscurrents—ranging from wavering demand for treasuries to insurance and financing costs that increased as prices fell from their late-2025 peaks. For readers tracking treasury performance, the 10-K filing offers a concrete snapshot of how market moves translated into reported losses even when long-term holdings remained substantial.
Market context during this period was nuanced. The crypto treasury space had already seen a squeeze on premium valuations in Q3 2025, a trend that predated a broader sell-off and the October market downturn. Analysts argued that a weaker macro and continued volatility could pressure treasury portfolios further, possibly triggering more sales as treasuries attempt to rebalance risk and maintain liquidity during stressed periods. In this backdrop, Nakamoto’s March actions read as a data point in a broader recalibration across the sector rather than an isolated event.
MARA’s March BTC sale: a tactical adjustment rather than capitulation
In a parallel development, MARA—the Bitcoin mining company that also holds a substantial treasury position—disclosed a March sale of 15,133 BTC valued at more than $1 billion. The purpose was to repurchase and retire approximately $1 billion in convertible debt, a move the firm framed as a strategic, short-term liquidity measure rather than a fundamental shift in its treasury strategy. Robert Samuels, MARA’s vice president for investor relations, emphasized that the sale did not indicate a plan to liquidate the majority of its reserves and that the company may buy or sell BTC from time to time based on market conditions and capital-allocation priorities.
The March sale underscores a recurring theme among large treasury holders: the balancing act between deleveraging, maintaining liquidity, and preserving upside exposure to Bitcoin’s longer-term fundamentals. While MARA’s disclosure signals a tactical debt-management objective, it also highlights how treasury activity can be driven by corporate financing needs as much as by crypto-market cycles. For investors and watchers, such moves can be a useful barometer of corporate risk tolerances and the appetite for risk transfer during periods of volatility.
What the ongoing dynamics mean for investors and builders
From an investor perspective, the Nakamoto and MARA disclosures illustrate that even sizable treasury positions are not immune to price volatility and reallocation pressures. The March activity—especially Nakamoto’s significant BTC disposition and Metaplanet stake reduction—adds to a broader narrative about treasury strategy in a regime of rising macro and geopolitical uncertainty. The end-2025 valuations and the quarterly losses documented in the 10-K filings serve as a reminder that mark-to-market moves can erode reported profitability even when blockchain-related assets retain strategic value for the long term.
For traders and builders in the ecosystem, the implications extend beyond single-company moves. The observed NAV premium collapse in Q3 2025 suggested a broader mispricing in crypto-treasury vehicles, a dynamic that can influence funding conditions for new projects, credit lines for miners, and the willingness of traditional finance partners to engage with digital-asset treasuries. With the October 2025 price action illustrating a sharper turn in risk sentiment, observers will be watching whether the sector stabilizes or continues to reprice risk as companies navigate debt maturities, liquidity needs, and potential further sales from treasuries under strain.
In the near term, market watchers should stay alert to several indicators. First, any additional treasury actions from major holders could signal shifting risk tolerance or liquidity pressures. Second, updates to NAV premium trends and the health of associated debt instruments will help gauge the sector’s resilience. Finally, BTC price dynamics—especially around macro- and regional risks—will influence whether treasury holders can avoid a self-reinforcing cycle of losses and forced sales.
As the sector processes these developments, readers should monitor forthcoming earnings and regulatory disclosures for more clarity on how treasuries are being managed in a volatile environment. The March disclosures from Nakamoto and MARA, alongside the 10-K filings, offer concrete data points for assessing whether the current period marks a turning point or a short-lived adjustment in a longer-cycle evolution of crypto treasuries.
Readers can refer to the original reporting for deeper detail on the specific transactions: Nakamoto’s March BTC disposition and Metaplanet stake sale were covered in Cointelegraph’s coverage of the event, while the formal debt-reduction move by MARA was outlined in their SEC filings. The broader market context—DAT market pressures, NAV premium movements, and the October 2025 price shock—has been discussed across multiple industry analyses and related Cointelegraph coverage.
The story remains fluid: as treasuries recalibrate their portfolios, investors should watch how new pricing, debt-financing needs, and macro conditions shape the next round of treasury activity and potential contagion dynamics within the sector.


Paradigm is building a pro‑grade prediction market terminal, eyeing an internal MM unit and S&P‑style index product as Kalshi’s valuation jumps to $22B on surging volumes.
Summary
- Paradigm is developing a professional-grade prediction market terminal targeting institutional traders and market makers.
- The firm is also exploring an internal market-making unit and an index product bundling multiple event markets, similar to the S&P 500.
- Paradigm, already a major backer of Kalshi, led a $1 billion round valuing the platform at $11 billion.
Paradigm is building a dedicated prediction market trading terminal aimed squarely at professional traders and market makers, in one of the clearest signs yet that real‑money event markets are being treated as an emerging asset class rather than a curiosity. The project, led by Paradigm partner Arjun Balaji and initiated in late 2025, is designed to give sophisticated users Bloomberg‑style tools to trade, analyze and route liquidity across a growing ecosystem of on‑chain and regulated prediction platforms, according to a recent report in Fortune.
The San Francisco‑based crypto investment firm is simultaneously weighing the launch of an internal prediction market‑making business, while working with researchers on a “prediction market index” that would package multiple event contracts into a single, tradable structure, explicitly modeled on benchmarks such as the S&P 500. Such an index could mirror earlier experiments with volatility and DeFi indices, and follows a broader wave of venture capital interest in the sector; one recent Forbes analysis noted that prediction market startups attracted $3.7 billion in new capital and “minted young billionaires at Polymarket and Kalshi” as trading volumes exploded.
Paradigm has already begun aggregating prediction market data into a public panel, a necessary precondition for any institutional‑grade terminal product. The firm is also one of the most aggressive financiers of regulated prediction venue Kalshi: in December 2025, Kalshi announced a $1 billion Series E funding round at an $11 billion valuation, led by Paradigm and joined by Sequoia, Andreessen Horowitz, ARK Invest and others, doubling its value in under two months, as first reported by TechCrunch and corroborated by company statements.
That bet has continued to pay off. A subsequent funding round reported in March 2026 lifted Kalshi’s valuation again, to $22 billion, after a further $1 billion raise, according to coverage compiled by Yahoo Finance and The Wall Street Journal. As prediction markets move from sub‑$100 million monthly volumes in early 2024 to more than $13 billion by the end of 2025, according to research cited by Forbes, the emergence of a dedicated Paradigm‑backed terminal, internal liquidity provision and index products suggests the asset class is being refashioned into financial infrastructure, rather than treated as a sideshow to spot crypto.


Deepcoin is the first centralized exchange to integrate Polymarket event contracts, syncing quotes, liquidity and clearing so users can trade real‑world events with CEX tooling.
Summary
- Deepcoin has launched synchronized “Event Contracts” in partnership with Polymarket, becoming the first centralized exchange to plug directly into its markets.
- The integration offers real‑time quotes, shared liquidity and unified clearing, letting users trade Polymarket‑style contracts with CEX speed and tooling.
- Deepcoin says it will keep refining the product toward a more “pure and professional” event‑trading experience tied to real‑world outcomes.
Cryptocurrency exchange Deepcoin has entered a formal partnership with prediction market platform Polymarket to launch “Event Contracts,” marking the first time a centralized exchange has integrated directly with Polymarket’s real‑money event markets. Announced on April 1, the tie‑up allows Deepcoin users to access “real quotes and liquidity support synchronized with global top event markets” while trading through standard exchange accounts, according to a company statement reported by ChainCatcher.
Under the new structure, both sides have implemented “deep integration of underlying logic and clearing synchronization,” so that positions taken via Deepcoin are effectively mirrored one‑for‑one with corresponding Polymarket contracts. This design means users can “directly participate in popular contracts on Polymarket through their Deepcoin accounts, enjoying CEX trading speed” and order‑book style execution that aligns with “professional trading habits,” the exchange said.
Deepcoin framed the launch as the first step in building out a dedicated, institutional‑grade venue for real‑world event trading. The platform stated it would “continue to refine its products in the future to create a more pure and professional trading experience,” signaling plans to iterate on contract design, risk management and user analytics as volumes scale. By routing demand from a centralized venue into on‑chain prediction markets, the partnership effectively opens CEX rails into a segment historically dominated by niche DeFi interfaces and bespoke OTC flows.
The move lands just as regulated event markets and decentralized prediction protocols are drawing heightened attention from both venture capital and regulators. In March, Kalshi’s latest financing pushed its valuation to $22 billion as demand for macro and political contracts surged, according to coverage compiled by Yahoo Finance, while a recent Forbes analysis described prediction markets as “on the cusp of becoming core financial infrastructure” amid rising institutional interest. At the same time, U.S. Commodity Futures Trading Commission enforcement director David Miller has warned that insider‑trading laws apply fully to prediction markets, underscoring the compliance pressure that CEX integrations like Deepcoin’s will have to navigate.
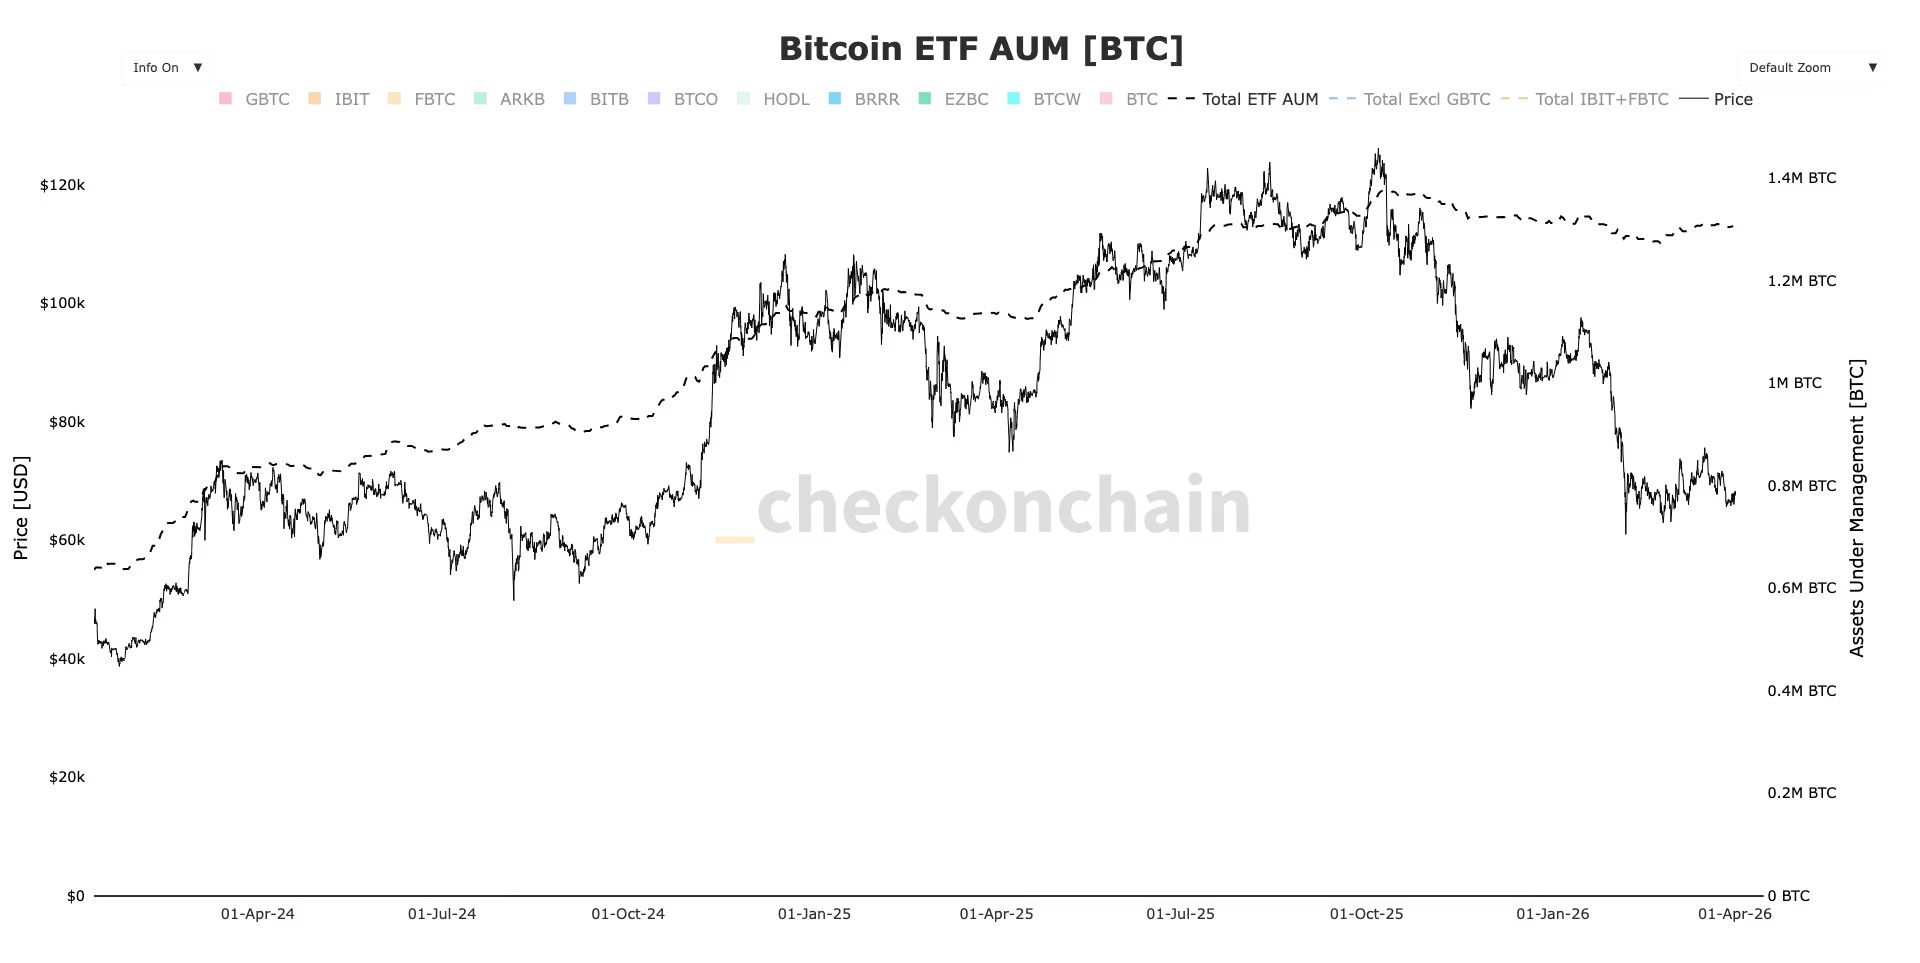
U.S.listed spot bitcoin ETFs ended March with $1.32 billion in net inflows to record their first monthly inflows since October, SoSoValue data shows.
This follows four consecutive months of net outflows, which coincided with bitcoin declining by as much as 50% from its October all time high of $126,000.
November saw $3.5 billion in outflows, followed by $1.1 billion in December, $1.6 billion in January, and $206 million in February.
March also marked bitcoin’s first positive monthly candle in six months, suggesting a potential shift in momentum.
ETF assets under management have remained relatively resilient, however. Holdings declined from 1.38 million BTC in October to a low of 1.28 million BTC, a drop of roughly 7%, and have since recovered to around 1.31 million BTC, according to CheckonChain.
ETF investors remain underwater on average, with an estimated cost basis near $84,000 compared to a current spot price of about $68,000.

Crypto World
Galaxy Digital’s (GLXY) testnet suffers hack but no client funds or information were compromised
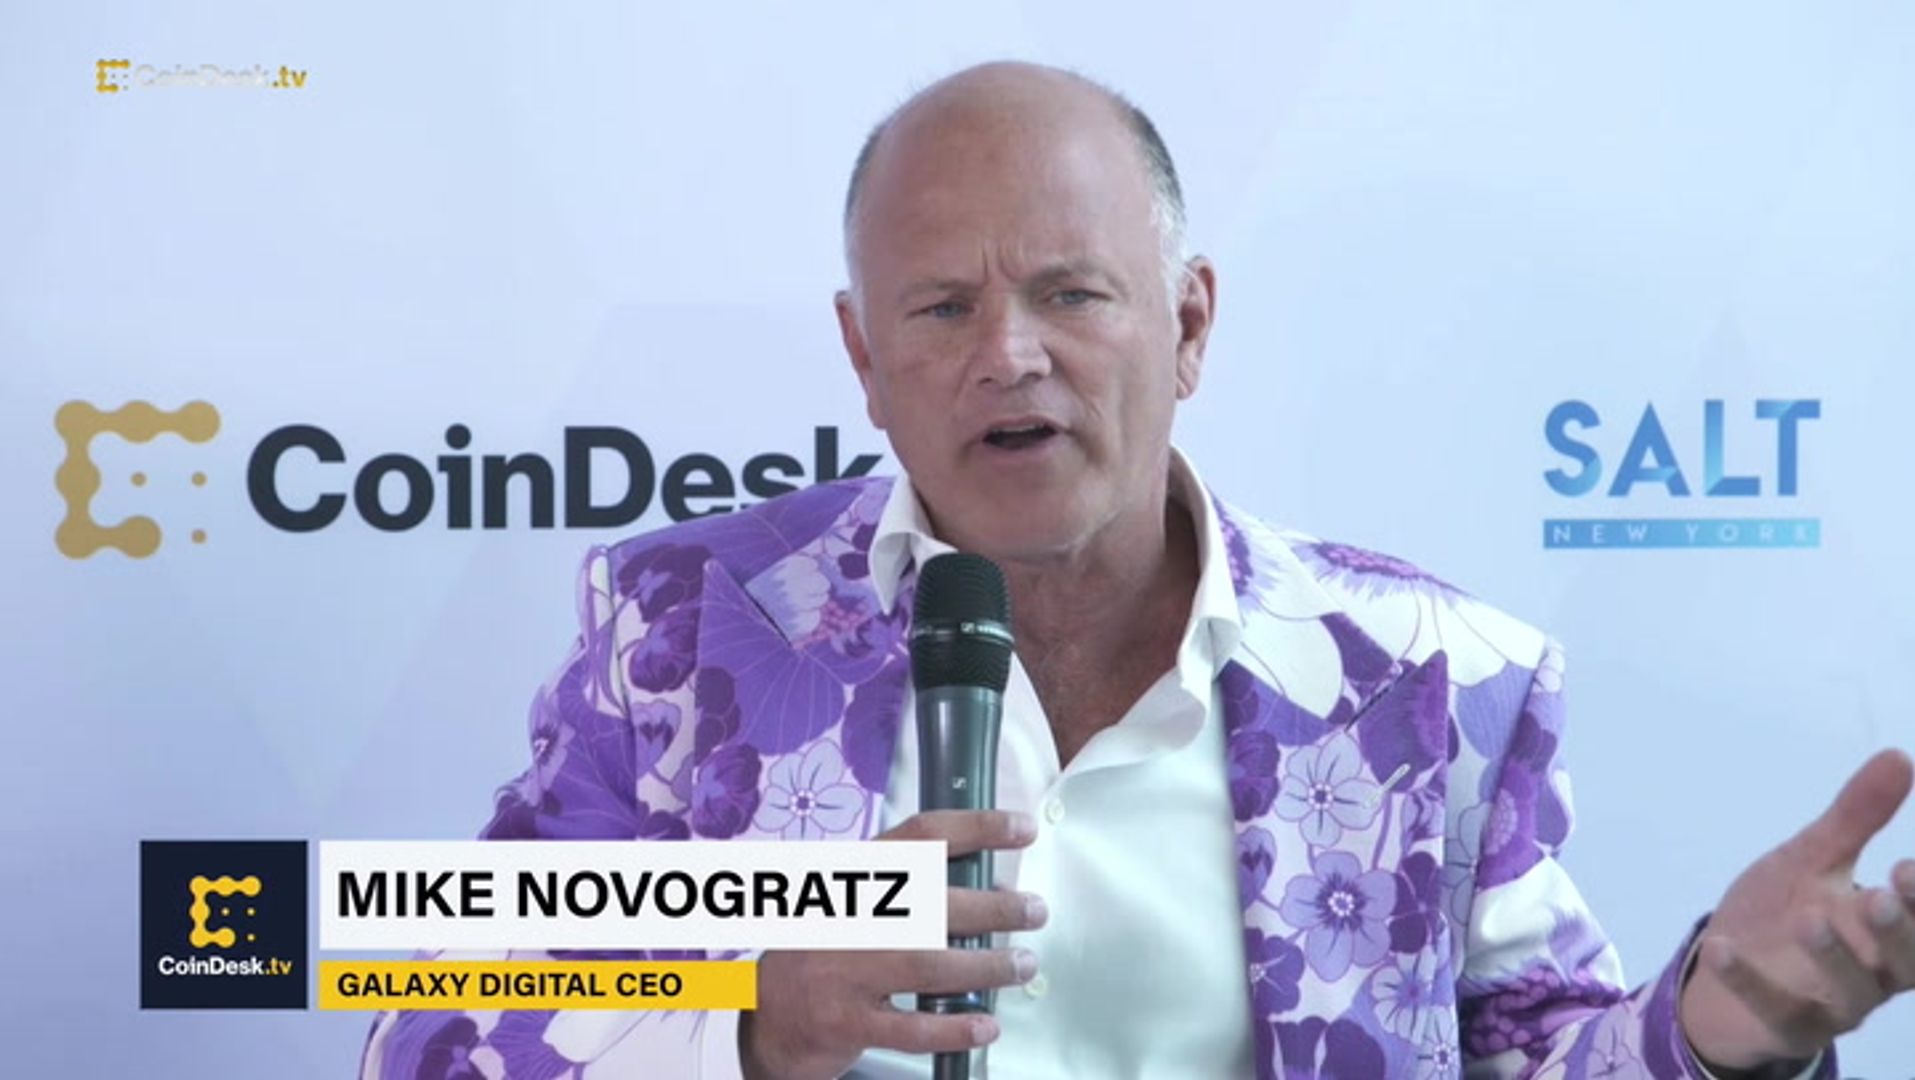

Galaxy Digital (GLXY), the digital asset financial services firm founded by Mike Novogratz, said it recently contained a cybersecurity incident involving unauthorized access to an isolated development workspace, according to a statement from a company spokesperson.
“An immaterial amount of company funds used for testing within the isolated development workspace was impacted,” the spokesperson said in emailed comments. The loss was less than $10,000, according to a person with knowledge of the matter.
The firm emphasized that the affected environment was used solely for research and development and was not connected to its core infrastructure, production systems, trading platforms or client accounts.
Galaxy said it detected the intrusion and moved quickly to contain it, secure the compromised workspace and implement additional precautionary measures across its on-chain infrastructure.
“No client funds or client account information were accessed or at risk at any point based on our review to date,” Galaxy said, adding that all platforms and services remain fully operational and secure for clients.
Hacks and exploits remain a persistent risk in the crypto industry, where the combination of open-source code, large pools of onchain liquidity and uneven security practices creates an attractive target for attackers.
Billions of dollars are lost to smart contract exploits, phishing schemes and infrastructure breaches, with industry estimates often exceeding $1–2 billion annually in recent years.
Even when incidents are contained, and client assets are not impacted, breaches can erode trust, trigger heightened regulatory scrutiny and underscore the operational risks facing firms operating in largely irreversible, always-on financial systems.
Galaxy is a diversified financial services and investment firm focused on the digital asset and blockchain sector, providing institutional clients with trading, asset management, lending, advisory and custody services.
The firm operates across several core business lines, including global markets, asset management and digital infrastructure, while also running businesses in areas like crypto mining, staking and data center operations.
Positioned as a bridge between traditional finance and crypto, Galaxy offers institutional-grade access to digital assets and related technologies, alongside investments in blockchain ventures and emerging areas such as AI-powered infrastructure.
The company said it is continuing to review the incident and will provide updates as appropriate.
Read more: Bitcoin’s quantum threat is real, but far from an existential crisis, Galaxy says
Warren Buffett, the legendary investor and chairman of Berkshire Hathaway, revealed on CNBC this week that his firm purchased approximately $17 billion in US Treasury bills at the latest auction. Is a stock market crash coming and what does it mean for Bitcoin (BTC)?
Key takeaways:
-
Berkshire held $373 billion in cash or cash equivalents as of 2025’s close, more than double the levels in 2023.
-
The firm’s rising cash reserves typically precede major stock market crashes, a bad sign for Bitcoin.
Buffett still sees better value in cash than in stocks
Buffett’s message is straightforward: Berkshire does not see the recent equity pullback as a sufficiently attractive buying opportunity.
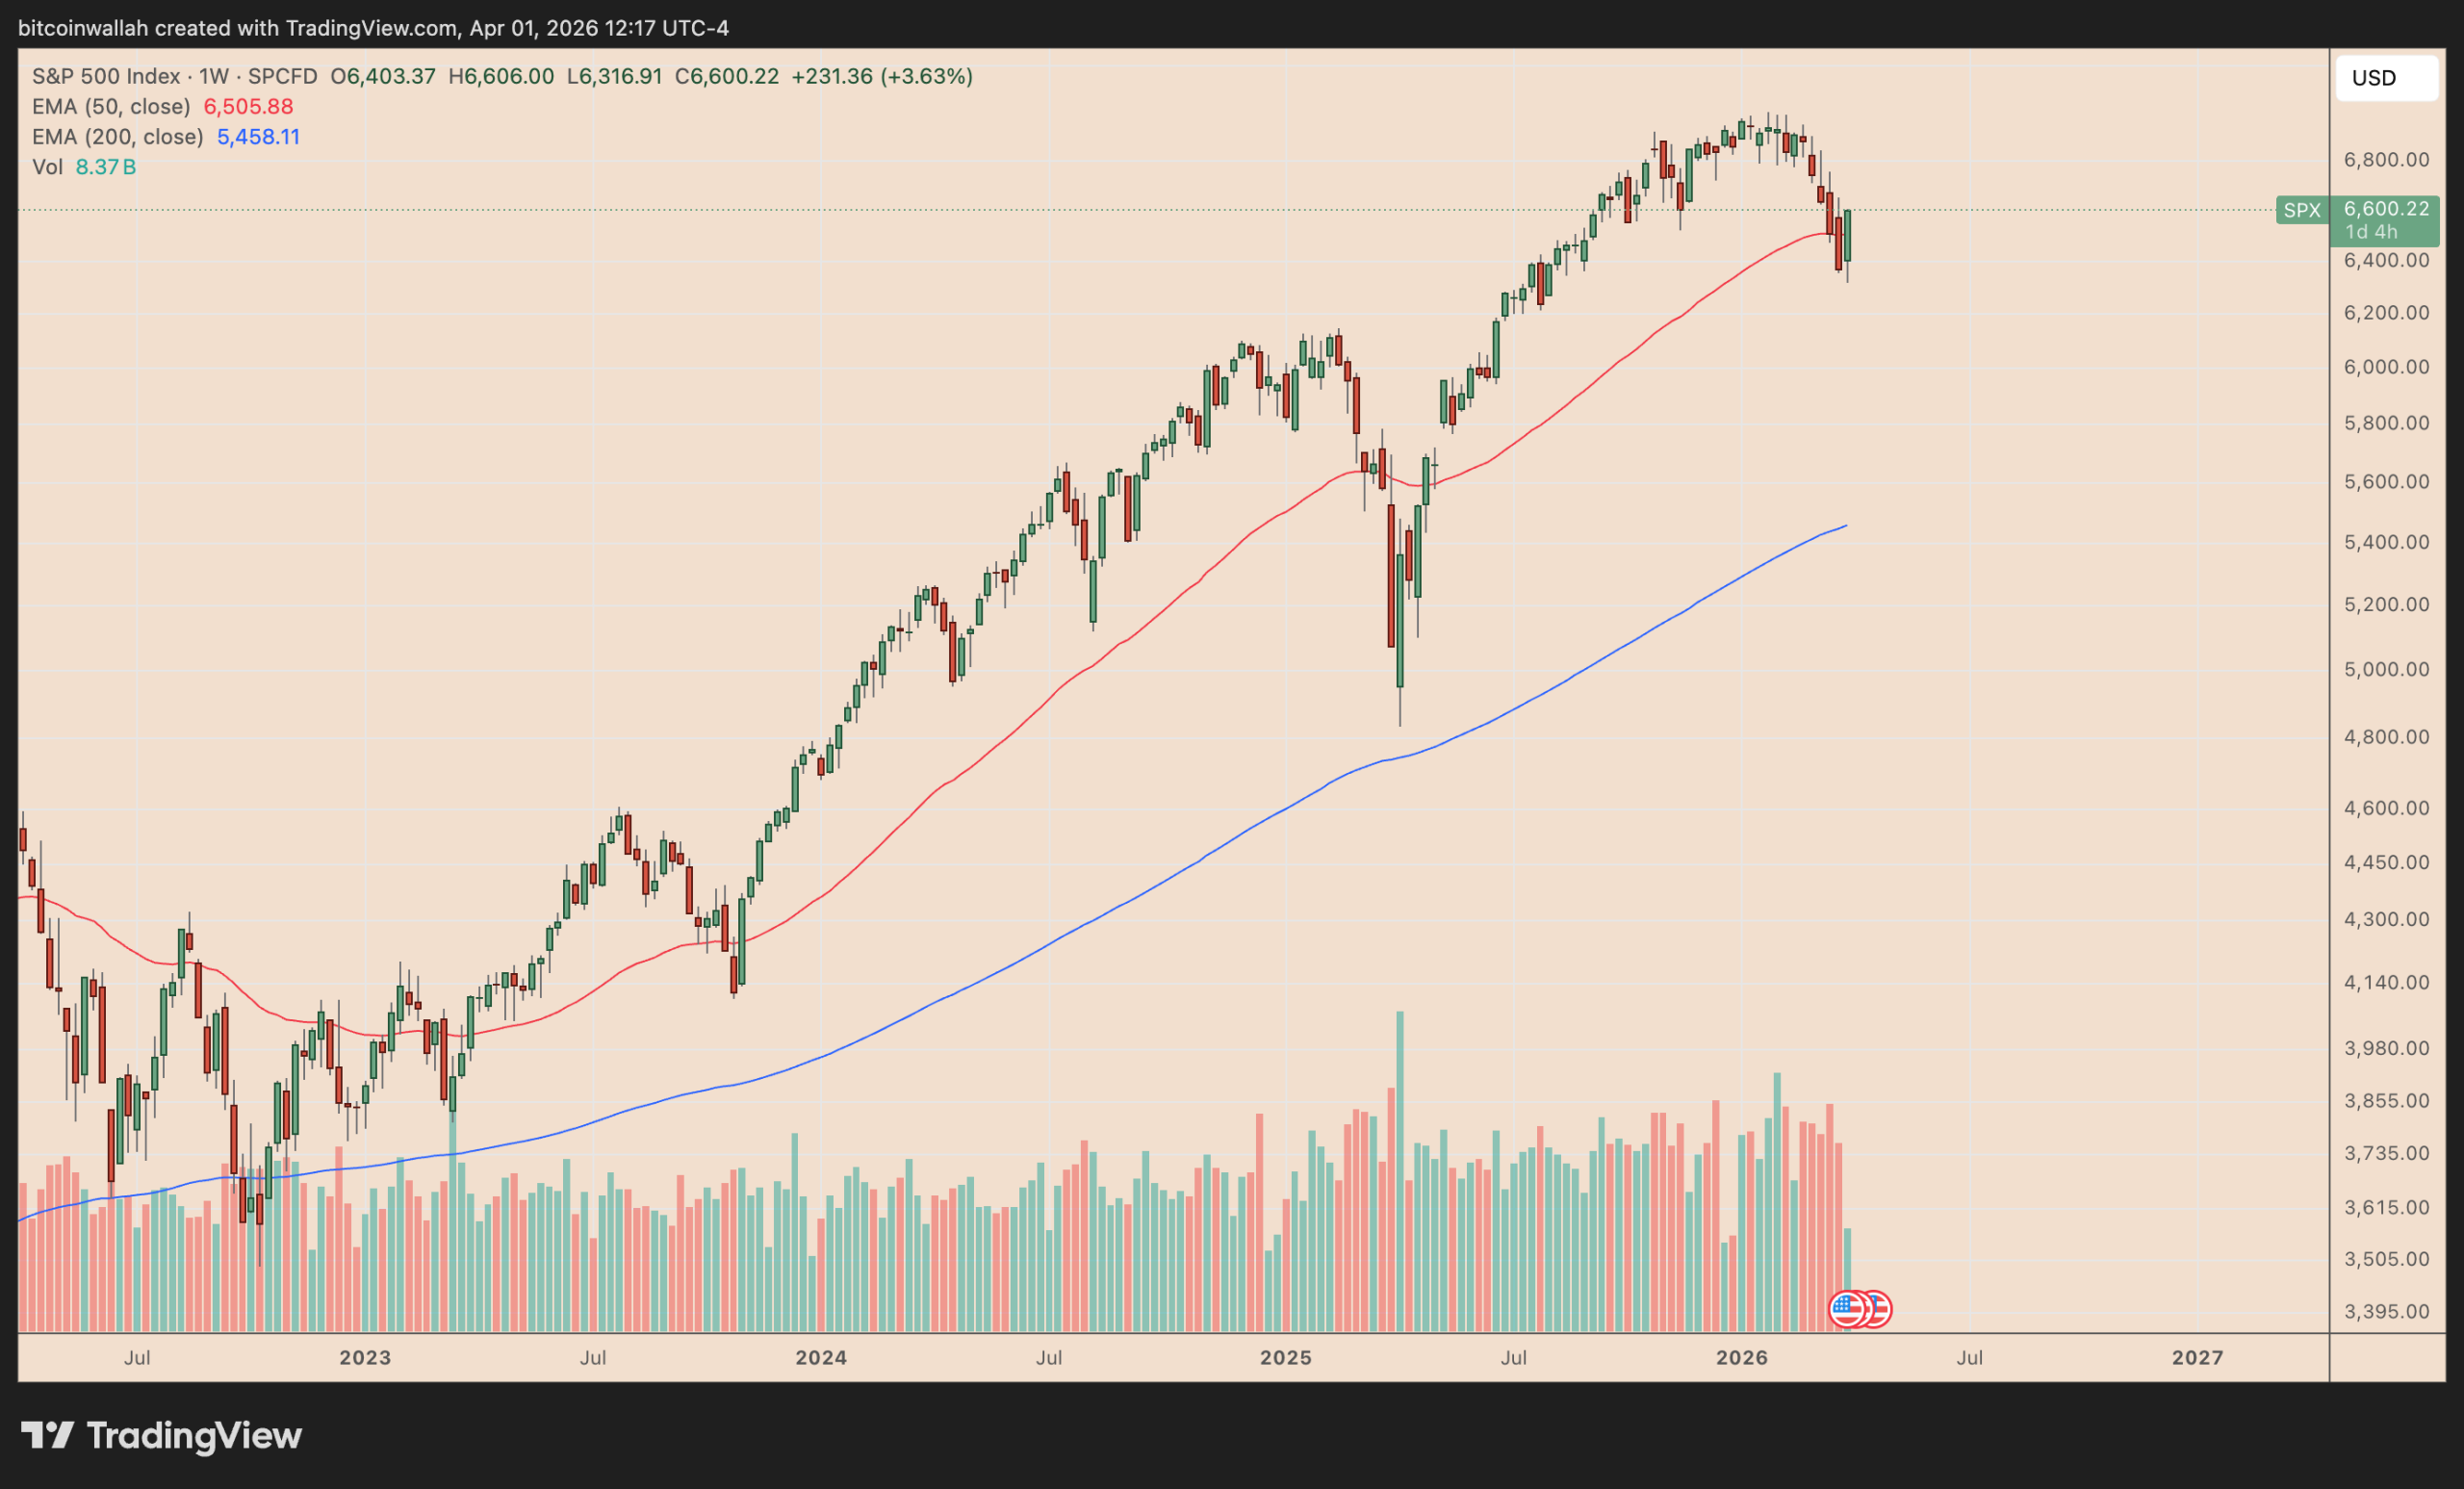
For context, the S&P 500 has fallen about 5.75% since reaching a record high in January.

Buffett said stocks are not “substantially” cheaper after the decline and described the sell-off as “nothing” compared with earlier downturns in which markets fell more than 50%.
That helps explain Berkshire’s latest Treasury-bill purchase. The company ended 2025 with about $373 billion in cash and equivalents, up from a record $334.2 billion a year earlier and more than double its level at the end of 2023.
Buffett, who famously called Bitcoin “rat poison,” typically gets into cash before major stock crashes, historical data shows.
In 1998, for instance, Buffett began trimming Berkshire’s stock exposure and raising cash, pushing the company’s cash and cash-equivalents holdings to $13.1 billion, or about 23% of total assets.

By mid-2000, that figure had climbed to nearly $15 billion, or roughly 25% of assets, before Berkshire started deploying capital into bargains as the Dot-com bubble burst.
Bitcoin’s positive correlation with stocks may hurt prices
Bitcoin has traded more like a stock than a traditional safe haven for much of the post-2020 period, often moving in the same direction as US equities, especially the tech-heavy Nasdaq.
As of Wednesday, the 20-week rolling correlation coefficient between the two markets was positive at 0.47.

If Buffett’s risk-off strategy is correct, then Bitcoin should see another crash alongside stocks. Fresh quantum-security concerns, war-driven inflation risks, and nearly 50% US recession odds are putting pressure on the BTC price.
Berkshire’s portfolio decisions have also leaned away from crypto-adjacent finance.
In the first quarter of 2025, the firm fully exited Nu Holdings, a crypto-friendly fintech company, after building its position in 2021 and 2022. It secured about $250 million in profits from these investments.
Multiple analysts predict BTC’s price to drop to as low as $30,000 in 2026.
This article is produced in accordance with Cointelegraph’s Editorial Policy and is intended for informational purposes only. It does not constitute investment advice or recommendations. All investments and trades carry risk; readers are encouraged to conduct independent research before making any decisions. Cointelegraph makes no guarantees regarding the accuracy or completeness of the information presented, including forward-looking statements, and will not be liable for any loss or damage arising from reliance on this content.

BBC Apologises For Response To Scott Mills Allegation Raised In 2025
One person airlifted to hospital as 100 firefighters attend ‘dust explosion’ fire in Omagh

Estate agents accuse Rightmove of charging excessive fees


-

 News Videos7 days ago
Parliament publishes latest register of MPs’ financial interests
-

 Business6 days ago
Instagram, YouTube Found Responsible for Teen’s Mental Health Struggle in Historic Ruling
-
 Tech6 days ago
Intercom’s new post-trained Fin Apex 1.0 beats GPT-5.4 and Claude Sonnet 4.6 at customer service resolutions
-

 NewsBeat5 days ago
The Story hosts event on Durham’s historic registers
-

 Sports5 days ago
Sweet Sixteen Game Thread: Tide vs Michigan
-
Entertainment2 days ago
Fans slam 'heartbreaking' Barbie Dream Fest convention debacle with 'cardboard cutout' experience
-
 Entertainment4 days ago
Lana Del Rey Celebrates Her Husband’s 51st Birthday In New Post
-
Crypto World1 day ago
Dems press CFTC, ethics board on prediction-market insider trades
-

 Sports1 day ago
Tallest college basketball player ever, standing at 7-foot-9, entering transfer portal
-

 Tech3 days ago
The Pixel 10a doesn’t have a camera bump, and it’s great
-

 Entertainment7 days ago
HBO’s Harry Potter Series Will Definitely Fail For One Big Reason, And It’s Not J.K. Rowling Or Snape
-

 Tech1 day ago
EE TV is using AI to help you find something to watch
-

 Crypto World2 days ago
U.S. rule change may open trillions in 401(k) funds to crypto
-

 Tech1 day ago
How to back up your iPhone & iPad to your Mac before something goes wrong
-

 Fashion6 days ago
En Vogue in Brown Leather and Tailored Neutrals by Atelier Savoir, Styled by J Bolin
-

 Politics2 days ago
Should Trump Be Scared Strait?
-

 Tech2 days ago
Flipsnack and the shift toward motion-first business content with living visuals
-

 Fashion6 days ago
What Are Your Favorite T-Shirts for the Weekend?
-

 Fashion5 days ago
Weekly News Update, 3.27.26 – Corporette.com
-

 Tech2 days ago
Apple will hide your email address from apps and websites, but not cops
You must be logged in to post a comment Login